Article

Molybdenum-Induced Effects on Nitrogen Metabolism Enzymes and Elemental Profile of Winter Wheat (Triticum aestivum L.) Under Different Nitrogen Sources

1
Key Laboratory of Arable Land Conservation (Middle and Lower Reaches of Yangtze River), Ministry of Agriculture and Rural Affairs, Huazhong Agricultural University, Wuhan 430070, China
2
Microelement Research Center, Huazhong Agricultural University, Wuhan 430070, China
3
Department of Agronomy, University of Agriculture Faisalabad, 38040 Punjab, Pakistan
4
College of Plant Science and Technology, Huazhong Agricultural University, Wuhan 430070, China
5
Soil and Water Research Department, Nuclear Research Center, Egyptian Atomic Energy Authority, Abou Zaabl 13759, Egypt
6
Faculty of Science and Technology, Department of Life Science, University of Comoros, Moroni 269, Comoros
*
Author to whom correspondence should be addressed.
Int. J. Mol. Sci. 2019, 20(12), 3009; https://doi.org/10.3390/ijms20123009
Submission received: 9 May 2019 / Revised: 30 May 2019 / Accepted: 1 June 2019 / Published: 20 June 2019

Abstract

:
Different nitrogen (N) sources have been reported to significantly affect the activities and expressions of N metabolism enzymes and mineral elements concentrations in crop plants. However, molybdenum-induced effects in winter wheat cultivars have still not been investigated under different N sources. Here, a hydroponic study was carried out to investigate these effects on two winter wheat cultivars (‘97003’ and ‘97014’) as Mo-efficient and Mo-inefficient, respectively, under different N sources (NO3, NH4NO3, and NH4+). The results revealed that the activities of nitrate reductase (NR) and nitrite reductase (NiR) followed the order of NH4NO3 > NO3 > NH4+ sources, while glutamine synthetase (GS) and glutamate synthase (GOGAT) followed the order of NH4+ > NH4NO3 > NO3 in both the wheat cultivars. However, Mo-induced effects in the activities and expressions of N metabolism enzymes under different N sources followed the order of NH4NO3 > NO3 > NH4+ sources, indicating that Mo has more complementary effects towards nitrate nutrition than the sole ammonium source in winter wheat. Interestingly, under −Mo-deprived conditions, cultivar ‘97003’ recorded more pronounced alterations in Mo-dependent parameters than ‘97014’ cultivar. Moreover, Mo application increased the proteins, amino acids, ammonium, and nitrite contents while concomitantly decreasing the nitrate contents in the same order of NH4NO3 > NO3 > NH4+ sources that coincides with the Mo-induced N enzymes activities and expressions. The findings of the present study indicated that Mo plays a key role in regulating the N metabolism enzymes and assimilatory products under all the three N sources; however, the extent of complementation exists in the order of NH4NO3 > NO3 > NH4+ sources in winter wheat. In addition, it was revealed that mineral elements profiles were mainly affected by different N sources, while Mo application generally had no significant effects on the mineral elements contents in the winter wheat leaves under different N sources.

1. Introduction

Plants take nitrogen (N) either as nitrate (NO3) or ammonium (NH4+) form for various growth and developmental processes; however, NO3 is more important for such processes. For most of the crop plants, the NO3 form is mobile, less toxic, and can be stored in vacuoles. However, NO3 must be reduced to NH4+ before it can be utilized for the synthesis of amino acids, proteins, and other nitrogenous compounds in plant cells. Nitrate reductase (NR) and nitrite reductase (NiR), the key nitrate assimilatory enzymes, are located in cytosol and chloroplasts and catalyze NO3 reduction to NO2 followed by NO2 to NH4+, respectively, in the leaf tissues [1]. However, NH4+ is directly assimilated to produce different amino acids by the mutual actions of glutamine synthetase (GS) and glutamate synthase (GOGAT) enzymes in a cyclic manner within the plant cells [2].
In plants, NO3 is reduced to NO2 by the activities of the NR enzyme present in the cytosols of cells. However, NR activities are largely dependent on the molybdenum cofactor (Moco), nitrate ions, hormones, growth conditions, reduced N metabolites, and phosphorylation [3,4,5]. Plant cells can store NO3 without toxic effects, but on the contrary, NO2 is highly toxic and needs immediate metabolization. NiR is responsible for catalyzing the six-electron reduction of NO2 to NH4+. However, the conversion rate of NO2 to NH4+ and NiR activity depend upon the repressive effects of reduced N metabolites such as NH4+ and amino acids contents [6].
Relative to the NO3 form of N, NH4+ is highly toxic and needs instant detoxification to various organic nitrogenous compounds. The main mechanism of NH4+ detoxification in higher plants is the assimilation of NH4+ to different amino acids and amides through the combined activities of GS and GOGAT enzymes [7]. The GS has greater affinity towards NH4+ and therefore, even at lower concentrations, can assimilate NH4+ to avoid its buildup to phytotoxic levels. In the NH4+ assimilating process, GS plays a key role in catalyzing the glutamate γ-carboxyl group fixation to glutamine [8,9,10]. GOGAT is also involved in the NH4+ assimilation [11,12] and catalyzes the process of glutamic acid formation in which NH4+ ions enter into the nitrogenous compounds. Accordingly, these aminotransferases transfer the NH4+ assimilated glutamates to suitable α-ketoacids to form α-amino acids. These amino acids are then further assimilated to different nitrogenous compounds such as nucleic acids and proteins [13,14].
Molybdenum (Mo) is an essential microelement for higher plants and also a metal component of the Mo-cofactor, (Moco) biosynthesis. Moco binds to Mo-requiring enzymes and optimizes their activities for normal functioning of plant growth and developmental processes. Mo plays a significant role in N metabolism, which includes nitrate reduction, assimilation, and fixation, by regulating the NR and GS enzymes activities and expressions [15,16,17]. Moreover, previous studies have reported that Mo-deficiencies are predominantly associated with poor N health and the plants show symptoms similar to N deficiencies [18], indicating that Mo has a key role in the N metabolism.
The proper functioning of every living cell is only possible through the availability of essential macro- and micro-elements. A critical network of gene products controls complex processes for the uptake, binding, transportation, and repossession of a given element in the plant cells [19]. Ionomics revealed that changes in the macro- or micro-element nutritional status of plants are associated with changes in a given subset of elements [20,21]. Different N sources available in the rhizosphere considerably affected the mineral element profiles of both macro and micro-elements in leaves and consequently affected the N metabolism, photosynthetic rate, growth, and yields in Citrus sinensis [22], cucumber [23], and watermelon [24].
Wheat (Triticum aestivum L.), the second most widely grown crop over the world, has a specific preference for NO3 source and shows toxicity symptoms under NH4+ source. However, nitrate buildups in wheat grains have serious consequences for human health because excess NO3 consumption can increase the risk of cancer in adults, and serious health damage, especially in children. It can cause methaemoglobinaemia, a type of rare but potentially fatal haemoglobinopath [25]. In nitrate-induced methaemoglobinaemia, dietary nitrate is reduced to nitrite in the stomach, and the absorbed nitrite then converts hemoglobin to methemoglobin in red blood cells by oxidizing the heme Fe2+ ion to Fe3+ [26]. This oxidation prevents methemoglobin from binding oxygen and compromises oxygen delivery to peripheral tissues. So, methaemoglobinaemia underlines the importance of optimal N metabolism in leaf tissues, which are actually the grain formation sources in crop plants, especially in wheat, which is the staple food in most countries, and whose optimal N metabolism could be achieved by regulating N metabolism enzymes activities and expressions.
Most of the previous and recent studies have repeatedly focused and reported the Mo and NO3 interactions in different crop plants [16,27,28,29,30,31]; however, the effects of Mo application on the N metabolism of winter wheat leaves have still not been reported under different N sources. Therefore, in the current study we investigated Mo-induced effects on N metabolism enzymes activities, gene expression patterns, N assimilatory products, and macro- and micro-elements contents in winter wheat leaves under different N sources and also highlighted the extent of complementation between these fertilizers.

2. Results

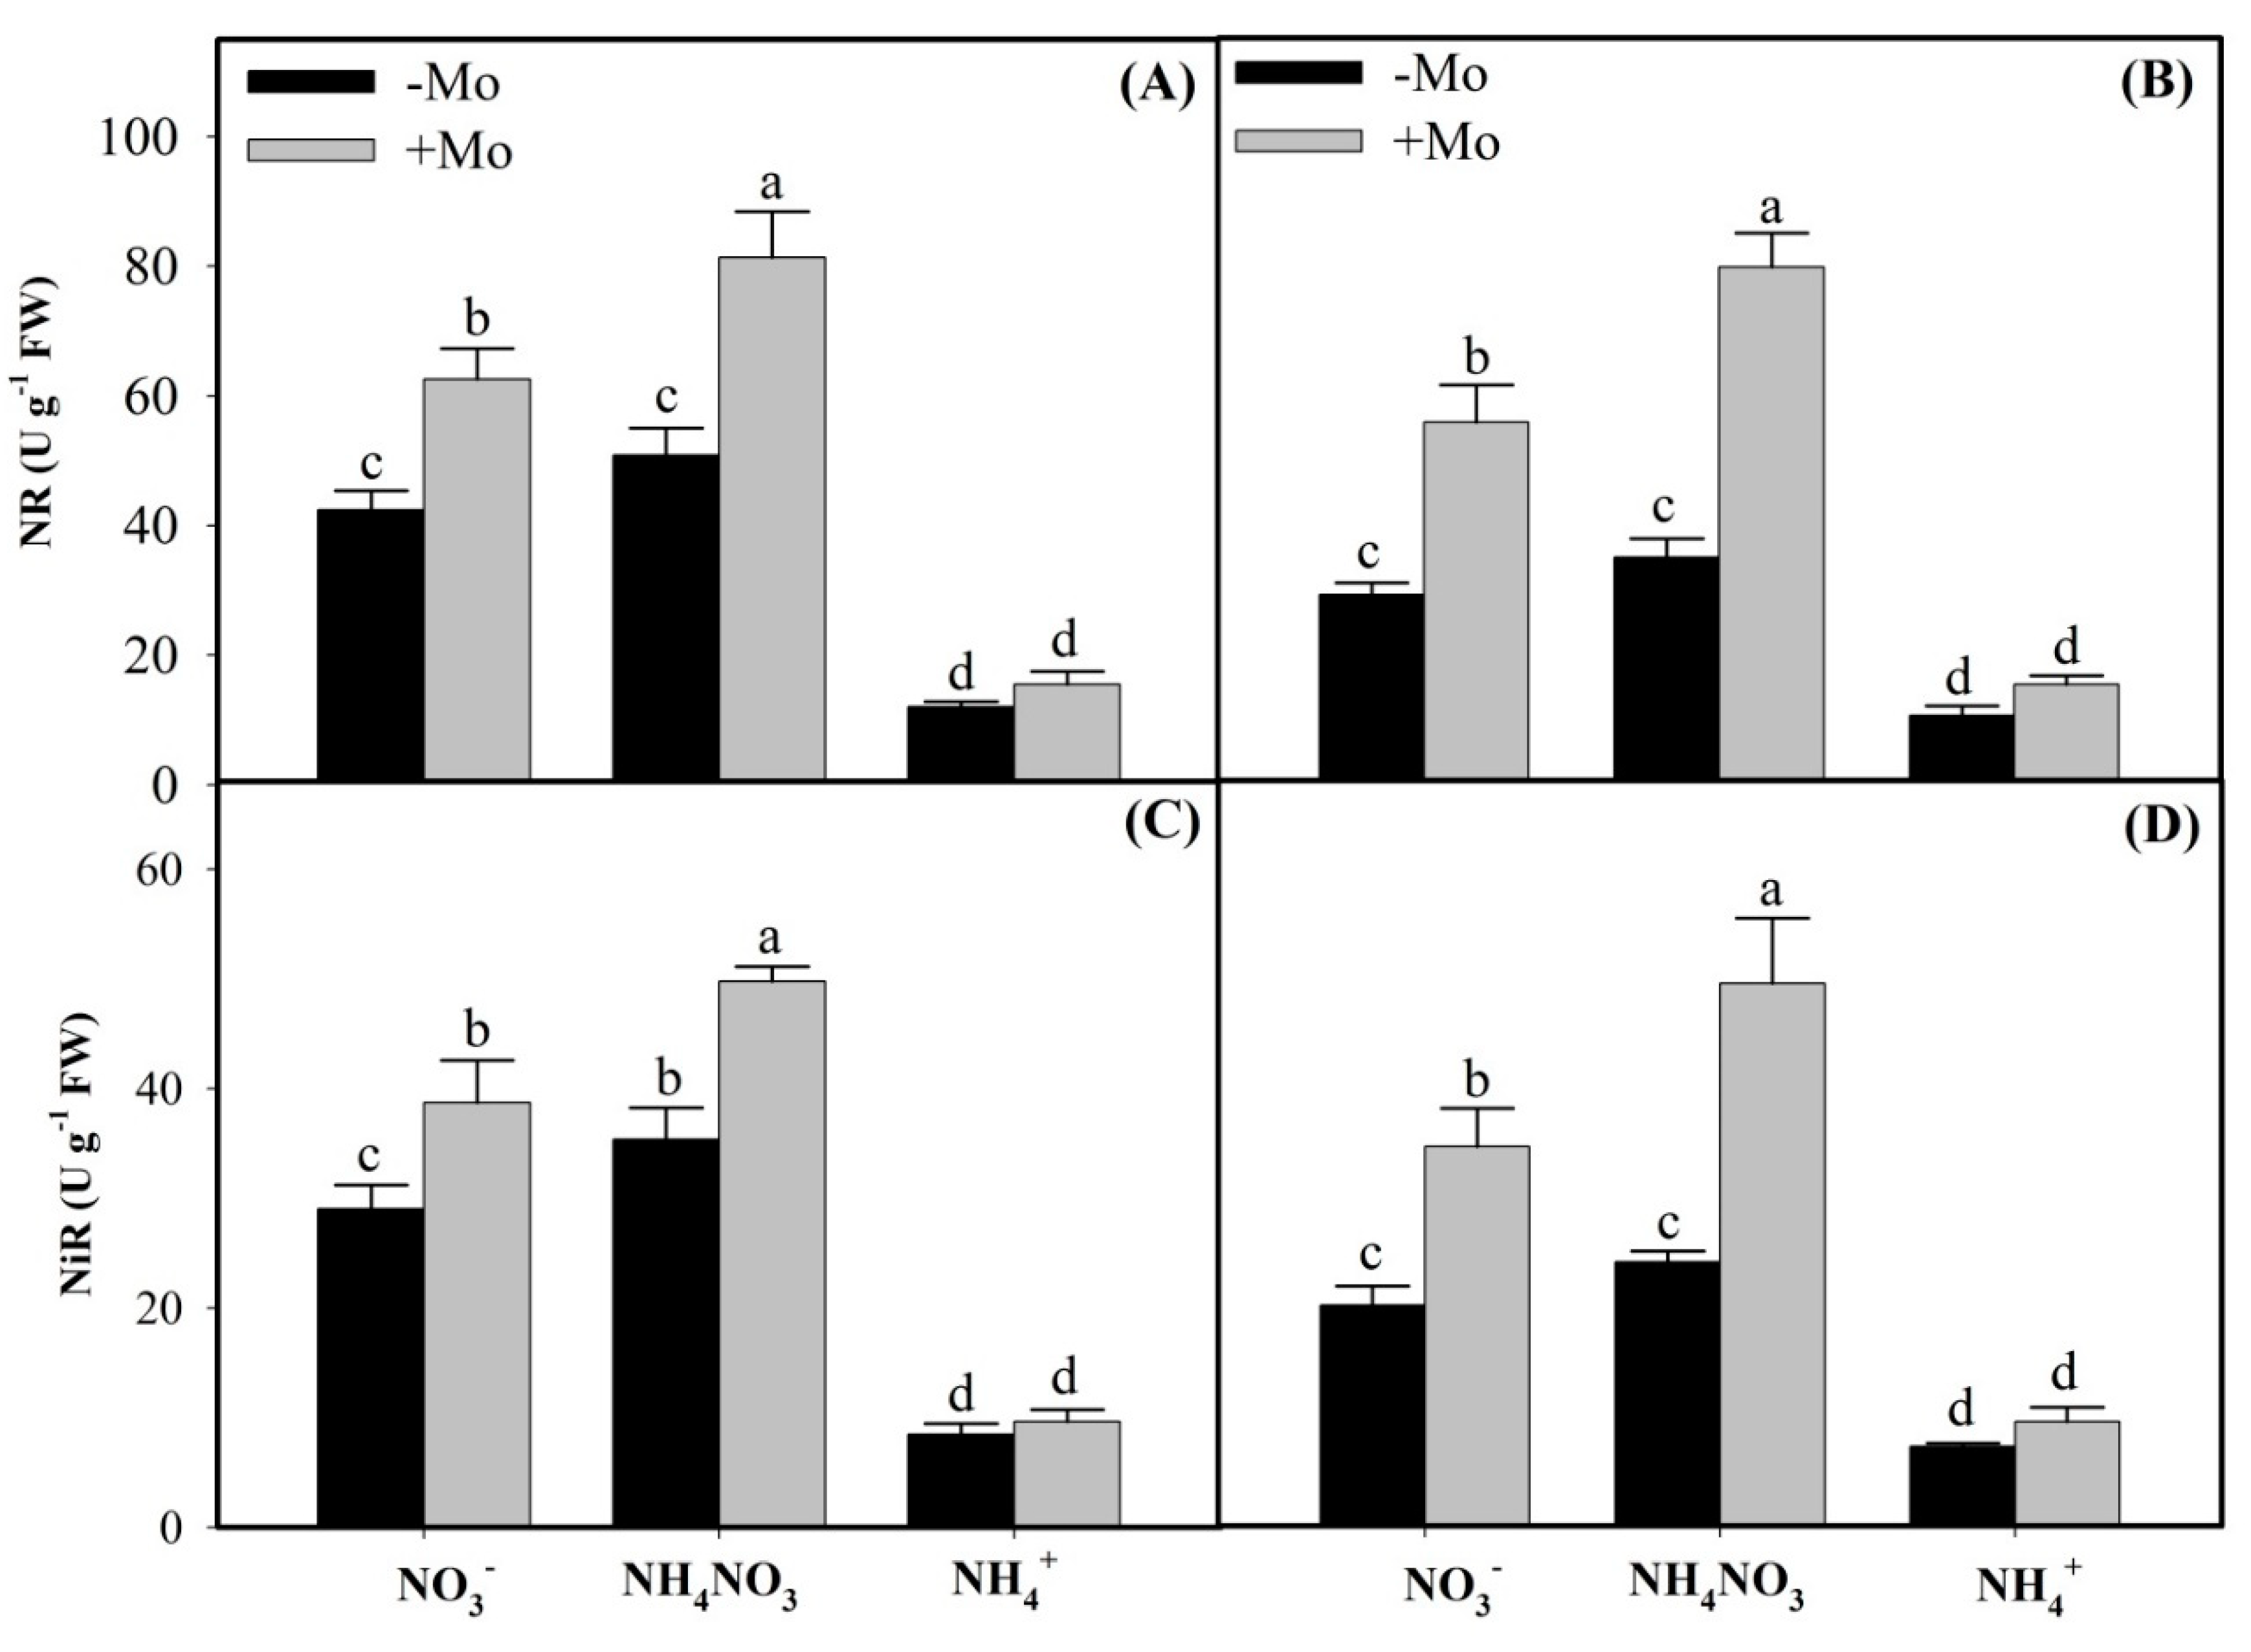
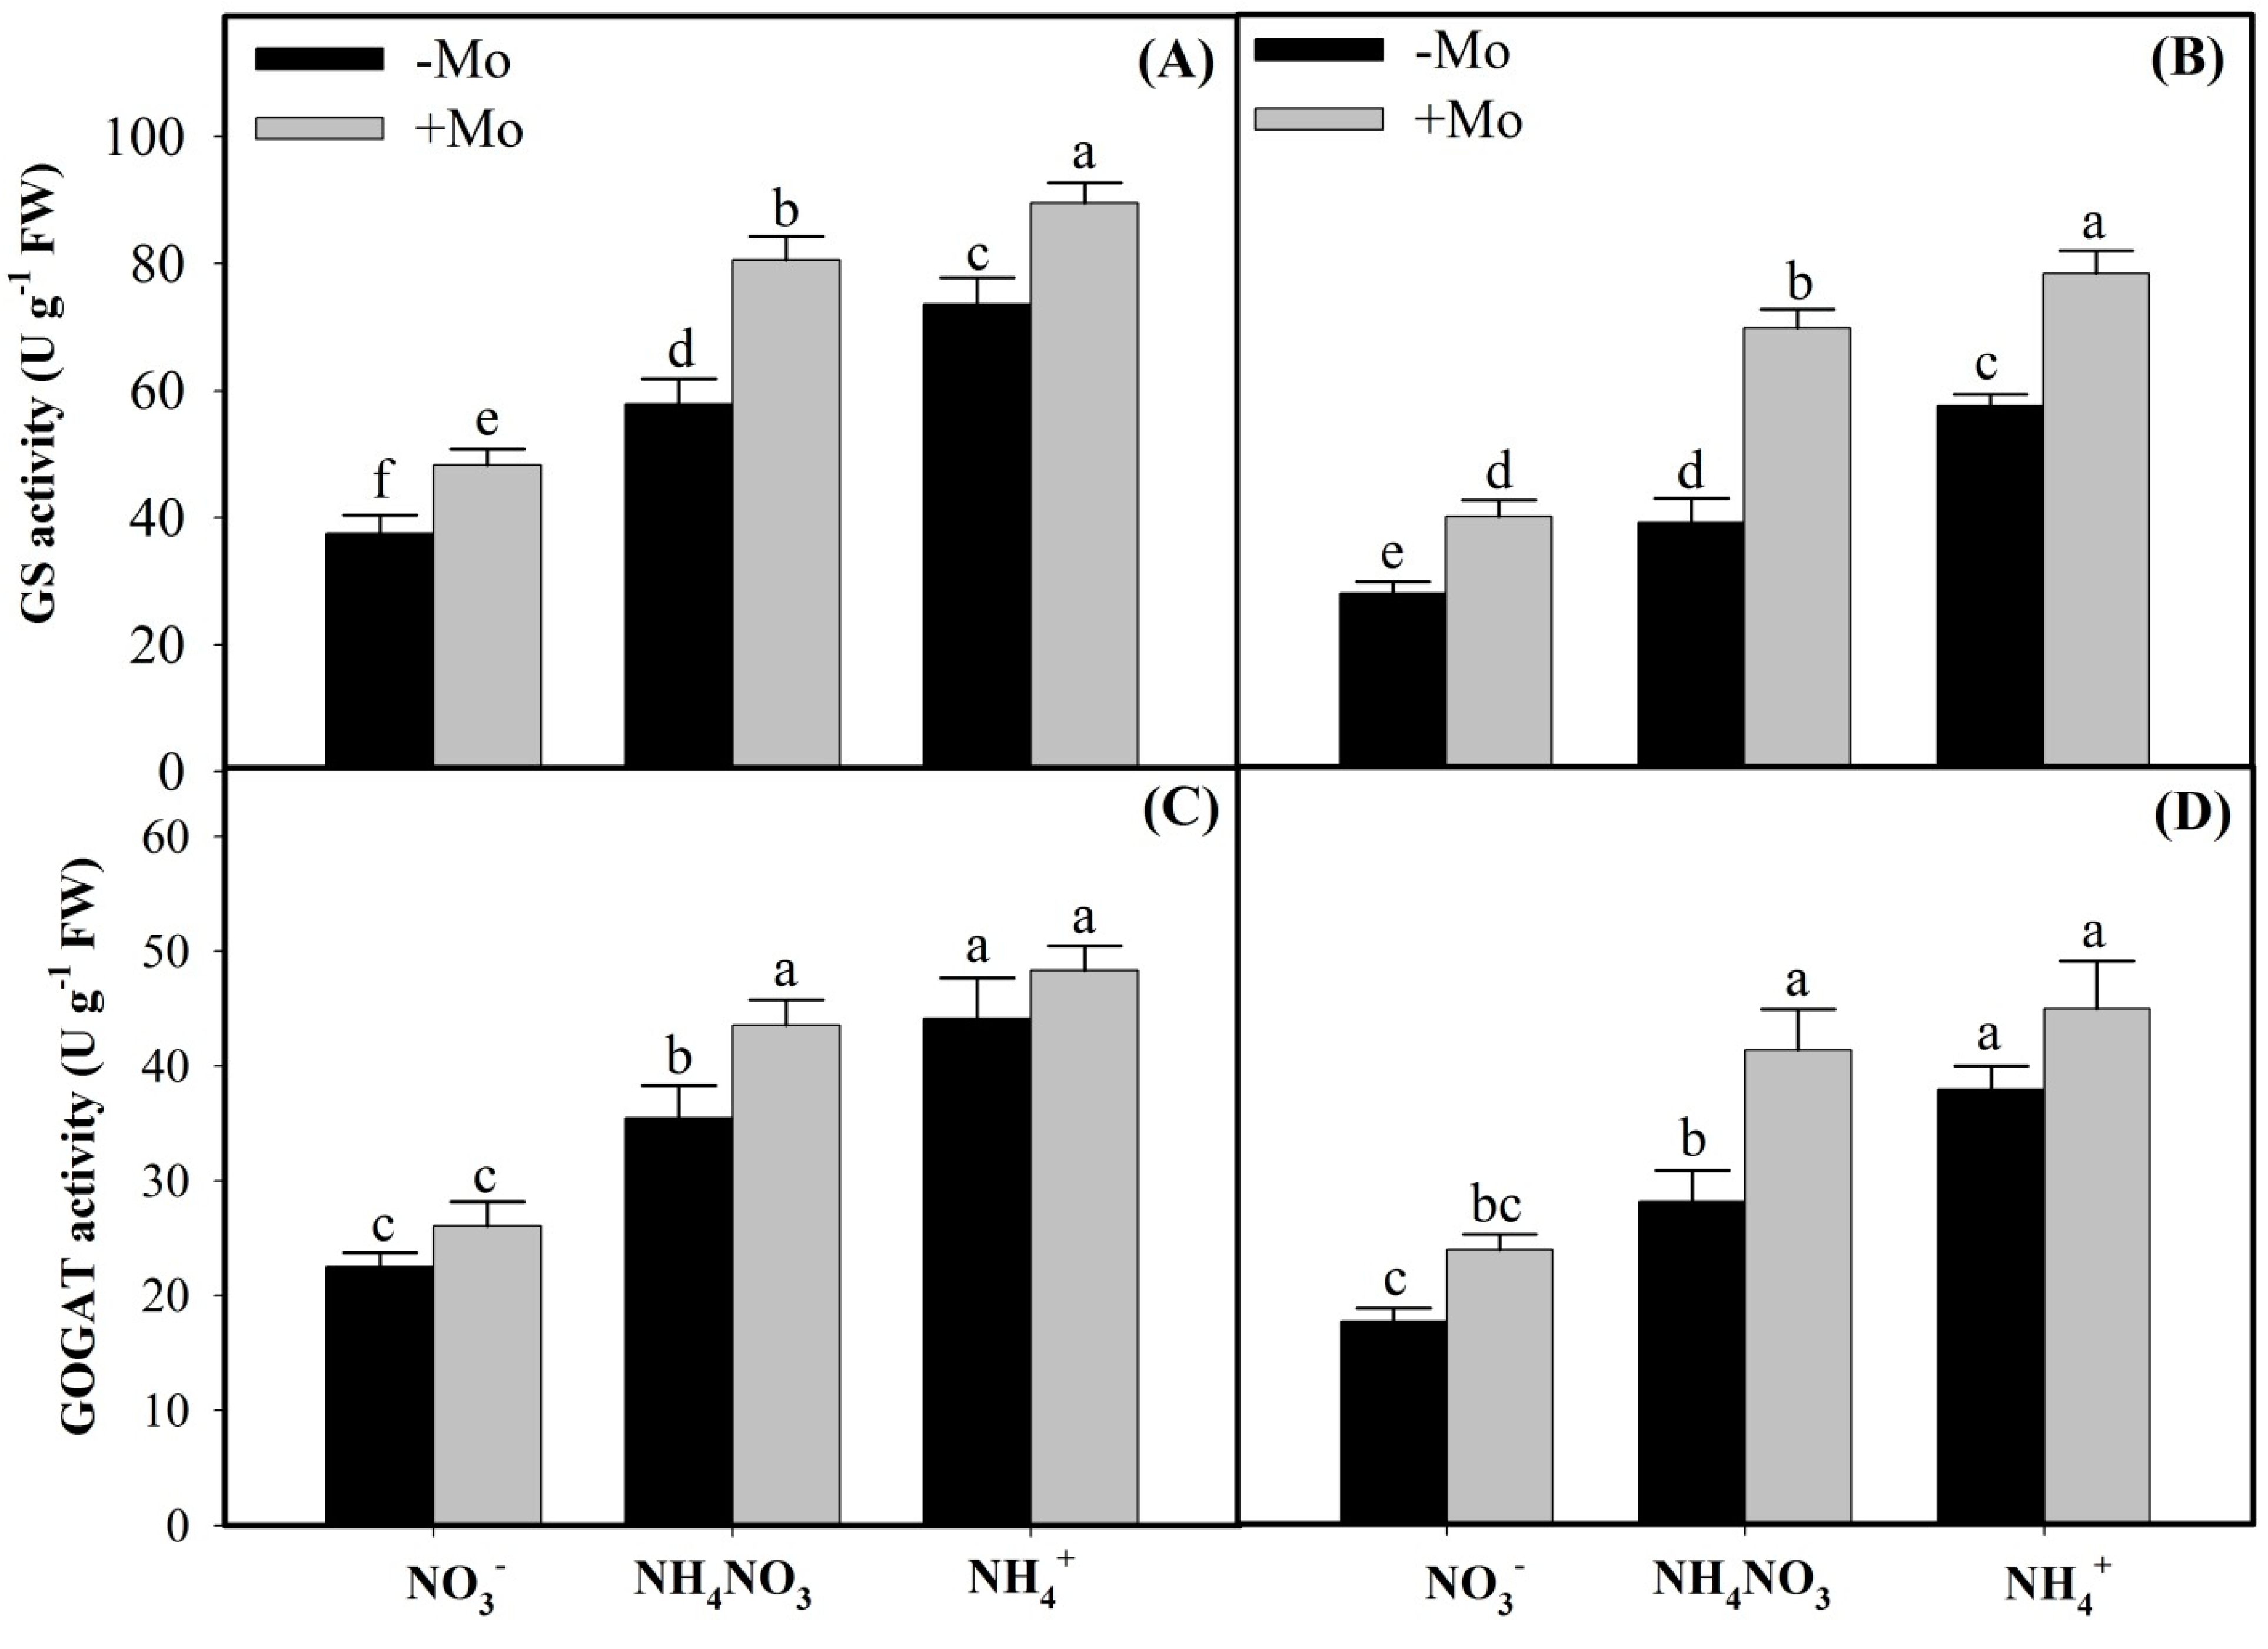
2.1. Effects of Mo Application on N Metabolism Enzymes Activities Under Different N Sources

In the present study, under different N sources, NR and NiR enzymes activities followed the order of NH4NO3 > NO3 > NH4+ sources, whereas GS and GOGAT enzymes activities followed the order of NH4+ > NH4NO3 > NO3 in both the winter wheat cultivars (Figure 1 and Figure 2). However, Mo application resulted in considerable increases of NR and NiR activities in NO3and NH4NO3 sources, except that non-significant effects were observed under sole NH4+ environment in both the winter wheat cultivars (Figure 1). Interestingly, compared with −Mo plants, Mo application significantly enhanced the GS activities under all N sources in both the wheat cultivars, with Mo-inefficient ‘97014’ cultivar showing more pronounced increases than the Mo-efficient ‘97003’ cultivar (Figure 2A,B), suggesting that Mo-inefficient ‘97014’ cultivar is comparatively more dependent on the external Mo supply than the Mo-efficient ‘97003’ cultivar when regulating the N metabolism enzymes. However, Mo supply did not significantly increase the GOGAT activities under sole either NO3-N or NH4+-N sources, except for the NH4NO3 source in both the wheat cultivars (Figure 2C,D), suggesting that Mo-induced effects in regulating the N metabolism of winter wheat plants under different N sources are more harmonious when available in mixture supply as NH4NO3 than as sole applications of either N source in wheat plants.

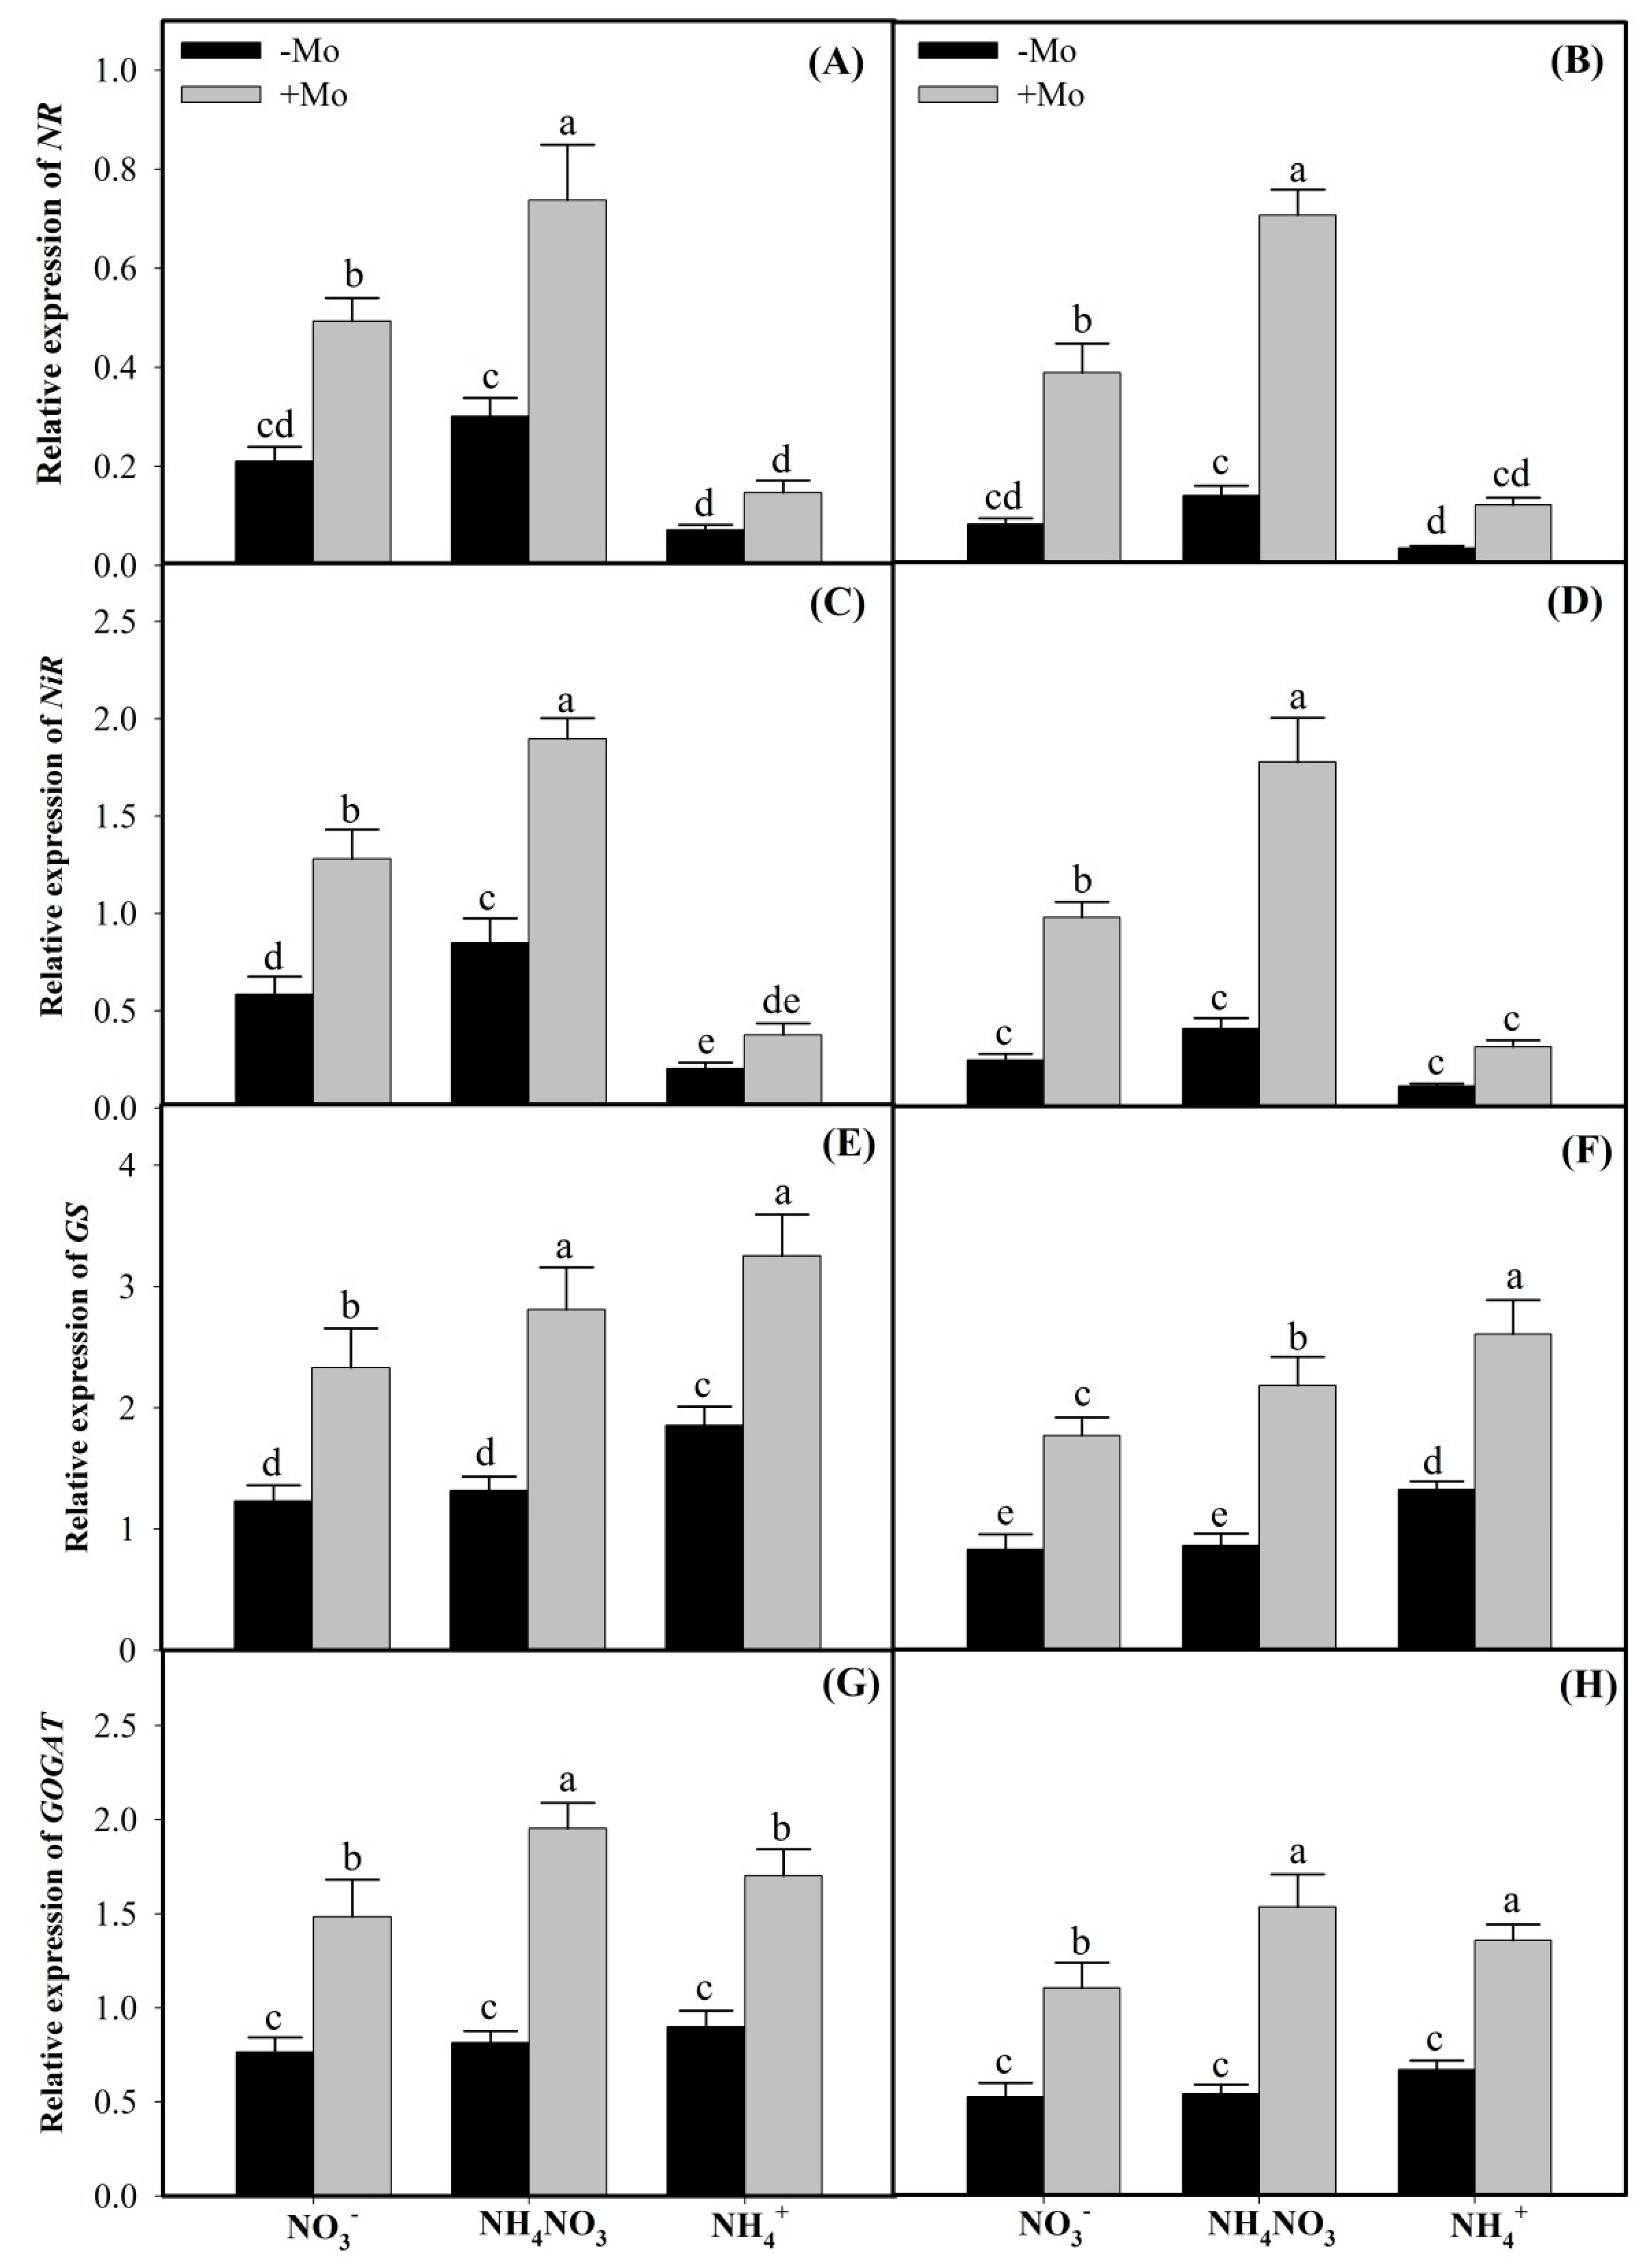
2.2. Mo Supply Regulated the Expressions of NR, NiR, GS, and GOGAT Genes

Among different N sources, the transcript abundance of NR and NiR genes followed the order of NH4NO3 > NO3-N > NH4+-N sources in both the winter wheat cultivars (Figure 3A–D). Compared with the −Mo-treated plants, +Mo application significantly up-regulated the expressions of NR and NiR genes under NO3-N and NH4NO3 sources relative to sole NH4+-N source in both the winter wheat cultivars (Figure 3A–D). However, in contrast to NR and NiR genes, Mo application also significantly up-regulated the expressions of GS and GOGAT genes under sole NH4+ source (Figure 3E–H). Interestingly, Mo-efficient winter wheat ‘97003’ cultivar recorded more pronounced Mo-dependent expressions than Mo-inefficient ‘97014’ cultivar under Mo-deprived environment (Figure 3), indicating that ‘97003’ cultivar can proficiently withstand Mo-deficient conditions than ‘97014’ winter wheat cultivar.

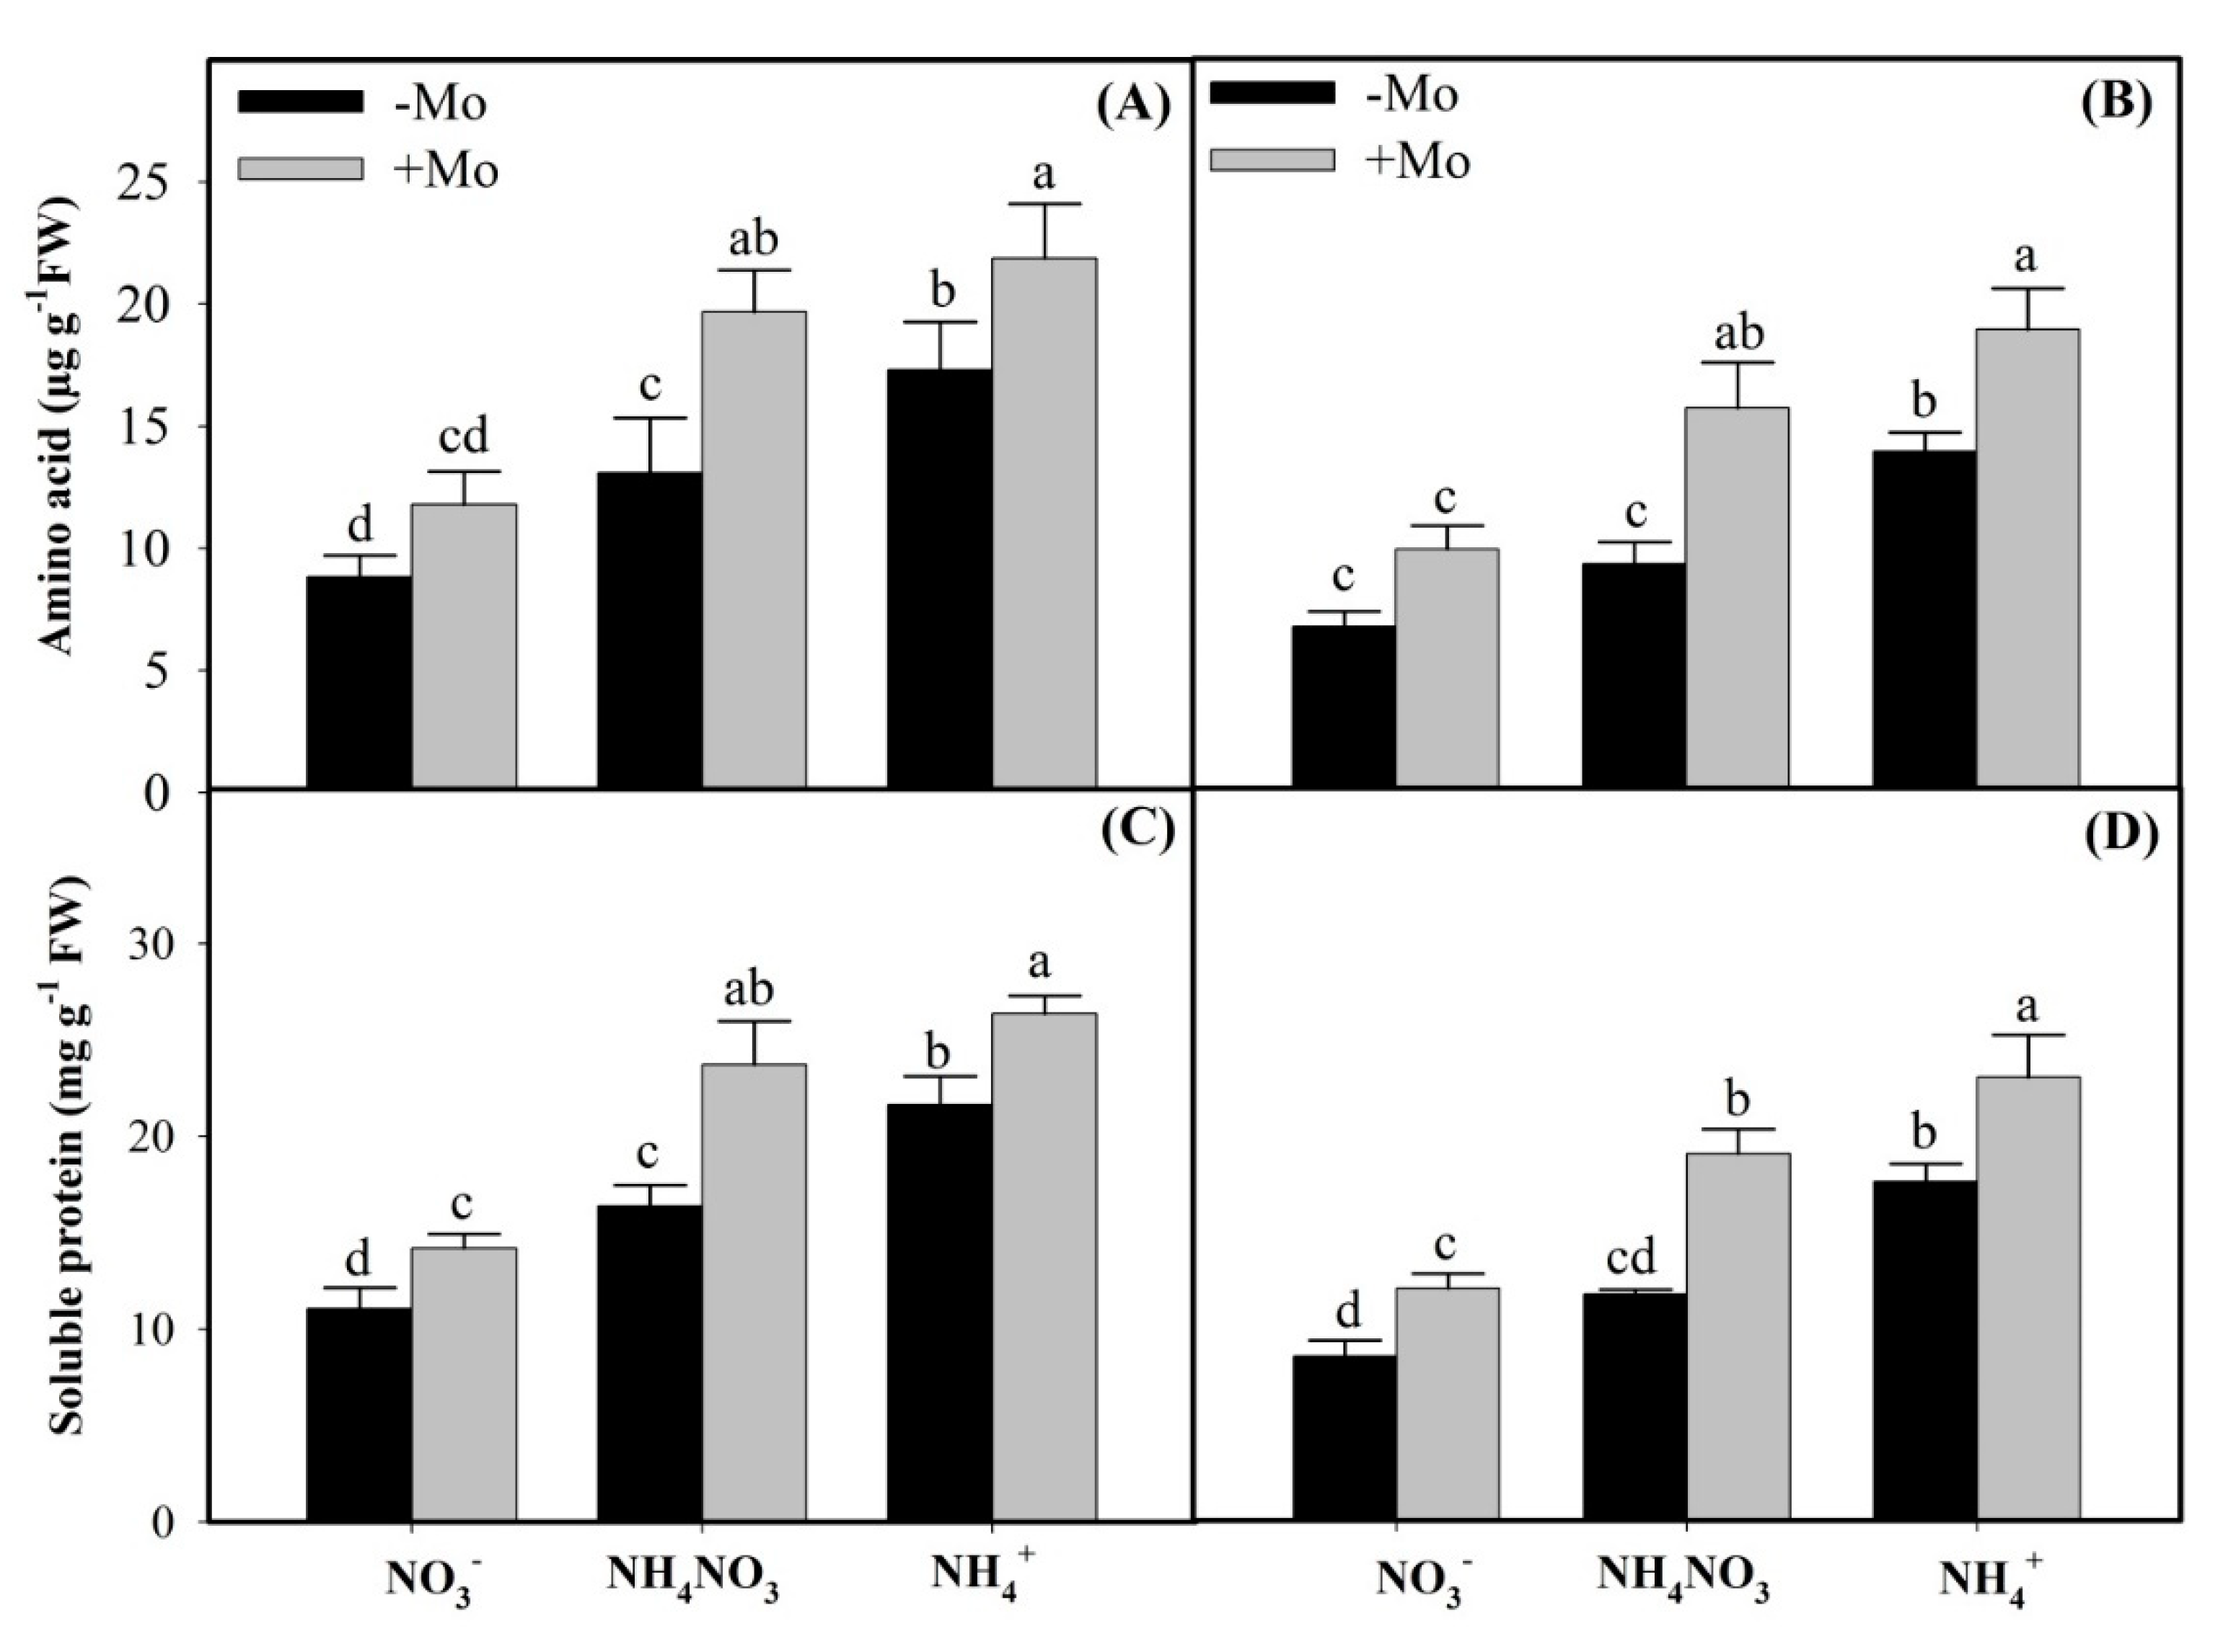
2.3. Effects of Mo Application on Inorganic and Reduced N Accumulation

In the present study, compared with −Mo plants, Mo application significantly decreased the NO3 contents in ‘97014’ cultivar relative to ‘97003’ cultivar under NO3 and NH4NO3 sources (Table 1). However, in contrast to NO3 contents, Mo application increased the NO2 and NH4+ contents in both the winter wheat cultivars (Table 1), suggesting that Mo plays a significant role in efficient NO3 assimilation pathways.
Amino acids and soluble proteins contents under different N sources followed the order of NH4+ > NH4NO3 > NO3 in both the winter wheat cultivars (Figure 4). Compared with the −Mo treatments, Mo application increased the amino acids and soluble proteins contents in all N sources; however, Mo-induced increases under different N sources were highest under NH4NO3 source than sole application of either N source (Figure 4), suggesting that Mo is harmonious with N when applied in mixture form as NH4NO3 source in winter wheat. Moreover, under Mo deficient conditions, Mo-efficient ‘97003’ cultivar showed more pronounced increases than Mo-inefficient ‘97014’ winter wheat cultivar (Figure 4), validating that Mo-efficient winter wheat ‘97003’ cultivar could comparatively withstand Mo-deficient soil conditions with less harm to Mo-dependent processes.

2.4. Effects of Mo Application on the Elemental Profiling of Winter Wheat Leaves Under Different N Sources

The effects of Mo supply on the macro-elements (K, Mg, and Ca) and micro-elements (Mn, Zn, Cu, and Fe) concentrations in the leaf tissues of winter wheat cultivars under various N forms are given in Table 2 and Table 3, respectively. In the present study, the concentrations of K, Ca, Mg, and Mn in the leaf tissues of both the winter wheat cultivars under different N sources followed the order of NO3 > NH4NO3 > NH4+ sources (Table 2 and Table 3). However, compared with the −Mo plants, the Ca and Mg concentrations were higher in the +Mo-treated plants under all N sources, while in contrast K and Mn concentrations were reduced in the wheat leaves (Table 2 and Table 3). Moreover, in the present study, Zn, Cu, and Fe concentrations under different N sources followed the order of NH4+ > NH4NO3 > NO3 in both the wheat cultivars (Table 3). However, compared with the −Mo treatments, Mo supply decreased the Mn, Zn, and Fe concentrations in the leaf tissues, except for Cu in both the winter wheat leaves (Table 3).

3. Discussion

Nitrate and ammonium are the major forms of N that plants use for different growth and developmental processes. The form of N available in the rhizosphere significantly affects N reduction, assimilation, gene expression patterns, N metabolism enzymes activities and assimilatory products, and the elemental profile of macro- and micro-elements [23,24,32,33,34]. Despite the fact that more energy is needed for NO3 assimilation, most of the crop plants prefer NO3 over NH4+ as their primary N source [35,36]. NO3 form of N is first converted to NO2 and then to NH4+ by the sequential actions of NR and NiR enzymes, whereas NH4+ is directly assimilated into amino acids via the concerted activities of GS and GOGAT enzymes [37]. So, the present study investigated, for the first time, the influence of Mo application on the activities and expressions of NR, NiR, GS, and GOGAT enzymes; assimilatory products; and the elemental profile in winter wheat leaves under different N sources.
In the present study, NO3 and NH4NO3 sources increased the NO3 contents in the wheat leaves (Table 1). In plant root systems, constitutive low-affinity transporter and inducible high-affinity transport systems are reserved to absorb NO3 from soil solutions. However, regulation of these transport systems is dependent on intracellular NO3 consumptions and cellular energy supplies [6,38]. Accumulated NO3 is reduced to NO2 through NR activities. In our study, Mo application significantly increased NR activities and expressions under NO3-N and NH4NO3 sources, compared to sole NH4+-N source (Figure 1A,B), which might be due to the fact that induction of NR in plants requires both NO3 and Mo elements; if either nutrient is deficient, the enzyme is either non-existent or less active [39]. Furthermore, we observed decreased NO3 and increased NO2 and NH4+ contents in the leaf tissues of both the winter wheat cultivars, with Mo-inefficient ‘97014’ cultivar showing more pronounced effects than the Mo-efficient ‘97003’ cultivar upon Mo application (Table 1). However, these differential responses between the two cultivars are consistent with the previous reports where Mo-efficient ‘97003’ cultivar yielded more than 90% and the Mo-inefficient ‘97014’ cultivar less than 50% under Mo deprivations when compared with the Mo applied (+Mo) treatments [40,41]. Nitrite contents depend upon NO3 availability in the rhizosphere, and NR activities and their mRNA expressions [32]. Our findings indicated that NO2 contents under different N sources followed the order of NH4NO3 > NO3 > NH4+ sources. These findings might be due to the reason that Mo-induced NR activities and expressions under different N sources followed the same order as NH4NO3 > NO3 > NH4+ in both the winter wheat cultivars. NR is a rate-limiting enzyme in the NO3 reduction to NO2 in higher plants [42], because it acts as a catalyst in the first step of the NO3 reduction pathway, yielding NO2, which in turn is further reduced to NH4+ [39,43]. Our findings that the increased NO2 contents under Mo application coincide with the higher NR activities and expressions in the wheat leaves (Figure 1 and Figure 3A,B) are in accordance with previous studies in soybean [44], common bean [45], maize [31], and strawberry [16].
Plants accumulate NH4+ either directly through ammonium transporters and/or they produce it in the NO3 reduction pathways [46,47,48]. In the present study, in contrast to NO3 contents, Mo supply increased the NO2 and NH4+ contents under all N sources in the leaves of wheat plants (Table 1). Therefore, these observations suggest that higher NH4+ contents, under sole NH4+ source, might be due to the ammonium transporters because these are highly responsive to NH4+ availability [42,49] while in NO3 and NH4NO3 sources through Mo-induced higher activities and expressions of NR and NiR enzymes (Figure 1 and Figure 3). These results agree with the previous reports that reduced NR activities and their mRNA expressions reduce the NO2 contents in leaf tissues [16,50,51]. Similarly, Mo-induced NiR activity and its mRNA expressions and concomitantly higher NH4+ contents in this study coincide with a direct relationship that exists between NiR activity and its transcript abundance, and the NH4+ accumulations [32].
GS and GOGAT play a significant role in the direct assimilation of NH4+ to amino acids in the leaves of higher plants [32,37]. Results of the present study showed that GS and GOGAT activities and expressions, and concomitantly amino acids and soluble protein contents under different N sources, followed the order of NH4+ > NH4NO3 > NO3 in both the winter wheat leaves. The reason might be that lower concentrations of external NO3 increase the GS and GOGAT activities [9], while higher cytoplasmic NO3 contents diminish their activities, along with reducing the amino acids and soluble protein contents [9,52]. However, Mo-induced increases in the GS and GOGAT activities and expressions, and similarly amino acids and soluble proteins contents under different N sources, followed the order of NH4NO3 > NO3 > NH4+ sources (Figure 2 and Figure 3E–F), suggesting that Mo has more complementary effects towards N when applied in the mixture form as NH4NO3 than the sole application of either source in winter wheat. Similar results have also been reported previously (that Mo application significantly enhanced the GS and GOGAT activities and expressions [15,16] and free amino acids and soluble protein contents in winter wheat leaves [53,54]).
We also observed that the mineral elements concentrations in the leaf tissues were markedly influenced by various N forms. The concentrations of macro-elements K, Ca, and Mg under different N sources followed the order of NO3 > NH4NO3 > NH4+ in both the winter wheat cultivars (Table 2). The reason is that translocation rates of K, Mg, and Ca might have reduced in the xylem sap of the wheat plants supplied with sole NH4+ source due to lower demand of cations for charge balance as previously observed [55]. Similar observations have also been reported in maize [55], cucumber [23], Arabidopsis thaliana [56], and watermelon [24]. However, microelements concentrations (Zn, Cu, and Fe except Mn), under different N sources followed the order of NH4+ > NH4NO3 > NO3 sources in both the winter wheat leaves (Table 3). These exceptional observations for Mn accumulation, compared to the other micronutrients, have also been reported previously in citrus plants [22]. The reason might be that re-translocation, recirculation, tissue internal demand, environmental conditions, and different plant species are the factors affecting the minerals uptake in plants [55,57]. Generally, compared with −Mo plants, Mo supply did not significantly affect the macro- or micro-elements concentrations in the winter wheat leaves under different N sources. Similar results have been reported in the root and leaf ionomes of cucumber plants grown with or without Mo fertilizer under hydroponic environment [58].
Taken together, the results of the present study conclude that Mo played a key role in improving the N metabolism under all the three N sources. However, Mo-induced effects on the N metabolism enzymes and assimilatory products exist in the order of NH4NO3 > NO3 > NH4+, suggesting that Mo is more harmonious with N when available in the mixture supply as NH4NO3 source than sole application of either source in winter wheat. However, more pronounced effects, in the Mo-dependent parameters, observed in the Mo-efficient winter wheat cultivar under −Mo conditions suggest that this cultivar might better adapt to Mo-deficient conditions with less harm to the N metabolism than the Mo-inefficient winter wheat cultivar.

4. Materials and Methods

4.1. Plant Materials and Growth Conditions

In the present experiment, two winter wheat cultivars, ‘97003’ (Mo-efficient) and ‘97014’ (Mo-inefficient), which are different in Mo uptake, distribution, and utilization efficiency [40,59,60], were obtained from the Laboratory of Trace Elements, Huazhong Agricultural University, China. Seeds were surface sterilized with a 0.5% sodium hypochlorite (NaOCl) solution and rinsed three times with sterile distilled water. The seeds were allowed to germinate in deionized water at 25 °C for five days. The conditions in the controlled environment chamber were 24/18 °C, 14/10 h day/night, 400 µmol·m−2·s−1 irradiance, and 60–70% relative humidity [53]. Uniform-sized wheat seedlings were transferred to plastic containers holding one-quarter strength Hoagland solution. Wheat seedlings were fixed into the perforated lids of the containers through small sponges. The wheat seedlings were grown in one-quarter and one-half strength Hoagland solutions for the first and second 2-day period, respectively, and then the seedlings were continuously supplied with a full-strength Hoagland solution for 30-days. A nitrification inhibitor (dicyandiamide, 8.0 µM) was added along with Hoagland solution to prevent NH4+ oxidation. The concentrations of three different N sources and macro-nutrients are mentioned in Table 4, and rests were added as follows: 100 µM EDTA-Fe, 0.8 µM ZnSO4·7H2O, 9.1 µM MnCl2·4H2O, 0.3 µM CuSO4·5H2O, and 46.2 µM H3BO3. Na2MoO4·2H2O was used as Mo fertilizer. Two Mo treatments, 0 (−Mo) and 1 µM (+Mo), were separately added with three N sources (Table 4).

4.2. Analysis of Nitrate Reductase Activity

The nitrate reductase (NR, EC 1.6.6.1) activity assay followed the protocol of our previous study [61]. Frozen plant leaf samples were ground in 4 mL cold 25 mM sodium phosphate (pH 8.7) buffer containing 1.3 mM EDTA and 10 mM cysteine and centrifuged at 4000 rpm and 4 °C for 15 min. The reaction mixture comprised of supernatant, 0.1 M KNO3, and 2.82 mM NADH. The reaction started with the addition of NADH and was then incubated for 30 min. The reaction was ended with 1% sulfanilamide and 0.02% N-phenyl-2-naphthylamine and left for 15 min. After centrifugation at 4000 rpm for 5 min, absorbance was determined at 540 nm.

4.3. Determination of Nitrite Reductase Activity

The nitrite reductase (NiR, EC 1.7.2.1) activity in the fresh leaves was determined according to the method of [62]. Briefly, the frozen leaf tissues were homogenized with cold 0.1 M potassium phosphate buffer (pH 7.5) and the reaction mixture was comprised of enzyme extract, 10 mM KNO2, 1.5% methylviologen, and 5% sodium dithionite (Na2S2O4) dissolved in 100 mM NaHCO3, whose addition initiated the reaction. The reaction mixture was nurtured at room temperature for 30 min and ended by the de-coloration of methylviologen. The nitrite contents were determined by measuring the absorbance at 540 nm in the solution consisting of supernatant, distilled water, 1% (w/v) N (1-naphty1)-ethylenediamine dihydrochloride, and 10% (w/v) sulfanilamide prepared in HCl.

4.4. Analysis of GS and NADH-GOGAT Activity

For the preparation of crude extracts, frozen leaves were homogenized with a pre-cooled extraction buffer consisting of 100 mM Tris–HCl (pH 7.6), 1.0 mM MgCl2-6H2O, 10 mM 2-mercaptoethanol, and 1.0 mM ethylenediaminetetraacetic acid (EDTA) in a mortar and pestle. The homogenates were centrifuged at 13,000 rpm for 15 min at 4 °C. The supernatants were collected as crude extracts for the measurement of GS and GOGAT enzymes assays in leaf tissues. The GS (EC 6.3.1.2) activity was measured in the leaf samples by following the method described by [63]. The crude enzyme extract was treated with synthase reaction fluid consisting of 0.1 M imidazole, 0.08 M MgSO4·7H2O, 0.02 M glutamic acid-Na, and 58 M hydroxylamine hydrochloride (pH 7.0) and 10 mM ATP and incubated for 15 min at 37 °C. The FeCl3 solution, consisting of 2% Tri-chloroacetic acid (TCA), 3.5% FeCl3, and 2% HCl, was added to terminate the reaction. The absorbance was then determined at 540 nm in spectrophotometer. The NADH-glutamate synthase (NADH-GOGAT; EC 1.4.1.14) activity was determined according to the method described by [64]. The crude enzyme extract was treated with 25 mM Tris-base, 100 mM α-Ketoglutaric acid, 10 mM KCl, 20 mM L-glutamine, and 3 mM NADH. Then, the absorbance was measured at 340 nm due to NADH oxidation.

4.5. Total RNA Extraction and Quantitative RT-PCR

The transcript abundance was measured in the frozen wheat leaves according to the method described by [61]. The total RNA was isolated and quantified with Nano Drop 2000 UV-VIS spectrophotometer (Thermo, Fisher, Waltham, MA, USA). The quantified RNA was then subjected to cDNA synthesis through reverse transcriptase using Oligo (dT18) primers, M-MLVRTase, and dNTP. A detection system of IQ5 Real-Time PCR (Bio-Rad, Hercules, CA, USA) was used to produce cDNA. The cDNA templates, the SYBR Green mix (Bio-Rad, United States), and gene-specific primers were mixed in a 96-well plate for the subsequent detections. The primers of NR, NiR, GS, and GOGAT genes were obtained from [32]. The wheat Actin gene was used as a reference for the genes of interest. The detailed information of primers is available in Table 5. The relative expression levels of the transcripts were calculated according to the method of [65].

4.6. Determination of Nitrate, Nitrite, and Ammonium Contents

Fresh wheat leaves were homogenized (1:10, w/v) in redistilled water, boiled for 15 min, and then filtered. Nitrate contents were determined according to the method of [66]. The reaction mixture was comprised of filtrate and 5% salicylic acid in concentrated H2SO4. After incubation for 15 min, 4M NaOH was added and absorbance was measured at 410 nm. A calibration curve was prepared for KNO3 and expressed in µmol NO3·g−1·FW.
Nitrite contents were measured according the method described by [32]. Briefly, fresh wheat leaves were grinded with 10 mM Tris buffer (pH 7.4) containing 10% (v/v) glycerol, 2 mM EDTA, 2% (w/v) PVPP, and 1 mM DTT at 4 °C. The homogenate was centrifuged at 12,000× g for 15 min. Then, nitrite contents were analyzed by Griess reagent consisting of 0.1% naphthylethylene diamine dihydrochloride in H2O and 1% sulfanilamide in 2.5% H3PO4. Sodium nitrite was used as standard, and nitrite contents were expressed as μmol NO2·g−1·FW.
Ammonium contents were measured using the Nessler reagent [67]. The reaction mixture was comprised of 0.1 mL filtrate, 0.01 mL 10% K–Na tartrate, 2.4 mL redistilled water, and 0.1 mL Nessler reagent. Spectrophotometer was used to measure the absorbance at 425 nm after 5 min. A standard calibration curve was prepared for NH4Cl and expressed in µmol NH4+ g−1·FW.

4.7. Measurement of Amino Acids

Free amino acid contents were measured according to method describe by [68]. Briefly, frozen wheat leaves were ground with phosphate buffer (pH 7.0) in a mortar and pestle. The reaction mixture was comprised of 10% pyridine and 2% ninhydrin solution. The absorbance was measured at 570 nm using spectrophotometer.

4.8. Measurement of Soluble Proteins

The total soluble protein contents in the leaf tissues were measured by following the method of [69] using bovine serum albumin (BSA). The absorbance was measured with spectrophotometer at 595 nm, and the pure reagent was used as blank.

4.9. Mineral Elements Assays

The plant samples were dried, grinded, weighed, and soaked with sulfuric acid and digested in a fume hood at 180 °C for 3 h, followed by the addition of H2O2. K concentration was then determined with a flame photometer (Model 410, Sherwood, USA).
For the determination of calcium (Ca); magnesium (Mg); and other micronutrients zinc (Zn), iron (Fe), manganese (Mn), and copper (Cu), dried plant samples were digested in 4:1 (v/v) HNO3:HClO4 (v/v) in a microwave oven (MLS 1200, Milestone, FKV, Italy). The elements (Ca, Mg, Zn, Fe, Mn, and Cu) concentrations in the digested samples were determined by Inductively Coupled Plasma-Mass Spectrometry (ICP-MS).

4.10. Statistical Analysis

Data were statistically analyzed following two-way analysis of variance (ANOVA) using Statistix 8.1 software (Analytical Software, Tallahassee, FL, USA). Mean variances of the data were analyzed using the least significant difference (LSD) test at p < 0.05. Graphs were plotted using Sigmaplot 10.0.

5. Conclusions

The present study revealed that Mo fertilizer plays a key role in N metabolism through regulating the activities and expressions of N-assimilating enzymes. Mo application decreased the NO3 contents while increasing NO2, NH4+, amino acids, and proteins contents in the leaf tissues, which is consistent with the enhanced NR, NiR, GS, and GOGAT activities and expression under different N sources; however, Mo-induced effects were highest under NH4NO3 source in both the wheat cultivars, suggesting that Mo plays a significant role in N assimilatory pathway and is more harmonious under mixture supply as NH4NO3 than either of the individual sources. Moreover, different N sources significantly interrupted the macro- and micro-elemental uptake, while Mo-induced effects were generally not significant. Interestingly, Mo-induced effects in the N metabolism enzymes activities and expressions and assimilatory products were more prominent in the ‘97014’ cultivar compared with the ‘97003’ cultivar, indicating that Mo has key importance in the N metabolism of winter wheat.

Author Contributions

M.I., C.X.H., X.S., and S.H. conceived and designed the experiment; M.I., M.H.S., and M.S.R. conducted the experiment and helped in replacing nutrient solution; F.R., J.A., A.M.E., M.G.M., U.A., and P.B. helped to analyze the data; X.S. and S.H. provided statistical guidance and drafted the manuscript; and M.I. wrote the manuscript.

Funding

This work was supported by the National Key Research and Development program of China (2016YFD0200108), the National Natural Science Foundation of China (Program No. 41771329) and the 948 Project from the Ministry of Agriculture of China (2016-X41).

Conflicts of Interest

The authors declare no conflicts of interest.

References

  1. Castaings, L.; Marchive, C.; Meyer, C.; Krapp, A. Nitrogen signalling in arabidopsis: How to obtain insights into a complex signalling network. J. Exp. Bot. 2011, 62, 1391–1397. [Google Scholar] [CrossRef] [PubMed]
  2. Lam, H.M.; Coschigano, K.; Schultz, C.; Melooliveira, R.; Tjaden, G.; Oliveira, I.; Ngai, N.; Hsieh, M.H.; Coruzzi, G. Use of arabidopsis mutants and genes to study amide amino acid biosynthesis. Plant Cell 1995, 7, 887–898. [Google Scholar] [CrossRef] [PubMed]
  3. Garg, S. Role and hormonal regulation of nitrate reductase activity in higher plants: A review. Plant Sci. Feed 2013, 3, 13–20. [Google Scholar]
  4. Nemie-Feyissa, D.; Królicka, A.; Førland, N.; Hansen, M.; Heidari, B.; Lillo, C. Post-translational control of nitrate reductase activity responding to light and photosynthesis evolved already in the early vascular plants. J. Plant Physiol. 2013, 170, 662–667. [Google Scholar] [CrossRef]
  5. Schwarz, G.; Mendel, R.R.; Ribbe, M.W. Molybdenum cofactors, enzymes and pathways. Nature 2009, 460, 839–847. [Google Scholar] [CrossRef] [PubMed]
  6. Aslam, M.; Travis, R.L.; Rains, D.W. Evidence for substrate induction of a nitrate efflux system in barley roots. Plant Physiol. 1996, 112, 1167–1175. [Google Scholar] [CrossRef] [PubMed]
  7. Vanoni, M.; Curti, B. Glutamate synthase: A complex iron-sulfur flavoprotein. Cell. Mol. Life Sci. Cmls 1999, 55, 617–638. [Google Scholar] [CrossRef] [PubMed]
  8. Nagy, Z.; Németh, E.; Guóth, A.; Bona, L.; Wodala, B.; Pécsváradi, A. Metabolic indicators of drought stress tolerance in wheat: Glutamine synthetase isoenzymes and rubisco. Plant Physiol. Biochem. 2013, 67, 48–54. [Google Scholar] [CrossRef] [PubMed]
  9. Pinto, E.; Fidalgo, F.; Teixeira, J.; Aguiar, A.A.; Ferreira, I.M. Influence of the temporal and spatial variation of nitrate reductase, glutamine synthetase and soil composition in the n species content in lettuce (lactuca sativa). Plant Sci. 2014, 219, 35–41. [Google Scholar] [CrossRef] [PubMed]
  10. Wang, Z.-Q.; Yuan, Y.-Z.; Ou, J.-Q.; Lin, Q.-H.; Zhang, C.-F. Glutamine synthetase and glutamate dehydrogenase contribute differentially to proline accumulation in leaves of wheat (triticum aestivum) seedlings exposed to different salinity. J. Plant Physiol. 2007, 164, 695–701. [Google Scholar] [CrossRef] [PubMed]
  11. Pajuelo, P.; Pajuelo, E.; Forde, B.G.; Márquez, A.J. Regulation of the expression of ferredoxin-glutamate synthase in barley. Planta 1997, 203, 517–525. [Google Scholar] [CrossRef] [PubMed]
  12. Turano, F.J.; Muhitch, M.J. Differential accumulation of ferredoxin-and nadh-dependent glutamate synthase activities, peptides, and transcripts in developing soybean seedlings in response to light, nitrogen, and nodulation. Physiol. Plant. 1999, 107, 407–418. [Google Scholar] [CrossRef]
  13. Forde, B.G. Local and long-range signaling pathways regulating plant responses to nitrate. Annu. Rev. Plant Biol. 2002, 53, 203–224. [Google Scholar] [CrossRef] [PubMed]
  14. Chen, M.; Li, K.; Li, H.; Song, C.P.; Miao, Y. The glutathione peroxidase gene family ingossypium hirsutum: Genome-wide identification, classification, gene expression and functional analysis. Sci. Rep. 2017, 7, 44743. [Google Scholar] [CrossRef] [PubMed]
  15. Min, Y.U.; Cheng-Xiao, H.U.; Sun, X.C.; Wang, Y.H. Influences of mo on nitrate reductase, glutamine synthetase and nitrogen accumulation and utilization in mo-efficient and mo-inefficient winter wheat cultivars. Agric. Sci. China 2010, 9, 355–361. [Google Scholar]
  16. Liu, L.; Xiao, W.; Li, L.; Li, D.-M.; Gao, D.-S.; Zhu, C.-y.; Fu, X.-L. Effect of exogenously applied molybdenum on its absorption and nitrate metabolism in strawberry seedlings. Plant Physiol. Biochem. 2017, 115, 200–211. [Google Scholar] [CrossRef] [PubMed]
  17. Mendel, R.R.; Schwarz, G. Molybdenum cofactor biosynthesis in plants and humans. Coord. Chem. Rev. 2011, 255, 1145–1158. [Google Scholar] [CrossRef]
  18. Kaiser, B.N.; Gridley, K.L.; Ngaire Brady, J.; Phillips, T.; Tyerman, S.D. The role of molybdenum in agricultural plant production. Ann. Bot. 2005, 96, 745–754. [Google Scholar] [CrossRef]
  19. Baxter, I. Ionomics: Studying the social network of mineral nutrients. Curr. Opin. Plant Biol. 2009, 12, 381–386. [Google Scholar] [CrossRef]
  20. Murgia, I.; Vigani, G. Analysis of arabidopsis thaliana atfer4-1, atfh and atfer4-1/atfh mutants uncovers frataxin and ferritin contributions to leaf ionome homeostasis. Plant Physiol. Biochem. 2015, 94, 65–72. [Google Scholar] [CrossRef]
  21. Baxter, I.R.; Vitek, O.; Lahner, B.; Muthukumar, B.; Borghi, M.; Morrissey, J.; Guerinot, M.L.; Salt, D.E. The leaf ionome as a multivariable system to detect a plant’s physiological status. Proc. Natl. Acad. Sci. 2008, 105, 12081–12086. [Google Scholar] [CrossRef] [PubMed]
  22. Na, L.; Li, Z.; Xiangxiang, M.; Ara, N.; Jinghua, Y.; Mingfang, Z. Effect of nitrate/ammonium ratios on growth, root morphology and nutrient elements uptake of watermelon (citrullus lanatus) seedlings. J. Plant Nutr. 2014, 37, 1859–1872. [Google Scholar] [CrossRef]
  23. Serna, M.; Borras, R.; Legaz, F.; Primo-Millo, E. The influence of nitrogen concentration and ammonium/nitrate ratio on n-uptake, mineral composition and yield of citrus. Plant Soil 1992, 147, 13–23. [Google Scholar] [CrossRef]
  24. Roosta, H.R.; Schjoerring, J.K. Effects of ammonium toxicity on nitrogen metabolism and elemental profile of cucumber plants. J. Plant Nutr. 2007, 30, 1933–1951. [Google Scholar] [CrossRef]
  25. Sanchezechaniz, J.; Benitofernández, J.; Minteguiraso, S. Methemoglobinemia and consumption of vegetables in infants. Pediatrics 2001, 107, 1024–1028. [Google Scholar] [CrossRef]
  26. Wright, R.O.; Lewander, W.J.; Woolf, A.D. Methemoglobinemia: Etiology, pharmacology, and clinical management. Ann. Emerg. Med. 1999, 34, 646. [Google Scholar] [CrossRef]
  27. Wen, X.; Hu, C.; Sun, X.; Zhao, X.; Tan, Q. Research on the nitrogen transformation in rhizosphere of winter wheat (triticum aestivum) under molybdenum addition. Environ. Sci. Pollut. Res. 2019, 26, 2363–2374. [Google Scholar] [CrossRef]
  28. Liu, X.; Zhao, X.; Li, X.; Chen, S. Suppression of hesa mutation on nitrogenase activity in paenibacillus polymyxa wly78 with the addition of high levels of molybdate or cystine. PeerJ 2019, 7, e6294. [Google Scholar] [CrossRef]
  29. Afridi, M.M.R.K.; Hewitt, E.J. The inducible formation and stability of nitrate reductase in higher plants: I. Effects of nitrate and molybdenum on enzyme activity in cauliflower (brassica oleracea var. Botrytis). J. Exp. Bot. 1964, 15, 251–271. [Google Scholar] [CrossRef]
  30. Spencer, D.; Wood, J.G. The role of molybdenum in nitrate reduction in higher plants. Aust. J. Biol. Sci. 1954, 7, 425. [Google Scholar] [CrossRef]
  31. Kovács, B.; Puskás-Preszner, A.; Huzsvai, L.; Lévai, L.; Bódi, É. Effect of molybdenum treatment on molybdenum concentration and nitrate reduction in maize seedlings. Plant Physiol. Biochem. 2015, 96, 38–44. [Google Scholar] [CrossRef] [PubMed] [Green Version]
  32. Balotf, S.; Kavoosi, G.; Kholdebarin, B. Nitrate reductase, nitrite reductase, glutamine synthetase, and glutamate synthase expression and activity in response to different nitrogen sources in nitrogen-starved wheat seedlings. Biotechnol. Appl. Biochem. 2016, 63, 220–229. [Google Scholar] [CrossRef] [PubMed]
  33. Balotf, S.; Islam, S.; Kavoosi, G.; Kholdebarin, B.; Juhasz, A.; Ma, W. How exogenous nitric oxide regulates nitrogen assimilation in wheat seedlings under different nitrogen sources and levels. PLoS ONE 2018, 13, e0190269. [Google Scholar] [CrossRef]
  34. Xiao, T.; Mi, M.; Wang, C.; Meng, Q.; Chen, Y.; Zheng, L.; Zhang, H.; Hu, Z.; Shen, Z.; Yan, X. A methionine-r-sulfoxide reductase, osmsrb5, is required for rice defense against copper toxicity. Environ. Exp. Bot. 2018, 153. [Google Scholar] [CrossRef]
  35. Keys, A.J.; Bird, I.F.; Cornelius, M.J.; Lea, P.J.; Wallsgrove, R.M.; Miflin, B.J. Photorespiratory nitrogen cycle. Nature 1978, 275, 741–743. [Google Scholar] [CrossRef]
  36. Pérez-Delgado, C.M.; García-Calderón, M.; Márquez, A.J.; Betti, M. Correction: Reassimilation of photorespiratory ammonium in lotus japonicus plants deficient in plastidic glutamine synthetase. PLoS ONE 2016, 11, e0156568. [Google Scholar] [CrossRef] [PubMed]
  37. Valadier, M.H.; Yoshida, A.; Grandjean, O.; Morin, H.; Kronenberger, J.; Boutet, S.; Raballand, A.; Hase, T.; Yoneyama, T.; Suzuki, A. Implication of the glutamine synthetase/glutamate synthase pathway in conditioning the amino acid metabolism in bundle sheath and mesophyll cells of maize leaves. Febs J. 2008, 275, 3193–3206. [Google Scholar] [CrossRef]
  38. Santi, S.; Locci, G.; Pinton, R.; Cesco, S.; Varanini, Z. Plasma membrane h+-atpase in maize roots induced for no3-uptake. Plant Physiol. 1995, 109, 1277–1283. [Google Scholar] [CrossRef]
  39. Campbell, W. Structure and function of eukaryotic nad (p) h: Nitrate reductase. Cell. Mol. Life Sci. Cmls 2001, 58, 194–204. [Google Scholar] [CrossRef]
  40. Yu, M.; Hu, C.-X.; Wang, Y.-H. Molybdenum efficiency in winter wheat cultivars as related to molybdenum uptake and distribution. Plant Soil 2002, 245, 287–293. [Google Scholar] [CrossRef]
  41. Yu, M.; Hu, C.; Wang, Y. Influences of seed molybdenum and molybdenum application on nitrate reductase activity, shoot dry matter, and grain yields of winter wheat cultivars. J. Plant Nutr. 1999, 22, 1433–1441. [Google Scholar] [CrossRef]
  42. Hachiya, T.; Watanabe, C.K.; Fujimoto, M.; Ishikawa, T.; Takahara, K.; Kawai-Yamada, M.; Uchimiya, H.; Uesono, Y.; Terashima, I.; Noguchi, K. Nitrate addition alleviates ammonium toxicity without lessening ammonium accumulation, organic acid depletion and inorganic cation depletion in arabidopsis thaliana shoots. Plant Cell Physiol. 2012, 53, 577–591. [Google Scholar] [CrossRef] [PubMed]
  43. Morozkina, E.; Zvyagilskaya, R. Nitrate reductases: Structure, functions, and effect of stress factors. Biochem. (Mosc.) 2007, 72, 1151–1160. [Google Scholar] [CrossRef]
  44. Peng, L.; Yu, Y. Effect of molybdenum and boron on nitrogen metabolism of soybea. Plant Natrition Fertil. 1999, 5, 347–351. [Google Scholar]
  45. Calonego, J.C.; Junior, E.U.R.; Barbosa, R.D.; Leite, G.H.P.; Grassi Filho, H. Adubação nitrogenada em cobertura no feijoeiro com suplementação de molibdênio via foliar. Rev. Ciência Agronômica 2010, 41, 334–340. [Google Scholar] [CrossRef]
  46. Goodall, A.J.; Kumar, P.; Tobin, A.K. Identification and expression analyses of cytosolic glutamine synthetase genes in barley (hordeum vulgare l.). Plant Cell Physiol. 2013, 54, 492–505. [Google Scholar] [CrossRef] [PubMed]
  47. Kronzucker, H.J.; Britto, D.T.; Davenport, R.J.; Tester, M. Ammonium toxicity and the real cost of transport. Trends Plant Sci. 2001, 6, 335–337. [Google Scholar] [CrossRef]
  48. Shelden, M.C.; Dong, B.; Guy, L.; Trevaskis, B.; Whelan, J.; Ryan, P.R.; Howitt, S.M.; Udvardi, M.K. Arabidopsis ammonium transporters, atamt1; 1 and atamt1; 2, have different biochemical properties and functional roles. Plant Soil 2001, 231, 151–160. [Google Scholar] [CrossRef]
  49. Hachiya, T.; Sugiura, D.; Kojima, M.; Sato, S.; Yanagisawa, S.; Sakakibara, H.; Terashima, I.; Noguchi, K. High co2 triggers preferential root growth of arabidopsis thaliana via two distinct systems under low ph and low n stresses. Plant Cell Physiol. 2014, 55, 269–280. [Google Scholar] [CrossRef]
  50. Lambeck, I.C.; Fischer-Schrader, K.; Niks, D.; Roeper, J.; Chi, J.-C.; Hille, R.; Schwarz, G. Molecular mechanism of 14-3-3 protein-mediated inhibition of plant nitrate reductase. J. Biol. Chem. 2012, 287, 4562–4571. [Google Scholar] [CrossRef]
  51. Lea, U.S.; Leydecker, M.-T.; Quilleré, I.; Meyer, C.; Lillo, C. Posttranslational regulation of nitrate reductase strongly affects the levels of free amino acids and nitrate, whereas transcriptional regulation has only minor influence. Plant Physiol. 2006, 140, 1085–1094. [Google Scholar] [CrossRef] [PubMed]
  52. Miflin, B.J.; Habash, D.Z. The role of glutamine synthetase and glutamate dehydrogenase in nitrogen assimilation and possibilities for improvement in the nitrogen utilization of crops. J. Exp. Bot. 2002, 53, 979–987. [Google Scholar] [CrossRef] [PubMed] [Green Version]
  53. Wu, S.; Hu, C.; Tan, Q.; Nie, Z.; Sun, X. Effects of molybdenum on water utilization, antioxidative defense system and osmotic-adjustment ability in winter wheat (triticum aestivum) under drought stress. Plant Physiol. Biochem. 2014, 83, 365–374. [Google Scholar] [CrossRef] [PubMed]
  54. Hu, C.; Wang, Y.; Wei, W. Effect of molybdenum applications on concentrations of free amino acids in winter wheat at different growth stages. J. Plant Nutr. 2002, 25, 1487–1499. [Google Scholar] [CrossRef]
  55. Engels, C.; Marschner, H. Influence of the form of nitrogen supply on root uptake and translocation of cations in the xylem exudate of maize (zea mays l). J. Exp. Bot. 1993, 44, 1695–1701. [Google Scholar] [CrossRef]
  56. Helali, S.M.r.; Nebli, H.; Kaddour, R.; Mahmoudi, H.; Lachaâl, M.; Ouerghi, Z. Influence of nitrate—Ammonium ratio on growth and nutrition of arabidopsis thaliana. Plant Soil 2010, 336, 65–74. [Google Scholar] [CrossRef]
  57. Van Beusichem, M.L.; Kirkby, E.A.; Baas, R. Influence of nitrate and ammonium nutrition on the uptake, assimilation, and distribution of nutrients in ricinus communis. Plant Physiol. 1988, 86, 914–921. [Google Scholar] [CrossRef]
  58. Vigani, G.; Di Silvestre, D.; Agresta, A.M.; Donnini, S.; Mauri, P.; Gehl, C.; Bittner, F.; Murgia, I. Molybdenum and iron mutually impact their homeostasis in cucumber (cucumis sativus) plants. New Phytol. 2017, 213, 1222–1241. [Google Scholar] [CrossRef]
  59. Nie, Z.; Hu, C.; Liu, H.; Tan, Q.; Sun, X. Differential expression of molybdenum transport and assimilation genes between two winter wheat cultivars (triticum aestivum). Plant Physiol. Biochem. 2014, 82, 27–33. [Google Scholar] [CrossRef]
  60. Sun, X.; Hu, C.; Tan, Q.; Liu, J.; Liu, H. Effects of molybdenum on expression of cold-responsive genes in abscisic acid (aba)-dependent and aba-independent pathways in winter wheat under low-temperature stress. Ann. Bot. 2009, 104, 345–356. [Google Scholar] [CrossRef]
  61. Wu, S.; Hu, C.; Tan, Q.; Xu, S.; Sun, X. Nitric oxide mediates molybdenum-induced antioxidant defense in wheat under drought stress. Front. Plant Sci. 2017, 8, 1085. [Google Scholar] [CrossRef]
  62. Rao, L.V.M.; Rajasekhar, V.K.; Sopory, S.K.; Guhamukherjee, S. Phytochrome regulation of nitrite reductase—A chloroplast enzyme—In etiolated maize leaves. Plant Cell Physiol. 1981, 22, 577–582. [Google Scholar]
  63. Rhodes, D.; Rendon, G.A.; Stewart, G.R. The control of glutamine synthetase level in lemna minor L. Planta 1975, 125, 201–211. [Google Scholar] [CrossRef]
  64. Lin, C.C.; Kao, C.H. Disturbed ammonium assimilation is associated with growth inhibition of roots in rice seedlings caused by nacl. Plant Growth Regul. 1996, 18, 233–238. [Google Scholar] [CrossRef]
  65. Pfaffl, M.W. A new mathematical model for relative quantification in real-time rt–pcr. Nucleic Acids Res. 2001, 29, e45. [Google Scholar] [CrossRef] [PubMed]
  66. Cataldo, D.; Maroon, M.; Schrader, L.; Youngs, V. Rapid colorimetric determination of nitrate in plant tissue by nitration of salicylic acid 1. Commun. Soil Sci. Plant Anal. 1975, 6, 71–80. [Google Scholar] [CrossRef]
  67. Molins-Legua, C.; Meseguer-Lloret, S.; Moliner-Martinez, Y.; Campíns-Falcó, P. A guide for selecting the most appropriate method for ammonium determination in water analysis. Trac Trends Anal. Chem. 2006, 25, 282–290. [Google Scholar] [CrossRef]
  68. Hamilton, P.B.; Van Slyke, D.D.; Lemish, S. The gasometric determination of free amino acids in blood filtrates by the ninhydrin-carbon dioxide method. J. Biol. Chem. 1943, 150, 251–258. [Google Scholar]
  69. Bradford, M.M. A rapid method for the quantitation of microgram quantities of protein utilizing the principle of protein-dye binding. Anal. Biochem. 1976, 72, 248–254. [Google Scholar] [CrossRef]
Figure 1. Impacts of Molybdenum (Mo) application on nitrate reductase (NR) and nitrite reductase (NiR) activities of Mo-efficient winter wheat ‘97003’ cultivar (A,C) and Mo-inefficient winter wheat ‘97014’ cultivar (B,D) under different N sources. −Mo and +Mo treatments represent the 0 and 1 µM Mo [Na2MoO4.2H2O] concentrations, respectively, in Hoagland solution. Vertical bar above indicates standard error of four replicates. Different lowercase letters (a, b, c, etc.) represent significant differences according to the least significant difference (LSD)-test (p < 0.05, n = 4). NO3: sole nitrate source, NH4NO3: co-applied ammonium nitrate, NH4+: sole ammonium source.
Ijms 20 03009 g001
Figure 2. Impacts of Molybdenum (Mo) application on glutamine synthetase (GS) and glutamate synthase (GOGAT) activities in the leaves of Mo-efficient winter wheat ‘97003’ cultivar (A,C) and Mo-inefficient ‘97014’ cultivar (B,D) under different N sources. −Mo and +Mo treatments represent the 0 and 1 µM Mo [Na2MoO4.2H2O] concentrations, respectively, in Hoagland solution. Vertical bar above indicates standard error of four replicates. Different lowercase letters (a, b, c, etc.) represent significant differences according to the LSD-test (p < 0.05, n = 4). Description of treatments is mentioned in Figure 1.
Ijms 20 03009 g002
Figure 3. qRT-PCR analysis of NR, NiR, GS, and GOGAT genes transcripts in the leaves of Mo-efficient ‘97003’ (A,C,E,G) and Mo-inefficient ‘97014’ (B,D,F,H) winter wheat cultivars. Seedlings were grown in nutrient solutions supplied with or without Mo fertilizer [Na2MoO4.2H2O] under different N sources. −Mo and +Mo treatments represent the 0 and 1 µM Mo concentrations, respectively, in Hoagland solution. Vertical bar above indicates standard error of four replicates. Different lowercase letters (a, b, c, etc.) represent significant differences according to the LSD-test (p < 0.05, n = 4). Description of treatments is mentioned in Figure 1.
Ijms 20 03009 g003
Figure 4. Effects of Molybdenum (Mo) application on amino acids and soluble protein contents in leaves of Mo-efficient winter wheat ‘97003’ cultivar (A,C) and Mo-inefficient winter wheat ‘97014’ cultivar (B,D) under different N sources. −Mo and +Mo treatments represent 0 and 1 µM Mo [Na2MoO4.2H2O] concentrations, respectively, in Hoagland solution. Vertical bar above indicates standard error of four replicates. Different lowercase letters (a, b, c, etc.) represent significant differences according to the LSD-test (p < 0.05, n = 4). Description of treatments is mentioned in Figure 1.
Ijms 20 03009 g004
Table 1. Influence of Mo supply on NO3, NO2, and NH4+ contents in leaves of Mo-efficient ‘97003’ and Mo-inefficient ‘97014’ winter wheat cultivars under different N sources.
Treatments9700397014
NO3 Content
(µmol·g−1FW)
NO2 Content
(µmol·g−1FW)
NH4+ Content
(µmol·g−1FW)
NO3 Content
(µmol·g−1FW)
NO2 Content
(µmol·g−1FW)
NH4+ Content
(µmol·g−1FW)
NO3−Mo35.56 ± 5.32 a2.22 ± 0.22 c7.45 ± 0.57 c38.98 ± 4.19 a1.80 ± 0.10 b6.35 ± 0.82 b
+Mo28.84 ± 2.78 ab2.74 ± 0.32 bc8.90 ± 1.06 c28.17 ± 4.27 bc2.53 ± 0.36 b8.19 ± 0.79 b
NH4NO3−Mo28.04 ± 3.74 ab3.30 ± 0.43 b10.79 ± 1.22 bc33.04 ± 3.25 ab2.59 ± 0.21 b9.00 ± 0.65 b
+Mo21.63 ± 1.73 b4.52 ± 0.53 a13.68 ± 1.38 ab21.44 ± 2.15 c4.18 ± 0.56 a12.85 ± 1.44 a
NH4+−Mo1.70 ± 0.17 c0.34 ± 0.02 d13.43 ± 1.07 ab1.80 ± 0.22 d0.23 ± 0.04 c12.94 ± 1.32 a
+Mo1.50 ± 0.08 c0.38 ± 0.04 d15.53 ± 1.94 a1.48 ± 0.12 d0.32 ± 0.04 c15.54 ± 1.80 a
Note: −Mo and +Mo represent winter wheat cultivars fertilized, respectively, with 0 and 1 µM Mo [Na2MoO4.2H2O] against different N sources. Data represent means ± S.E from different independent treatments. Dissimilar superscripted letters (a, b, c, etc.) in each column indicate significant differences among different treatments at (p < 0.05). FW, fresh weight
Table 2. Influence of Molybdenum (Mo) supply on potassium, magnesium, and calcium concentrations in leaves of Mo-efficient ‘97003’ and Mo-inefficient ‘97014’ winter wheat cultivars under different N sources.
Treatments9700397014
K
(mg·g−1DW)
Mg
(mg·g−1DW)
Ca
(mg g−1DW)
K
(mg·g−1DW)
Mg
(mg·g−1DW)
Ca
(mg·g−1DW)
NO3−Mo37.80 ± 1.62 a2.63 ± 0.19 ab12.09 ± 1.15 a37.31 ± 1.86 a2.14 ± 0.19 ab10.43 ± 1.49 ab
+Mo34.30 ± 0.89 b3.25 ± 0.55 a13.79 ± 1.01 a35.49 ± 1.82 a2.80 ± 0.23 a12.92 ± 1.36 a
NH4NO3−Mo30.89 ± 0.84 c2.24 ± 0.12 bc10.49 ± 0.76 a30.56 ± 0.64 b1.89 ± 0.20 b8.08 ± 0.86 bc
+Mo28.24 ± 1.24 c2.87 ± 0.30 ab12.05 ± 1.63 a26.45 ± 1.39 c2.67 ± 0.43 a11.37 ± 0.78 a
NH4+−Mo25.10 ± 0.55 d1.32 ± 0.15 d4.70 ± 0.23 b25.92 ± 0.63 c0.88 ± 0.04 c4.17 ± 0.29 d
+Mo22.73 ± 0.74 d1.49 ± 0.15 cd5.27 ± 0.78 b23.71 ± 0.62 c1.09 ± 0.14 c4.85 ± 0.66 cd
Note: −Mo and +Mo represent winter wheat cultivars fertilized, respectively, with 0 and 1 µM Mo [Na2MoO4.2H2O] against different N sources. Data represent means ± S.E from different independent treatments. Different superscripted letters (a, b, c, etc.) in each column indicate significant differences among different treatments at (p < 0.05). K, potassium; Mg, magnesium; Ca, calcium; and DW, dry weight.
Table 3. Influence of Molybdenum (Mo) supply on manganese, zinc, copper, and iron concentrations in leaves of Mo-efficient ‘97003’ and Mo-inefficient ‘97014’ winter wheat cultivars under different N sources.
Treatments9700397014
Mn
(µg·g−1DW)
Zn
(µg·g−1DW)
Cu
(µg·g−1DW)
Fe
(µg g−1DW)
Mn
(µg·g−1DW)
Zn
(µg·g−1DW)
Cu
(µg·g−1DW)
Fe
(µg·g−1DW)
NO3−Mo72.78 ± 7.88 a26.51 ± 6.53 b7.83 ± 0.51 c84.19 ± 3.45 de69.28 ± 8.33 a30.34 ± 1.37 cd6.95 ± 0.53 c102.86 ± 22.01 bcd
+Mo62.88 ± 7.34 ab22.39 ± 2.88 b8.44 ± 1.25 c71.04 ± 9.50 e55.53 ± 3.78 ab20.97 ± 2.88 d7.96 ± 1.09 c76.83 ± 6.28 d
NH4NO3−Mo62.38 ± 10.05 ab32.23 ± 3.03 b9.89 ± 1.15 bc110.07 ± 20.12 bc60.64 ± 4.91 b34.18 ± 6.08 bc8.64 ± 0.84 c127.69 ± 15.12 bc
+Mo50.93 ± 5.45 bc26.53 ± 4.33 b11.29 ± 1.57 abc96.82 ± 9.24 cd51.48 ± 7.54 bc23.93 ± 1.89 cd10.35 ± 1.69 bc99.18 ± 10.25 cd
NH4+−Mo39.58 ± 3.60 cd52.35 ± 5.77 a15.14 ± 3.24 ab150.32 ± 11.47 a40.07 ± 4.31 cd54.63 ± 7.35 a14.58 ± 2.67 ab177.30 ± 21.16 a
+Mo31.10 ± 4.50 d44.50 ± 5.78 a15.67 ± 1.69 a131.83 ± 15.88 ab31.06 ± 5.04 d41.77 ± 6.30 b15.71 ± 1.87 a141.69 ± 13.79 ab
Note: −Mo and +Mo represent winter wheat cultivars fertilized, respectively, with 0 and 1 µM Mo [Na2MoO4.2H2O] against different N sources. Data represent means ± S.E from different independent treatments. Dissimilar superscripted letters (a, b, c, etc.) in each column indicate significant difference among different treatments at (p < 0.05). Mn, manganese; Zn, zinc; Cu, copper; and Fe, iron.
Table 4. The concentrations of salts (mM) used to prepare Hoagland nutrient solutions with dissimilar N sources NO3, NH4:NO3, and NH4+.
SaltsNO3 NH4:NO3 NH4+
Ca(NO3)2.4H2O5.003.750.00
KNO35.000.000.00
CaCl20.001.255.00
K2SO40.002.502.50
(NH4)2SO40.003.757.50
MgSO4.7H2O2.002.002.00
KH2PO41.001.001.00
Plastic pots (30 cm × 20 cm × 15 cm), containing four liters of respective solution and a perforated floating board on the surface of Hoagland solution with two rows for each cultivar, were used and each treatment was replicated four times. The pH was maintained at 6.5 ± 0.05 by the addition of HCl or NaOH to the nutrient solutions every day. The experimental pots were placed according to completely randomized design (CRD) with factorial arrangement.
Table 5. Sequences of primers used for qRT-PCR of NR, NiR, GS, and GOGAT genes.
GenesStrandPrimer Sequence 5′ to 3′Annealing Temperature (°C)
NRForwardCACCGGCCGCGGCAACTTC58
ReverseCGAGACGGAGATGCACCTGG
NiRForwardCGAGAAGAGGATGCCGAACG56
ReverseCACGCCGAGGTAGTCACG
GSForwardCACACCTCATCTCATCTCATCTC52
ReverseTTCACCGTCCTTGCTTTGC
GOGATForwardTCATCCAGCCGACCAACACG55
ReverseCCACAATCCATACAACGAGCAGAC
TaActinForwardACTGGGATGACATGGGGAA55
ReverseACCGCTGGCATACAAGGAC

