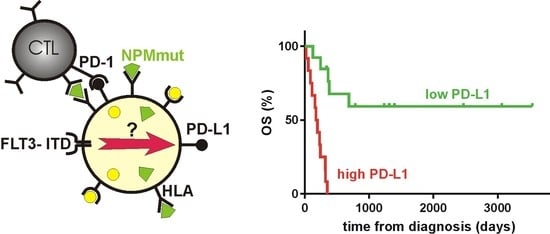
High PD-L1 Expression Predicts for Worse Outcome of Leukemia Patients with Concomitant NPM1 and FLT3 Mutations


Abstract
1. Introduction
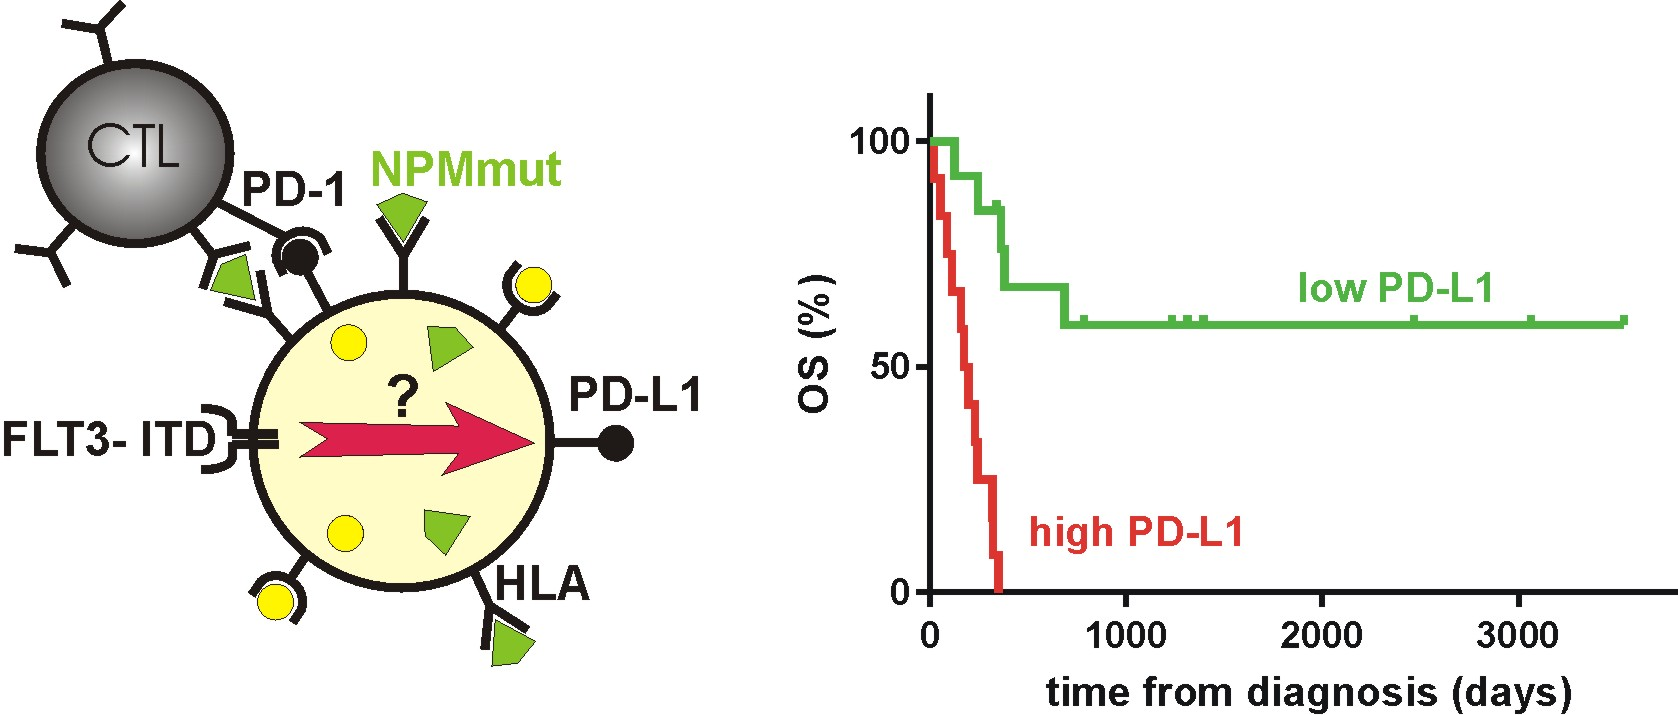
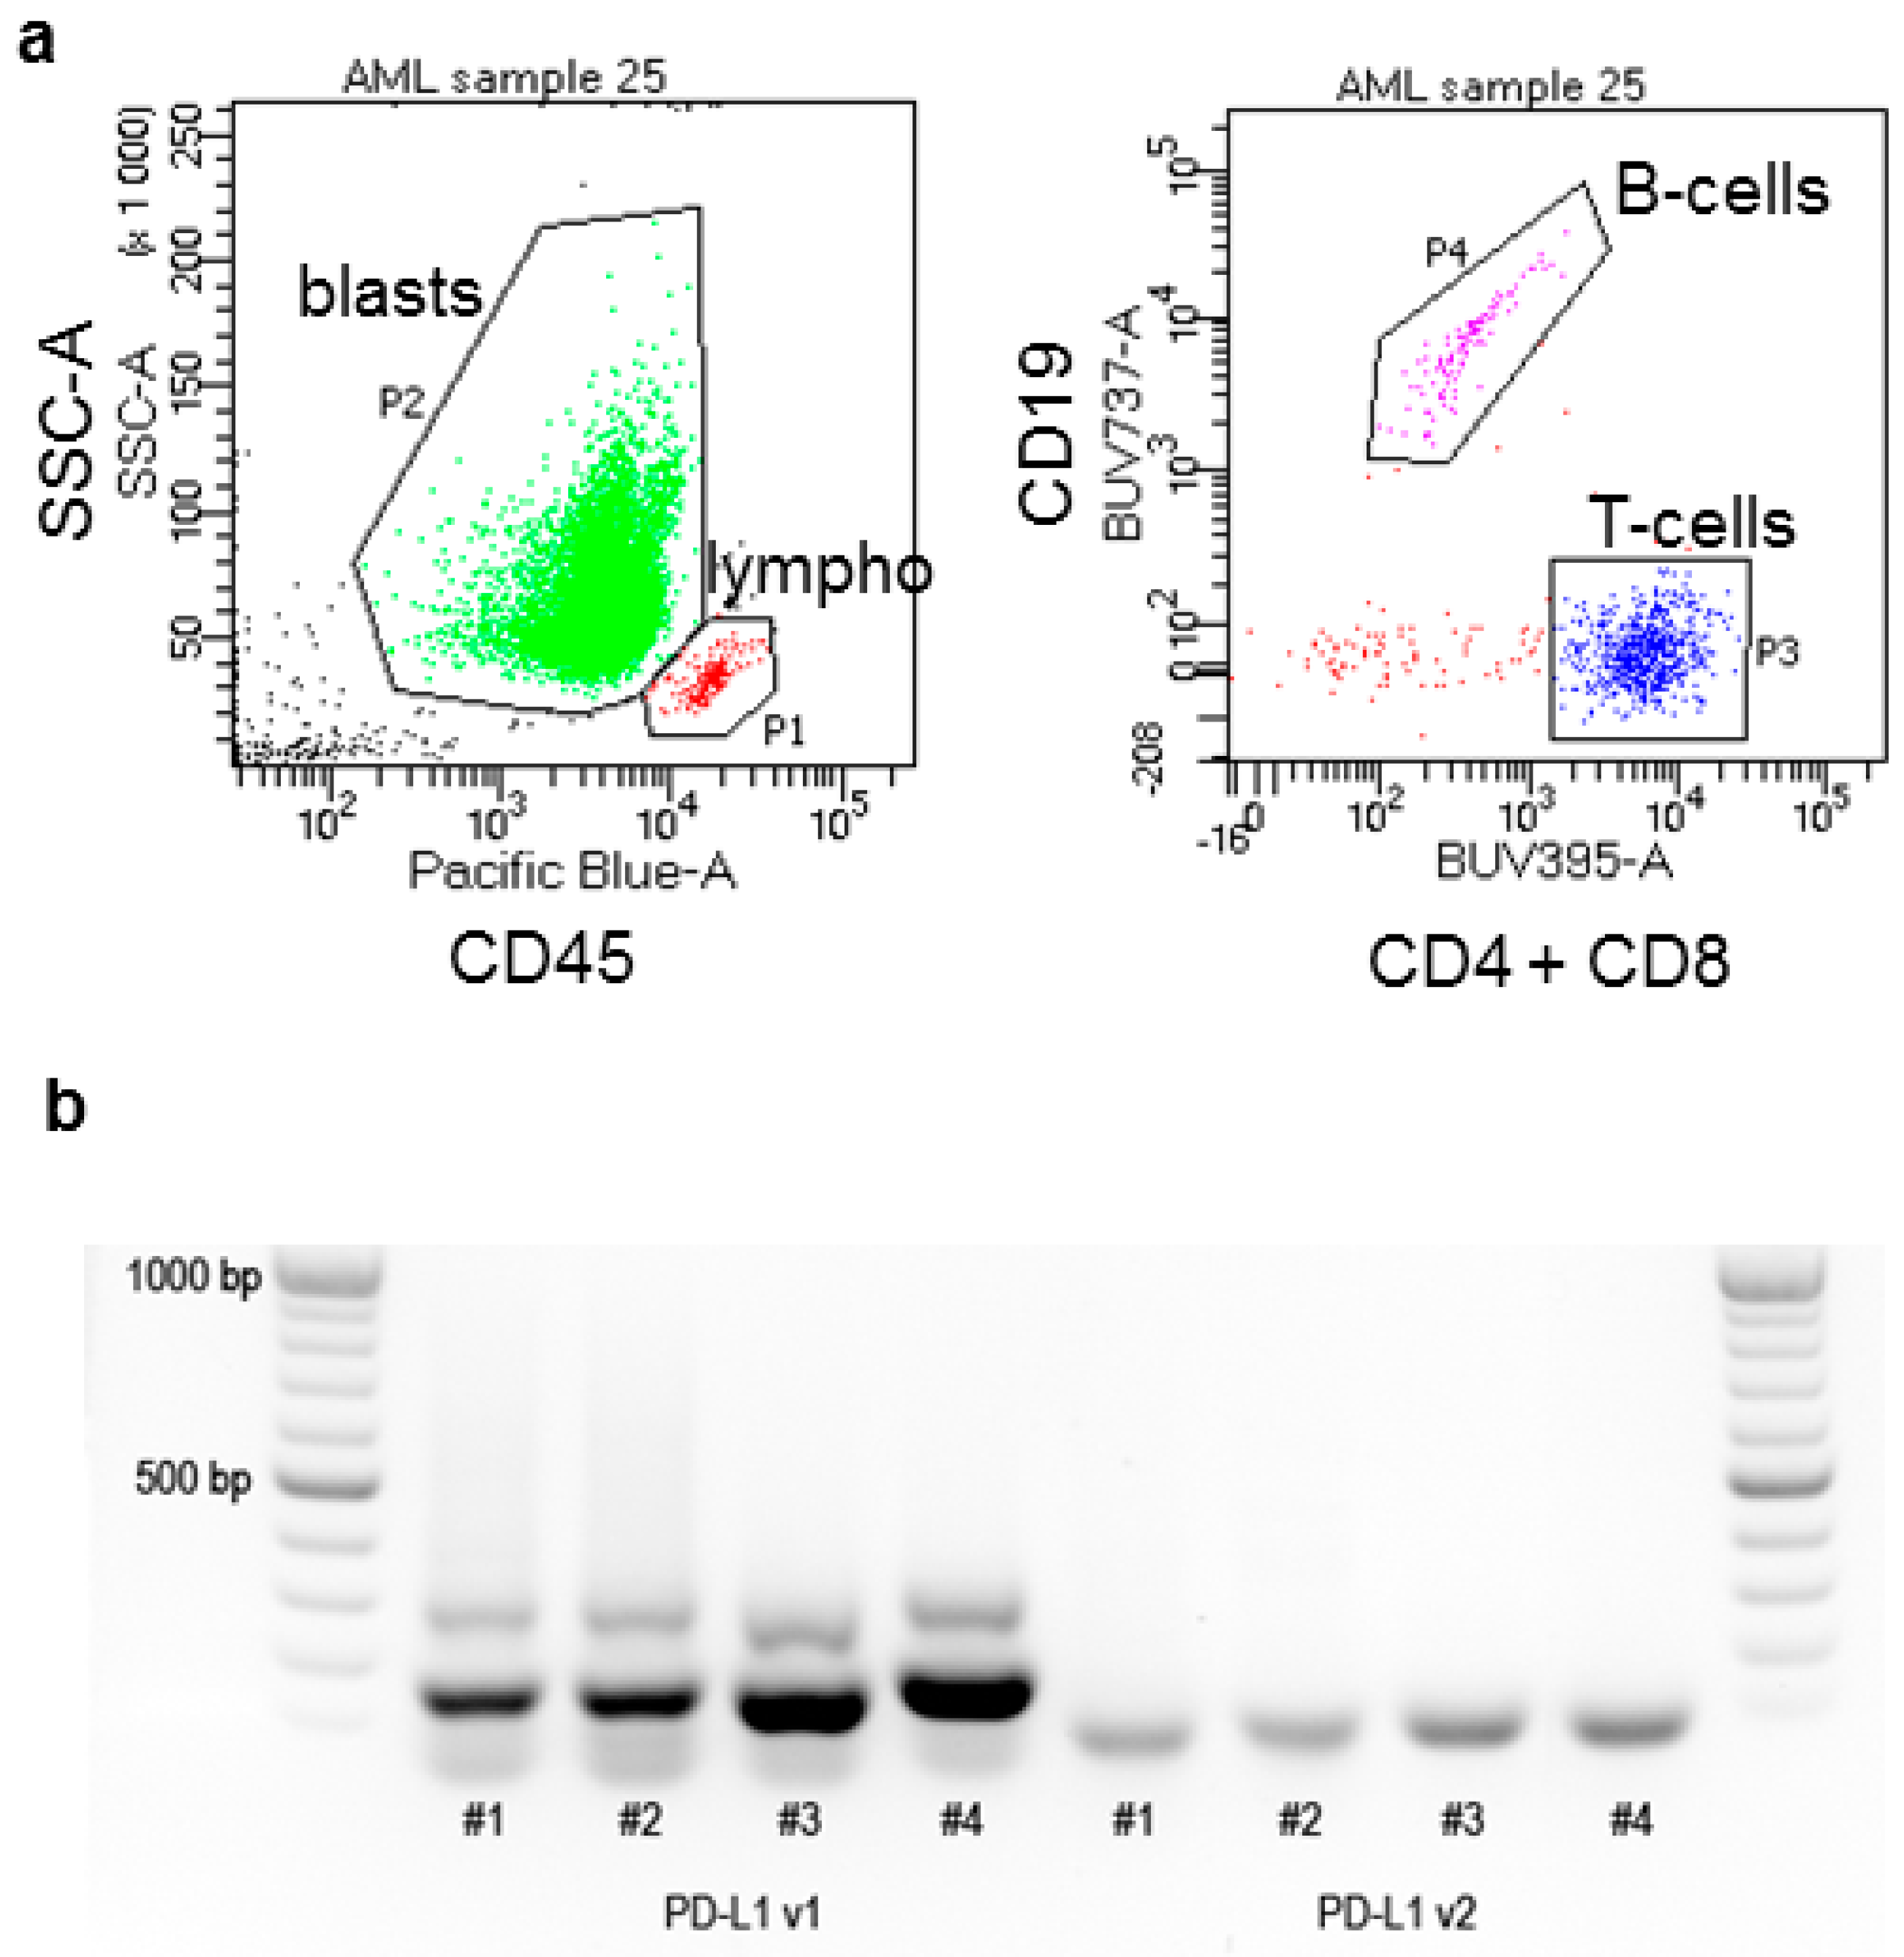
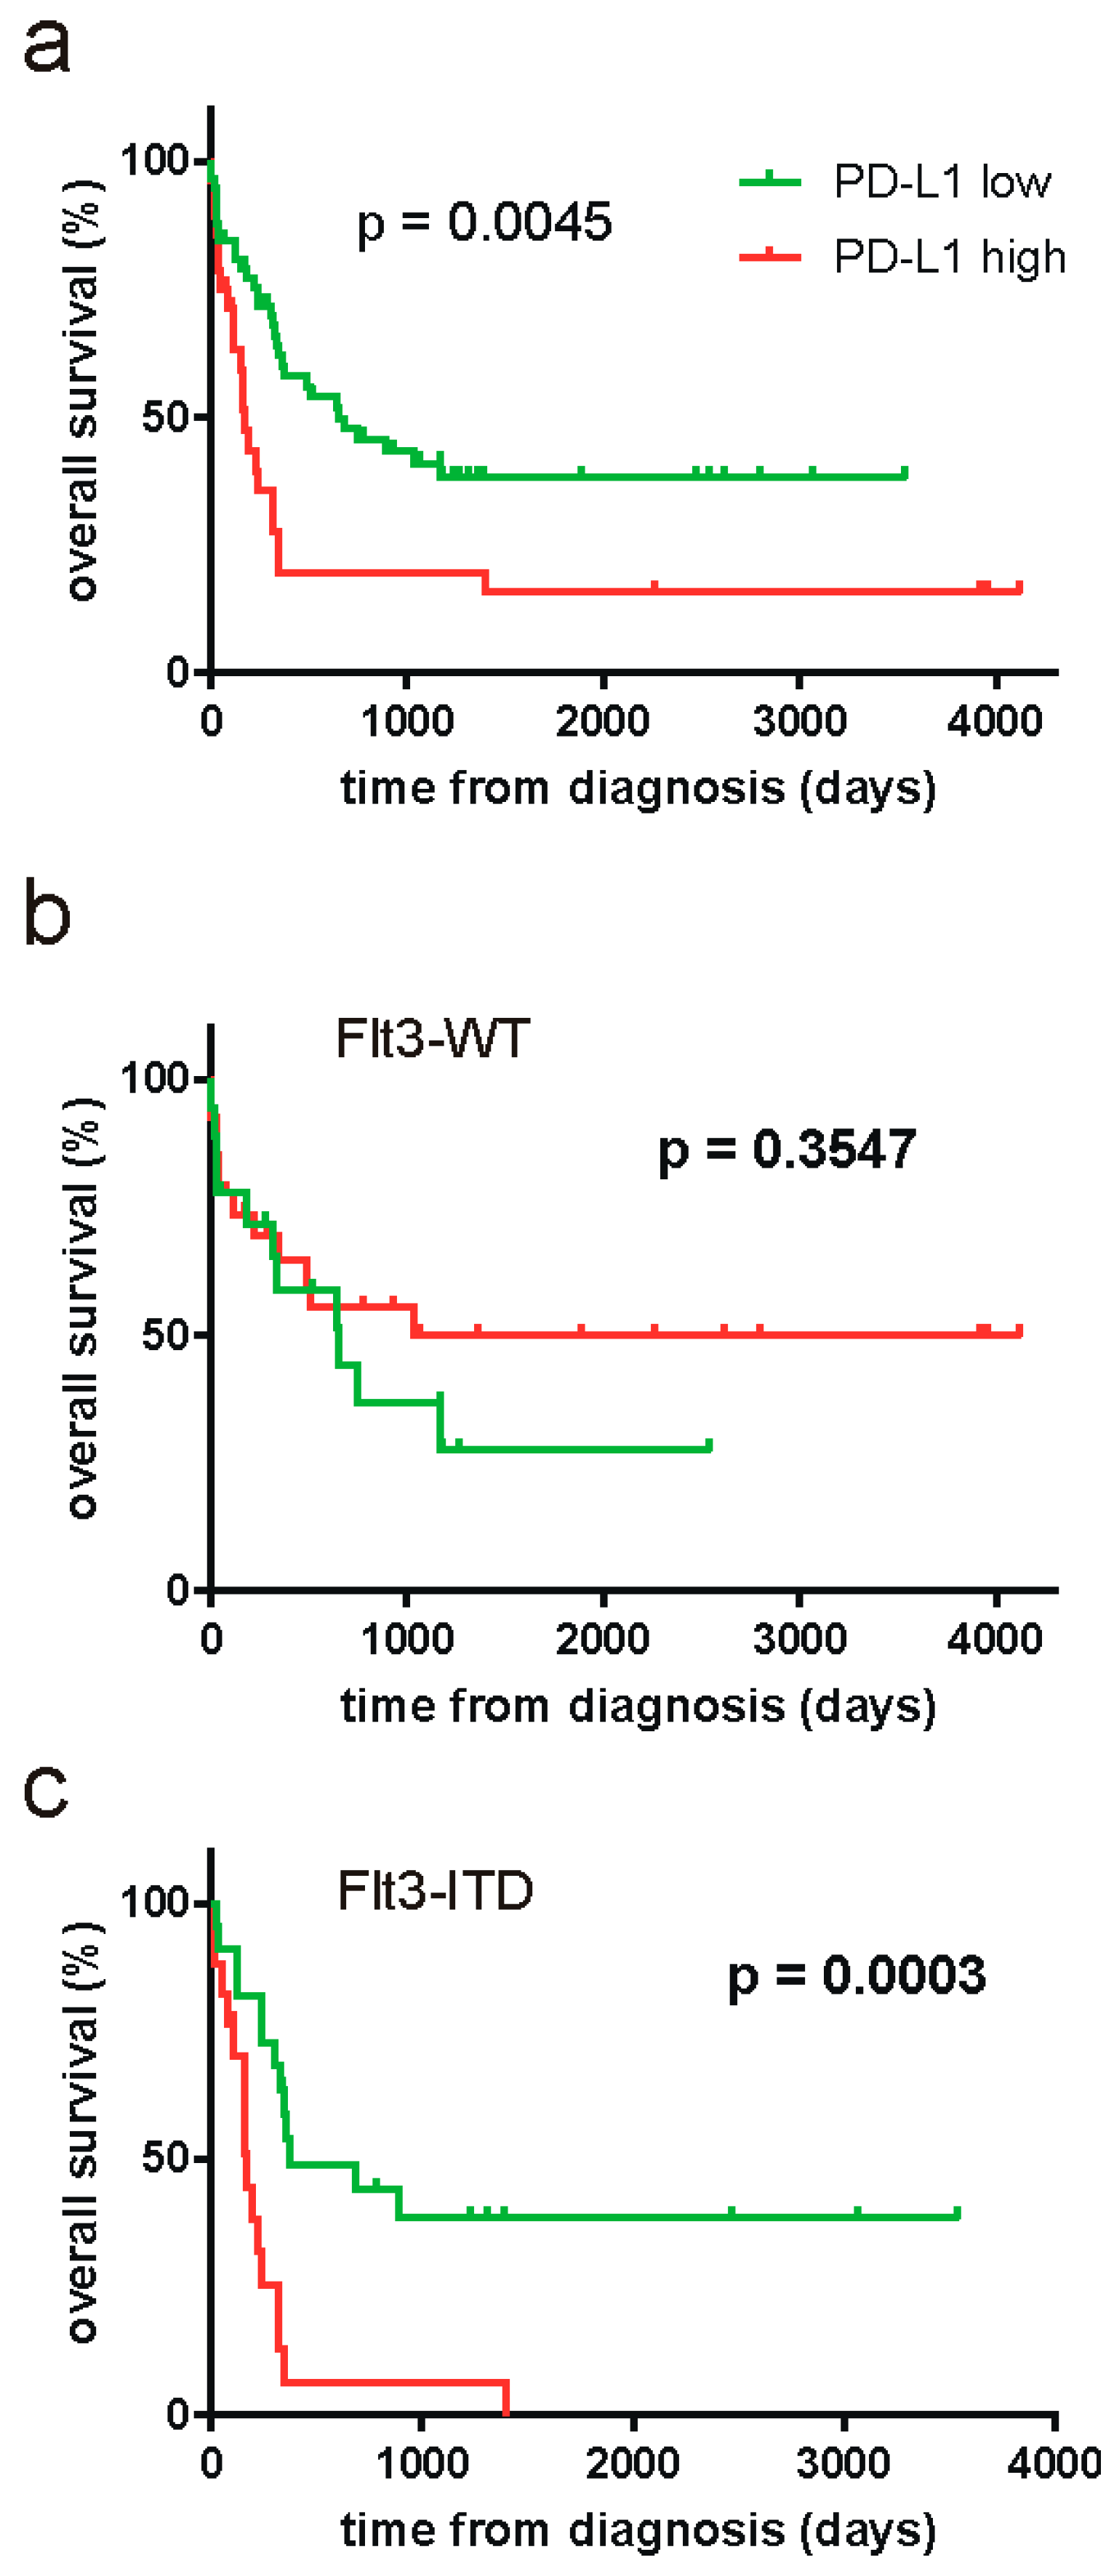
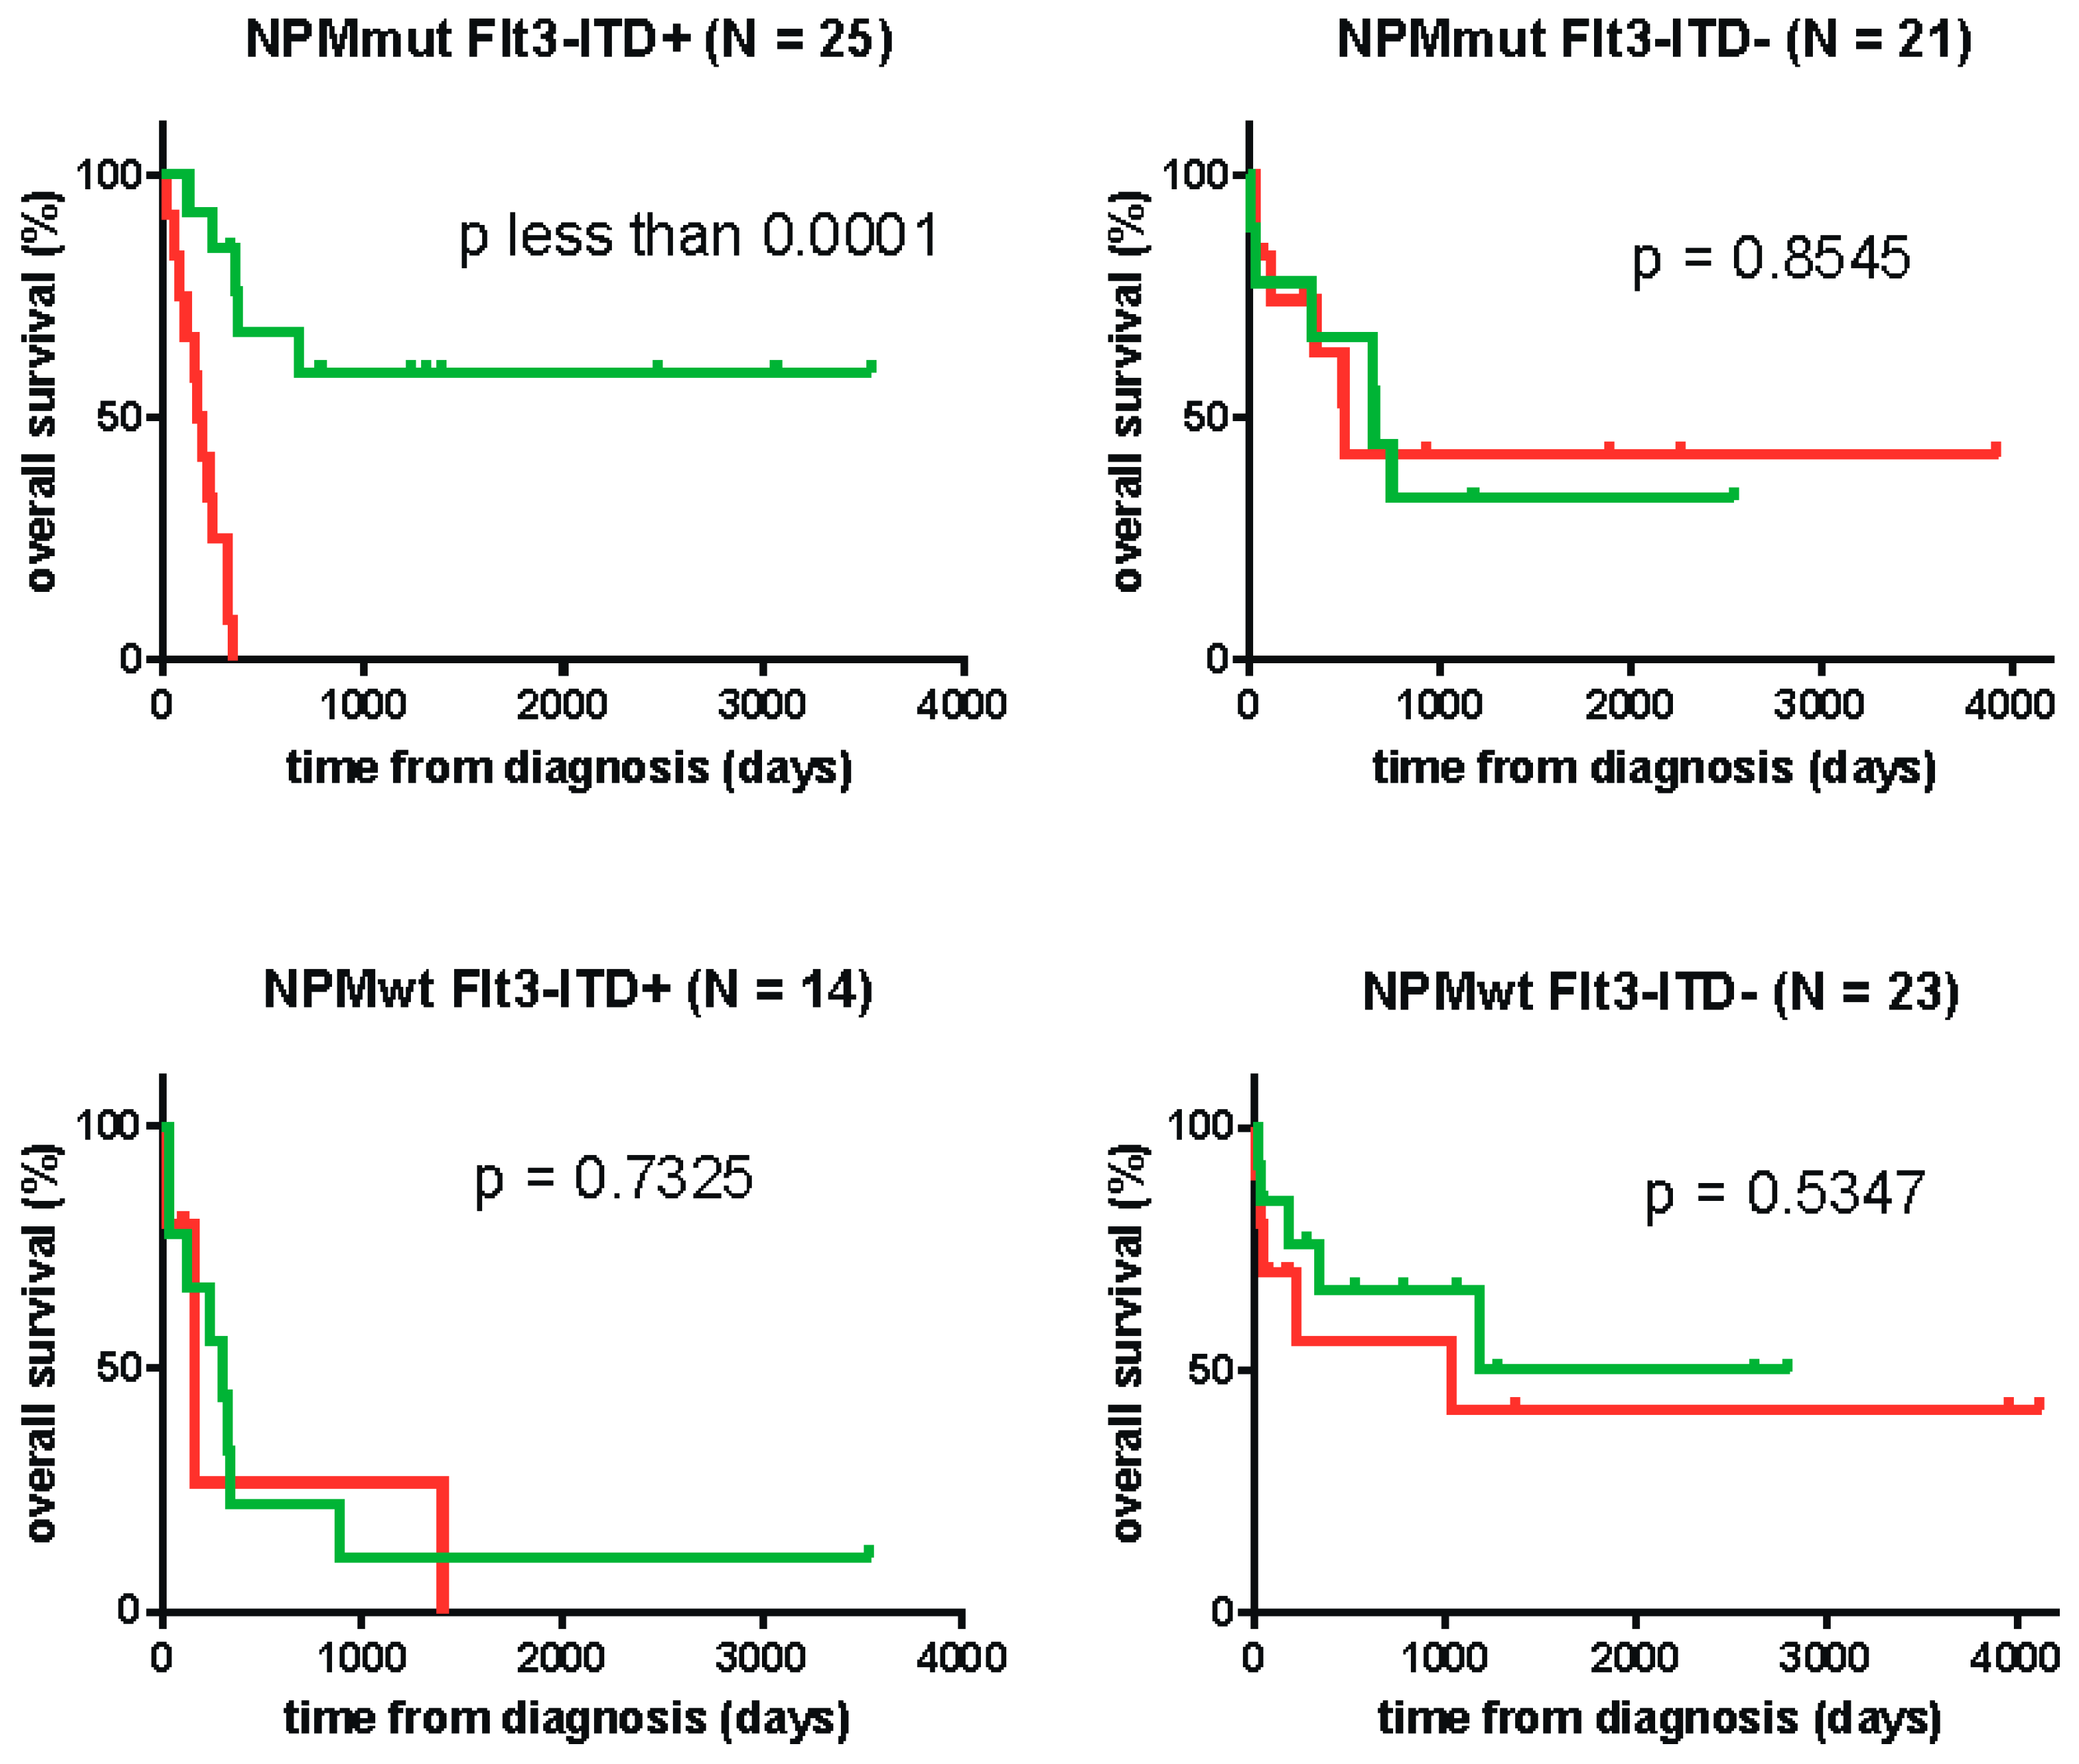
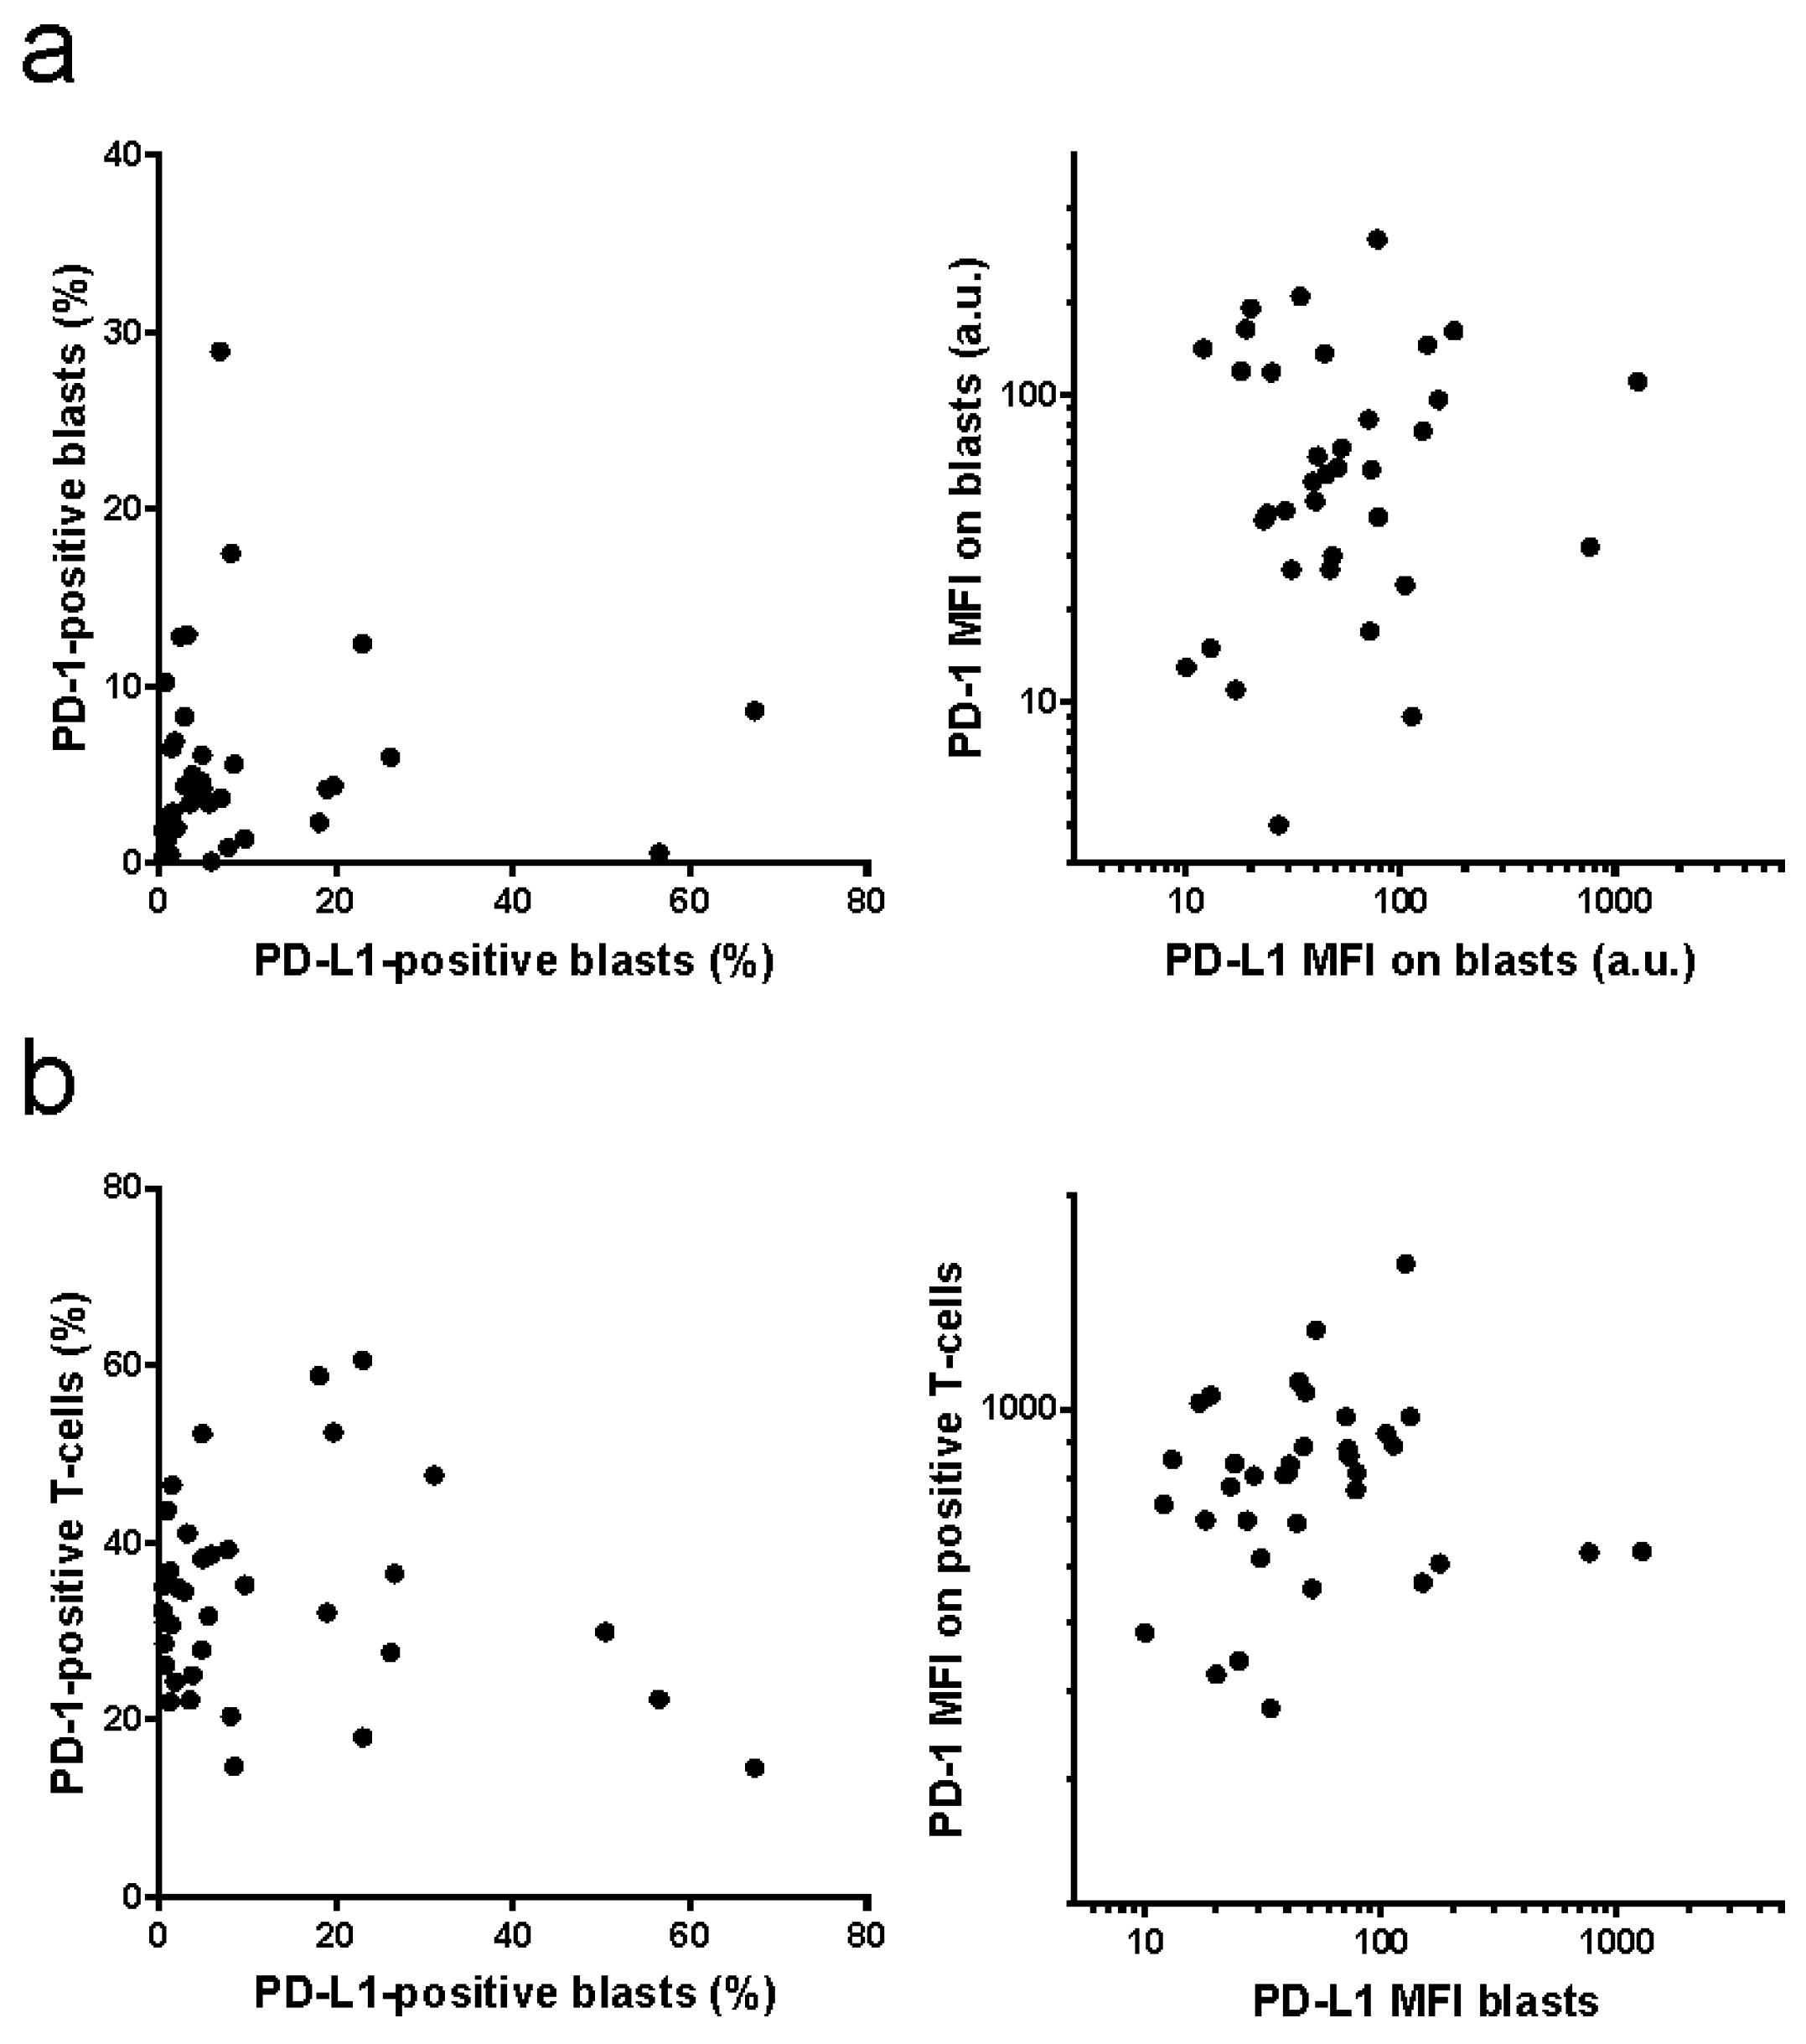
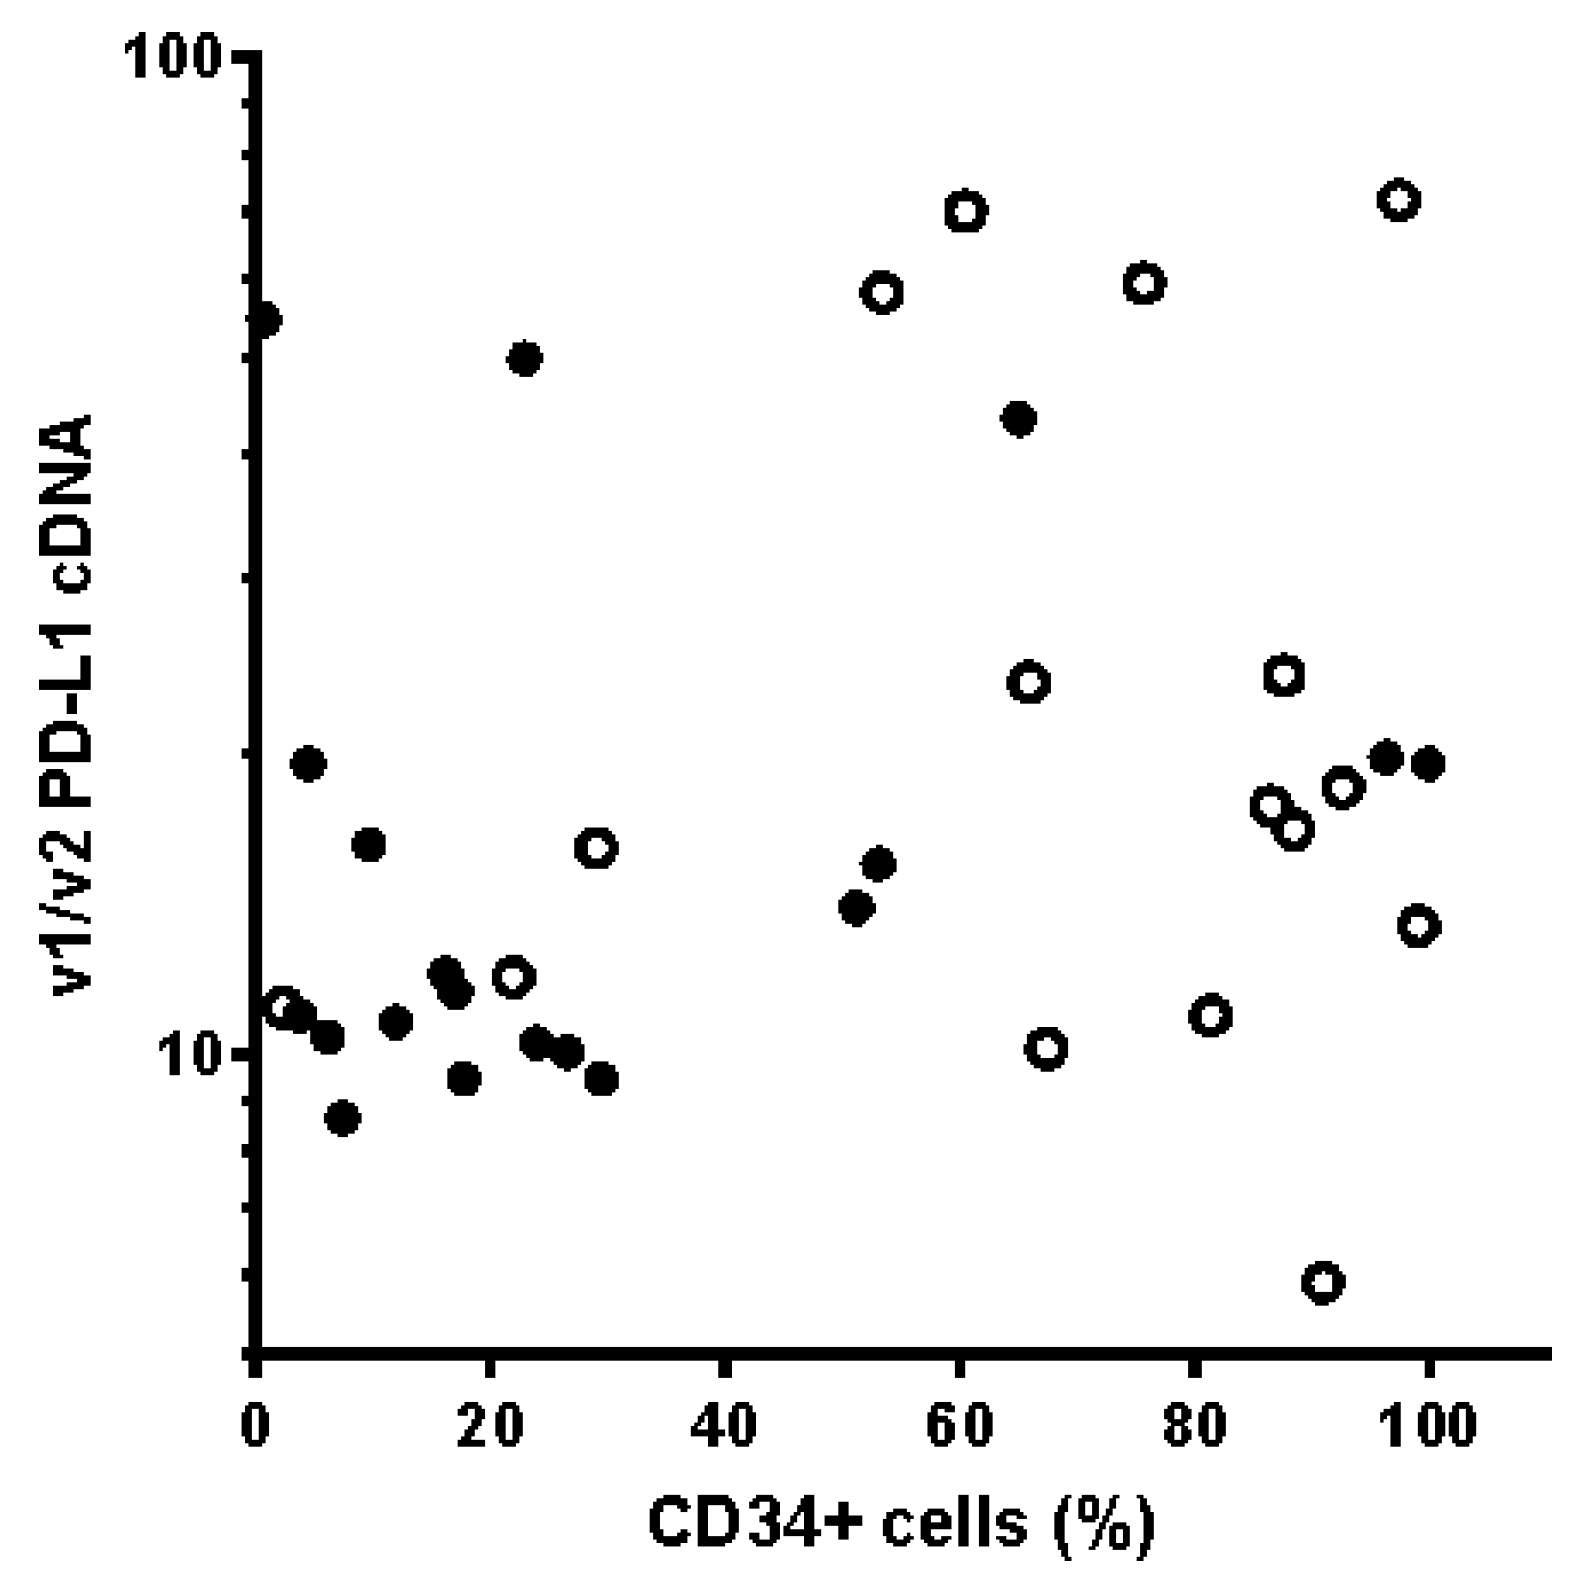
2. Results
3. Discussion
4. Materials and Methods
4.1. Material
4.2. Flow Cytometry
4.3. Real-Time Polymerase Chain Reaction
4.4. Statistical Analyses
5. Conclusions
Author Contributions
Funding
Acknowledgments
Conflicts of Interest
Abbreviations
| AML | acute myeloid leukemia |
| cHL | classical Hodgkin´s lymphoma |
| CMML | chronic myelomonocytic leukemia |
| DLBCL | diffuse large B-cell lymphoma |
| FLT3 | Fms-like tyrosine kinase 3 |
| FLT3-ITD | FLT3 with internal tandem duplications |
| HMAs | hypomethylating agents |
| IHC | immunohistochemistry |
| MDS | myelodysplastic syndrome |
| MFI | mean fluorescence intensity |
| MGUS | monoclonal gammopathy of undetermined significance |
| MM | multiple myeloma |
| NPM | nucleophosmin |
| PD-L1 | programmed death ligand-1 |
| SSC | side scatter |
| TILs | tumor-infiltrating lymphocytes |
References
- Carey, C.D.; Gusenleitner, D.; Lipschitz, M.; Roemer, M.G.M.; Stack, E.C.; Gjini, E.; Hu, X.; Redd, R.; Freeman, G.J.; Neuberg, D.; et al. Topological Analysis Reveals a PD-L1-Associated Microenvironmental Niche for Reed-Sternberg Cells in Hodgkin Lymphoma. Blood 2017, 130, 2420–2430. [Google Scholar] [CrossRef] [PubMed]
- Roemer, M.G.; Advani, R.H.; Ligon, A.H.; Natkunam, Y.; Redd, R.A.; Homer, H.; Connelly, C.F.; Sun, H.H.; Daadi, S.E.; Freeman, G.J.; et al. PD-L1 and PD-L2 Genetic Alterations Define Classical Hodgkin Lymphoma and Predict Outcome. J. Clin. Oncol. 2016, 34, 2690–2697. [Google Scholar] [CrossRef] [PubMed]
- Brockelmann, P.J.; Engert, A. Checkpoint Inhibition in Hodgkin Lymphoma - a Review. Oncol. Res. Treat. 2017, 40, 654–660. [Google Scholar] [CrossRef] [PubMed]
- Andorsky, D.J.; Yamada, R.E.; Said, J.; Pinkus, G.S.; Betting, D.J.; Timmerman, J.M. Programmed Death Ligand 1 is Expressed by Non-Hodgkin Lymphomas and Inhibits the Activity of Tumor-Associated T Cells. Clin. Cancer Res. 2011, 17, 4232–4244. [Google Scholar] [CrossRef]
- Li, Y.; Wang, J.; Li, C.; Ke, X.Y. Contribution of PD-L1 to Oncogenesis of Lymphoma and its RNAi-Based Targeting Therapy. Leuk. Lymphoma 2012, 53, 2015–2023. [Google Scholar] [CrossRef]
- Yousef, S.; Marvin, J.; Steinbach, M.; Langemo, A.; Kovacsovics, T.; Binder, M.; Kroger, N.; Luetkens, T.; Atanackovic, D. Immunomodulatory Molecule PD-L1 is Expressed on Malignant Plasma Cells and Myeloma-Propagating Pre-Plasma Cells in the Bone Marrow of Multiple Myeloma Patients. Blood Cancer. J. 2015, 5, e285. [Google Scholar] [CrossRef]
- Tamura, H.; Ishibashi, M.; Yamashita, T.; Tanosaki, S.; Okuyama, N.; Kondo, A.; Hyodo, H.; Shinya, E.; Takahashi, H.; Dong, H.; et al. Marrow Stromal Cells Induce B7-H1 Expression on Myeloma Cells, Generating Aggressive Characteristics in Multiple Myeloma. Leukemia 2013, 27, 464–472. [Google Scholar] [CrossRef]
- Oliva, S.; Troia, R.; D’Agostino, M.; Boccadoro, M.; Gay, F. Promises and Pitfalls in the use of PD-1/PD-L1 Inhibitors in Multiple Myeloma. Front. Immunol. 2018, 9, 2749. [Google Scholar] [CrossRef]
- Grzywnowicz, M.; Karczmarczyk, A.; Skorka, K.; Zajac, M.; Zaleska, J.; Chocholska, S.; Tomczak, W.; Giannopoulos, K. Expression of Programmed Death 1 Ligand in Different Compartments of Chronic Lymphocytic Leukemia. Acta Haematol. 2015, 134, 255–262. [Google Scholar] [CrossRef]
- Lewinsky, H.; Barak, A.F.; Huber, V.; Kramer, M.P.; Radomir, L.; Sever, L.; Orr, I.; Mirkin, V.; Dezorella, N.; Shapiro, M.; et al. CD84 Regulates PD-1/PD-L1 Expression and Function in Chronic Lymphocytic Leukemia. J. Clin. Invest. 2018, 128, 5465–5478. [Google Scholar] [CrossRef]
- Yang, H.; Bueso-Ramos, C.; DiNardo, C.; Estecio, M.R.; Davanlou, M.; Geng, Q.R.; Fang, Z.; Nguyen, M.; Pierce, S.; Wei, Y.; et al. Expression of PD-L1, PD-L2, PD-1 and CTLA4 in Myelodysplastic Syndromes is Enhanced by Treatment with Hypomethylating Agents. Leukemia 2014, 28, 1280–1288. [Google Scholar] [CrossRef] [PubMed]
- Wolff, F.; Leisch, M.; Greil, R.; Risch, A.; Pleyer, L. The Double-Edged Sword of (Re)Expression of Genes by Hypomethylating Agents: From Viral Mimicry to Exploitation as Priming Agents for Targeted Immune Checkpoint Modulation. Cell. Commun. Signal. 2017, 15, 13. [Google Scholar] [CrossRef] [PubMed]
- Daver, N.; Garcia-Manero, G.; Basu, S.; Boddu, P.C.; Alfayez, M.; Cortes, J.E.; Konopleva, M.; Ravandi-Kashani, F.; Jabbour, E.; Kadia, T.; et al. Efficacy, Safety, and Biomarkers of Response to Azacitidine and Nivolumab in Relapsed/Refractory Acute Myeloid Leukemia: A Nonrandomized, Open-Label, Phase II Study. Cancer. Discov. 2019, 9, 370–383. [Google Scholar] [CrossRef] [PubMed]
- Assi, R.; Kantarjian, H.; Ravandi, F.; Daver, N. Immune Therapies in Acute Myeloid Leukemia: A Focus on Monoclonal Antibodies and Immune Checkpoint Inhibitors. Curr. Opin. Hematol. 2018, 25, 136–145. [Google Scholar] [CrossRef] [PubMed]
- Berthon, C.; Driss, V.; Liu, J.; Kuranda, K.; Leleu, X.; Jouy, N.; Hetuin, D.; Quesnel, B. In Acute Myeloid Leukemia, B7-H1 (PD-L1) Protection of Blasts from Cytotoxic T Cells is Induced by TLR Ligands and Interferon-Gamma and can be Reversed using MEK Inhibitors. Cancer Immunol. Immunother. 2010, 59, 1839–1849. [Google Scholar] [CrossRef]
- Greiner, J.; Hofmann, S.; Schmitt, M.; Gotz, M.; Wiesneth, M.; Schrezenmeier, H.; Bunjes, D.; Dohner, H.; Bullinger, L. Acute Myeloid Leukemia with Mutated Nucleophosmin 1: An Immunogenic Acute Myeloid Leukemia Subtype and Potential Candidate for Immune Checkpoint Inhibition. Haematologica 2017, 102, e499–e501. [Google Scholar] [CrossRef] [PubMed]
- Cassady, K.; Martin, P.J.; Zeng, D. Regulation of GVHD and GVL Activity Via PD-L1 Interaction with PD-1 and CD80. Front. Immunol. 2018, 9, 3061. [Google Scholar] [CrossRef]
- Saha, A.; Aoyama, K.; Taylor, P.A.; Koehn, B.H.; Veenstra, R.G.; Panoskaltsis-Mortari, A.; Munn, D.H.; Murphy, W.J.; Azuma, M.; Yagita, H.; et al. Host Programmed Death Ligand 1 is Dominant Over Programmed Death Ligand 2 Expression in Regulating Graft-Versus-Host Disease Lethality. Blood 2013, 122, 3062–3073. [Google Scholar] [CrossRef]
- Brody, R.; Zhang, Y.; Ballas, M.; Siddiqui, M.K.; Gupta, P.; Barker, C.; Midha, A.; Walker, J. PD-L1 Expression in Advanced NSCLC: Insights into Risk Stratification and Treatment Selection from a Systematic Literature Review. Lung Cancer 2017, 112, 200–215. [Google Scholar] [CrossRef]
- Reck, M.; Rodriguez-Abreu, D.; Robinson, A.G.; Hui, R.; Csoszi, T.; Fulop, A.; Gottfried, M.; Peled, N.; Tafreshi, A.; Cuffe, S.; et al. Pembrolizumab Versus Chemotherapy for PD-L1-Positive Non-Small-Cell Lung Cancer. N. Engl. J. Med. 2016, 375, 1823–1833. [Google Scholar] [CrossRef]
- Lee, K.S.; Kim, B.H.; Oh, H.K.; Kim, D.W.; Kang, S.B.; Kim, H.; Shin, E. Programmed Cell Death Ligand-1 Protein Expression and CD274/PD-L1 Gene Amplification in Colorectal Cancer: Implications for Prognosis. Cancer. Sci. 2018, 109, 2957–2969. [Google Scholar] [CrossRef] [PubMed]
- Bruggemann, C.; Kirchberger, M.C.; Goldinger, S.M.; Weide, B.; Konrad, A.; Erdmann, M.; Schadendorf, D.; Croner, R.S.; Krahenbuhl, L.; Kahler, K.C.; et al. Predictive Value of PD-L1 Based on mRNA Level in the Treatment of Stage IV Melanoma with Ipilimumab. J. Cancer Res. Clin. Oncol. 2017, 143, 1977–1984. [Google Scholar] [CrossRef] [PubMed]
- Sasaki, H.; Suzuki, A.; Shitara, M.; Hikosaka, Y.; Okuda, K.; Moriyama, S.; Yano, M.; Fujii, Y. PD-L1 Gene Expression in Japanese Lung Cancer Patients. Biomed. Rep. 2013, 1, 93–96. [Google Scholar] [CrossRef] [PubMed]
- Shen, J.K.; Cote, G.M.; Choy, E.; Yang, P.; Harmon, D.; Schwab, J.; Nielsen, G.P.; Chebib, I.; Ferrone, S.; Wang, X.; et al. Programmed Cell Death Ligand 1 Expression in Osteosarcoma. Cancer. Immunol. Res. 2014, 2, 690–698. [Google Scholar] [CrossRef] [PubMed]
- Hassan, S.S.; Akram, M.; King, E.C.; Dockrell, H.M.; Cliff, J.M. PD-1, PD-L1 and PD-L2 Gene Expression on T-Cells and Natural Killer Cells Declines in Conjunction with a Reduction in PD-1 Protein during the Intensive Phase of Tuberculosis Treatment. PLoS ONE 2015, 10, e0137646. [Google Scholar] [CrossRef] [PubMed]
- Ikeda, S.; Okamoto, T.; Okano, S.; Umemoto, Y.; Tagawa, T.; Morodomi, Y.; Kohno, M.; Shimamatsu, S.; Kitahara, H.; Suzuki, Y.; et al. PD-L1 is Upregulated by Simultaneous Amplification of the PD-L1 and JAK2 Genes in Non-Small Cell Lung Cancer. J. Thorac. Oncol. 2016, 11, 62–71. [Google Scholar] [CrossRef] [PubMed]
- Vassilakopoulou, M.; Avgeris, M.; Velcheti, V.; Kotoula, V.; Rampias, T.; Chatzopoulos, K.; Perisanidis, C.; Kontos, C.K.; Giotakis, A.I.; Scorilas, A.; et al. Evaluation of PD-L1 Expression and Associated Tumor-Infiltrating Lymphocytes in Laryngeal Squamous Cell Carcinoma. Clin. Cancer Res. 2016, 22, 704–713. [Google Scholar] [CrossRef]
- Koirala, P.; Roth, M.E.; Gill, J.; Piperdi, S.; Chinai, J.M.; Geller, D.S.; Hoang, B.H.; Park, A.; Fremed, M.A.; Zang, X.; et al. Immune Infiltration and PD-L1 Expression in the Tumor Microenvironment are Prognostic in Osteosarcoma. Sci. Rep. 2016, 6, 30093. [Google Scholar] [CrossRef]
- Kosemehmetoglu, K.; Ozogul, E.; Babaoglu, B.; Tezel, G.G.; Gedikoglu, G. Programmed Death Ligand 1 (PD-L1) Expression in Malignant Mesenchymal Tumors. Turk. Patoloji Derg. 2017, 1, 192–197. [Google Scholar] [CrossRef]
- Weber, M.; Wehrhan, F.; Baran, C.; Agaimy, A.; Buttner-Herold, M.; Preidl, R.; Neukam, F.W.; Ries, J. PD-L1 Expression in Tumor Tissue and Peripheral Blood of Patients with Oral Squamous Cell Carcinoma. Oncotarget 2017, 8, 112584–112597. [Google Scholar] [CrossRef]
- Gasser, M.; Koenigshausen, M.; Grimm, M.; Stein, C.; Grimmig, T.; Wagner, M.; Eung, M.; Rehder, R.; Nichiporuk Stumpf, E.; Moench, R.; et al. Clinical Significance and Therapeutic Potential of the Programmed Death Ligand-1 (PD-L1) and PD-L2 Expression in Human Colorectal Cancer. Cancer Sci. Ther. 2017, 9, 566–573. [Google Scholar] [CrossRef]
- Isobe, K.; Kakimoto, A.; Mikami, T.; Kaburaki, K.; Kobayashi, H.; Yoshizawa, T.; Nakano, Y.; Makino, T.; Otsuka, H.; Sano, G.; et al. PD-L1 mRNA Expression in EGFR-Mutant Lung Adenocarcinoma. Oncol. Rep. 2018, 40, 331–338. [Google Scholar] [CrossRef] [PubMed]
- Amatatsu, M.; Arigami, T.; Uenosono, Y.; Yanagita, S.; Uchikado, Y.; Kijima, Y.; Kurahara, H.; Kita, Y.; Mori, S.; Sasaki, K.; et al. Programmed Death-Ligand 1 is a Promising Blood Marker for Predicting Tumor Progression and Prognosis in Patients with Gastric Cancer. Cancer. Sci. 2018, 109, 814–820. [Google Scholar] [CrossRef] [PubMed]
- Tsimafeyeu, I.; Imyanitov, E.N.; Zavalishina, L.; Raskin, G.; Povilaitite, P.; Savelov, N.; Kharitonova, E.; Rumyantsev, A.; Pugach, I.; Andreeva, Y.; et al. Final Results of the Concordance Analysis of PD-L1 Immunohistochemistry (IHC) Assays and Polymerase Chain Reaction (PCR) in Non-Small Lung Cancer. Ann. Oncol. 2018, 29, viii493. [Google Scholar] [CrossRef]
- Pawelczyk, K.; Piotrowska, A.; Ciesielska, U.; Jablonska, K.; Gletzel-Plucinska, N.; Grzegrzolka, J.; Podhorska-Okolow, M.; Dziegiel, P.; Nowinska, K. Role of PD-L1 Expression in Non-Small Cell Lung Cancer and their Prognostic Significance According to Clinicopathological Factors and Diagnostic Markers. Int. J. Mol. Sci. 2019, 20, 824. [Google Scholar] [CrossRef]
- Yang, K.; Xu, J.; Liu, Q.; Li, J.; Xi, Y. Expression and Significance of CD47, PD1 and PDL1 in T-Cell Acute Lymphoblastic lymphoma/leukemia. Pathol. Res. Pract. 2019, 215, 265–271. [Google Scholar] [CrossRef] [PubMed]
- Brodska, B.; Otevrelova, P.; Kuzelova, K. Correlation of PD-L1 Surface Expression on Leukemia Cells with the Ratio of PD-L1 mRNA Variants and with Electrophoretic Mobility. Cancer. Immunol. Res. 2016, 4, 815–819. [Google Scholar] [CrossRef]
- Budczies, J.; Klauschen, F.; Sinn, B.V.; Gyorffy, B.; Schmitt, W.D.; Darb-Esfahani, S.; Denkert, C. Cutoff Finder: A Comprehensive and Straightforward Web Application Enabling Rapid Biomarker Cutoff Optimization. PLoS ONE 2012, 7, e51862. [Google Scholar] [CrossRef] [PubMed]
- Brodská, B.; Šašinková, M.; Kuželová, K. Nucleophosmin in Leukemia: Consequences of Anchor Loss. Int. J. Biochem. Cell Biol. 2019, 111, 52–62. [Google Scholar] [CrossRef]
- Vogel, C.; Marcotte, E.M. Insights into the Regulation of Protein Abundance from Proteomic and Transcriptomic Analyses. Nat. Rev. Genet. 2012, 13, 227–232. [Google Scholar] [CrossRef]
- Li, C.W.; Lim, S.O.; Xia, W.; Lee, H.H.; Chan, L.C.; Kuo, C.W.; Khoo, K.H.; Chang, S.S.; Cha, J.H.; Kim, T.; et al. Glycosylation and Stabilization of Programmed Death Ligand-1 Suppresses T-Cell Activity. Nat. Commun. 2016, 7, 12632. [Google Scholar] [CrossRef] [PubMed]
- Yao, H.; Lan, J.; Li, C.; Shi, H.; Brosseau, J.P.; Wang, H.; Lu, H.; Fang, C.; Zhang, Y.; Liang, L.; et al. Inhibiting PD-L1 Palmitoylation Enhances T-Cell Immune Responses Against Tumours. Nat. Biomed. Eng. 2019, 3, 306–317. [Google Scholar] [CrossRef] [PubMed]
- Burr, M.L.; Sparbier, C.E.; Chan, Y.C.; Williamson, J.C.; Woods, K.; Beavis, P.A.; Lam, E.Y.N.; Henderson, M.A.; Bell, C.C.; Stolzenburg, S.; et al. CMTM6 Maintains the Expression of PD-L1 and Regulates Anti-Tumour Immunity. Nature 2017, 549, 101–105. [Google Scholar] [CrossRef] [PubMed]
- Lin, D.Y.; Tanaka, Y.; Iwasaki, M.; Gittis, A.G.; Su, H.P.; Mikami, B.; Okazaki, T.; Honjo, T.; Minato, N.; Garboczi, D.N. The PD-1/PD-L1 Complex Resembles the Antigen-Binding Fv Domains of Antibodies and T Cell Receptors. Proc. Natl. Acad. Sci. USA 2008, 105, 3011–3016. [Google Scholar] [CrossRef] [PubMed]
- He, X.H.; Xu, L.H.; Liu, Y. Identification of a Novel Splice Variant of Human PD-L1 mRNA Encoding an Isoform-Lacking Igv-Like Domain. Acta Pharmacol. Sin. 2005, 26, 462–468. [Google Scholar] [CrossRef] [PubMed]
- Garcia-Diaz, A.; Shin, D.S.; Moreno, B.H.; Saco, J.; Escuin-Ordinas, H.; Rodriguez, G.A.; Zaretsky, J.M.; Sun, L.; Hugo, W.; Wang, X.; et al. Interferon Receptor Signaling Pathways Regulating PD-L1 and PD-L2 Expression. Cell. Rep. 2017, 19, 1189–1201. [Google Scholar] [CrossRef] [PubMed]
- Gowrishankar, K.; Gunatilake, D.; Gallagher, S.J.; Tiffen, J.; Rizos, H.; Hersey, P. Inducible but Not Constitutive Expression of PD-L1 in Human Melanoma Cells is Dependent on Activation of NF-kappaB. PLoS ONE 2015, 10, e0123410. [Google Scholar] [CrossRef]
- Prestipino, A.; Zeiser, R. Clinical Implications of Tumor-Intrinsic Mechanisms Regulating PD-L1. Sci. Transl. Med. 2019, 11, eaav4810. [Google Scholar] [CrossRef]
- Noman, M.Z.; Desantis, G.; Janji, B.; Hasmim, M.; Karray, S.; Dessen, P.; Bronte, V.; Chouaib, S. PD-L1 is a Novel Direct Target of HIF-1alpha, and its Blockade Under Hypoxia Enhanced MDSC-Mediated T Cell Activation. J. Exp. Med. 2014, 211, 781–790. [Google Scholar] [CrossRef]
- Ruf, M.; Moch, H.; Schraml, P. PD-L1 Expression is Regulated by Hypoxia Inducible Factor in Clear Cell Renal Cell Carcinoma. Int. J. Cancer 2016, 139, 396–403. [Google Scholar] [CrossRef]
- Chen, J.; Jiang, C.C.; Jin, L.; Zhang, X.D. Regulation of PD-L1: A Novel Role of Pro-Survival Signalling in Cancer. Ann. Oncol. 2016, 27, 409–416. [Google Scholar] [CrossRef] [PubMed]
- Dong, P.; Xiong, Y.; Yue, J.; Hanley, S.J.B.; Watari, H. Tumor-Intrinsic PD-L1 Signaling in Cancer Initiation, Development and Treatment: Beyond Immune Evasion. Front. Oncol. 2018, 8, 386. [Google Scholar] [CrossRef] [PubMed]
- Marzec, M.; Zhang, Q.; Goradia, A.; Raghunath, P.N.; Liu, X.; Paessler, M.; Wang, H.Y.; Wysocka, M.; Cheng, M.; Ruggeri, B.A.; et al. Oncogenic Kinase NPM/ALK Induces through STAT3 Expression of Immunosuppressive Protein CD274 (PD-L1, B7-H1). Proc. Natl. Acad. Sci. USA 2008, 105, 20852–20857. [Google Scholar] [CrossRef] [PubMed]
- Ota, K.; Azuma, K.; Kawahara, A.; Hattori, S.; Iwama, E.; Tanizaki, J.; Harada, T.; Matsumoto, K.; Takayama, K.; Takamori, S.; et al. Induction of PD-L1 Expression by the EML4-ALK Oncoprotein and Downstream Signaling Pathways in Non-Small Cell Lung Cancer. Clin. Cancer Res. 2015, 21, 4014–4021. [Google Scholar] [CrossRef] [PubMed]
- Grafone, T.; Palmisano, M.; Nicci, C.; Storti, S. An Overview on the Role of FLT3-Tyrosine Kinase Receptor in Acute Myeloid Leukemia: Biology and Treatment. Oncol. Rev. 2012, 6, e8. [Google Scholar] [CrossRef] [PubMed]
- Roolf, C.; Dybowski, N.; Sekora, A.; Mueller, S.; Knuebel, G.; Tebbe, A.; Murua Escobar, H.; Godl, K.; Junghanss, C.; Schaab, C. Phosphoproteome Analysis Reveals Differential Mode of Action of Sorafenib in Wildtype and Mutated FLT3 Acute Myeloid Leukemia (AML) Cells. Mol. Cell. Proteom. 2017, 16, 1365–1376. [Google Scholar] [CrossRef] [PubMed]
- Prestipino, A.; Emhardt, A.J.; Aumann, K.; O’Sullivan, D.; Gorantla, S.P.; Duquesne, S.; Melchinger, W.; Braun, L.; Vuckovic, S.; Boerries, M.; et al. Oncogenic JAK2(V617F) Causes PD-L1 Expression, Mediating Immune Escape in Myeloproliferative Neoplasms. Sci. Transl. Med. 2018, 10, eaam7729. [Google Scholar] [CrossRef] [PubMed]
- Fujita, J.; Mizuki, M.; Otsuka, M.; Ezoe, S.; Tanaka, H.; Satoh, Y.; Fukushima, K.; Tokunaga, M.; Matsumura, I.; Kanakura, Y. Myeloid Neoplasm-Related Gene Abnormalities Differentially Affect Dendritic Cell Differentiation from Murine Hematopoietic stem/progenitor Cells. Immunol. Lett. 2011, 136, 61–73. [Google Scholar] [CrossRef] [PubMed]
- Escors, D.; Gato-Canas, M.; Zuazo, M.; Arasanz, H.; Garcia-Granda, M.J.; Vera, R.; Kochan, G. The Intracellular Signalosome of PD-L1 in Cancer Cells. Signal. Transduct Target Ther. 2018, 3, 26. [Google Scholar] [CrossRef]
- Kuzelova, K.; Brodska, B.; Fuchs, O.; Dobrovolna, M.; Soukup, P.; Cetkovsky, P. Altered HLA Class I Profile Associated with Type A/D Nucleophosmin Mutation Points to Possible Anti-Nucleophosmin Immune Response in Acute Myeloid Leukemia. PLoS ONE 2015, 10, e0127637. [Google Scholar] [CrossRef] [PubMed]
- Kuzelova, K.; Brodska, B.; Schetelig, J.; Rollig, C.; Racil, Z.; Walz, J.S.; Helbig, G.; Fuchs, O.; Vrana, M.; Pecherkova, P.; et al. Association of HLA Class I Type with Prevalence and Outcome of Patients with Acute Myeloid Leukemia and Mutated Nucleophosmin. PLoS ONE 2018, 13, e0204290. [Google Scholar] [CrossRef] [PubMed]
- Greiner, J.; Ono, Y.; Hofmann, S.; Schmitt, A.; Mehring, E.; Gotz, M.; Guillaume, P.; Dohner, K.; Mytilineos, J.; Dohner, H.; et al. Mutated Regions of Nucleophosmin 1 Elicit both CD4(+) and CD8(+) T-Cell Responses in Patients with Acute Myeloid Leukemia. Blood 2012, 120, 1282–1289. [Google Scholar] [CrossRef] [PubMed]
- Greiner, J.; Schneider, V.; Schmitt, M.; Gotz, M.; Dohner, K.; Wiesneth, M.; Dohner, H.; Hofmann, S. Immune Responses Against the Mutated Region of Cytoplasmatic NPM1 might Contribute to the Favorable Clinical Outcome of AML Patients with NPM1 Mutations (NPM1mut). Blood 2013, 122, 1087–1088. [Google Scholar] [CrossRef] [PubMed]
- Van der Lee, D.I.; Reijmers, R.M.; Honders, M.W.; Hagedoorn, R.S.; de Jong, R.C.; Kester, M.G.; van der Steen, D.M.; de Ru, A.H.; Kweekel, C.; Bijen, H.M.; et al. Mutated Nucleophosmin 1 as Immunotherapy Target in Acute Myeloid Leukemia. J. Clin. Invest. 2019, 129, 774–785. [Google Scholar] [CrossRef]
- Forghieri, F.; Riva, G.; Lagreca, I.; Barozzi, P.; Vallerini, D.; Morselli, M.; Paolini, A.; Bresciani, P.; Colaci, E.; Maccaferri, M.; et al. Characterization and Dynamics of Specific T Cells Against Nucleophosmin-1 (NPM1)-Mutated Peptides in Patients with NPM1-Mutated Acute Myeloid Leukemia. Oncotarget 2019, 10, 869–882. [Google Scholar] [CrossRef] [PubMed]
- Zhao, Y.; Harrison, D.L.; Song, Y.; Ji, J.; Huang, J.; Hui, E. Antigen-Presenting Cell-Intrinsic PD-1 Neutralizes PD-L1 in Cis to Attenuate PD-1 Signaling in T Cells. Cell. Rep. 2018, 24, 379–390. [Google Scholar] [CrossRef]
- Yao, H.; Wang, H.; Li, C.; Fang, J.Y.; Xu, J. Cancer Cell-Intrinsic PD-1 and Implications in Combinatorial Immunotherapy. Front. Immunol. 2018, 9, 1774. [Google Scholar] [CrossRef] [PubMed]


| Reference | NA Type | Cohort Size | Cancer Type | Primer Targets | Protein Analysis, Correlation with NA | Observed Associations with High PD-L1 Levels |
|---|---|---|---|---|---|---|
| Sasaki 2013 [23] | mRNA | 123 | NSCLC | v1&v2 | not performed |
|
| Shen 2014 [24] | mRNA | 38 | osteo sarcoma | v1&v2 | not performed |
|
| Yang 2014 [11] | mRNA | 124 | MDS, AML | v1&v2 | IHC in selected 4 patients - correlation (not significant) |
|
| Hassan 2015 [25] | mRNA | 26 | tuber culosis | v1&v2 | not performed |
|
| Ikeda 2016 [26] | DNA | 94 | NSCLC | v1&v2 | IHC, FC, no correlation |
|
| Vassilakopoulou 2016 [27] | mRNA | 260 | SCC | v1&v2 | IHC, significant correlation (p < 0.001) |
|
| Koirala 2016 [28] | cDNA | 21 | osteo sarcoma | v1&v2 | IHC, no correlation |
|
| Kösemehmetoğlu 2017 [29] | cDNA | 222 | sarcoma | v1 (&v4) | IHC, no correlation |
|
| Brüggemann 2017 [22] | mRNA | 78 | melanoma | v1 | IHC, correlation depended on antibody used |
|
| Weber 2017 [30] | mRNA | 45 | OSCC | v1&v2; v1 | not performed |
|
| Gasser 2017 [31] | mRNA | 116 | colo rectal CA | not specif. | IHC, significant correlation (p = 0.005) |
|
| Isobe 2018 [32] | mRNA | 33 | lung adeno CA | v1&v2 | IHC, significant correlation (p = 0.015) |
|
| Amatatsu 2018 [33] | mRNA | 124 | gastric CA | v1&v2 | IHC, correlation with NA not analyzed |
|
| Tsimafeyeu 2018 [34] | mRNA | 473 | NSCLC | not specif. | IHC, no correlation with any of the three antibodies tested | |
| Pawelczyk 2019 [35] | mRNA | 62 | NSCLC | not specif. | IHC (values 0-1-2), significant correlation (p < 0.0001) |
|
| Yang 2019 [36] | cDNA | 56 | T-ALL | v1 | IHC, no correlation |
|
| Patient Cohort | Cutoff | Reached p-Value |
|---|---|---|
| all (N = 86) | 22.72 | 0.0045 |
| FLT3-WT (N = 44) | 13.75 | 0.3547 |
| FLT3-ITD (N = 39) | 22.72 | 0.0003 |
| NPMmut FLT3-ITD (N = 25) | 24.20 | < 0.0001 |
| NPMwt FLT3-WT (N = 23) | 18.84 | 0.5347 |
| NPMmut FLT3-WT (N = 21) | 15.07 | 0.8545 |
| NPMwt FLT3-ITD (N = 14) | n.a. | 0.7325 |
© 2019 by the authors. Licensee MDPI, Basel, Switzerland. This article is an open access article distributed under the terms and conditions of the Creative Commons Attribution (CC BY) license (http://creativecommons.org/licenses/by/4.0/).
Share and Cite
Brodská, B.; Otevřelová, P.; Šálek, C.; Fuchs, O.; Gašová, Z.; Kuželová, K. High PD-L1 Expression Predicts for Worse Outcome of Leukemia Patients with Concomitant NPM1 and FLT3 Mutations. Int. J. Mol. Sci. 2019, 20, 2823. https://doi.org/10.3390/ijms20112823
Brodská B, Otevřelová P, Šálek C, Fuchs O, Gašová Z, Kuželová K. High PD-L1 Expression Predicts for Worse Outcome of Leukemia Patients with Concomitant NPM1 and FLT3 Mutations. International Journal of Molecular Sciences. 2019; 20(11):2823. https://doi.org/10.3390/ijms20112823
Chicago/Turabian StyleBrodská, Barbora, Petra Otevřelová, Cyril Šálek, Ota Fuchs, Zdenka Gašová, and Kateřina Kuželová. 2019. "High PD-L1 Expression Predicts for Worse Outcome of Leukemia Patients with Concomitant NPM1 and FLT3 Mutations" International Journal of Molecular Sciences 20, no. 11: 2823. https://doi.org/10.3390/ijms20112823
APA StyleBrodská, B., Otevřelová, P., Šálek, C., Fuchs, O., Gašová, Z., & Kuželová, K. (2019). High PD-L1 Expression Predicts for Worse Outcome of Leukemia Patients with Concomitant NPM1 and FLT3 Mutations. International Journal of Molecular Sciences, 20(11), 2823. https://doi.org/10.3390/ijms20112823