Article

Detection and Correlation of Single and Concomitant TP53, PTEN, and CDKN2A Alterations in Gliomas

by
Igor Andrade Pessôa
1,3,5,
Carolina Koury Amorim
3,
Wallax Augusto Silva Ferreira
2,3,
Fernanda Sagica
3,
José Reginaldo Brito
4,
Moneeb Othman
5,
Britta Meyer
6,
Thomas Liehr
5 and
Edivaldo Herculano C. de Oliveira
3,7,*
1
Programa de Pós-graduação em Genética e Biologia Molecular, Universidade Federal do Pará, Belém, PA 66075-110, Brazil
2
Programa de Pós-graduação em Neurociências e Biologia Celular, Universidade Federal do Pará, Belém, PA 66075-110, Brazil
3
Laboratório de Cultura de Tecidos e Citogenética, SAMAM, Instituto Evandro Chagas, Ananindeua, PA 67030-000, Brazil
4
Programa de Pós-graduação em Oncologia e Ciências Médicas, Universidade Federal do Pará, Belém, PA 66075-110, Brazil
5
Institute of Human Genetics, Jena University Hospital, Am Klinikum 1, 07747 Jena, Germany
6
Zyto Vision GmbH, 27572 Bremerhaven, Germany
7
Faculdade de Ciências Naturais, ICEN, Universidade Federal do Pará, Belém, PA 66075-110, Brazil
*
Author to whom correspondence should be addressed.
Int. J. Mol. Sci. 2019, 20(11), 2658; https://doi.org/10.3390/ijms20112658
Submission received: 2 April 2019 / Revised: 28 April 2019 / Accepted: 30 April 2019 / Published: 30 May 2019
(This article belongs to the Special Issue Chromosome and Karyotype Variation)

Abstract

:
Gliomas are the most frequent primary tumors of central nervous system and represent a heterogeneous group of tumors that originates from the glial cells. TP53, PTEN, and CDKN2A are important tumor suppressor genes that encode proteins involved in sustaining cellular homeostasis by different signaling pathways. Though genetic alterations in these genes play a significant role in tumorigenesis, few studies are available regarding the incidence and relation of concomitant TP53, PTEN, and CDKN2A alterations in gliomas. The purpose of this study was to evaluate the occurrence of mutation and deletion in these genes, through single-strand conformational polymorphism, array-comparative genomic hybridization, and fluorescence in situ hybridization techniques, in 69 gliomas samples. Molecular results demonstrated a significant higher prevalence of TP53, PTEN, and CDKN2A alterations in astrocytoma than other tumor subtypes, and heterozygous deletion was the most frequent event. In addition, a significant association was observed between TP53 and CDKN2A alterations (p = 0.0424), which tend to coexist in low grade astrocytomas (5/46 cases (10.9%)), suggesting that they are early events in development of these tumors, and PTEN and CDKN2A deletions (p = 0.0022), which occurred concomitantly in 9/50 (18%) patients, with CDKN2A changes preceding PTEN deletions, present preferably in high-grade gliomas.

1. Introduction

Glioma is a general term used to characterize tumors originated from glial brain cells [1]. They are the most frequent primary tumors of the central nervous system (CNS), and are characterized for a heterogeneous set of diseases, ranging from benign to malignant tumors, with a diverse array of histology and molecular differences and clinical outcomes [2,3]. Historically, gliomas have been diagnosed and classified based on histopathology, according to their microscopic characteristics and clinical behavior. Until recently, these tumors were classified, according to the World Health Organization (WHO) classification system, into astrocytomas, oligodendrogliomas, oligoastrocytomas, and ependymomas depending on their cells of origin [4]. However, new molecular markers have emerged in recent decades, and these findings have contributed to a better understanding of glioma biology, providing new information concerning tumor initiation, progression, and clinical outcome [5]. Hence, in 2016, the WHO classification was updated, and, for the first time, it integrated classic histological features with molecular biomarkers to define distinct gliomas entities, interrupting the idea of only using histopathological analyses as the criterion for definition and classification of CNS tumors [6].
Among molecular markers, there are several tumor suppressors genes, such TP53, PTEN, and CDKN2A, which are involved in sustaining cellular homeostasis by different signaling pathways, having been reported to be altered in different human cancers [7]. TP53 is a tumor suppressor gene localized on chromosome site 17p13.1, and encodes the p53 protein, a transcription factor involved in regulation of multiple cell functions implicated in cancer biology, such as regulation of cell proliferation, DNA repair, apoptosis, and differentiation [8]. PTEN, located on chromosome site 10q23.3, is a tumor suppressor gene that encodes a 403-amino acid polypeptide, which is a dual lipid/protein phosphatase considered essential for tumor suppressor properties, since its phosphatase activity makes it a negative regulator of PI3K and Akt/mTOR signaling, and thus playing important roles in the regulation of apoptosis, cell cycle arrest, angiogenesis, adhesion and invasion, and DNA damage repair [9,10]. CDKN2A gene is localized on chromosome site 9p21, being a negative G1 cell-cycle regulatory gene [11,12], since it encodes both p16INK4a and p14ARF proteins [13,14]; p16 is a tumor suppressor protein that induces cell-cycle arrest by inhibition of cyclinD-CDK4 and cyclinD-CDK6 complexes, indicating the phosphorylation of Rb protein [15], while p14ARF is a protein that blocks Mdm2-mediated degradation of p53 [16].
It has been showed that mutations and/or deletions of tumor suppressor genes are critical events behind the pathogenesis of gliomas [17]. Hence, considering the importance of TP53, PTEN, and CDKN2A genetic alterations in different proposals of initiation, progression, and classification of gliomas, the aim of this study was to analyze the occurrence of allelic deletions in these genes, as well as to perform a screening of TP53 and PTEN gene mutations in 69 samples of gliomas. Through this study, we have described the prevalence pattern of individual and mutually genetic alterations of these three genes in these gliomas and established their possible associations with clinical variables such gender, age, histological types, and WHO histological grading

2. Results

2.1. Clinical Parameters

Among the 69 gliomas samples analyzed, 41 (59.4%) were males and 28 (40.6%) females, with mean age at diagnosis of 35.1 years (ranging from 1 to 79 years). We compared the mean age distribution among different WHO grades of malignancy by analysis of variance (ANOVA) and identified statistically significant differences in younger patients with less aggressive tumors, whereas the increase of mean age was accompanied by an increase in tumor aggressiveness (Table 1).

2.2. Molecular Data

2.2.1. TP53 Status

TP53 mutational status (exons 4–11) was determined in 48 cases, while 65 were successfully analyzed for TP53 deletion evaluation and 44 for both analyses. Of 48 gliomas samples analyzed, PCR-SSCP revealed aberrantly migrated bands in 6 (12.5%) (Table 2). Among these six samples, a total of eight mutations were identified, with exon 5 being the most altered, mutated in three cases (50%), followed by exon 7, mutated in two cases (33.3%) and exons 4, 10, and 11, mutated in one case each (16.7%). The results for each exon are shown in Figure 1.
TP53 mutation was more prevalent in male patients (66.7%) and the mean age of patients with mutation was 44.2 years, higher than wild-type TP53 patients (35.5). However, no significant association was found between the presence of TP53 mutation and gender and age (p = 0.6441 and p = 0.2143, respectively). A statistically significant prevalence of this alteration in astrocytomas was observed, since only this subgroup presented mutations (p = 0.0016). In addition, WHO grades II and IV showed highest frequency of TP53 mutations in the study, since 33.3% (2/6) of the changes were identified in each one of them. However, no association was observed between the presence of mutation and grade of malignancy (p = 0.9985).
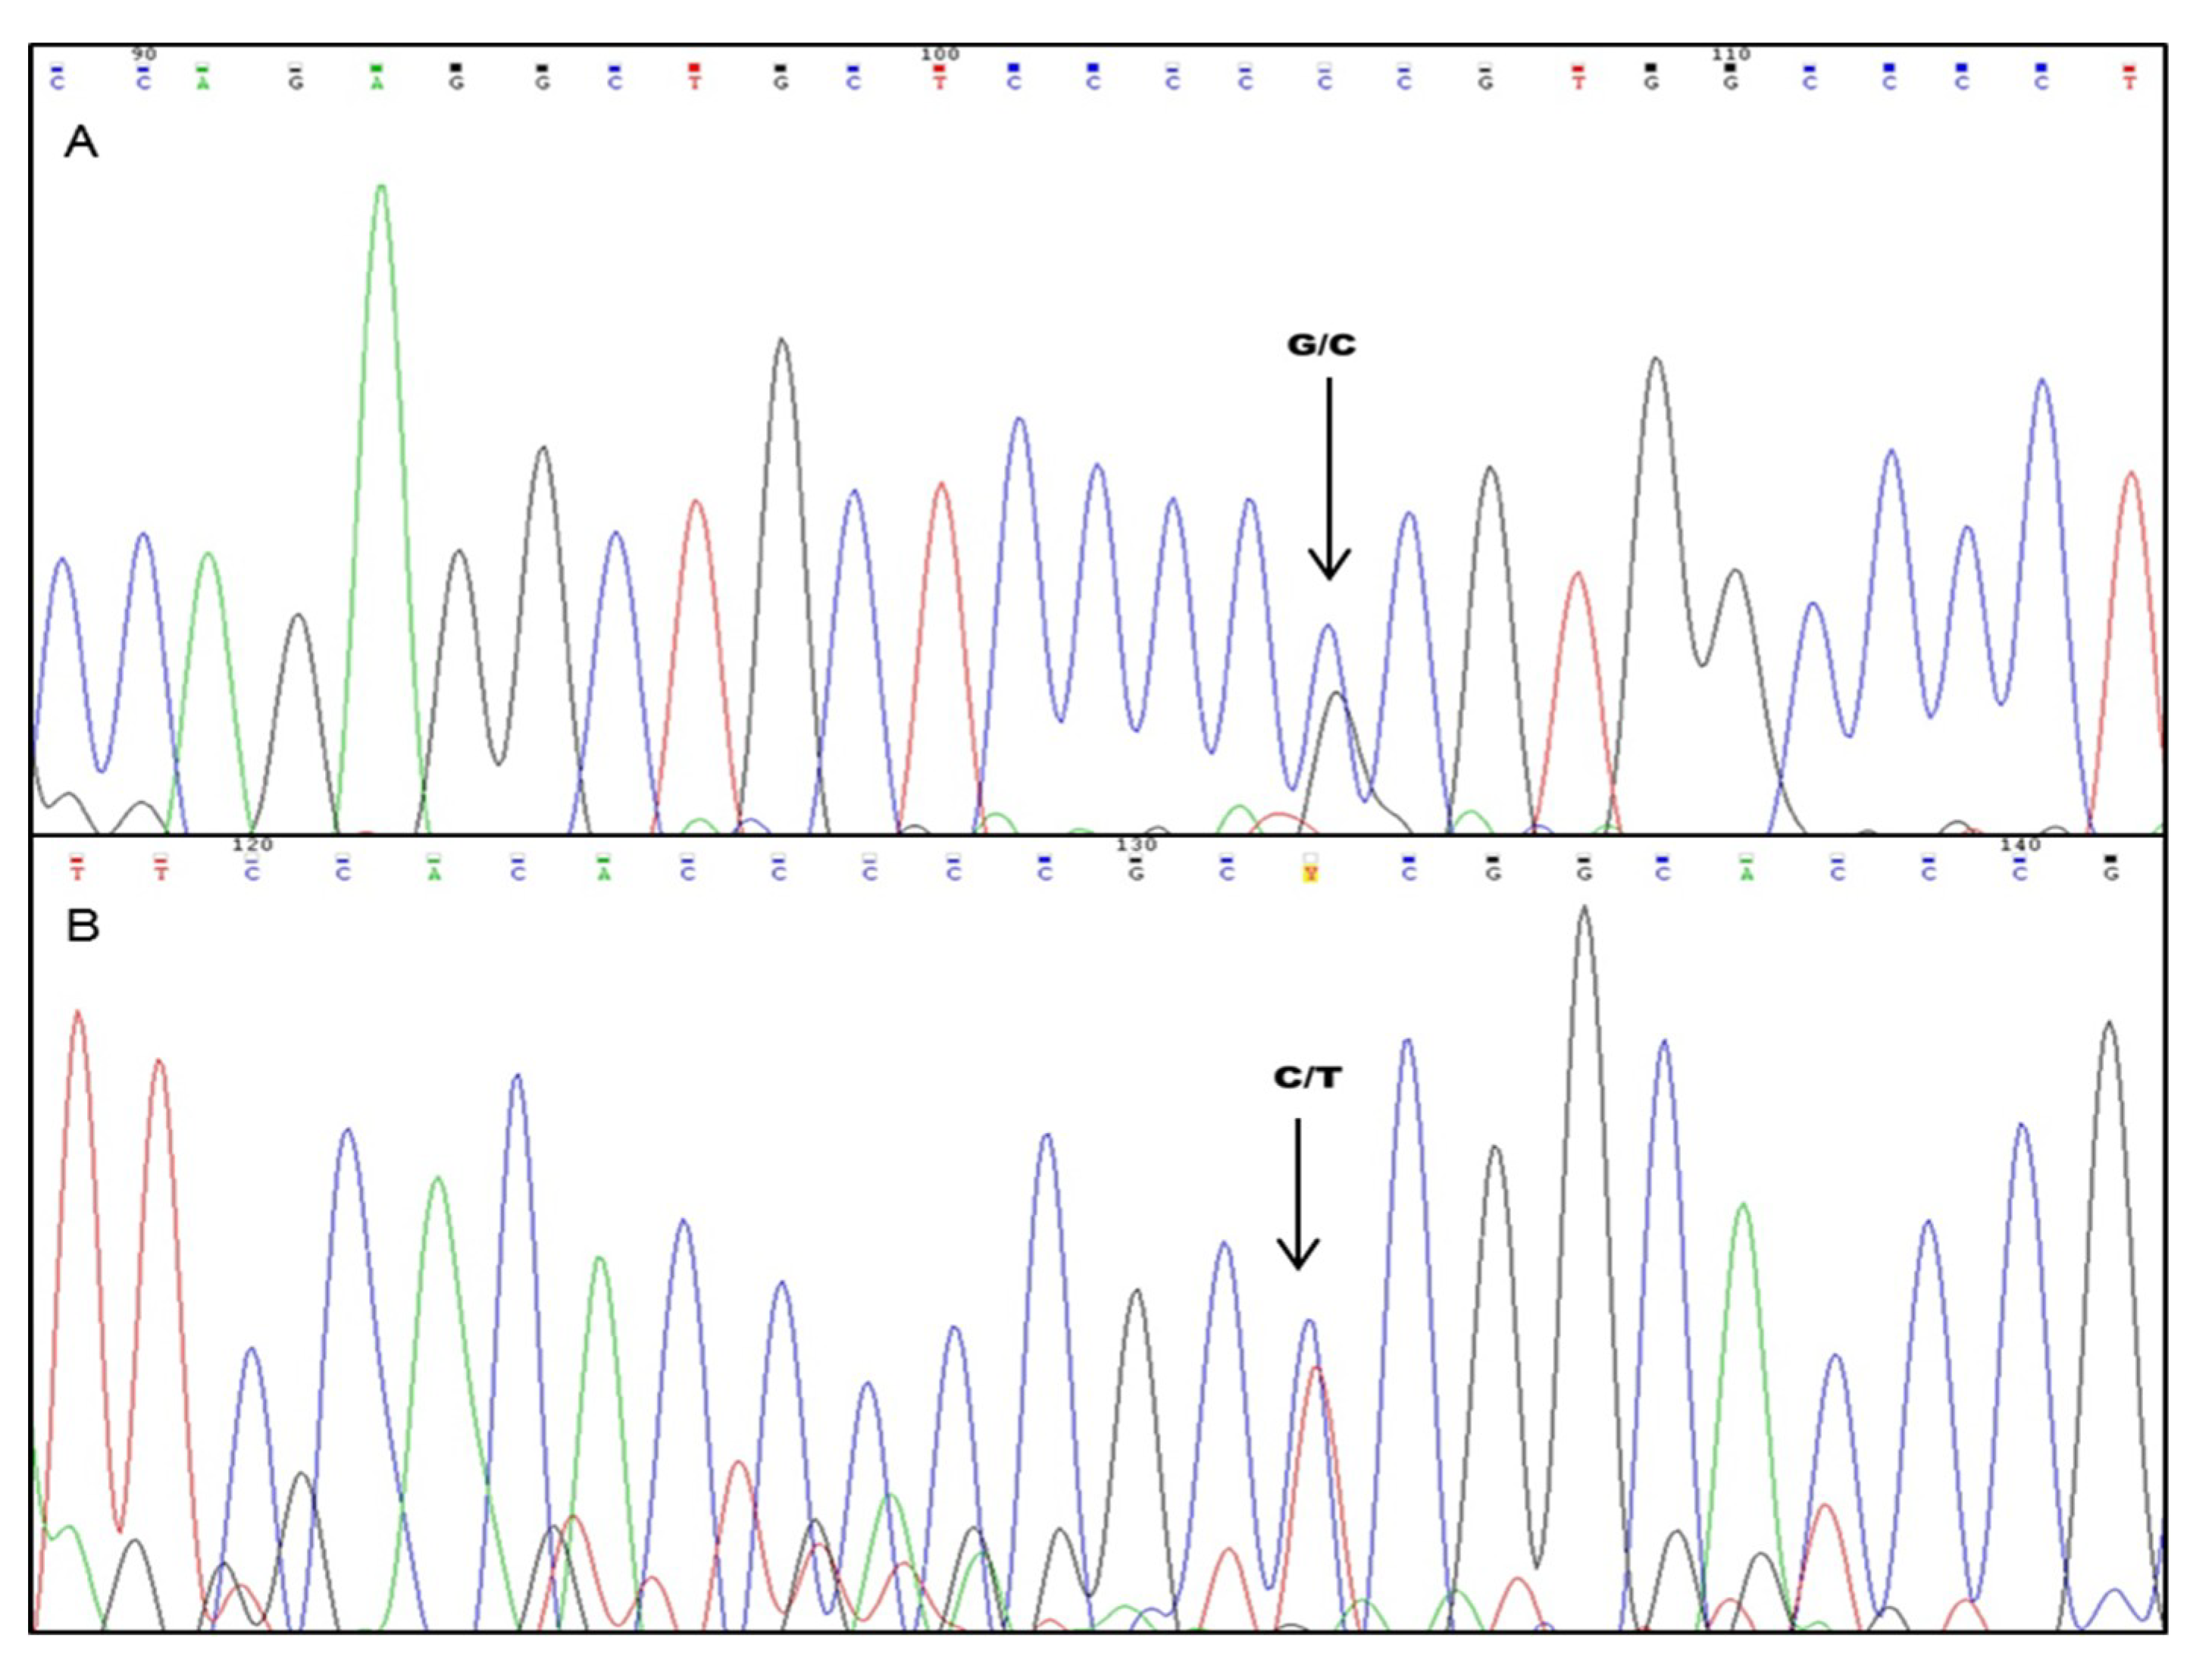
Sequencing was used for validation of SSCP results in one case (CSN 31—anaplastic astrocytoma). In exon 4, the codon 72 polymorphism (rs = 1,042,522), which results in a G→C transversion in the second position of the codon, resulted in the substitution of Arginine for Proline. In exon 5, a C→T mutation was identified at codon 153 (position 458 of the coding region—COSM44367), which change the amino acid Proline to Leucine. The sample presented the genotype in heterozygous, Arg/Pro (G/C) and Pro/Leu (C/T), respectively (Figure 2).
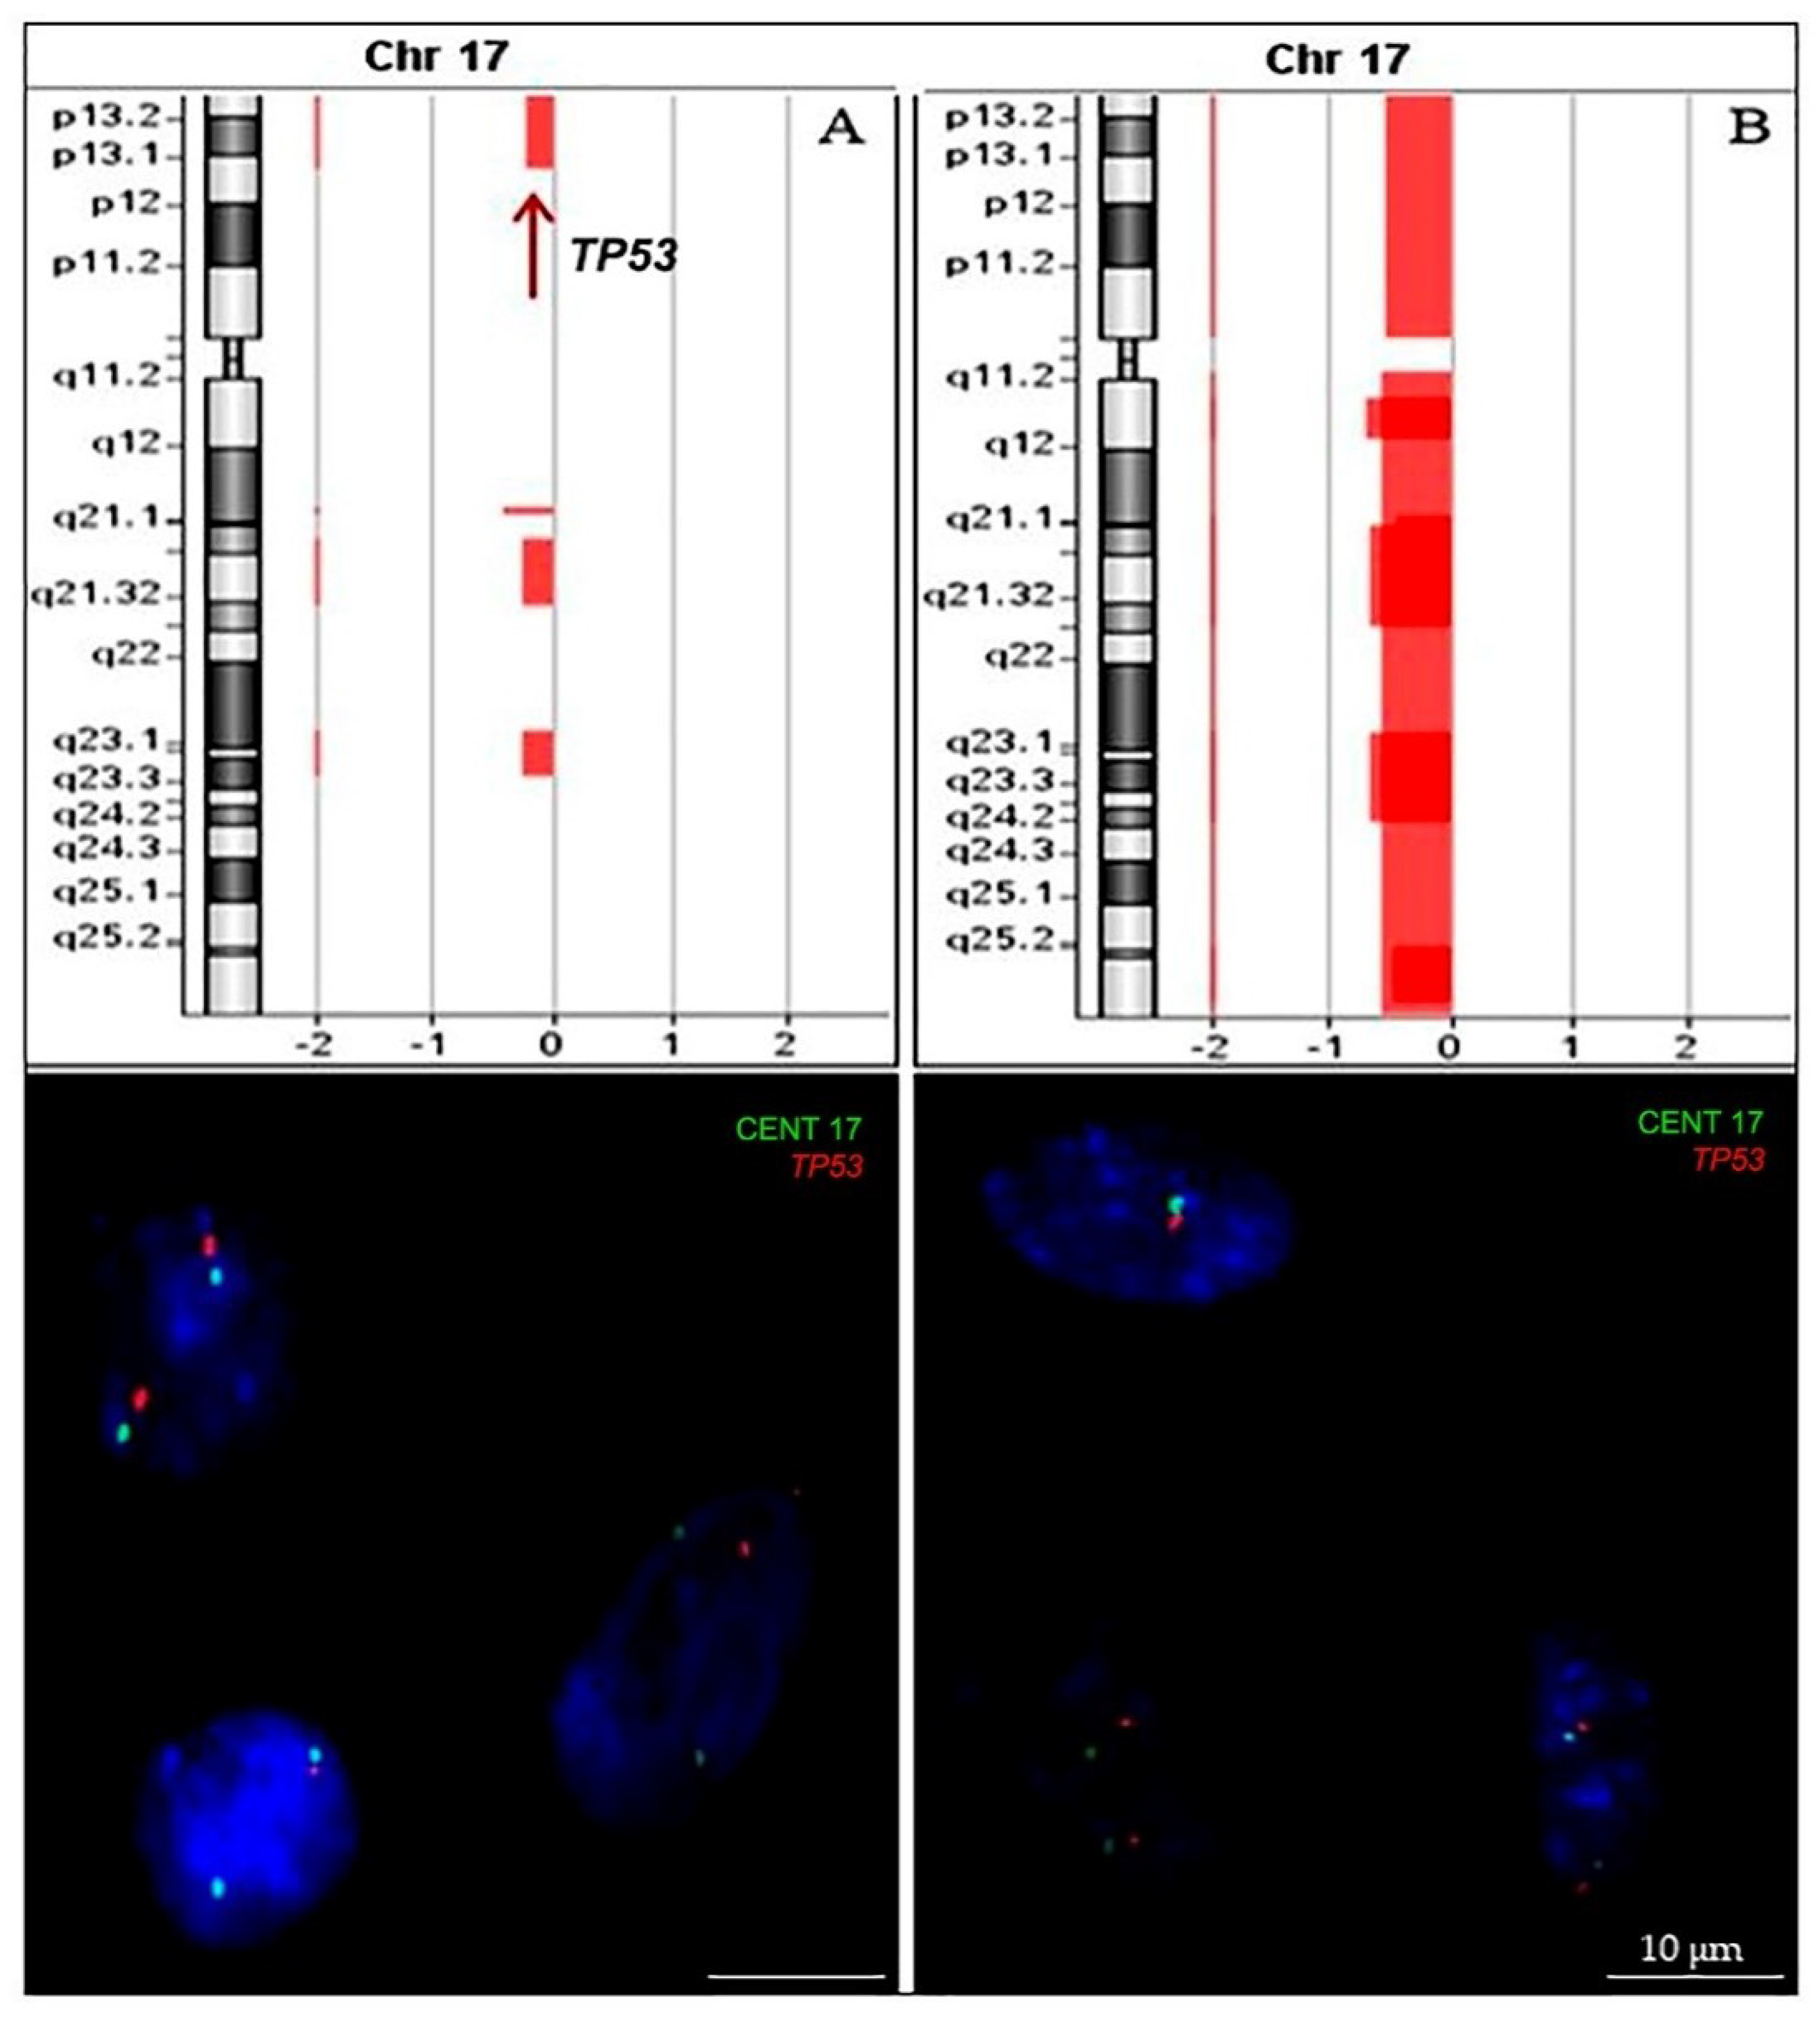
Analysis of TP53 deletion was performed in 65 of the cases, 18 of which were analyzed by array-comparative genomic hybridization (aCGH) alone, 23 by interphase fluorescence in situ hybridization (iFISH), and 24 by both methods. Figure 3 illustrate TP53 deletion identified by array-CGH and confirmed by iFISH. There was a general agreement between aCGH and FISH methodologies, with concordance for detection of TP53 deletion of 91.7%. In two cases, TP53 deletion was identified by iFISH, but not by aCGH. Of the 65 cases analyzed, heterozygous deletion was identified in 19 cases (29.2%). No homozygous deletions were found in this study.
TP53 deletion was slightly more prevalent in female patients (52.6%) and the mean age of patients harboring this alteration (39.7 years) was higher than those with no deletion (35.5 years). However, no significant association was found between the presence of this abnormality and age (p = 0.1835). The frequency of TP53 deletion was significantly higher in astrocytomas (15/49 cases, 30.6%) when compared to other histological groups (p = 0.0048). Further, the highest frequency of TP53 deletion was identified in high-grade gliomas (HGG) (WHO grade III and IV) when compared to low-grade gliomas (LGG) (WHO grade I and II) (13/37 cases, 35.1% vs. 6/28 cases, 21.4% respectively); however, no association was observed between the presence of this alteration and WHO grading groups (p = 0.3535). Table 3 summarizes the frequency of TP53 deletion for each histologic subtype and WHO grading groups.
The occurrence of concomitant allelic deletion and mutation in TP53 gene were analyzed in a total of 44 samples, and it was observed that in the 4 samples that harbored TP53 mutations, 2 of them (50%) also presented TP53 heterozygous deletion. However, no significant association between presence of TP53 mutation and allelic loss was found (p = 0.2530).

2.2.2. PTEN Status

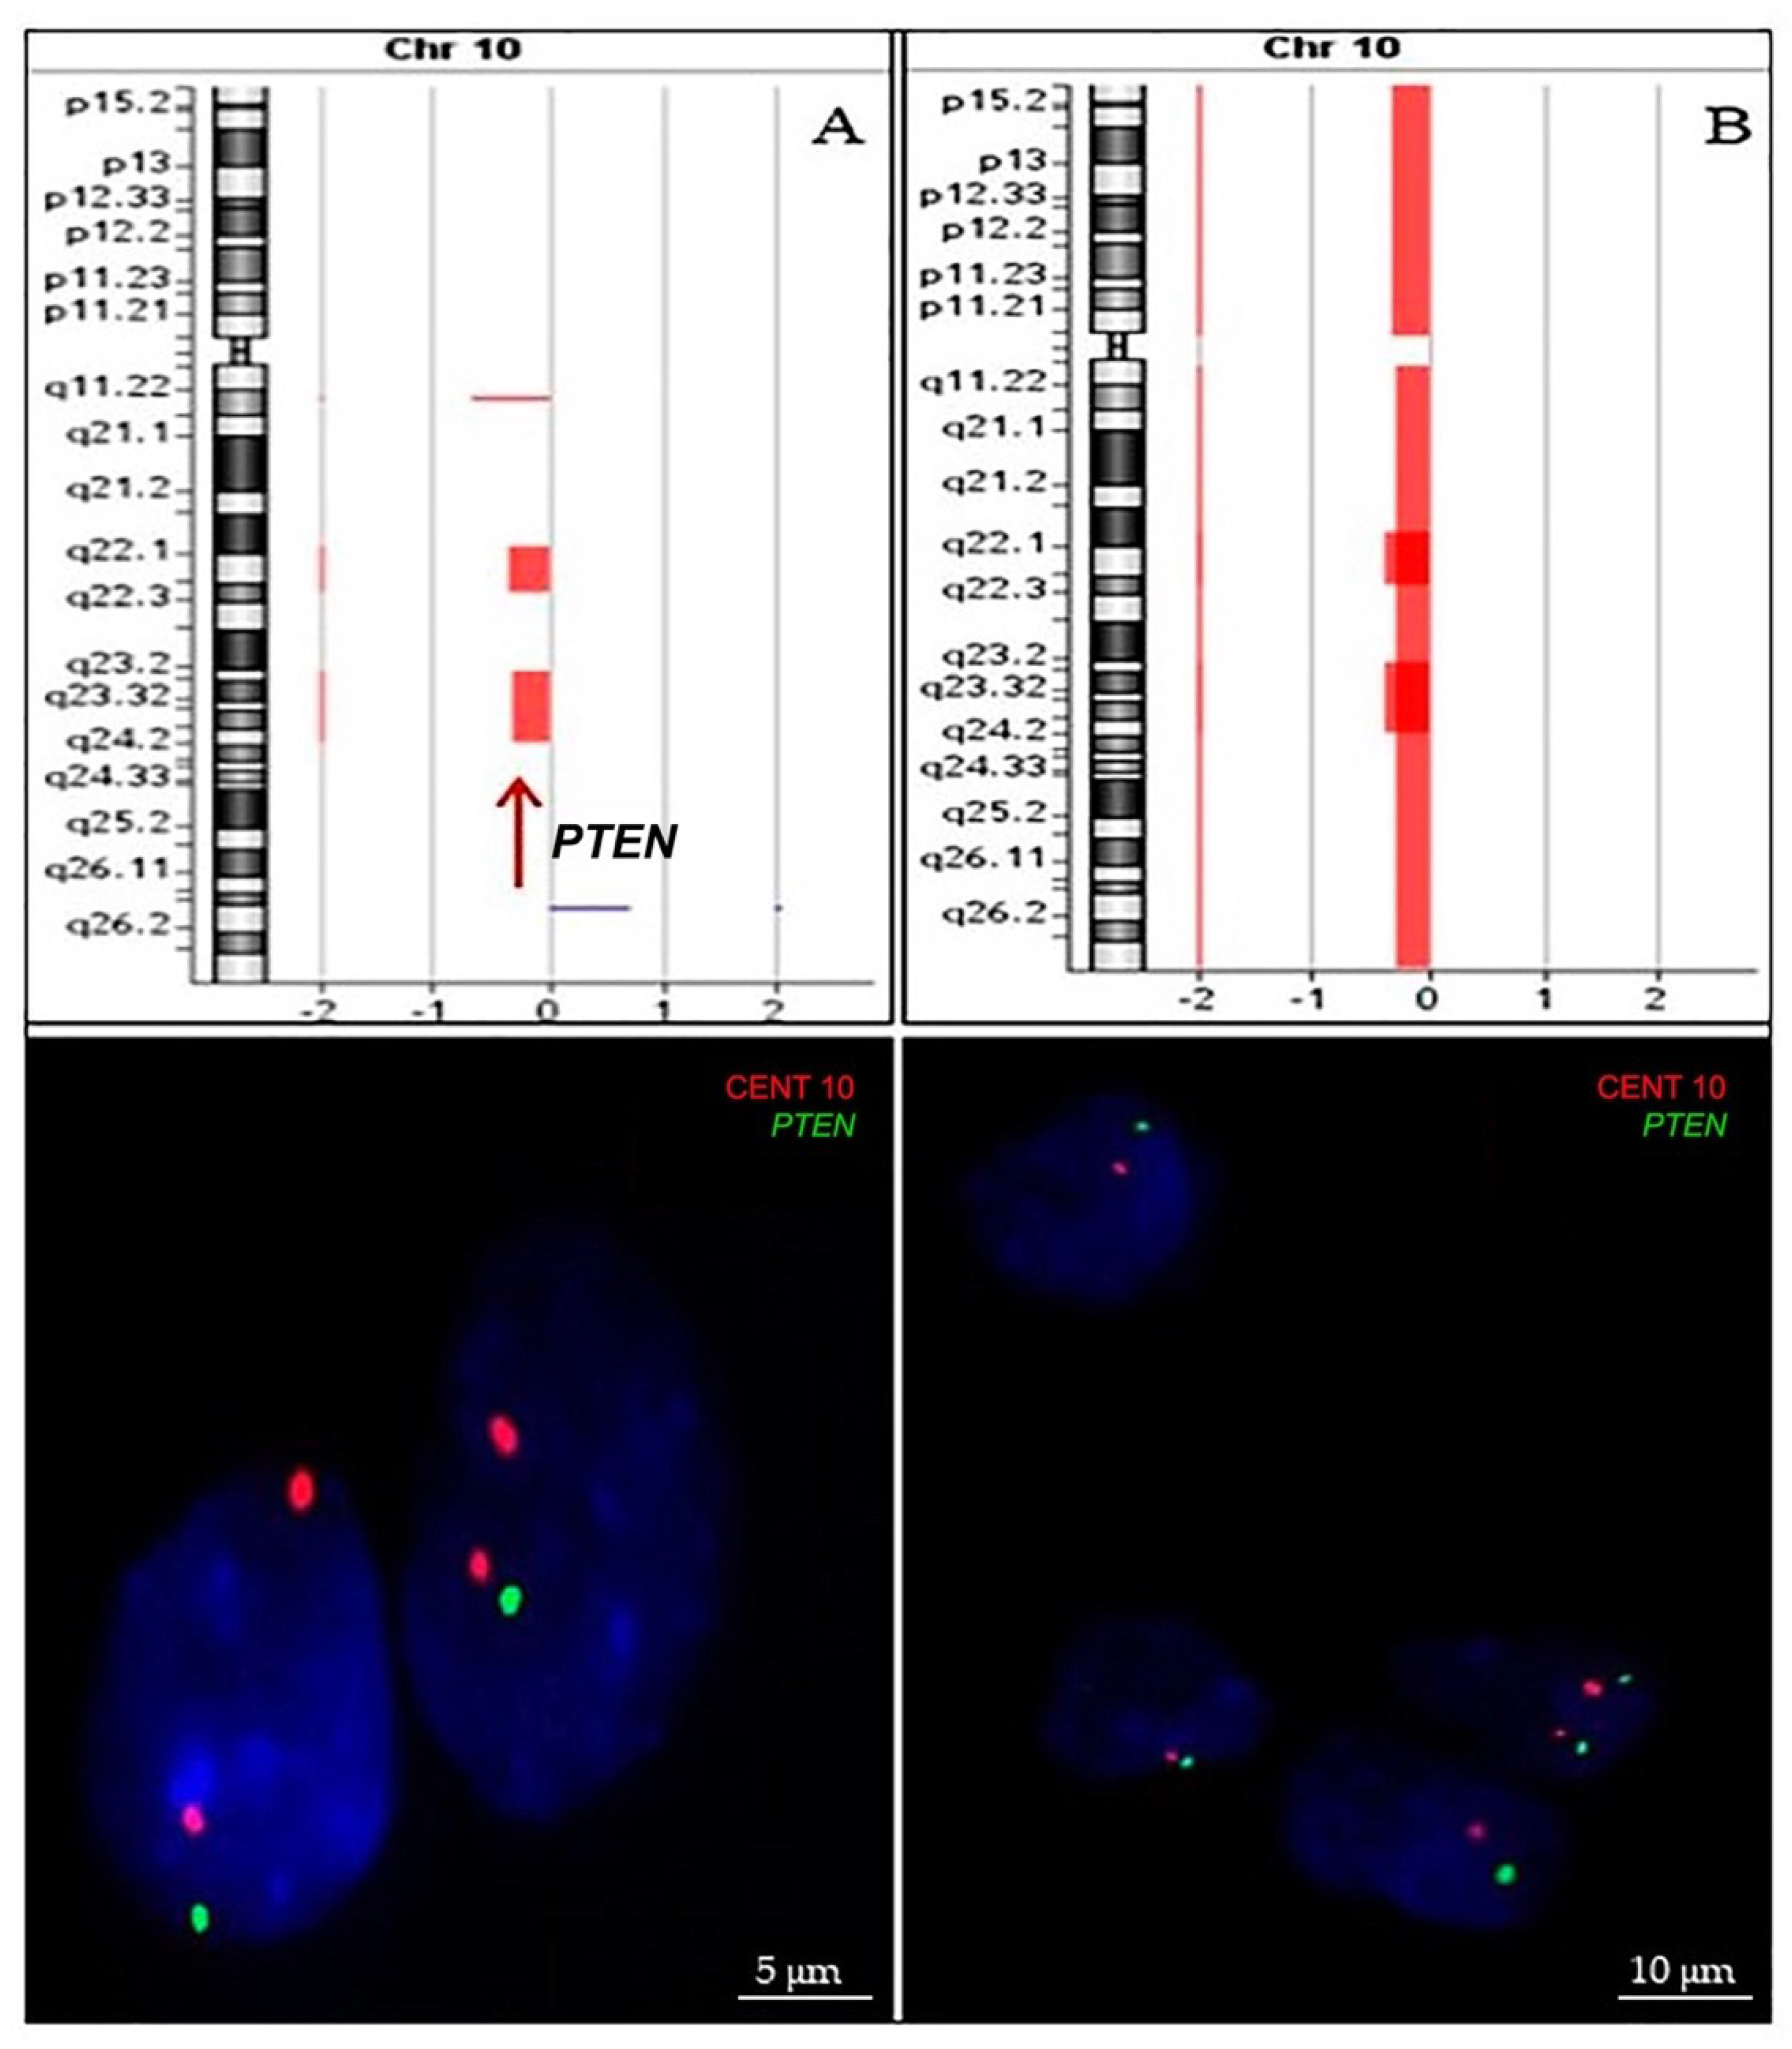
PTEN mutational status (exons 5–7) was determined in 34 cases, while 62 were successfully analyzed for PTEN deletion evaluation and 32 for both analyses. No aberrantly migrating bands were observed by PCR-SSCP. Among the 62 samples that were evaluated for PTEN deletion, 37 were analyzed by aCGH alone, 20 by iFISH, and 5 by both methods. Figure 4 illustrate PTEN deletion identified by array-CGH and confirmed by iFISH. There was agreement between aCGH and FISH methodologies, with concordance for detection of PTEN deletion of 100%. Of the 62 cases analyzed, heterozygous deletion was identified in 23 cases (37.1%). No homozygous deletions were found in this study.
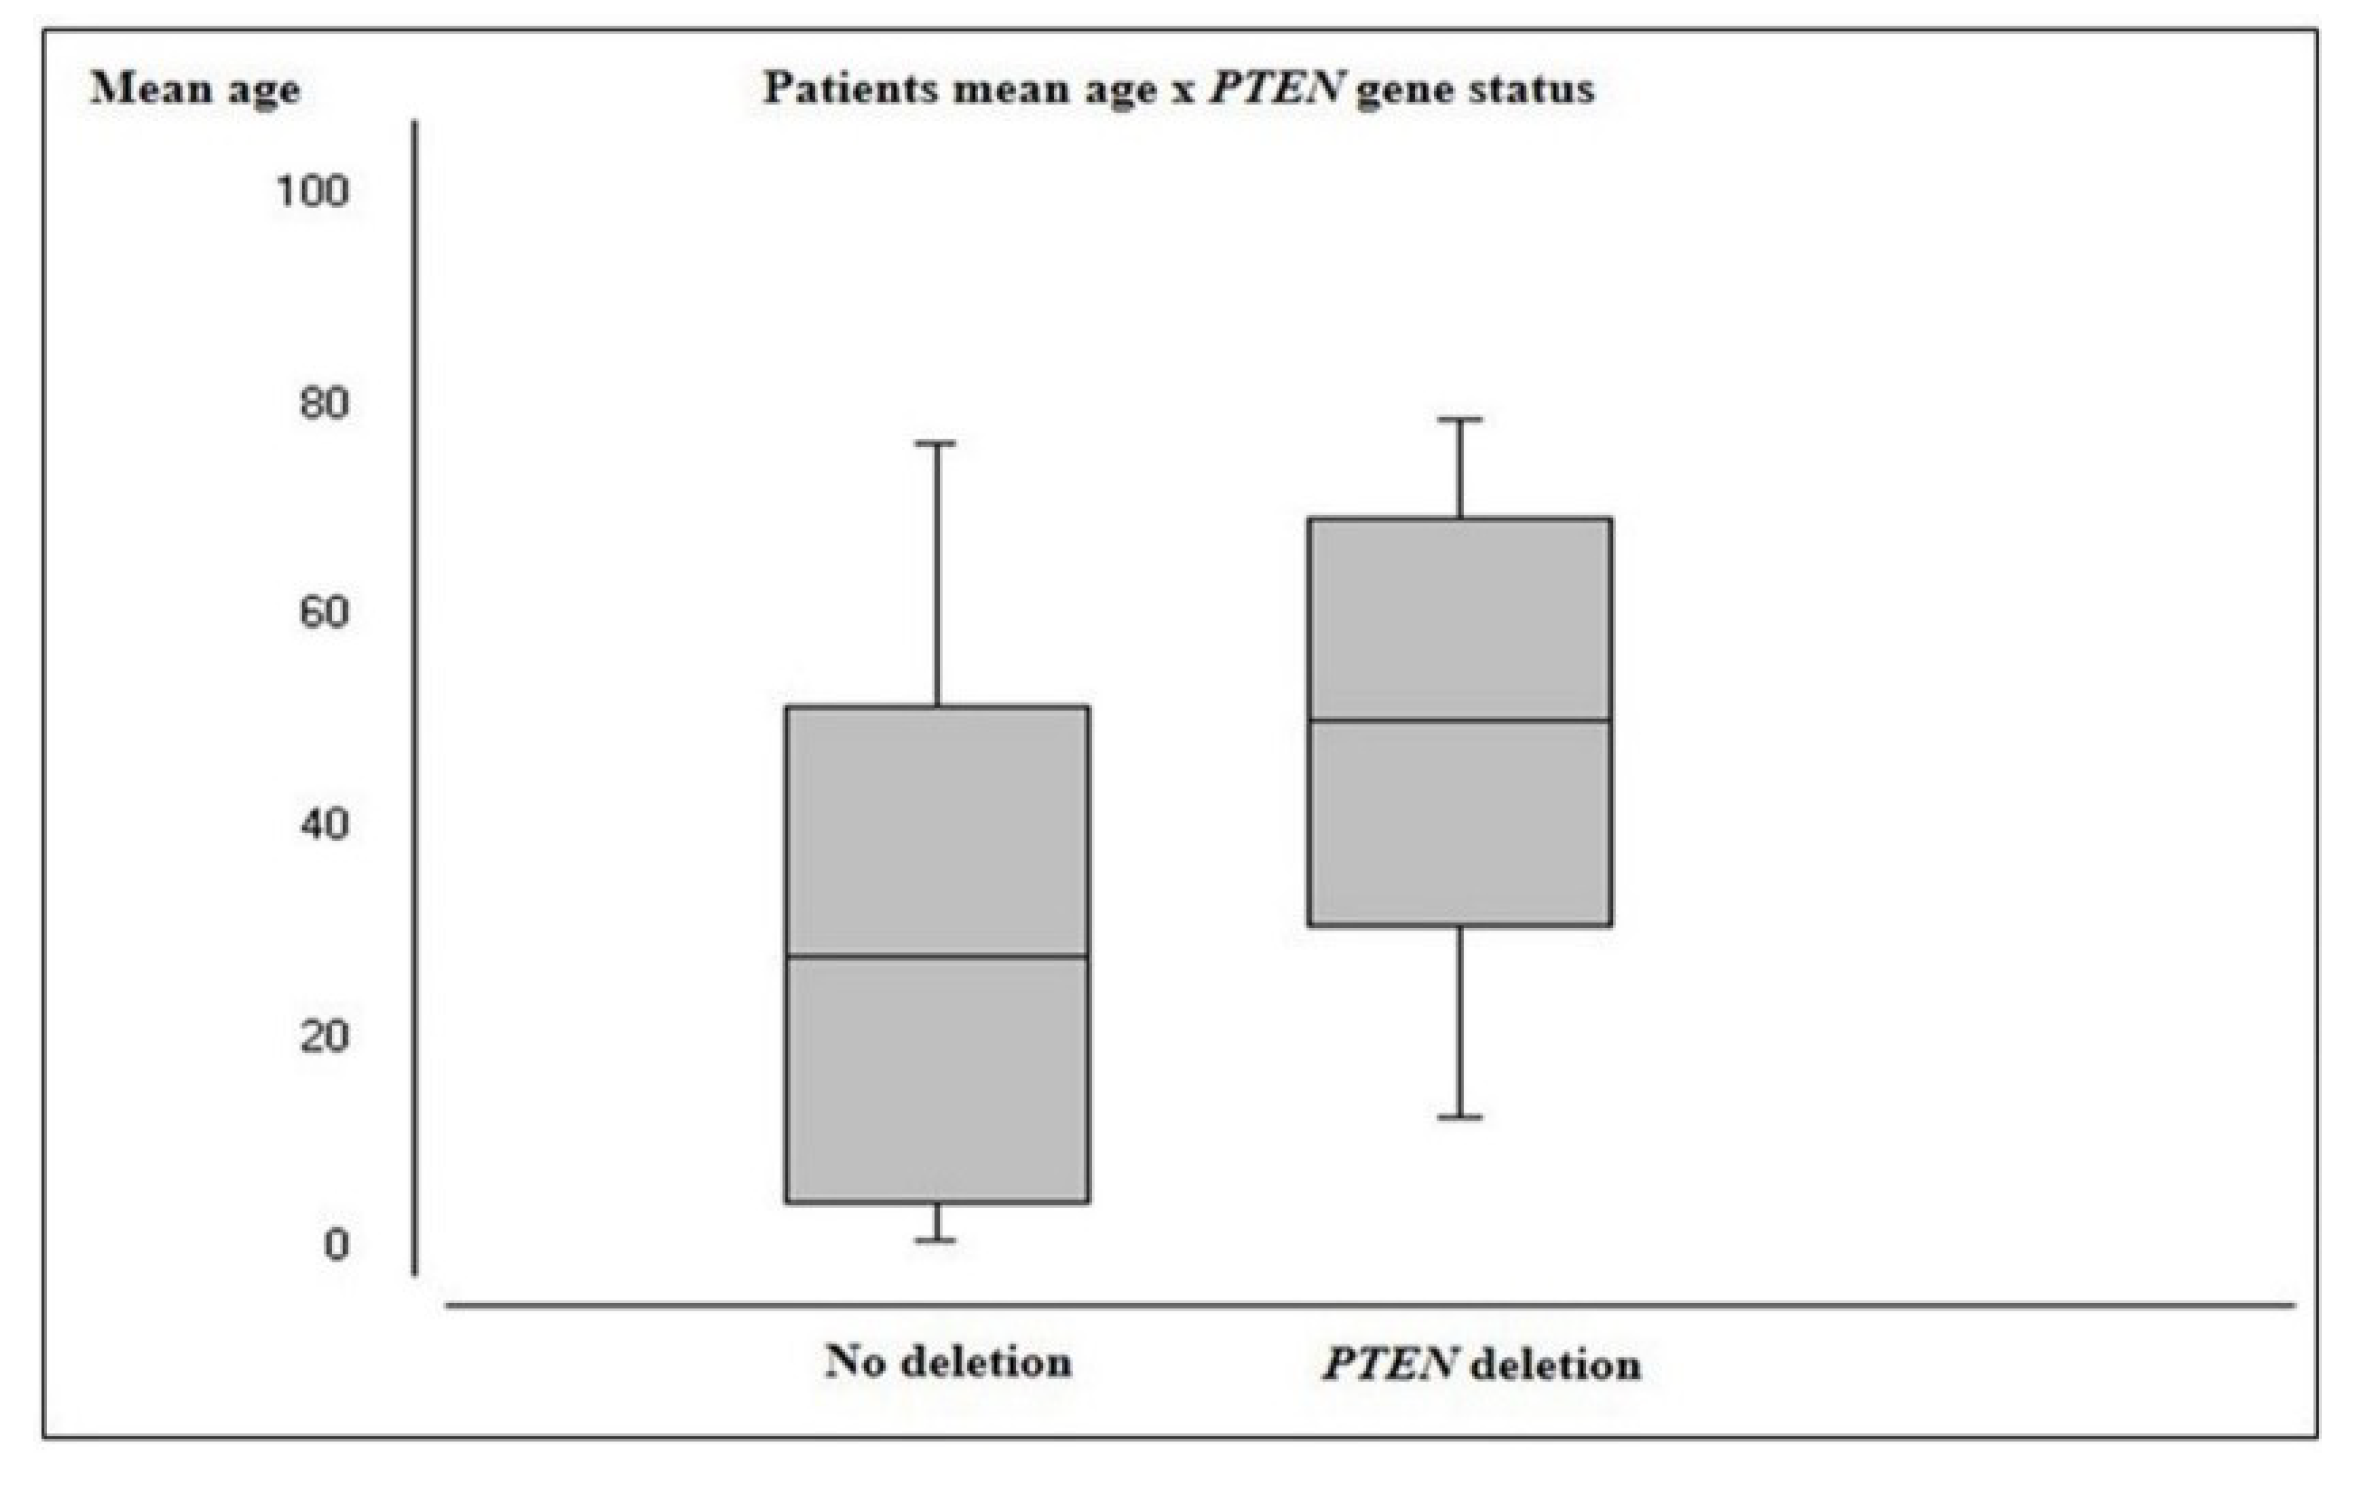
PTEN deletion was more prevalent in male patients (69.6%) and the mean age of patients harboring this alteration (50.5 years) was significantly higher than those with no deletion (28.3 years; p = 0.0002) (Figure 5). Astrocytomas demonstrated a significantly higher frequency of PTEN deletion (20/46 cases, 43.5%) than other histological groups (p ≤ 0.0001). Additionally, HGG presented significantly higher frequencies of PTEN deletion (20/36 cases, 55.6%) than LGG (3/26 cases, 11.5%) (p = 0.05). Table 4 summarizes the frequency of PTEN deletion for each histologic subtype and WHO grading groups.

2.2.3. CDKN2A Status

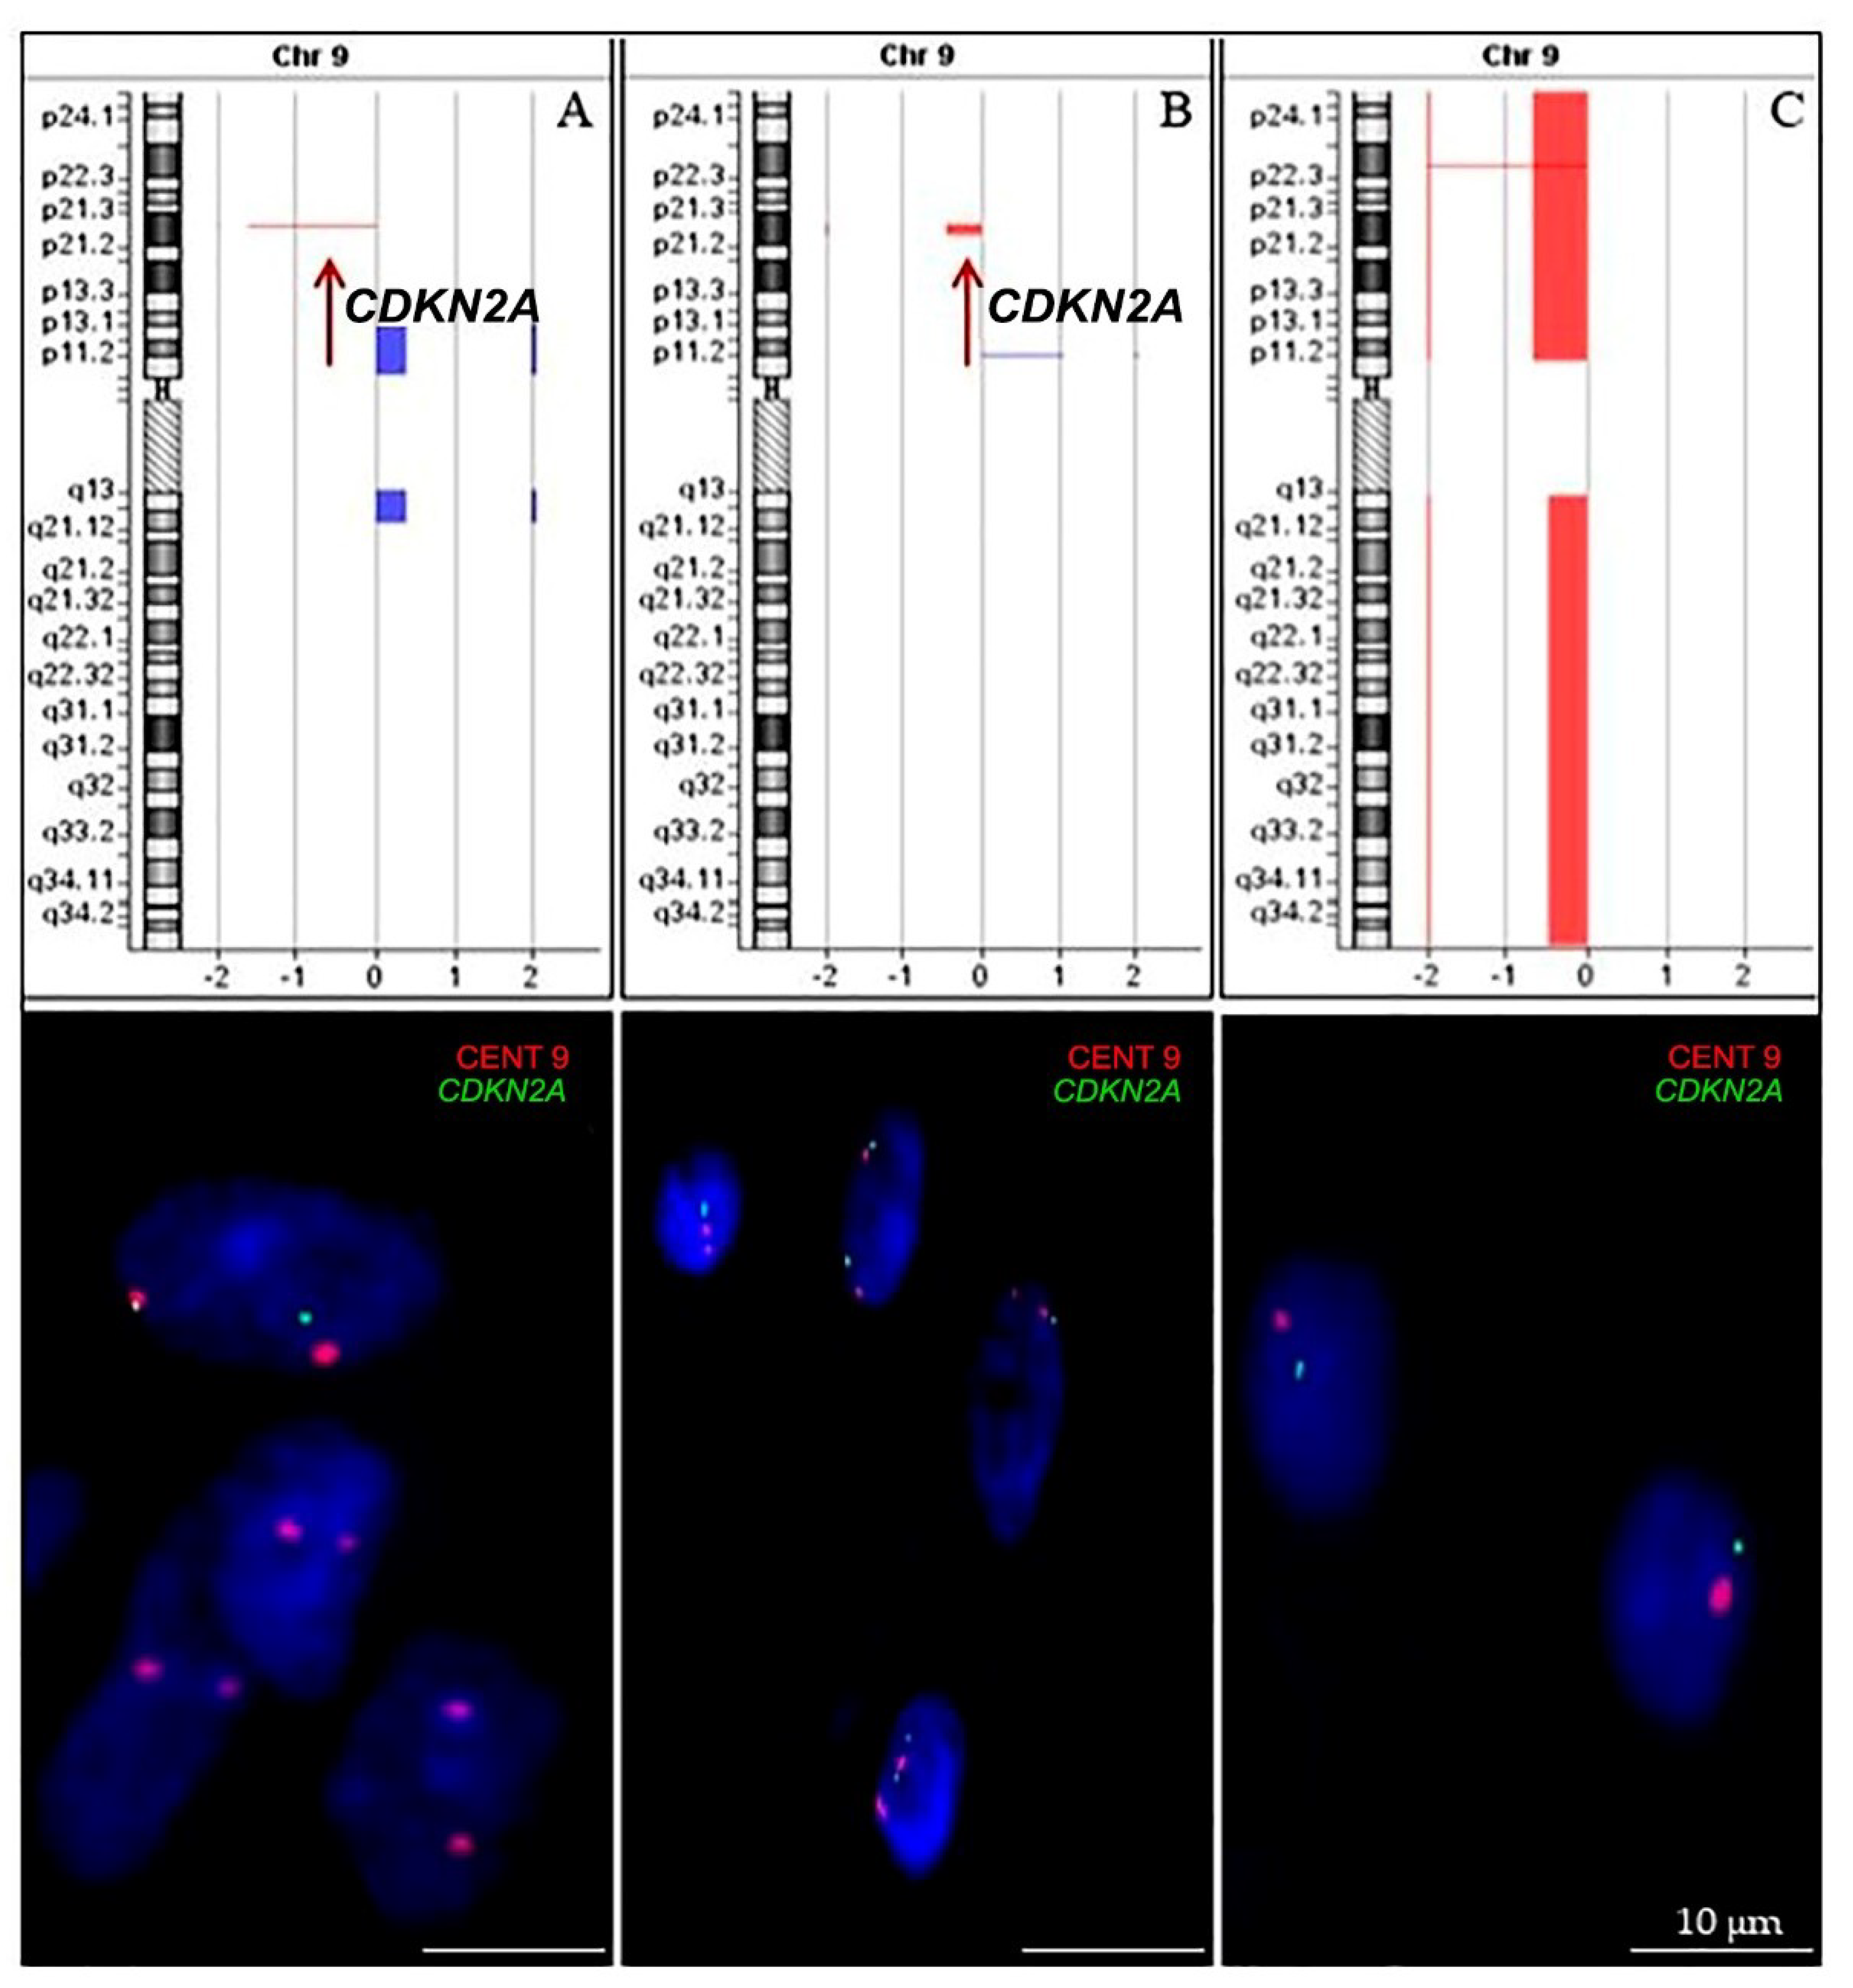
A total of 63 samples were evaluated for CDKN2A deletion, of which 36 were analyzed only by aCGH, 21 by iFISH, and 6 by both methods. Figure 6 illustrate CDKN2A deletion identified by array-CGH and confirmed by iFISH. There was agreement between aCGH and FISH methodologies, with concordance for detection of CDKN2A loss of 100%. Of the 63 cases analyzed, CDKN2A deletion was identified in 28 cases (44.4%). A total of 20 samples (71.4%) showed heterozygous deletion, while homozygous deletions were found in 8 samples (28.6%).
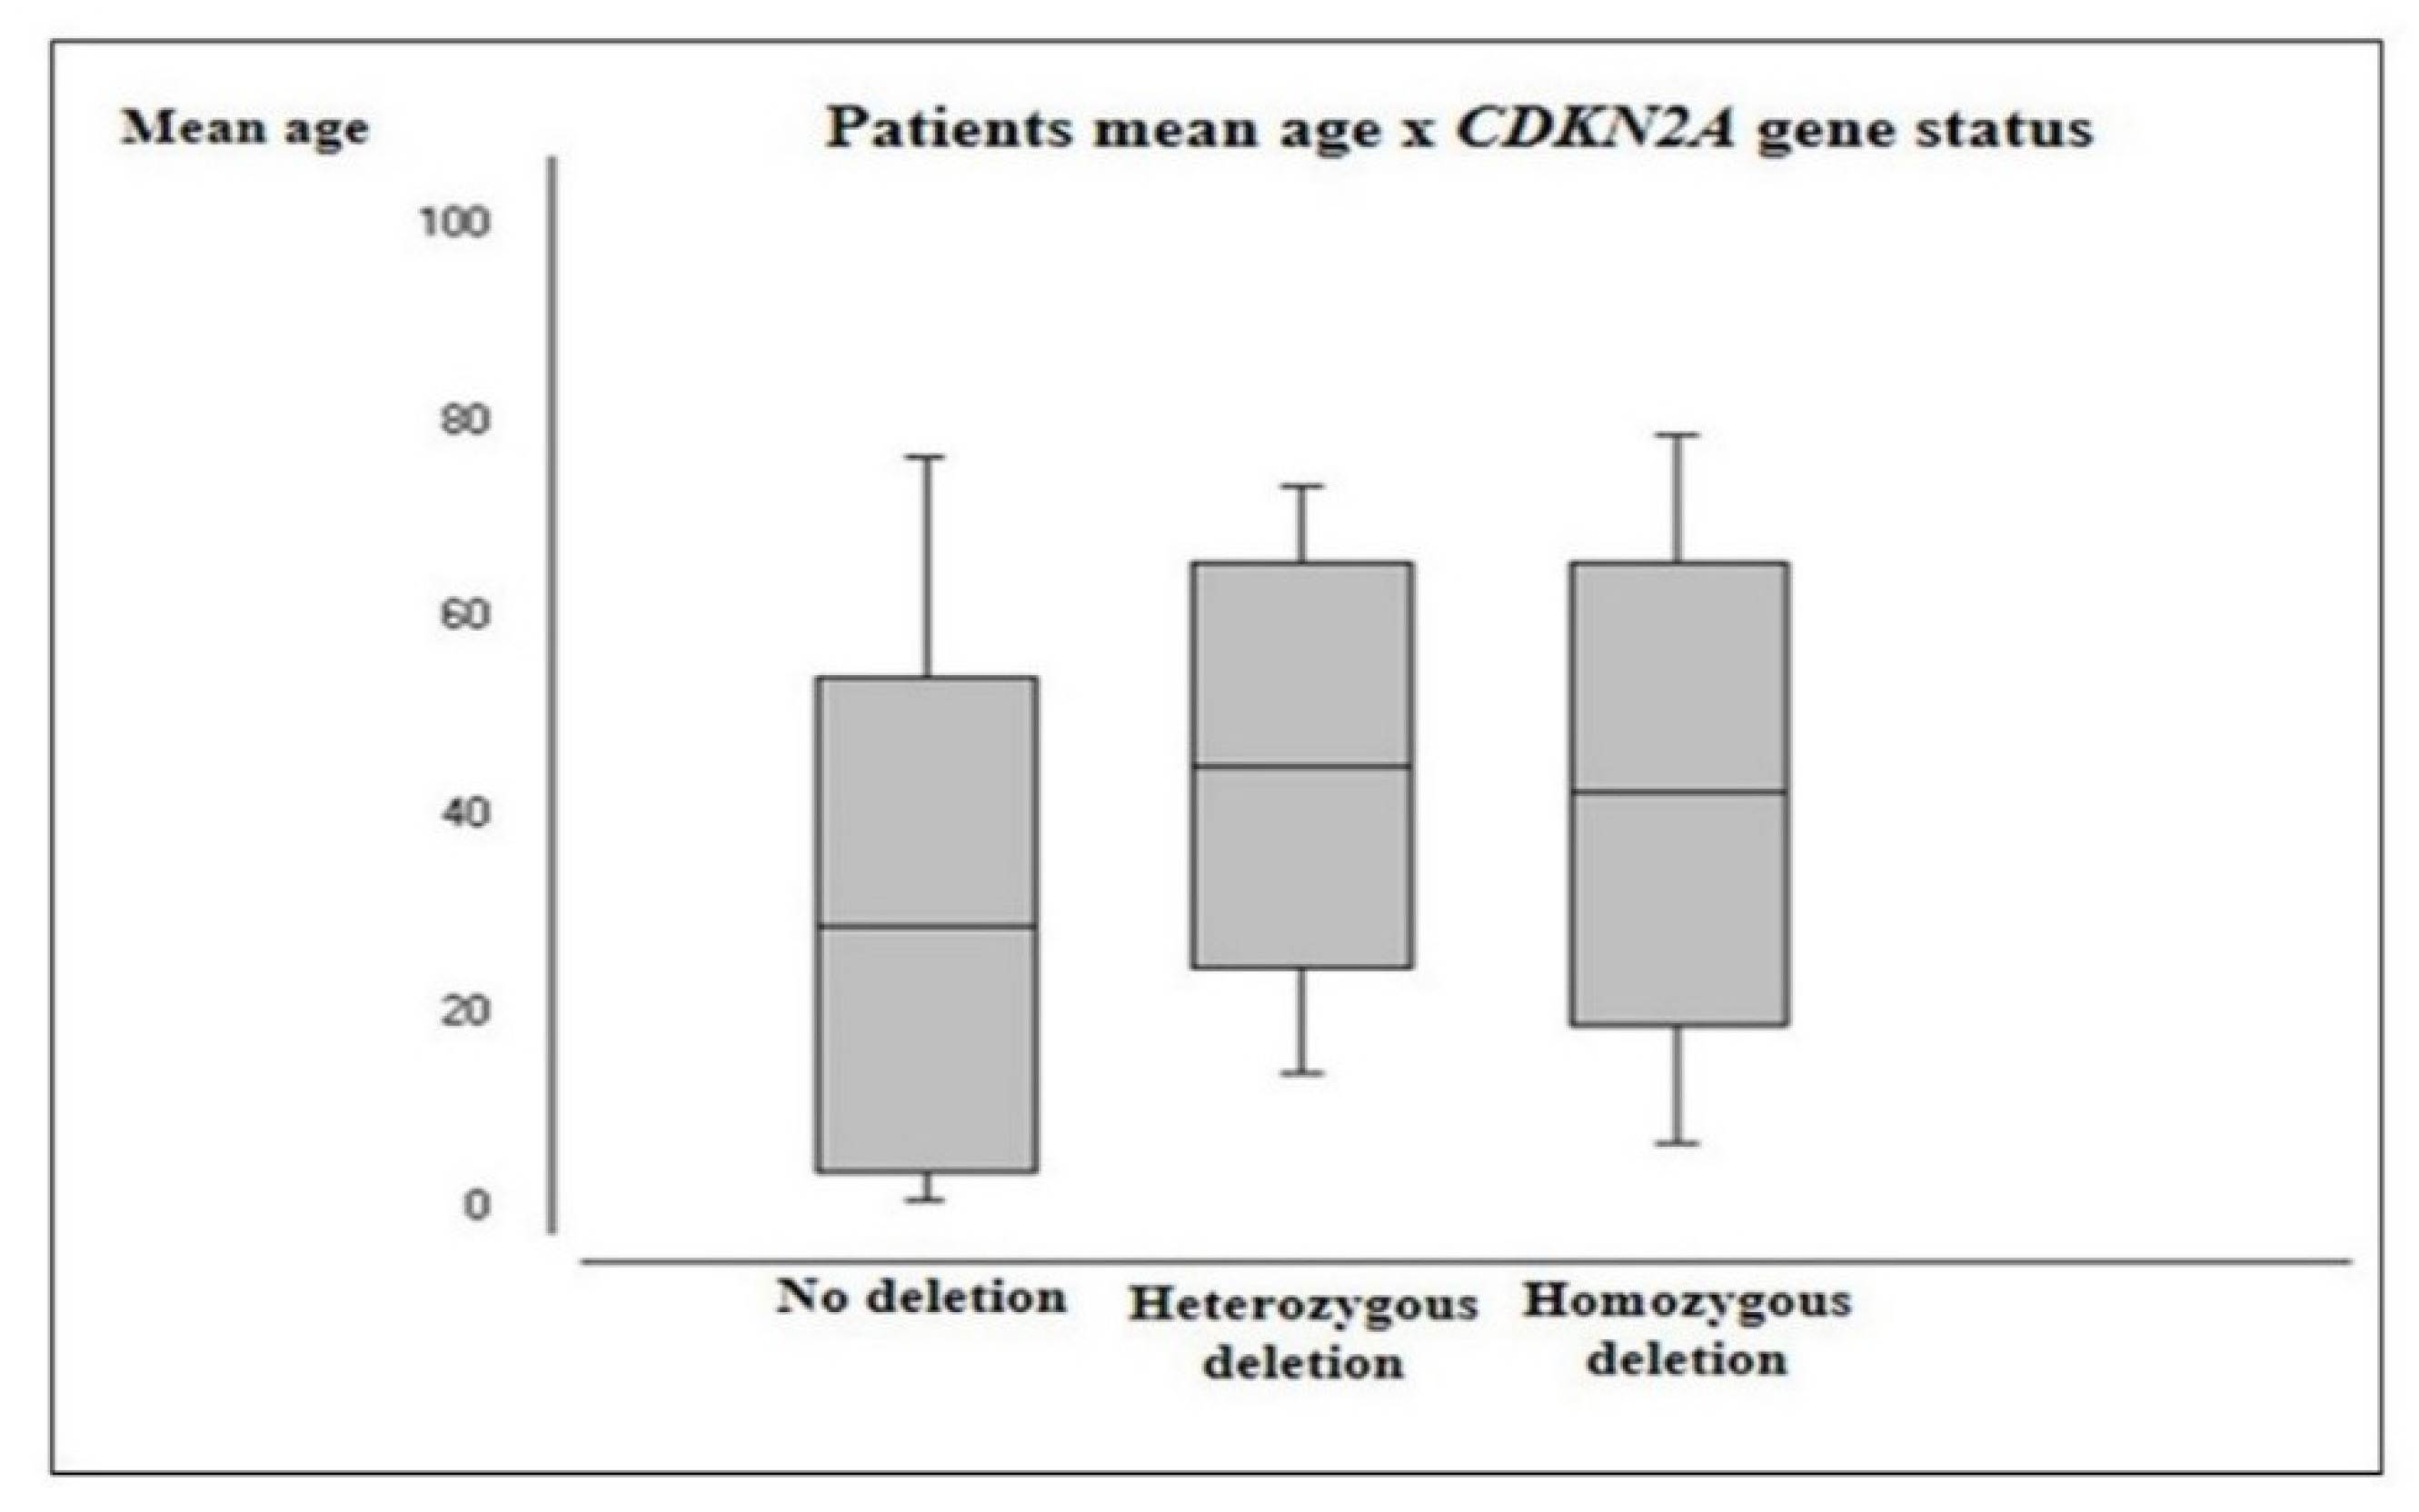
CDKN2A deletion was more prevalent in male patients (71.4%) and the mean age of patients harboring heterozygous deletion (45.5 years) and homozygous deletions (42.6 years) were significantly higher than those with no deletion (29.2 years; p = 0.0091 and p = 0.0089, respectively) (Figure 7). Astrocytomas demonstrated a significantly higher frequency of both CDKN2A heterozygous (16/47 cases, 34%) and homozygous deletion (8/47 cases, 17%) than other histological groups (p ≤ 0.0001 and p = 0.006, respectively). Moreover, HGG presented a higher frequency of heterozygous (14/37 cases, 37.8%) and homozygous deletion (6/37 cases, 16.2%) than LGG (6/26 cases, 23.1% and 2/26 cases, 7.7%, respectively). However, no significant association was observed between the presence of this alteration and WHO grading groups (p = 0.1901). Table 5 summarizes the frequency of CDKN2A deletion for each histologic subtype and WHO grading groups.

2.3. Frequency and Association between TP53, PTEN, and CDKN2A Genetic Alterations

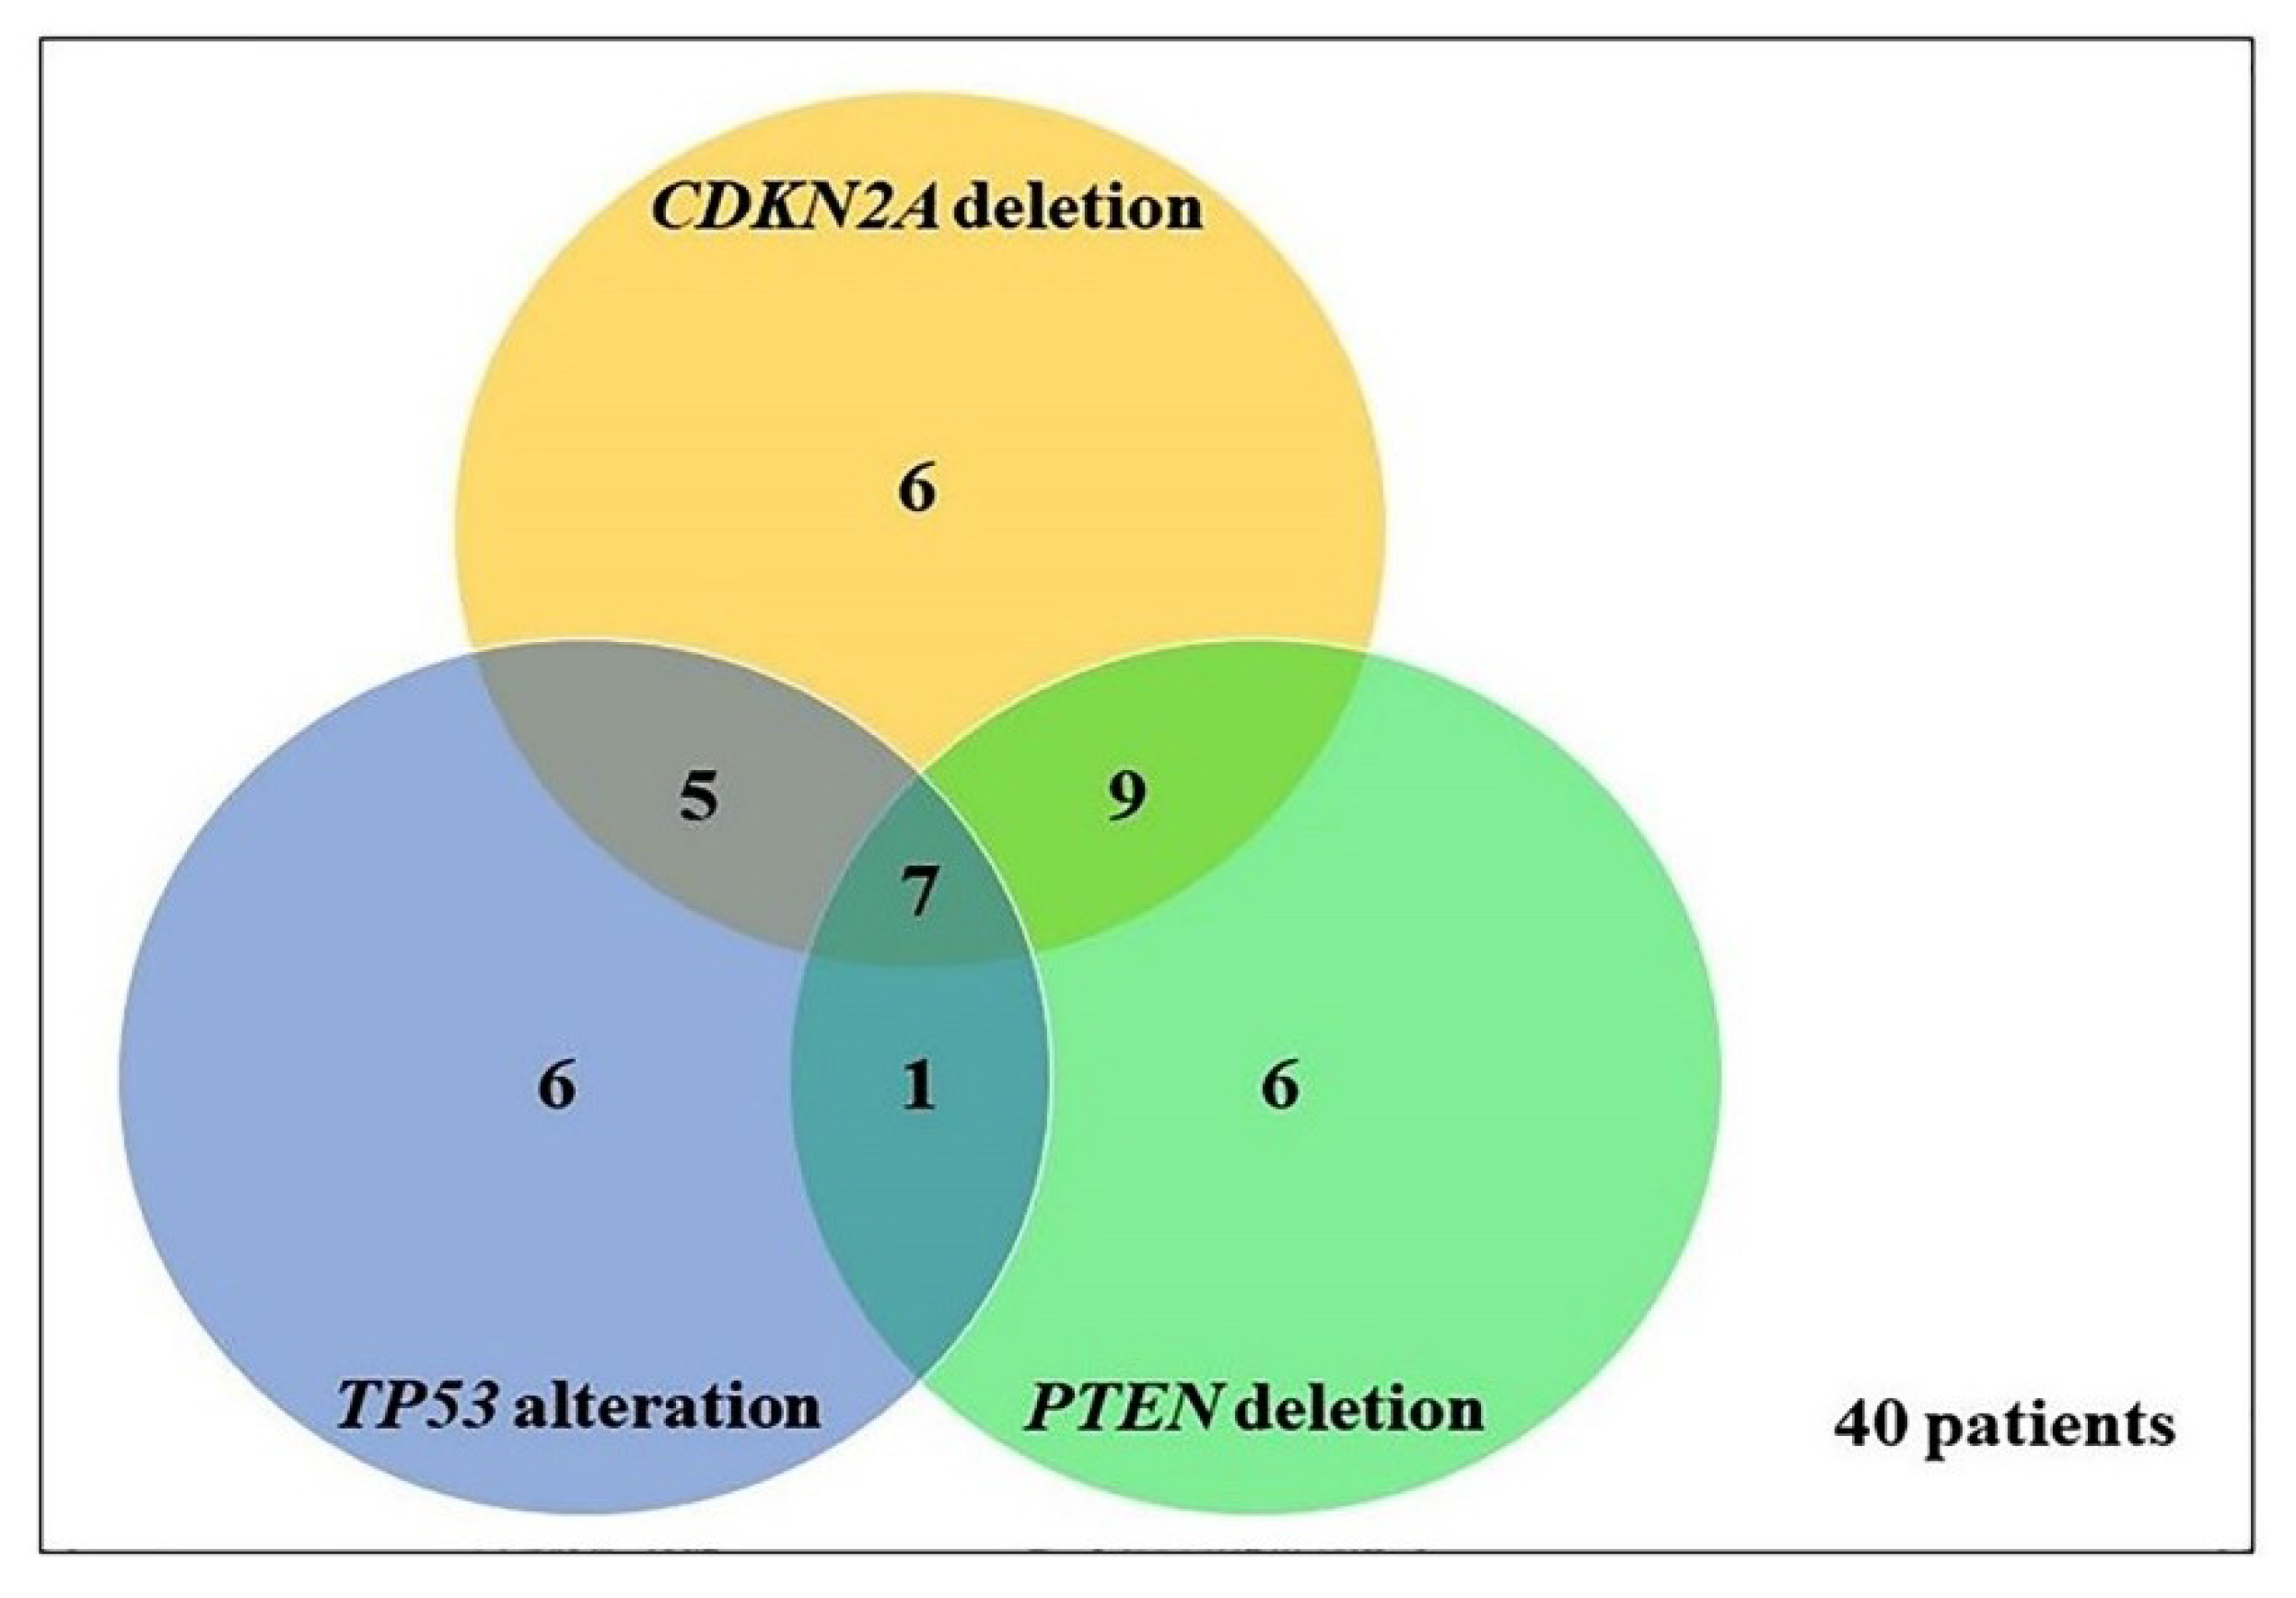
Concurrent TP53, PTEN, and CDKN2A analyses were available in 62 samples, of which 40 (64.5%) presented alteration in at least one gene (Figure 8). TP53 alteration (mutation or deletion), PTEN, and CDKN2A deletion occurred together in seven samples, 6/46 (13%) astrocytomas, and 1/4 (25%) oligodendrogliomas. The simultaneous occurrence of alterations in two genes was observed as follows: PTEN and CDKN2A genes, identified in nine patients, 8/46 (17.4%) astrocytomas, and 1/4 (25%) oligoastrocytoma; TP53 and CDKN2A genes, identified in 5/46 (10.9%) astrocytomas; and TP53 and PTEN genes, identified in 1/46 (2.2%) astrocytomas. Considering cases with alterations in only two genes, a significant association was observed between TP53 and CDKN2A alterations (p = 0.0424) and between PTEN and CDKN2A deletions (p = 0.0022), but not between TP53 and PTEN alterations (p = 0.5879).
Table 6 summarizes the frequencies of alterations per WHO CNS grading. A significant association was detected between the presence of concurrent alterations and WHO grade (p = 0.0408), since the increase in grade of malignancy was accompanied by an increase in the number of concomitant gene alterations. Co-alterations of TP53 and PTEN genes were present in only HGG (2.8%), and combined PTEN and CDKN2A alterations were observed predominantly in HGG (22.2%) when compared to LGG (3.8%). Additionally, co-alteration in TP53 and CDKN2A genes were also more frequently observed in HGG, however, with a frequency similar to the one observed in LGG (8.3% vs. 7.7%). Further, a higher frequency of concurrent TP53, PTEN, and CDKN2A alterations was observed in gliomas of higher malignancy grade (16.7%).

3. Discussion

Over the last decades, our understanding of the genetic profile of CNS tumors has improved considerably. Large-scale cytogenetic and molecular studies have detected many recurrent genetic and epigenetic abnormalities associated with different subtypes of glial tumors, and it has become clear that these markers are useful in identifying more uniform gliomas subgroups [18]. Like in other types of cancers, initiation and progression of gliomas are a consequence of sequential genetic alterations, such as point mutations, epigenetic changes, copy number alterations, and chromosomal rearrangements, affecting genes that are essential to maintaining cellular homeostasis [19]. Therefore, the focus of this investigation was to analyze the influence of independently and combined alterations in TP53, PTEN, and CDKN2A tumor suppressor genes in the gliomagenesis, evaluating a possible association of our findings with clinical variable of the patients.
Genetic alterations in TP53, PTEN, and CDKN2A genes are important molecular markers, being commonly observed in gliomas [20]. Loss of function of their respective proteins, which are inactivated directly by mutations and allelic deletions or indirectly by alterations of genes that interact with their protein product, is a common characteristic in a majority of human cancers, resulting in escape from the tumor-suppressor process [20].
In our study, TP53 abnormalities (mutation and/or deletion) occurred in 23/69 (33.3%) samples, with a significant prevalence of both gene mutation (p = 0.0016) and allelic loss (p = 0.0048) in astrocytomas, when compared to the other histological groups, confirming previous reports [21,22]. TP53 deletions were more frequent than mutations and were detected in 19/65 cases (29.2%) and 6/48 cases (12.5%), respectively, confirming the data of previous publications demonstrating higher incidence of TP53 deletion than gene mutation in cancer [23,24,25]. In addition, no significant association (p = 0.2530) between presence of mutation and deletion of TP53 was found in the 44 samples in which both analyses were allowed.
Since most TP53 mutations (~90%) identified in gliomas are concentrated in mutational hotspots regions (exons 5–9), studies have limited their mutational analysis to this portion of the gene. This fact has caused some bias in the literature, because mutations located outside these classic hotspots have already been identified, especially in primary glioblastoma [26]. In an attempt to avoid this bias, we performed a screening of mutations in a region that included exons 4 to 11 of the gene. In our study, we found that 5 of 8 (62.5%) mutations in TP53 gene were localized into hotspot region, confirming the prevalence of mutations described in literature in this region; however, 3 mutations (37.5%) were present in exons 4, 10, and 11, thus showing the need for studying all exons of TP53 gene in gliomas.
On the other hand, although some reports have identified low frequency of PTEN mutations in HGG [27,28], which is consistent with our results, since no mutation was identified in 34 tumors, a mutational rate in up to ~60% in high-grade astrocytomas has been detected in most of the previous studies [29,30,31]. A sampling bias can explain this divergence with our findings, since the heterogeneity of tumor subtypes and sample size in our study may have influenced these conflicting results. Further, other genetic events may be associated with inactivation of the PTEN protein and consequent participation in the process of malignant progression of gliomas. PTEN deletions also have been reported in up to 88.1% of anaplastic astrocytomas, from 0% to 50% in oligodendrogliomas/oligoastrocytomas and rarely in LGG [32,33,34,35,36,37]. Consistent with these studies, we found the presence of PTEN deletion in 23 cases from 62 (37.1%), with a significantly higher prevalence detected in astrocytomas (p ≤ 0.0001). Although most investigations show a higher frequency of PTEN mutation when compared to allelic loss [18,38,39], Pollack et al. performed a sequence analysis of the nine exons of PTEN in a series of 62 malignant gliomas and found mutation in only one case, while PTEN allelic imbalance was detected in 7 of 22 cases (31.8%) [40], which is consistent with our findings.
Besides the alterations described above, high occurrence of losses involving CDKN2A gene have been reported in gliomas, ranging from 11% to 71% in all histological types, although more frequently found in astrocytomas [41,42,43]. Our findings are consistent with literature, since we report CDKN2A deletions in 28 from 63 cases (44.4%), with significantly higher frequency of both heterozygous and homozygous deletion in astrocytomas (p ≤ 0.0001 and p = 0.006 respectively).
Previous publications have shown that TP53 heterozygous deletion occur more frequently than homozygous deletion in cancer [44,45]. Our findings corroborate these observations, since we detected only heterozygous deletion in TP53 gene. Contradicting previous studies reporting higher frequency of homozygous deletions of PTEN and CDKN2A genes in gliomas [18,34,41,42], in our study only PTEN heterozygous deletions were found, while genomic analyses of CDKN2A showed that 28 patients harboring this alterations: 71.4% presented heterozygous deletion against 28.6% showing homozygous deletions.
Although TP53, PTEN, and CDKN2A are considered recessive tumor-suppressor genes, and deletions are frequently related with mutations of the second allele, supporting the “two-hit” of cancer development [46], many studies have shown the effect of their inactivation by a heterozygous mutation or one allele loss on tumorigenesis [25]. It has been proposed that cell proliferation rates can be increased by haploinsufficiency of tumor-suppressor genes and that heterozygous deletions in these genes are supposed to be preferentially selected during tumor progression [47,48].
Studies using mouse models have shown that PTEN heterozygous deletion promotes genomic instability and leads to preferential rearrangements at fragile sites [49]. In addition, it was reported that loss of both TP53 alleles is not a prerequisite for tumor formation and progression, since analyses of tumors in heterozygous animals showed that many of the tumors preserved a wild-type TP53 allele [25]. Moreover, analyses of human cancers samples obtained from patients diagnosed with the Li-Fraumeni syndrome have shown that the remaining wild-type TP53 allele is not always lost, proposing that haploinsufficiency of TP53 may be enough for tumor initiation [50]. In addition, Picanço-Albuquerque et al. showed in a series of 18 biopsies of prostate cancer that two cases with a heterozygous PTEN deletion detected by FISH presented decreased expression of PTEN protein [47]. Thus, it is thought that a heterozygous deletion with retention of a PTEN allele intact may reduce the protein expression levels.
Overall, it has been reported that TP53 genetic alterations are early events in gliomagenesis, while genetic changes affecting PTEN have been identified mainly in HGG, considered to be involved in malignant glioma progression. Our data are in concordance previous studies, since we found no statistically significant difference between the presence of TP53 mutation/deletion and grade of malignancy (p = 0.9985 and p = 0.3535, respectively), while a significantly higher frequency of PTEN deletion in HGG was identified (55.6%) (p = 0.05). In addition, although the majority of investigations have shown that CDKN2A deletions are more frequently identified in HGG when compared to LGG, suggesting a role for CDKN2A pathway in malignant progression [41,42], no significant association was observed between the presence of CDKN2A losses and WHO grading groups (p = 0.1901) in our study, suggesting that this is an early event in initiation and progression of gliomas. Our results are supported by Reis et al., who reported no significant differences when the frequency of CKN2A deletion was compared between low- and high-grade tumors (44.7% × 50.8%; p = 0.6, respectively) [42], and also by Purkait et al., who found lower frequency of CDKN2A deletion in grade-II tumors (27.3%) when compared to grade-III tumors (30%), although the difference was not statistically significant [41].
In addition, in order to validate our findings, we investigated the frequency of these specific alterations in large-scale available glioma database (http://www.cbioportal.org), which includes TCGA (The Cancer Genome Atlas) datasets. Thus, we compiled the data obtained and compared the frequencies with our results. In general, the alterations pattern described in our analysis correspond to that found in these datasets. While PTEN alterations (mutation and deletion) were detected predominantly in HGG (346/1310 cases, 26.4%) when compared to LGG (29/847 cases, 3.4%), the frequency of TP53 alterations was similar in these two groups (LGG (350/847 cases, 41.3% against HGG (426/1310 cases, 32.5%)), supporting our experimental data. On the other hand, concerning CDKN2A deletion, we found a different situation, since this alteration was found mainly in HGG (426/2114 cases, 53.9%), while in LGG was identified in 8.9% (67/750) of samples, suggesting that this is a late event in progression of gliomas and is involved in tumor malignancy. However, as previously mentioned, published data on CDKN2A deletion in gliomas are still conflicting, and further studies are needed to clarify the timing of changes in this gene in the progression of glial tumors. It is also important to report that, according to the TCGA dataset, TP53, PTEN, and CDKN2A alterations (mutation and deletion) are more prevalent in gliomas derived from astrocytic lineage, which confirms our results, since we found a significant association of these genes alterations with astrocytomas.
Most of our glioma samples harbored alterations in at least one gene (40/62 cases, 64.5%). The most frequent aberrations detected were concomitant deletion of PTEN and CKDN2A genes (9/40 cases, 22.5%), followed by simultaneous alterations in all three genes (7/40 cases, 17.5%), individual changes in TP53, PTEN, and CDKN2A (6/40 cases each, 15%), co-alteration of TP53 and CKDN2A (5/40 cases, 12.5%), and co-alteration of TP53 and PTEN genes (1/40 cases, 2.5%). Stankovic et al. had similar findings, since in their analyses of 30 glioma samples, 27 presented abnormalities in either one of TP53, PTEN, and CDKN2A genes (90%) [7]. In addition, among these 27 samples that showed alterations, it was observed a higher frequency of co-alteration in PTEN and CDKN2A genes (29.6%), followed by alterations of all three genes (18.5%), co-alteration in TP53 and CDKN2A (14.8%), and concomitant deletion of TP53 and PTEN genes (3.7%).
Overall, a strong association was noted for the co-occurrence of PTEN and CDKN2A deletions (p = 0.0022). Similarly, significant association was found for the co-alterations of TP53 and CDKN2A (p = 0.0424). However, no significant association was detected between TP53 and PTEN alterations (p = 0.5879). These findings are similar to other studies that found an association for the co-occurrence of PTEN and CDKN2A deletions [7,33] and/or TP53 and CDKN2A alterations in gliomas [15,51], while concomitants TP53 and PTEN alterations were less frequent [7,52,53].
When tumor grade was evaluated, a significant increase in the number of co-occurrence of genetic alterations in the three genes was detected, according to increase of WHO grade (p = 0.0408), and supporting previous reports [33,37], suggesting that combined alterations are involved in malignant tumor progression. Although it was observed that co-occurrence of PTEN and CDKN2A losses (both heterozygous and homozygous deletion) were detected in higher frequency in HGG, LGG showed a frequency of individual CDKN2A deletion similar to that observed in more aggressive tumors, while the presence of individual PTEN deletion was significantly higher in more aggressive tumors, suggesting that allelic loss of CDKN2A is a prior event to PTEN alterations.
Although much have been reported on the presence of genetic alterations in TP53, PTEN, and CDKN2A genes in several tumor types, few studies have focused on the analysis of the incidence of co-alterations of these three genes, through different types of mechanisms which lead to loss of protein function, such as mutations and deletions, in a single sample of gliomas. Our results demonstrated the presence of simultaneous alterations of these genes and association with different clinical-pathological variables of the patients, evidencing its importance in the development and progression of gliomas. In summary, all the alterations detected in our study were associated with astrocytic phenotype and older age. In addition, an important finding of our results is the higher prevalence of heterozygous deletion when compared to homozygous deletion, and since these changes have rarely occurred simultaneously with mutations in these genes, which could inactivate the second allele, supporting the “two-hit” idea of cancer development, we suggest that heterozygous allele loss are fundamental in the development of the tumors analyzed. Further, our findings indicate that TP53 changes and CDKN2A deletions tend to coexist in LGG, suggesting that they are early events in progression of these tumors, as well as CDKN2A and PTEN deletions, since a significant association was observed, with CDKN2A changes preceding PTEN deletions, that are involved with malignant progression of gliomas.

4. Materials and Methods

4.1. Patients and Tissue Samples

All subjects gave their informed consent for inclusion before they participated in the study. The study was conducted in accordance with the Declaration of Helsinki, and the protocol was approved by the Ethics Committee of Instituto Evandro Chagas (Belém, Brazil) under the code CAA 01698912.7.3002.5550 (11 April 2014). Tumor samples were obtained fresh at the time of surgery at the Hospital Ophir Loyola (Belém, PA, Brazil) and transported to the Laboratório de Cultura de Tecidos e Citogenética in Instituto Evandro Chagas (IEC) (Ananideua, PA, Brazil). Biopsies were divided in two parts and used for DNA extraction and cell culture.
The samples were collected before the publication of the updated WHO classification in 2016. Clinical features of patients’ samples are shown in Table 7. All cases were histologically graded and classified according to the 2007 WHO classification for CNS tumors. We examined a total of 69 gliomas, including 2 subependymal giant cell astrocytoma (WHO grade I), 9 pilocytic astrocytomas (WHO grade I), 2 pilomyxoid astrocytoma (WHO grade II), 1 pleomorphic xanthoastrocytoma (WHO grade II), 9 diffuse astrocytomas (WHO grade II), 6 anaplastic astrocytomas (WHO grade III), 22 gliobastomas (WHO grade IV), 2 gliosarcomas (WHO grade IV), 2 oligoastrocytoma (WHO grade II), 2 anaplastic oligoastrocytomas (WHO grade III), 3 oligodendrogliomas (WHO grade II), 1 anaplastic oligodendrogliomas (WHO grade III), 4 ependymomas (WHO grade II), and 4 anaplastic ependymomas (WHO grade III). Clinical parameters including age and gender were collected.

4.2. DNA Extraction

High molecular weight DNA was isolated from the tumor samples using the Illustra Tissue and Cells GenomicPrep Mini Spin Kit (GE Healthcare Life Science, (Little Chalfont, Buckinghamshire, UK). The concentration and purity of DNA was evaluated by agarose gel electrophoresis and by Nanodrop ND-2000 Spectrophotometer (Thermo Scientific, Waltham, Massachusetts, USA). The absorbance ratio at 260 nm and 280 nm, as well as the ratio absorbance at 260 nm and 230 nm, were analyzed as measures of quantity and quality of the DNA extracted.

4.3. Single-Strand Conformational Polymorphism (SSCP) Analysis

Exons 4–11 of TP53 gene and 5–7 of PTEN gene were separately amplified by PCR using specific sets of primers (Table 8 and Table 9). The primers used in this study were developed with support of the specialized software programs Primer3, Blat, and AutoDimer. PCR reactions were carried out in a total volume of 25 μL, using concentrations of 0.1 μM of deoxynucleotide triphosphate, 1.5 μM of MgCl2, 0.1 μM of each of the primers (forward and reverse), 50 mM of KCl, 1 U of Taq polymerase, and 100 ng/μL of sample DNA. PCR conditions for the genes amplification were: Initial denaturation at 95 °C for 5 min, 35 cycles at 95 °C for 1 min, annealing at specific temperature for each primer (Table 1) for 1 min, and 72 °C for 50 s, with a final extension of 8 min at 72 °C. PCR reactions were analyzed in 1.5% nondenaturing agarose gel.
After PCR amplification, the products were submitted to a 95 °C denaturing condition for 5 min and stabilized the single strands with a thermal shock on ice. Electrophoresis in a polyacrylamide gel with different conditions of concentration, voltage, and time of running were performed for each exon, and then silver-stained and prepared to be analyzed. In order to validate the efficiency of SSCP, we decided to sequence one of the positive cases for mobility shifts in polyacrylamide gel. The PCR product was sequenced using the Big Dye Terminator kit (v3.1, Applied Biosystems, Foster City, CA, USA) following manufacturer specifications. The ABI PRISM 3130 Genetic Analyzer (Applied Biosystems) was utilized to read the sequences. The software programs Chromas Lite (v2.1.1) and BioEdit (v7.2.5) were used for sequence analysis.

4.4. Array-Comparative Genomic Hybridization (aCGH)

aCGH analyses were carried out using the oligonucleotide-based SurePrint G3 Human Genome CGH + SNP Microarray kit 4 × 180 K (Agilent Technologies, CA, USA), as described by the manufacturer instructions. Briefly, 1 µg of reference DNA (Agilent Euro Male/Female) and patient DNA were digested and labeled using the SureTag DNA Labeling kit (Agilent Technologies). Fragmented DNAs were labeled with Cy3 (reference DNA) and Cy5 (test samples) fluorescent dUTP, respectively. Purification columns were used to remove the unincorporated nucleotides and dyes.
After purification, labeled sample and reference DNA were co-hybridized at 65 °C at 20 rpm for 24 h on the array slides, and scanned with Agilent G2565CA Microarray Scanner System. Features were normalized and extracted using feature extraction software (v11.1). Data were analyzed and visualized by Cytogenomics software (v2.7). For calling genomic imbalances, we applied the statistical algorithm ADM-2 with a sensitivity threshold of 6.0. A minimum of three-probe for aberration was used for filter. The log2 ratio of Cy3:Cy5 signal intensities was used by the program to consider a variation as a loss or a gain, with reasons ≤ −0.25 reasons considered loss. The log2 ratio of < −1.0 at the region of interest was considered to represent a homozygous deletion.

4.5. Fluorescence In Situ Hybridization (FISH)

Cell suspensions were obtained from primary cultures using standard techniques (hypotonic treatment and methanol/acetic acid fixation). Interphase FISH (iFISH) was used to confirm and validate the aCGH results. In addition, this approach was used in samples which the aCGH analyses was not possible. Dual color iFISH experiments with commercially available probes were used according to standard procedures and/or to manufacturer’s instructions: TP53/CEN 17 Dual Color Probe (ZytoVision GmbH, Germany), PTEN/CEN 10 Dual Color Probe (ZytoVision GmbH, Germany), CDKN2A/CEN 9 Dual Color Probe (ZytoVision GmbH, Germany). Cells were counterstained with DAPI (4′,6-diamidino-2-phenylindole) and the slides were analyzed using a fluorescence microscope (AxioImager.Z1 mot, Zeiss) equipped with appropriate filter sets. The images were captured by a sensitive CCD camera and the result was processed by ISIS imaging system (MetaSystems, Altlußheim, Germany). In each sample, hybridization signals of at least 200 tumor cell interphase nuclei were counted. When ≥10% of the nuclei showed a decreased number of fluorescent signals of locus specific probe with respect to normal diploid cells, it was considered a loss event. For statistical value analyses, monosomy was included as heterozygous allelic loss.

4.6. Statistical Analysis

Microsoft Excel and Bioestat 5.3 were used to annotate information in the form of databases and to apply descriptive statistics, respectively. To compare the frequencies and mean scores of each group, noting possible statistical differences, parametric statistics tests (analysis of variance, student’s t-test) and non-parametric statistics tests (Fisher exact, chi-square, binomial proportion, poisson) were used, respectively. Additionally, simple logistic regression and partial correlation test were evaluated to reveal correlation between molecular alterations and variables of the experiments. The results were considered statistically significant when p values were ≤ 0.05.

Author Contributions

Conceptualization, I.A.P. and E.H.C.d.O.; methodology, I.A.P., C.K.A., W.A.S.F., J.R.B. and F.S.; software, I.A.P., E.H.C.d.O. and T.L.; validation, I.P., M.O., B.M., and T.L.; formal analysis, I.A.P.; investigation, I.A.P.; resources, I.A.P., B.M., T.L. and E.H.C.d.O.; writing—original draft preparation, I.A.P.; writing—review and editing, I.A.P. and E.H.C.d.O.; visualization, I.A.P. and E.O.; supervision, T.L. and E.H.C.d.O.

Funding

This research was funded partially by Fundação de Amparo à Pesquisa do Estado do Pará (FAPESPA, Belém, PA) (ICAAF 075/2014).

Acknowledgments

Authors are grateful to Instituto Evandro Chagas (Ananindeua, PA, Brazil), Fundação de Amparo à Pesquisa do Estado do Pará (FAPESPA, Belém, PA), Pró-Reitoria de Pesquisa e Pós-Graduação (PROPESP/UFPA, Belém, PA), Laboratório de Biologia Molecular Francisco M. Salzano (UFPA, Belém) and Jena University (Jena, Germany) for financial and technical support; to the Hospital Ophir Loyola (Belém, PA) and the patient’s family for the consent to participate in this project; to CNPq/DAAD for Igor A. Pessoa’s scholarship.

Conflicts of Interest

The authors declare no conflict of interest.

References

  1. Persaud-Sharma, D.; Burns, J.; Trangle, J.; Moulik, S. Disparities in Brain Cancer in the United States: A Literature Review of Gliomas. Med. Sci. 2017, 5, 16. [Google Scholar] [CrossRef]
  2. Alfonso, J.C.L.; Talkenberger, K.; Seifert, M.; Klink, B.; Hawkins-Daarud, A.; Swanson, K.R.; Hatzikirou, H.; Deutsch, A. The biology and mathematical modelling of glioma invasion: A review. J. R. Soc. Interface 2017, 14, 20170490. [Google Scholar] [CrossRef] [PubMed]
  3. Karsy, M.; Guan, J.; Cohen, A.L.; Jensen, R.L.; Colman, H. New Molecular Considerations for Glioma: IDH, ATRX, BRAF, TERT, H3 K27M. Curr. Neurol. Neurosci. Rep. 2017, 17, 19. [Google Scholar] [CrossRef] [PubMed]
  4. Massara, M.; Persico, P.; Bonavita, O.; Mollica, P.V.; Locati, M.; Simonelli, M.; Bonecchi, R. Neutrophils in Gliomas. Front. Immunol. 2017, 8, 1349. [Google Scholar] [CrossRef] [Green Version]
  5. Chen, R.; Smith-Cohn, M.; Cohen, A.L.; Colman, H. Glioma Subclassifications and Their Clinical Significance. Neurotherapeutics 2017, 14, 284–297. [Google Scholar] [CrossRef] [Green Version]
  6. Louis, D.N.; Perry, A.; Reifenberger, G.; Deimling, A.; Figarella-Branger, D.; Cavenee, W.K.; Ohgaki, H.; Wiestler, O.D.; Kleihues, P.; Ellison, D.W. The 2016 World Health Organization Classification of Tumors of the Central Nervous System: A summary. Acta Neuropathol. 2016, 131, 803–820. [Google Scholar] [CrossRef]
  7. Stankovic, T.; Milinkovic, V.; Bankovic, J.; Dinic, J.; Tanic, N.; Dramicanin, T.; Tanic, N. Comparative analyses of individual and multiple alterations of p53, PTEN and p16 in non-small cell lung carcinoma, glioma and breast carcinoma samples. Biomed. Pharmacother. 2014, 68, 521–526. [Google Scholar] [CrossRef]
  8. Takami, H.; Yoshida, A.; Fukushima, S.; Arita, H.; Matsushita, Y.; Nakamura, T.; Ohno, M.; Miyakita, Y.; Shibui, S.; Narita, Y.; et al. Revisiting TP53 mutations and immunohistochemistry—A comparative study in 157 diffuse gliomas. Brain Pathol. 2015, 25, 256–265. [Google Scholar] [CrossRef] [PubMed]
  9. Han, F.; Hu, R.; Yang, H.; Liu, J.; Sui, J.; Xiang, X.; Wang, F.; Chu, L.; Song, S. PTEN gene mutations correlate to poor prognosis in glioma patients: A meta-analysis. Oncol. Targets Ther. 2016, 9, 3485–3492. [Google Scholar]
  10. Hill, V.K.; Kim, J.S.; James, C.D.; Waldman, T. Correction of PTEN mutations in glioblastoma cell lines via AAV-mediated gene editing. PLoS ONE 2017, 12, e0176683. [Google Scholar] [CrossRef] [PubMed]
  11. Liggett, W.H.; Sidransky, D. Role of the p16 tumor suppressor gene in cancer. J. Clin. Oncol. 1998, 16, 1197–1206. [Google Scholar] [CrossRef]
  12. Ruas, M.; Peters, G. The p16INK4a/CDKN2A tumor suppressor and its relatives. Biochim. Biophys. Acta 1998, 1378, F115–F177. [Google Scholar] [CrossRef]
  13. Quelle, D.E.; Zindy, F.; Ashmun, R.A.; Sherr, C.J. Alternative reading frames of the INK4a tumor suppressor gene encode two unrelated proteins capable of inducing cell cycle arrest. Cell 1995, 83, 993–1000. [Google Scholar] [Green Version]
  14. Ivanchuk, S.M.; Mondal, S.; Dirks, P.B.; Rutka, J.T. The INK4A/ARF locus: Role in cell cycle control and apoptosis and implications for glioma growth. J. Neurooncol. 2001, 51, 219–229. [Google Scholar] [CrossRef]
  15. Purkait, S.; Jha, P.; Sharma, M.C.; Suri, V.; Sharma, M.; Kale, S.S.; Sarkar, C. CDKN2A deletion in pediatric versus adult glioblastomas and predictive value of p16 immunohistochemistry. Neuropathology 2013, 33, 405–412. [Google Scholar] [CrossRef]
  16. Jagannathan, J.; Oskouian, R.J.; Yeoh, H.K.; Saulle, D.; Dumont, A.S. Molecular biology of unreresectable meningiomas: Implications for new treatments and review of the literature. Skull Base 2008, 18, 173–187. [Google Scholar] [CrossRef]
  17. Nikiforova, M.N.; Wald, A.I.; Melan, M.A.; Roy, S.; Zhong, S.; Hamilton, R.L.; Lieberman, F.S.; Drappatz, J.; Amankulor, N.M.; Pollack, I.F.; et al. Targeted next-generation sequencing panel (GlioSeq) provides comprehensive genetic profiling of central nervous system tumors. Neuro Oncol. 2016, 18, 379–387. [Google Scholar] [CrossRef] [PubMed]
  18. Zacher, A.; Kaulich, K.; Stepanow, S.; Wolter, M.; Köhrer, K.; Felsberg, J.; Malzkorn, B.; Reifenberger, G. Molecular Diagnostics of Gliomas Using Next Generation Sequencing of a Glioma-Tailored Gene Panel. Brain Pathol. 2017, 27, 146–159. [Google Scholar] [CrossRef] [PubMed]
  19. Diamandis, P.; Aldape, K.D. Insights from Molecular Profiling of Adult Glioma. J. Clin. Oncol. 2017, 35, 2386–2393. [Google Scholar] [CrossRef]
  20. Ludwig, K.; Kornblum, H.I. Molecular markers in glioma. J. Neurooncol. 2017, 134, 505–512. [Google Scholar] [CrossRef] [PubMed]
  21. Jesionek-Kupnicka, D.; Szybka, M.; Malachowska, B.; Fendler, W.; Potemski, P.; Piaskowski, S.; Jaskolski, D.; Papierz, W.; Skowronski, W.; Och, W.; et al. TP53 Promoter Methylation in Primary Glioblastoma: Relationship with TP53 mRNA and Protein Expression and Mutation Status. DNA Cell Biol. 2014, 33, 217–226. [Google Scholar] [CrossRef] [PubMed]
  22. Wang, Y.Y.; Zhang, T.; Li, S.W.; Qian, T.Y.; Fan, X.; Peng, X.X.; Ma, J.; Wang, L.; Jiang, T. Mapping p53 Mutations in Low-Grade Glioma: A Voxel-Based Neuroimaging Analysis. AJNR Am. J. Neuroradiol. 2015, 36, 70–76. [Google Scholar] [CrossRef]
  23. Halldórsdóttir, A.M.; Lundin, A.; Murray, F.; Mansouri, L.; Knuutila, S.; Sundström, C.; Laurell, A.; Ehrencrona, H.; Sander, B.; Rosenquist, R. Impact of TP53 mutation and 17p deletion in mantle cell lymphoma. Leukemia 2011, 25, 1904–1908. [Google Scholar] [CrossRef] [Green Version]
  24. Liu, Y.; Chen, C.; Xu, Z.; Scuoppo, C.; Rillahan, C.D.; Gao, J.; Spitzer, B.; Bosbach, B.; Kastenhuber, E.R.; Baslan, T.; et al. Deletions linked to TP53 loss drive cancer through p53-independent mechanisms. Nature 2016, 531, 471–475. [Google Scholar] [CrossRef] [Green Version]
  25. Malcikova, J.; Smardova, J.; Rocnova, L.; Tichy, B.; Kuglik, P.; Vranova, V.; Cejkova, S.; Svitakova, M.; Skuhrova, F.H.; Brychtova, Y.; et al. Monoallelic and biallelic inactivation of TP53 gene in chronic lymphocytic leukemia: Selection, impact on survival, and response to DNA damage. Blood 2009, 114, 5307–5314. [Google Scholar] [CrossRef] [PubMed]
  26. Gillet, E.; Alentorn, A.; Doukouré, B.; Mundwiller, E.; van Thuijl, H.F.; Reijneveld, J.C.; Medina, J.A.; Liou, A.; Marie, Y.; Mokhtari, K.; et al. TP53 and p53 statuses and their clinical impact in diffuse low grade gliomas. J. Neurooncol. 2014, 118, 131–139. [Google Scholar] [PubMed]
  27. Wiencke, J.K.; Zheng, S.; Jelluma, N.; Tihan, T.; Vandenberg, S.; Tamgüney, T.; Baumber, R.; Parsons, R.; Lamborn, K.R.; Berger, M.S.; et al. Methylation of the PTEN promoter defines low-grade gliomas and secondary glioblastoma. Neuro Oncol. 2007, 9, 271–279. [Google Scholar] [CrossRef] [PubMed] [Green Version]
  28. Cryan, J.B.; Haidar, S.; Ramkissoon, L.A.; Bi, W.L.; Knoff, D.S.; Schultz, N.; Abedalthagafi, M.; Brown, L.; Wen, P.Y.; Reardon, D.A.; et al. Clinical multiplexed exome sequencing distinguishes adult oligodendroglial neoplasms from astrocytic and mixed lineage gliomas. Oncotarget 2014, 5, 8083–8092. [Google Scholar] [CrossRef]
  29. Yang, Y.; Shao, N.; Luo, G.; Li, L.; Zheng, L.; Nilsson-Ehle, P.; Xu, N. Mutations of PTEN Gene in Gliomas Correlate to Tumor Differentiation and Short-term Survival Rate. Anticancer Res. 2010, 30, 981–985. [Google Scholar]
  30. Bleeker, F.E.; Lamba, S.; Zanon, C.; Molenaar, R.J.; Hulsebos, T.J.; Troost, D.; van Tilborg, A.A.; Vandertop, W.P.; Leenstra, S.; van Noorden, C.J.; et al. Mutational profiling of kinases in glioblastoma. BMC Cancer 2014, 14, 718. [Google Scholar] [CrossRef]
  31. Tang, C.; Guo, J.; Chen, H.; Yao, C.J.; Zhuang, D.X.; Wang, Y.; Tang, W.J.; Ren, G.; Yao, Y.; Wu, J.S.; et al. Gene mutation profiling of primary glioblastoma through multiple tumor biopsy guided by 1H-magnetic resonance spectroscopy. Int. J. Clin. Exp. Pathol. 2015, 8, 5327–5335. [Google Scholar]
  32. Yakut, T.; Gutenberg, A.; Bekar, A.; Egeli, U.; Gunawan, B.; Ercan, I.; Tolunay, S.; Doygun, M.; Schulten, H.J. Correlation of chromosomal imbalances by comparative genomic hybridization and expression of EGFR, PTEN, p53, and MIB-1 in diffuse gliomas. Oncol. Rep. 2007, 17, 1037–1043. [Google Scholar] [CrossRef]
  33. Jeuken, J.W.; Sijben, A.; Bleeker, F.E.; Boots-Sprenger, S.H.; Rijntjes, J.; Gijtenbeek, J.M.; Mueller, W.; Wesseling, P. The Nature and Timing of Specific Copy Number Changes in the Course of Molecular Progression in Diffuse Gliomas: Further Elucidation of Their Genetic “Life Story”. Brain Pathol. 2011, 21, 308–320. [Google Scholar] [CrossRef]
  34. Srividya, M.R.; Thota, B.; Shailaja, B.C.; Arivazhagan, A.; Thennarasu, K.; Chandramouli, B.A.; Hegde, A.S.; Santosh, V. Homozygous 10q23/PTEN deletion and its impact on outcome in glioblastoma: A prospective translational study on a uniformly treated cohort of adult patients. Neuropathology 2011, 31, 376–383. [Google Scholar] [CrossRef] [PubMed]
  35. Idbaih, A.; Dalmasso, C.; Kouwenhoven, M.; Jeuken, J.; Carpentier, C.; Gorlia, T.; Kros, J.M.; French, P.; Teepen, J.; Broët, P.; et al. Genomic aberrations associated with outcome in anaplastic oligodendroglial tumors treated within the EORTC phase III trial 26951. J. Neurooncol. 2011, 103, 221–230. [Google Scholar] [CrossRef] [PubMed]
  36. Sabha, N.; Knobbe, C.B.; Maganti, M.; Omar, S.; Bernstein, M.; Cairns, R.; Çako, B.; von Deimling, A.; Capper, D.; Mak, T.W.; et al. Analysis of IDH mutation,1p/19q deletion, and PTEN loss delineates prognosis in clinical low-grade diffuse gliomas. Neuro Oncol. 2014, 16, 914–923. [Google Scholar] [CrossRef] [PubMed]
  37. Bidinotto, L.T.; Torrieri, R.; Mackay, A.; Almeida, G.C.; Viana-Pereira, M.; Cruvinel-Carloni, A.; Spina, M.L.; Campanella, N.C.; Pereira de Menezes, W.; Clara, C.A.; et al. Copy Number Profiling of Brazilian Astrocytomas. G3 2016, 6, 1867–1878. [Google Scholar] [CrossRef] [Green Version]
  38. Smith, J.S.; Tachibana, I.; Passe, S.M.; Huntley, B.K.; Borell, T.J.; Iturria, N.; O’Fallon, J.R.; Schaefer, P.L.; Scheithauer, B.W.; James, C.D.; et al. PTEN Mutation, EGFR Amplification, and Outcome in Patients with Anaplastic Astrocytoma and Glioblastoma Multiforme. J. Natl. Cancer Inst. 2001, 93, 1246–1256. [Google Scholar] [CrossRef]
  39. Dubbink, H.J.; Atmodimedjo, P.N.; Kros, J.M.; French, P.J.; Sanson, M.; Idbaih, A.; Wesseling, P.; Enting, R.; Spliet, W.; Tijssen, C.; et al. Molecular classification of anaplastic oligodendroglioma using next-generation sequencing: A report of the prospective randomized EORTC Brain Tumor Group 26951 phase III trial. Neuro Oncol. 2016, 18, 388–400. [Google Scholar] [CrossRef]
  40. Pollack, I.F.; Hamilton, R.L.; James, C.D.; Finkelstein, S.D.; Burnham, J.; Yates, A.J.; Holmes, E.J.; Zhou, T.; Finlay, J.L.; Children’s Oncology Group. Rarity of PTEN deletions and EGFR amplification in malignant gliomas of childhood: Results from the Children’s Cancer Group 945 cohort. J. Neurosurg. 2006, 105, 418–424. [Google Scholar]
  41. Purkait, S.; Sharma, V.; Jha, P.; Sharma, M.C.; Suri, V.; Suri, A.; Sharma, B.S.; Sarkar, C. EZH2 expression in gliomas: Correlation with CDKN2A gene deletion/ p16 loss and MIB-1 proliferation index. Neuropathology 2015, 35, 421–431. [Google Scholar] [CrossRef]
  42. Reis, G.F.; Pekmezci, M.; Hansen, H.M.; Rice, T.; Marshall, R.E.; Molinaro, A.M.; Phillips, J.J.; Vogel, H.; Wiencke, J.K.; Wrensch, M.R.; et al. CDKN2A Loss Is Associated with Shortened Overall Survival in Lower Grade (World Health Organization II-III) Astrocytomas. J. Neuropathol. Exp. Neurol. 2015, 74, 442–452. [Google Scholar] [CrossRef]
  43. Kogiso, M.; Qi, L.; Lindsay, H.; Huang, Y.; Zhao, X.; Liu, Z.; Braun, F.K.; Du, Y.; Zhang, H.; Bae, G.; et al. Xenotransplantation of pediatric low grade gliomas confirms the enrichment of BRAF V600E mutation and preservation of CDKN2A deletion in a novel orthotopic xenograft mouse model of progressive pleomorphic xanthoastrocytoma. Oncotarget 2017, 8, 87455–87471. [Google Scholar] [CrossRef] [Green Version]
  44. Fan, Y.; Yue, J.; Xiao, M.; Han-Zhang, H.; Wang, Y.V.; Ma, C.; Deng, Z.; Li, Y.; Yu, Y.; Wang, X.; et al. FXR1 regulates transcription and is required for growth of human cancer cells with TP53/FXR2 homozygous deletion. Elife 2017, 6, e26129. [Google Scholar] [CrossRef] [PubMed]
  45. Nakajima, N.; Nobusawa, S.; Nakata, S.; Nakada, M.; Yamazaki, T.; Matsumura, N.; Harada, K.; Matsuda, H.; Funata, N.; Nagai, S.; et al. BRAF V600E, TERT promoter mutations and CDKN2A/B homozygous deletions are frequent in epithelioid glioblastomas: A histological and molecular analysis focusing on intratumoral heterogeneity. Brain Pathol. 2018, 28, 663–673. [Google Scholar] [CrossRef] [PubMed]
  46. Knudson, A.G. Two genetic hits (more or less) to cancer). Nat. Rev. Cancer 2001, 1, 157–162. [Google Scholar] [CrossRef]
  47. Picanço-Albuquerque, C.G.; Morais, C.L.; Carvalho, F.L.; Peskoe, S.B.; Hicks, J.L.; Ludkovski, O.; Vidotto, T.; Fedor, H.; Humphreys, E.; Han, M.; et al. In prostate cancer needle biopsies, detections of PTEN loss by fluorescence in situ hybridization (FISH) and by immunohistochemistry (IHC) are concordant and show consistent association with upgrading. Virchows Arch. 2016, 468, 607–617. [Google Scholar] [CrossRef]
  48. Vidotto, T.; Tiezzi, D.G.; Squire, J.A. Distinct subtypes of genomic PTEN deletion size influence the landscape of aneuploidy and outcome in prostate cancer. Mol. Cytogenet. 2018, 11, 1. [Google Scholar] [CrossRef] [PubMed]
  49. Sun, Z.; Huang, C.; He, J.; Lamb, K.L.; Kang, X.; Gu, T.; Shen, W.H.; Yin, Y. PTEN C-terminal deletion causes genomic instability and tumor development. Cell Rep. 2014, 6, 844–854. [Google Scholar] [CrossRef] [PubMed]
  50. Kluth, M.; Harasimowicz, S.; Burkhardt, L.; Grupp, K.; Krohn, A.; Prien, K.; Gjoni, J.; Haß, T.; Galal, R.; Graefen, M.; et al. Clinical significance of different types of p53 gene alteration in surgically treated prostate cancer. Int. J. Cancer. 2014, 135, 1369–1380. [Google Scholar] [CrossRef]
  51. Mistry, M.; Zhukova, N.; Merico, D.; Rakopoulos, P.; Krishnatry, R.; Stavropoulos, M.S.; Alon, N.; Pole, J.D.; Ray, P.N.; Navickiene, V.; et al. BRAF Mutation and CDKN2A Deletion Define a Clinically Distinct Subgroup of Childhood Secondary High-Grade Glioma. J. Clin. Oncol. 2015, 9, 1015–1022. [Google Scholar] [CrossRef] [PubMed]
  52. Kato, H.; Kato, S.; Kumabe, T.; Sonoda, Y.; Yoshimoto, T.; Kato, S.; Han, S.Y.; Suzuki, T.; Shibata, H.; Kanamaru, R.; et al. Functional evaluation of p53 and pten gene mutation in gliomas. Clin. Cancer Res. 2000, 6, 3937–3943. [Google Scholar] [PubMed]
  53. Riemenschneider, M.J.; Jeuken, J.W.; Wesseling, P.; Reifenberger, G. Molecular diagnostics of gliomas: State of the art. Acta Neuropathol. 2010, 120, 567–584. [Google Scholar] [CrossRef] [PubMed]
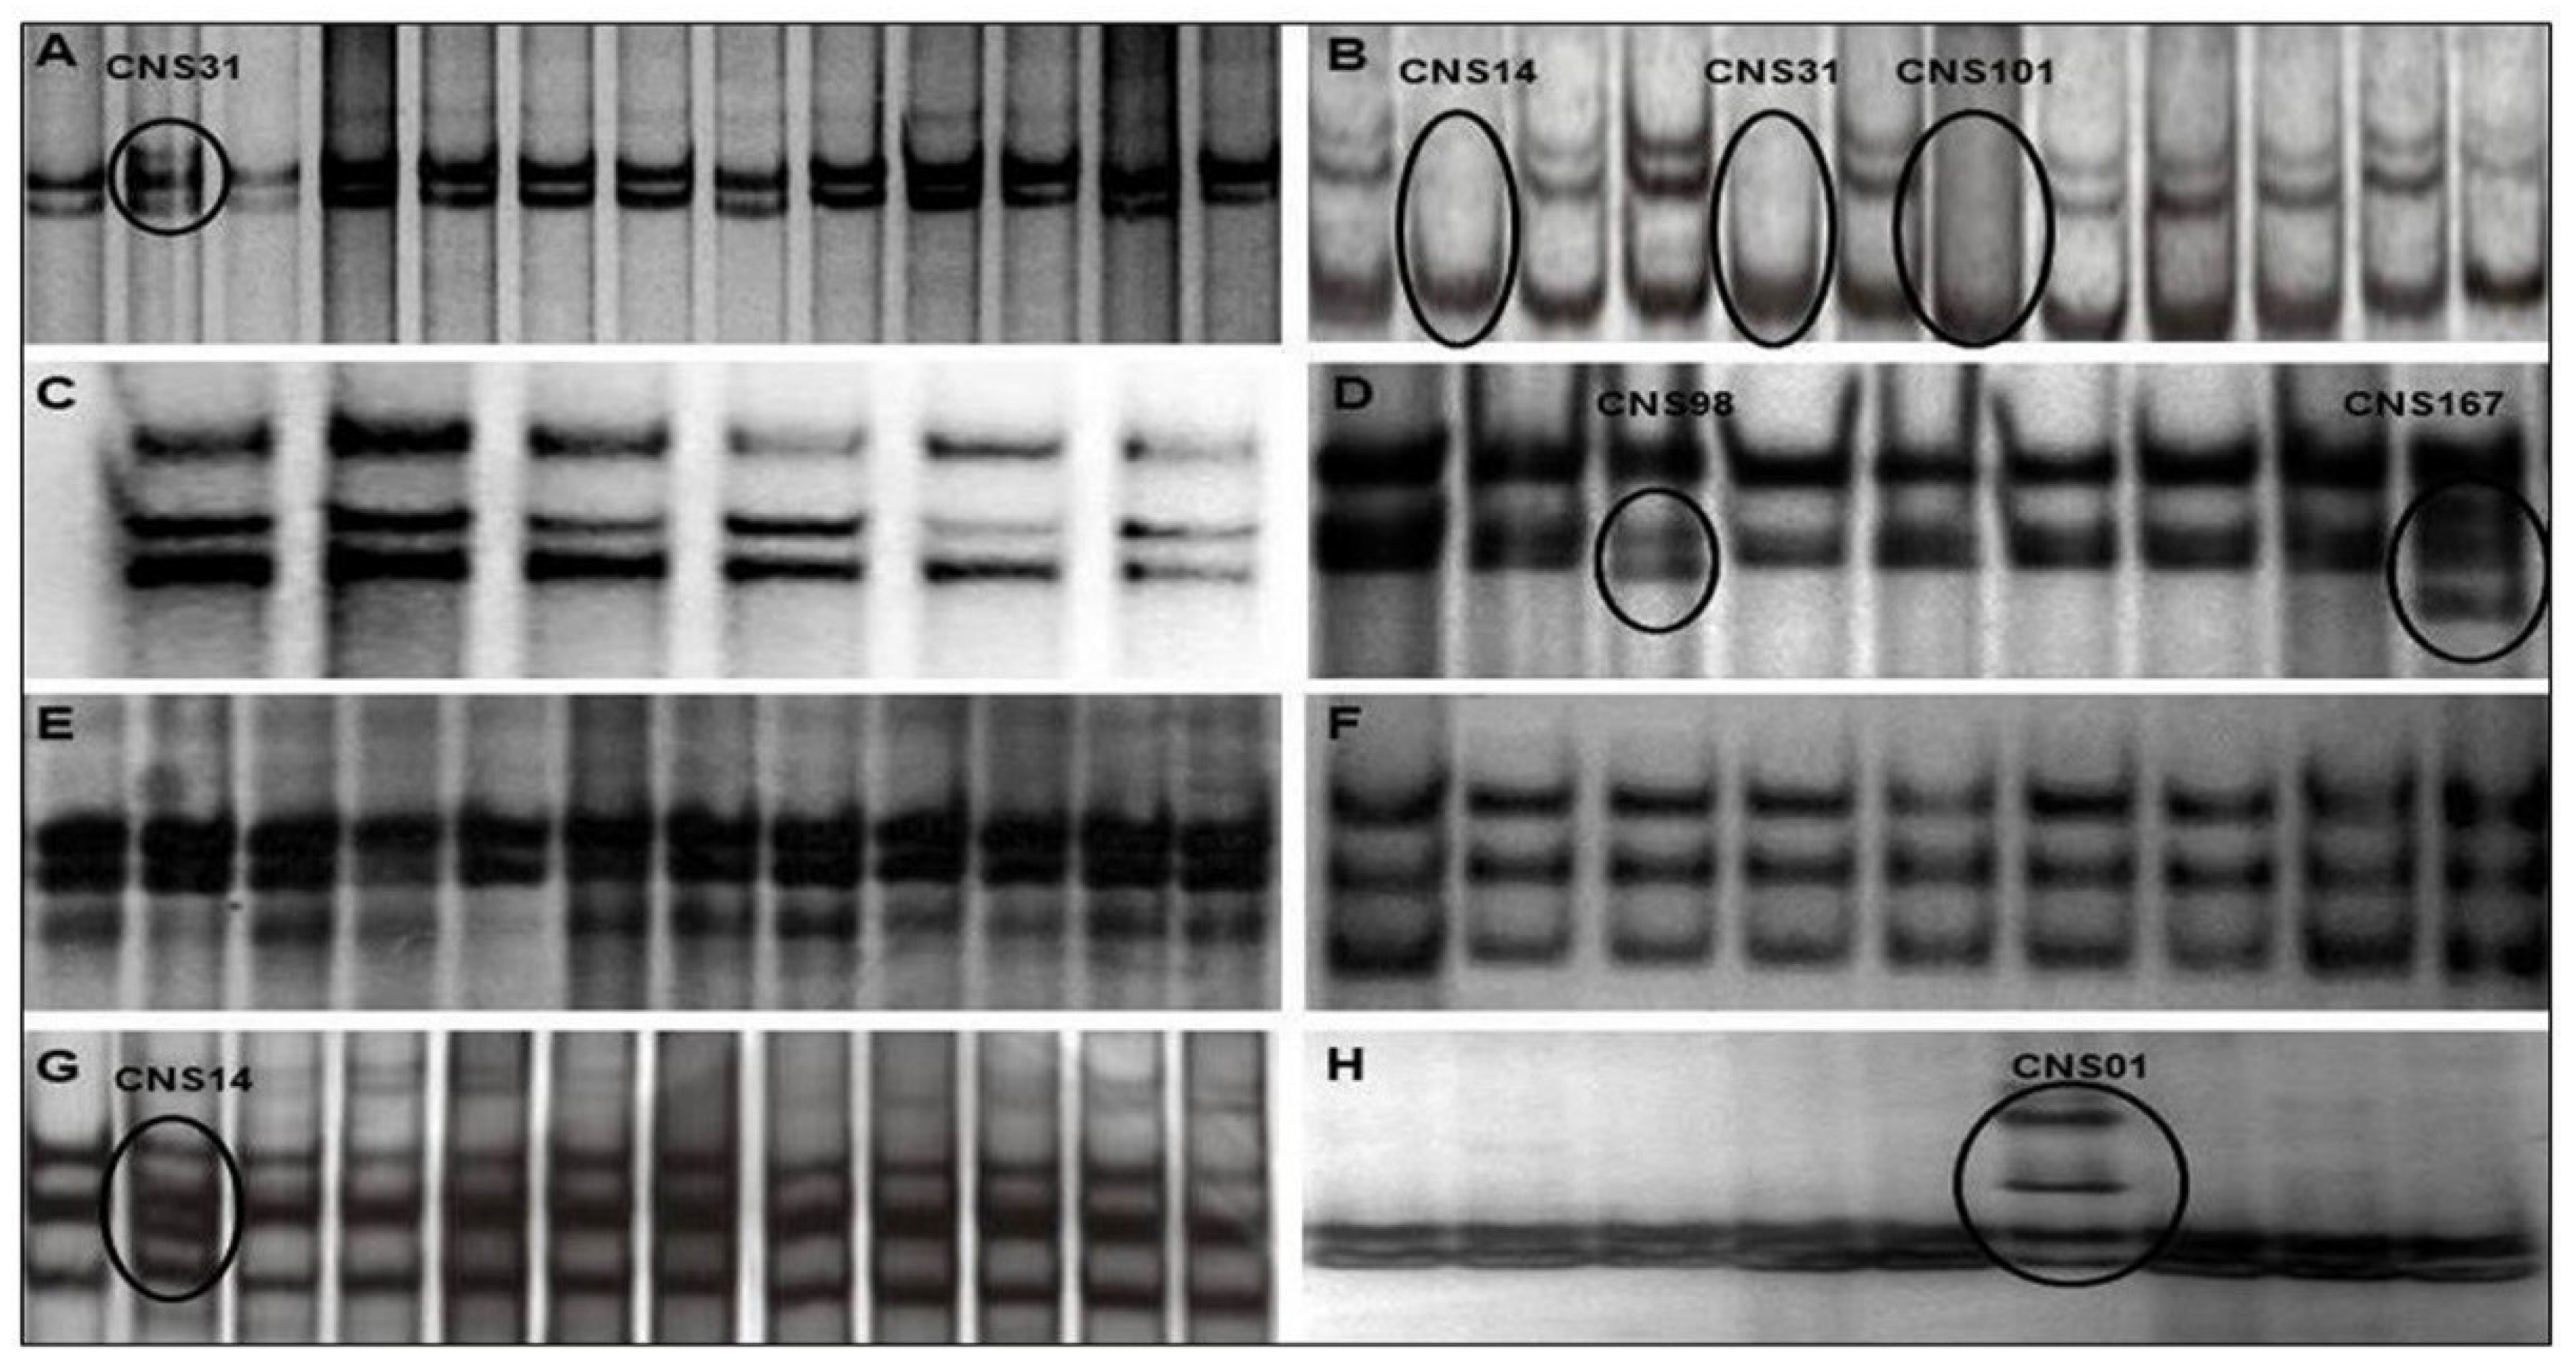
Figure 1. TP53 gene SSCP. The results show in the images (A), (B), (D), (G), and (H) show that some samples presented aberrantly migrated bands in the SSCP, representing the exons 4, 5, 7, 10, and 11 respectively, indicating the presence of changes in these regions, while the analysis of samples for the other exons revealed a monomorphic pattern of migration, as we can see in the images (C), (E), and (F), which represent the exons 6, 8, and 9, respectively.
Ijms 20 02658 g001
Figure 2. Nucleotide changes identified in TP53. (A) G→C polymorphism at codon 72 of exon 4 (Arg/Pro) (B) C→T transition mutation at codon 153 of Exon 5 (Leu/Pro).
Ijms 20 02658 g002
Figure 3. TP53 allelic loss identified by array-comparative genomic hybridization (CGH) (upper line) was confirmed by interphase fluorescence in situ hybridization (iFISH) using LSPs (lower line). Results for two exemplary cases are shown: Image (A) shows heterozygous deletion of TP53 gene; image (B) shows monosomy of chromosome 17. Scale bars = 10 µm.
Ijms 20 02658 g003
Figure 4. PTEN allelic loss identified by array-CGH (upper line) was confirmed by iFISH using LSPs (lower line). Results for two exemplary cases are shown: Image (A) shows heterozygous deletion of PTEN gene; image (B) shows monosomy of chromosome 10.
Ijms 20 02658 g004
Figure 5. Patients’ mean age according to PTEN gene status.
Ijms 20 02658 g005
Figure 6. CDKN2A allelic loss identified by array-CGH (upper line) was confirmed by iFISH using LSPs (lower line). Results for three exemplary cases are shown: Image (A) shows homozygous deletion of CDKN2A gene; image (B) shows heterozygous deletion of CDKN2A gene; image (C) shows monosomy of chromosome 9. Scale bars = 10 µm.
Ijms 20 02658 g006
Figure 7. Patients’ mean age according to CDKN2A gene status.
Ijms 20 02658 g007
Figure 8. Association of TP53, PTEN, and CDKN2A alteration in 40 gliomas.
Ijms 20 02658 g008
Table 1. Comparison of World Health Organization (WHO) grade of malignancy x age.
WHO Histological GradingMean AgeSignificance (p Value)
I11.8Median I and II (p > 0.05)
Median I and III (p < 0.05)
Median I and IV (p < 0.05)
II23.6Median II and III (p < 0.05)
Median II and IV (p < 0.05)
III42.8Median III and IV (p > 0.05)
IV51.7-
Table 2. TP53 mutated gliomas.
SampleTumorWHO GradingGenderAgeExon
CNS 1Subependymal giant cell astrocytomaIM2311
CNS 14GlioblastomaIVF685, 10
CNS 31Analastic astrocytomaIIIF654, 5
CNS 98Diffuse astrocytomaIIM267
CNS 101GlioblastomaIVM795
CNS 167Diffuse astrocytomaIIM147
Table 3. Frequency of TP53 deletion in each histologic and WHO grading group.
TP53All CasesA-IA-IIA-IIIA-IVOD-IIOD-IIIOA-IIOA-IIIED-IIED-III
N%N%N%N%N%N%N%N%N%N%N%
Intact4670.8555.6990466.71666.73100002100150375375
Hom. Del0000000000000000000000
Het. Del1929.2444.4110233.3833.300110000150125125
Total65 9 10 6 24 3 1 2 2 4 4
Hom. Del, homozygous deletion; Het. Del, heterozygous deletion; A, astrocytoma; OD, oligodendroglioma, OA, oligoastrocytoma, ED, ependymoma.
Table 4. Frequency of PTEN deletion in each histologic and WHO grading group.
PTENAll CasesA-IA-IIA-IIIA-IVOD-IIOD-IIIOA-IIOA-IIIED-IIED-III
N%N%N%N%N%N%N%N%N%N%N%
Intact3962.98100777.8583.3626.1266.700210015041004100
Hom. Del0000000000000000000000
Het. Del2337.100222.2116.71773.9133.31100001500000
Total62 8 9 6 23 3 1 2 2 4 4
Hom. Del, homozygous deletion; Het. Del, heterozygous deletion; A, astrocytoma; OD, oligodendroglioma, OA, oligoastrocytoma, ED, ependymoma.
Table 5. Frequency of CDKN2A deletion in each histologic and WHO grading group.
CDKN2AAll CasesA-IA-IIA-IIIA-IVOD-IIOD-IIIOA-IIOA-IIIED-IIED-III
N%N%N%N%N%N%N%N%N%N%N%
Intact3555.6675444.43501041.7266.70021001504100375
Hom. Del812.700222.2116.7520.8000000000000
Het. Del2031.7225333.3233.3937.5133.311000015000125
Total63 8 9 6 24 3 1 2 2 4 4
Hom. Del, homozygous deletion; Het. Del, heterozygous deletion; A, astrocytoma; OD, oligodendroglioma, OA, oligoastrocytoma, ED, ependymoma.
Table 6. Frequency of single and concurrent TP53, PTEN, and CDKN2A alteration by WHO grade of malignancy.
Gene AlterationsWHO Grading
Grade IGrade IIGrade IIIGrade IV
One Gene
TP53 */PTEN/CDKN2A1/8 (12.5%) 1/18 (5.6%)2/13 (15.4%)2/23 (8.7%)
TP53/PTEN */CDKN2A-1/18 (5.6%)-5/23 (21.7%)
TP53/PTEN/CDKN2A*-4/18 (22.2%)1/13 (7.7%)1/23 (4.3%)
Two Genes
TP53*/PTEN */CDKN2A---1/23 (4.3%)
TP53*/PTEN/CDKN2A*2/8 (25%)-2/13 (15.4%)1/23 (4.3%)
TP53/PTEN */CDKN2A*-1/18 (5.6%)2/13 (15.4%)6/23 (26.1%)
Three Genes
TP53*/PTEN */CDKN2A*-1/18 (5.6%)1/13 (7.7%)5/23 (21.7%)
* alterated; - no alteration.
Table 7. Clinical data, molecular, and cytogenetic findings of patient’s samples used in the study.
PatientHistopathologicWHOSexAgeSSCPaCGH + iFISH
TP53PTENTP53PTENCDKN2A
1SGCA1M23mutwtxxx
2DA2F12wtwt-xx
3PA 1M13wtxxxx
4GBM4F68mutxno delno delno del
5GBM 4F64wtx--- -
6PMA2M3wtwtno delno delno del
7GBM 4M65wtx--no del
8OA2M2wtwtno delno delno del
9AA3F55mutwt-no del-
10GBM 4F7wtxno delx- -
11ED2F2xx-no delno del
12AA3M60wtwtno delno del-
13GSA 4M64wtwtno del-no del
14DA 2M37wtxno delno del-
15GBM4M43wtwtno delno delno del
16ED 2F1wtwtno delno delno del
17DA 2F52wtxno delno delno del
18AOA3F63wtwt-no delno del
19ED2M8wtwtno delno delno del
20OD 2M19wtwtno delno delno del
21OD 2F43wtwtno del-no del
22DA 2M26mutxxxx
23GBM 4M79mutx--- -
24AED3F54wtwt-no delno del
25GBM4M15wtx---
26SGCA1M20wtx-no del-
27AA3F23xxno delno delno del
28PA 1F16wtwt-no del-
29AOD 3M61xx---
30PXA 2M26wtwtno delno del- -
31PA 1F3wtx-xx
32PMA 2F2xxno delno delno del
33GBM4F70wtwtno del--
34DA 2F34wtwtno delno delno del
35GBM4M51wtwtno del--
36DA 2M64wtxxxx
37ED2F8wtwtno delno delno del
38AED3M62wtwtno delno del-
39PA 1F27wtwtno delno delno del
40AA3F31wtwt-no del- -
41GBM 4M60wtwtno del-- -
42GBM 4M43wtwt-no del- -
43GBM 4F13xxno del-no del
44DA 2M14mutxno del--
45GBM4M46xxno del--
46GBM4F49xxno del-no del
47OD2F23xxno delno del-
48AA 3M59xxno del--
49GBM4M56xx---
50GBM4M74wtwtno delno del-
51GBM4M48wtwtno del-no del
52GBM4M32xx---
53PA1M7wtwtno delno delno del
54AED3M19wtwtno delno delno del
55PA1F9xxno delno delno del
56GSA4M77wtwt-no delno del
57PA1M2wtwtno delno delno del
58DA2M65wtwtno del--
59AOA3M24wtwtno del--
60AA3M58xxno delno delno del
61OA 2M3wtwtno delno delno del
62DA2M31xxno delno del- -
63GBM4M33xxno delno delno del
64PA1F4xxno delno delno del
65AED3M2xxno delno delno del
66PA1F6xx-no delno del
67GBM4F66xxno del--
68GBM4M43xxno del-no del
69GBM4F74xxno del-no del
AA, anaplastic astrocytoma; AED, anaplastic ependymoma; AOA, anaplastic oligoastrocytoma; AOD, anaplastic oligodendroglioma; DA, diffuse astrocytoma; ED, ependymoma; FA, fibrillary astrocytoma; GBM, glioblastoma; GSA, gliosarcoma; OA, oligoastrocytoma; OD, oligodendroglioma; PA, pilocytic astrocytoma; PMA, pilomyxoid astrocytoma; PXA, pleomorphic xanthoastrocytoma; SGCA, subependymal giant cell astrocytomas; mut, mutated, wt, wild type; x, not available; no del, no deletion.
Table 8. Primers used for TP53 gene.
ExonPrimerPrimer Lenght (bp)Exon Lenght
(pb)
Annealing Temperature (°C)
Exon 4F-5′ TTTCACCCATCTACAGTCCC 3′
R-5′ CATTGAAGTCTCATGGAAGC 3′
20
20
27954
Exon 5F-5′ TTCACTTGTGCCCTGACTT 3′
R-5′ AACCAGCCCTGTCCGTCTC 3′
19
19
18457
Exon 6F-5′ CAGGGCTGGTTGCCCAGGGTCCCCC 3′
R-5′ ACTGACAACCACCCTTAACCCCTCC 3′
25
25
11359
Exon 7F-5′ TGCTTGCCACAGGTCT 3′
R-5′ ACAGCAGGCAGTGT 3′
16
14
11054
Exon 8F-5′ CCACCGCTTCTTGTCCTGC 3′
R-5′ CCTACTGCCTCTTTGCTTC 3′
19
19
13758
Exon 9F-5′ AGGGTGCAGTTATGCCTCAG 3′
R-5′ ACTTGATAAGAGGTCC 3′
20
16
7452
Exon 10F-5′ CTGAGGCACAAGAATCAC 3′
R-5′ TCCTATGGCTTTCCAACC 3′
18
18
10759
Exon 11F-5′ GGAAGGGTCAACATCTTTTACA 3′
R–5′ TAAAAAGGGAGAAGGAGGGG 3′
22
20
128959
Table 9. Primers used for PTEN gene.
ExonPrimerPrimer Lenght (bp)Exon Lenght
(pb)
Annealing Temperature (°C)
Exon 5F-5′ ACCTGTTAAGTTTGTATGCAAC 3′
R-5′ TCTGTTTTCCAATAAATTCTC 3′
22
21
23951
Exon 6F-5′ CTACGACCCAGTTACCATAGCA 3′
R-5′ GGCTTCTTTAGCCCAATGAGTTG 3′
22
23
14259
Exon 7F-5′ TGACAGTTTGACAGTTAAAGG 3′
R-5′ CTCCCAATGAAAGTAAAGTACA 3′
21
22
16753