Article

GmBRC1 is a Candidate Gene for Branching in Soybean (Glycine max (L.) Merrill)

1
Department of Plant Science and Research Institute of Agriculture and Life Sciences, Seoul National University, Seoul 08826, Korea
2
Plant Genomics and Breeding Institute, Seoul National University, Seoul 08826, Korea
3
National Institute of Crop Sciences, Rural Development Administration, Wanju-gun, Jeollabuk-do 55365, Korea
4
Department of Crop Science & Biotechnology, Dankook University, Cheonan-si, Chungcheongnam-do 31116, Korea
5
Bio-Evaluation Center, Korea Research Institute of Bioscience and Biotechnology, Cheongju-si, Chungcheongbuk-do 28116, Korea
6
National Institute of Agricultural Sciences, Rural Development Administration, Jeonju-si, Jeollabuk-do 54874, Korea
*
Author to whom correspondence should be addressed.
Int. J. Mol. Sci. 2019, 20(1), 135; https://doi.org/10.3390/ijms20010135
Submission received: 15 November 2018 / Revised: 24 December 2018 / Accepted: 25 December 2018 / Published: 1 January 2019
(This article belongs to the Special Issue Plant Genetics and Molecular Breeding)

Abstract

:
Branch number is one of the main factors affecting the yield of soybean (Glycine max (L.)). In this study, we conducted a genome-wide association study combined with linkage analysis for the identification of a candidate gene controlling soybean branching. Five quantitative trait nucleotides (QTNs) were associated with branch numbers in a soybean core collection. Among these QTNs, a linkage disequilibrium (LD) block qtnBR6-1 spanning 20 genes was found to overlap a previously identified major quantitative trait locus qBR6-1. To validate and narrow down qtnBR6-1, we developed a set of near-isogenic lines (NILs) harboring high-branching (HB) and low-branching (LB) alleles of qBR6-1, with 99.96% isogenicity and different branch numbers. A cluster of single nucleotide polymorphisms (SNPs) segregating between NIL-HB and NIL-LB was located within the qtnBR6-1 LD block. Among the five genes showing differential expression between NIL-HB and NIL-LB, BRANCHED1 (BRC1; Glyma.06G210600) was down-regulated in the shoot apex of NIL-HB, and one missense mutation and two SNPs upstream of BRC1 were associated with branch numbers in 59 additional soybean accessions. BRC1 encodes TEOSINTE-BRANCHED1/CYCLOIDEA/PROLIFERATING CELL FACTORS 1 and 2 transcription factor and functions as a regulatory repressor of branching. On the basis of these results, we propose BRC1 as a candidate gene for branching in soybean.

1. Introduction

Soybean (Glycine max (L.)) is a major food crop and a rich source of protein and oil in human diet and animal feed. Two cultivation methods with different planting densities are used to maximize soybean yield. The high-density planting method is mainly practiced in the USA [1], where the yield of soybean increases with planting density until saturation. The low-density planting method is practiced in Asia not only to avoid disease and lodging, but also to reduce seed and labor cost; however, the productivity in low-density planting is lower than that in high-density planting [2]. An important factor of low-density planting is branching plasticity, which offsets yield losses [3]. Branching pattern and branch number are dependent on environmental factors such as planting density and light quality [3,4,5]. These factors have obstructed the identification of genes regulating branch development. However, variation in branch number among soybean cultivars of diverse origins under low-density planting suggests the presence of genetic differences [6,7]. Thus, breeding for soybean genotypes with optimal plant architecture adapted to a specific planting density is necessary for improving yield and enabling mechanical harvesting.
To date, a dozen quantitative trait loci (QTLs) regulating branch development have been identified using recombinant inbred line (RIL) or F2 populations in soybean [7,8,9,10,11]. However, the identified QTLs span a large number of plausible genes because of the low resolution of genetic linkage maps and low recombination frequency in mapping populations. Recently, three known QTLs have been narrowed down to identify candidate genes based on a high-density linkage map using the 6K single nucleotide polymorphism (SNP) chip (BARCSoySNP6K), and positive phenotypic correlation has been demonstrated between branch number and total pod number [8]. Among the QTLs, a major one (qBR6-1) on chromosome (Chr) 6, with a logarithm of odds (LOD) score of 10.3 and 14.5% of the phenotypic variation in branch numbers, was shown to contain 13 genes [8]. One of these genes was a gene encoding TEOSINTE-BRANCHED1/CYCLOIDEA/PROLIFERATING CELL FACTORS 1 and 2 (TCP) transcription factor, also known as BRANCHED1 (BRC1), which is involved in gene networks of axillary branching via interactions with the auxin hormone network [8]. In soybean, the BRC1 gene has not been genetically identified.
A genome-wide association study (GWAS) is used to identify associations between genetic loci and traits. It is a powerful method, as it provides high genetic resolution derived from all recombination events that occurred during the evolution of a natural population [12]. GWAS has been used successfully to identify the genetic basis of complex agronomic traits in Arabidopsis (Arabidopsis thaliana (L.)), rice (Oryza sativa (L.)), and maize (Zea mays (L.)) [13,14,15]. In soybean, GWAS has been performed to identify the association of genetic regions with agronomic traits, including flowering time, maturity date, plant height, and seed oil content [16,17]. However, the detection of false-positive associations with phenotypes is a weakness of GWAS, which is caused by the population structure and kinship relatedness in natural populations [16]. Utilizing linkage analysis in combination with GWAS has been previously used to overcome the limitations of QTL mapping and to validate the results of GWAS [16].
The objective of this study was to narrow down a genomic region of qBR6-1 to identify a candidate gene responsible for soybean branching. To this end, GWAS was conducted to identify quantitative trait nucleotides (QTNs) associated with branch number in a soybean core collection comprising 400 soybean genotypes grown in three locations. To validate and narrow down a QTN that was found to be overlapped with the previously identified major QTL, qBR6-1, we developed and analyzed a set of near-isogenic lines (NILs) carrying high-branching (HB) and low-branching (LB) alleles of qBR6-1 derived from an F6 residual heterozygous line (RHL) heterozygous for qBR6-1. Using these NILs, we detected differential expression of genes within the linkage disequilibrium (LD) block of the QTN on Chr 6. In addition, we examined nucleotide variations in a selected candidate gene between NIL-HB and NIL-LB, and confirmed their allelic associations with branch numbers in soybean accessions obtained from the United States Department of Agriculture Germplasm Resources Information Network (USDA-GRIN). This study will provide a better understanding of genetic basis underlying the branch development in soybean and valuable information to improve plant architecture for soybean cultivars with high yields.

2. Results

2.1. Variation and Heritability in Branch Number of the Soybean Core Collection

We present variations in branch number of the soybean core collection according to the location of cultivation (Wanju, Cheonan, and Ochang) and best linear unbiased predictor (BLUP) values in Figure S1. The number of branches varied from 2.0–20.7 in Wanju, 1.0–21.3 in Cheonan, and 0.0–14.3 in Ochang (Table S1). The broad-sense heritability (H2) of branch numbers in the soybean core collection was 57.7% (Table S1). Analysis of variance (ANOVA) showed significant effects of genotype as well as genotype-by-environment (G × E) interaction on branch numbers (p < 0.0001). Additionally, a continuous distribution of branch numbers was observed in all three locations, indicating that branch numbers were regulated by multiple genetic factors. To identify reliable QTNs associated with branch numbers, the BLUP values were calculated for each genotype and used in GWAS (Figure S1).

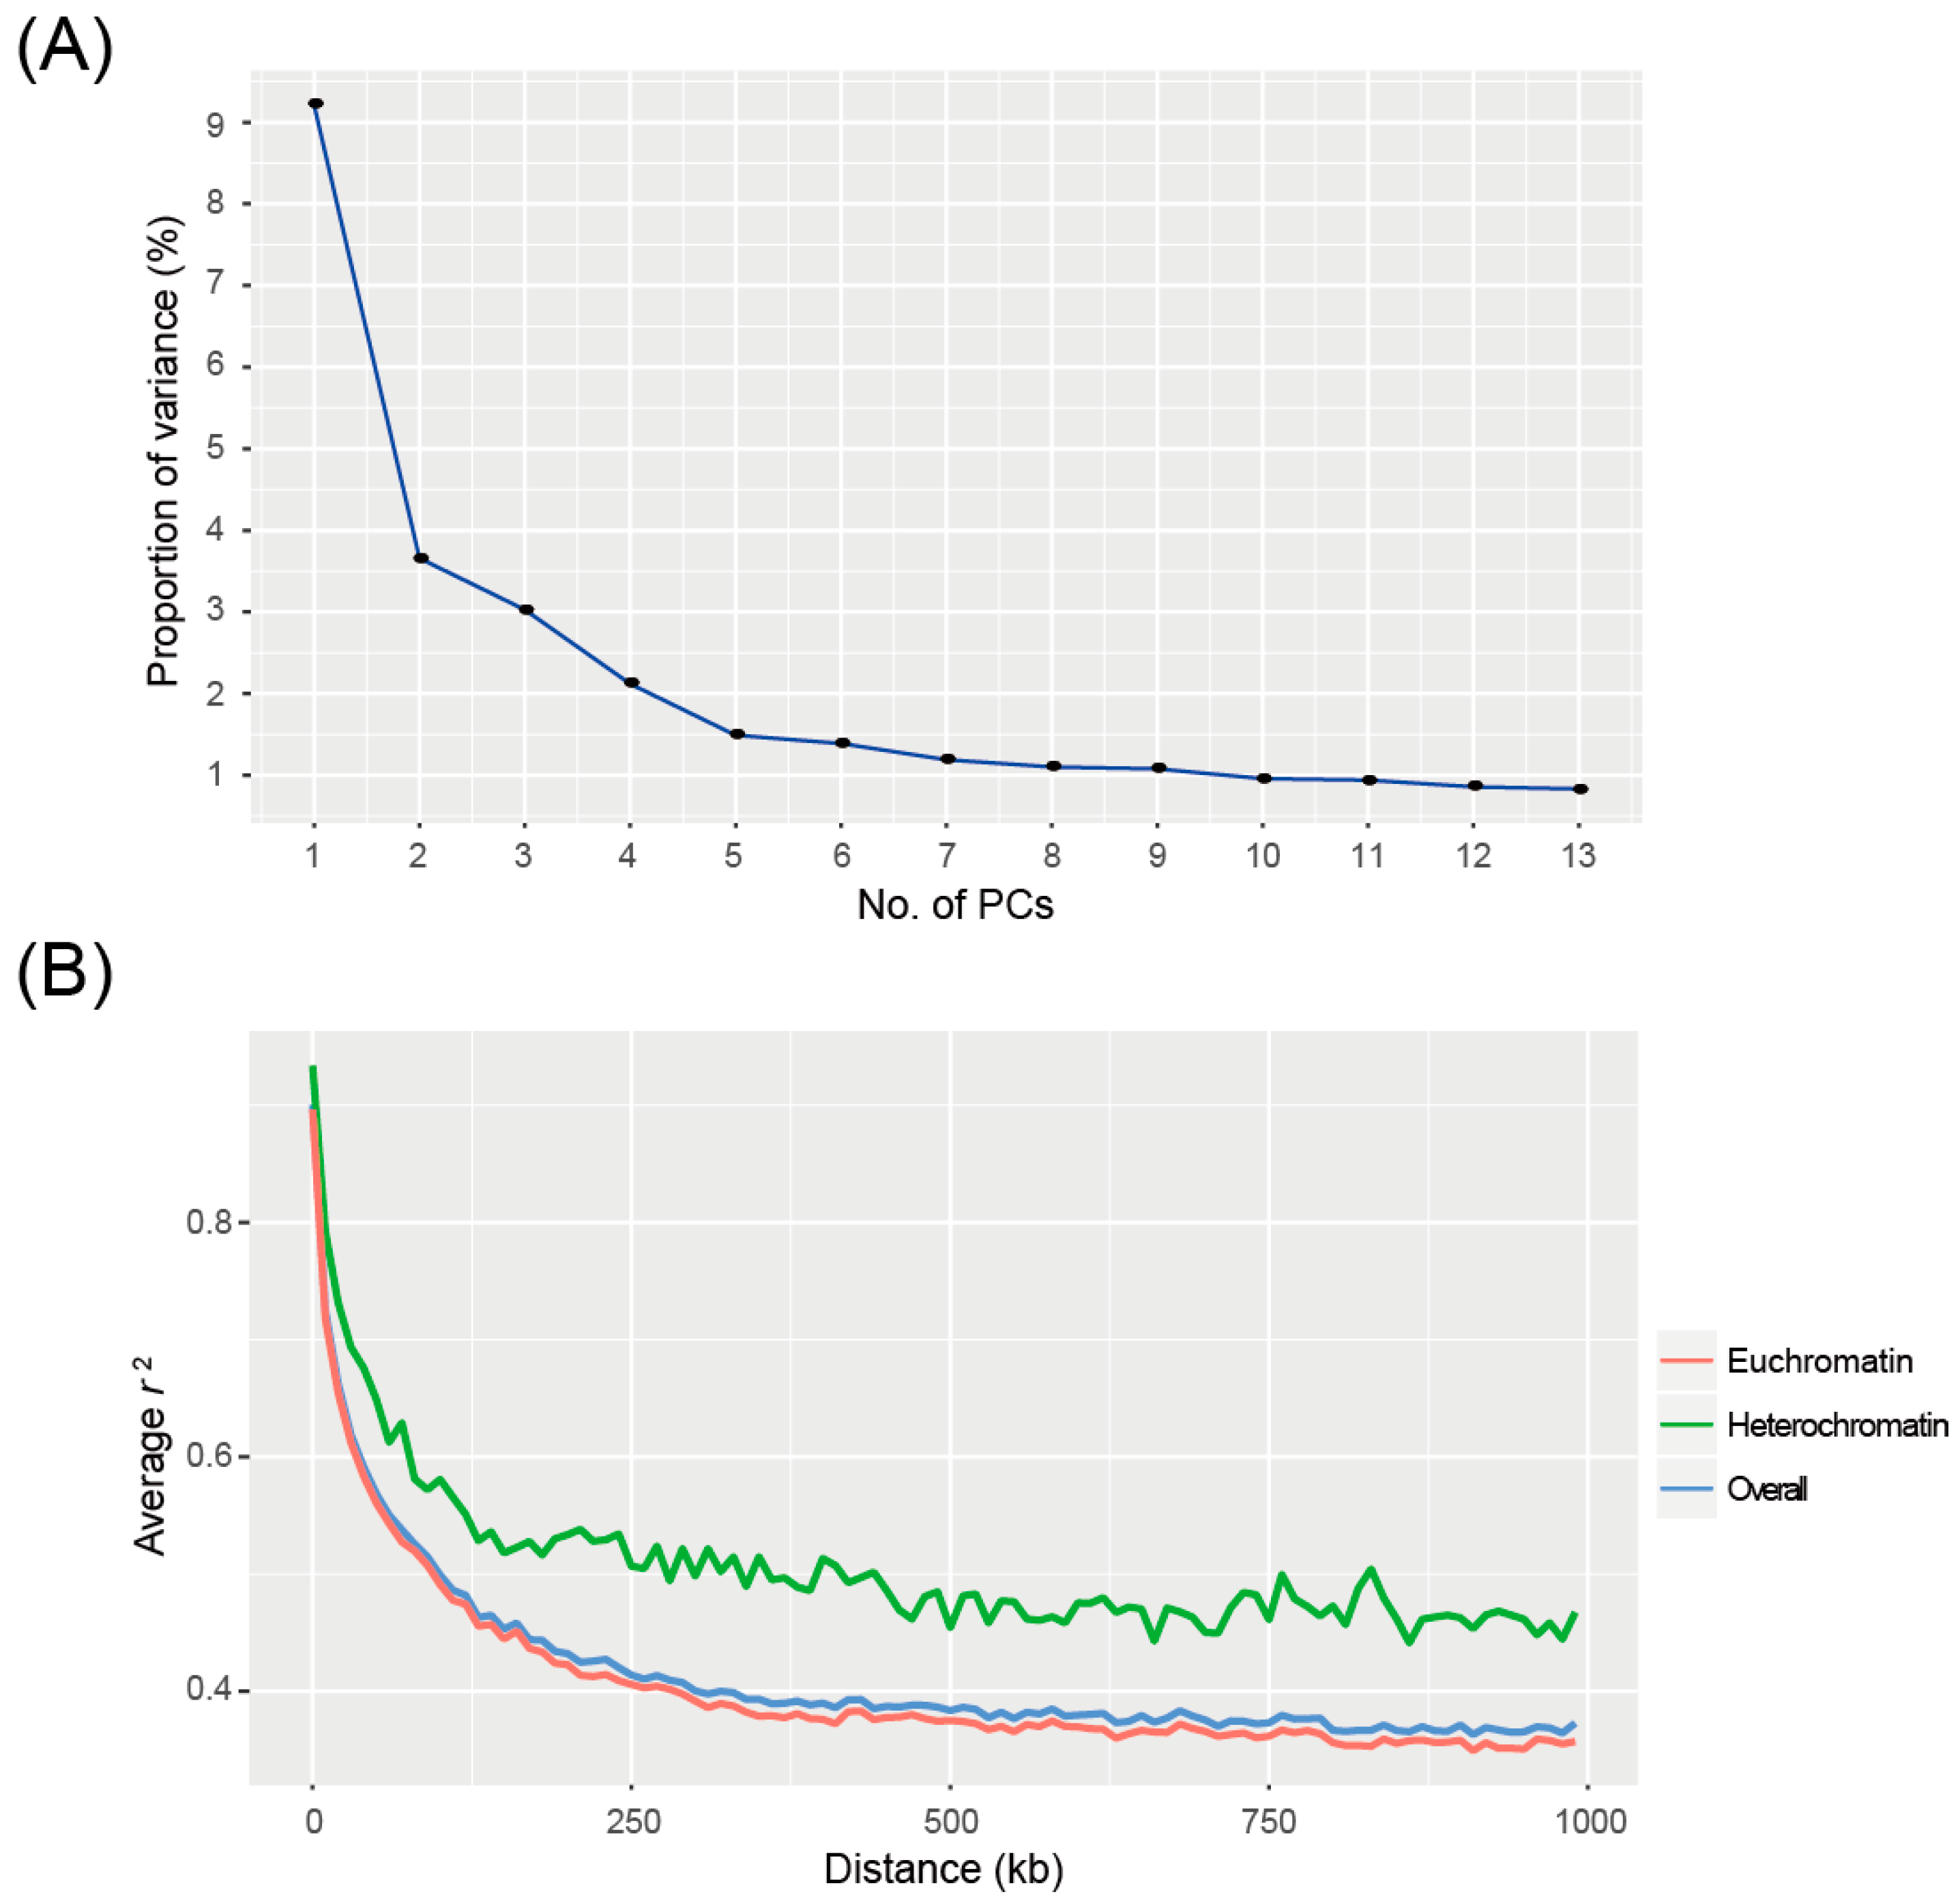
2.2. Population Structure and LD

Covariates from the population structure were stratified using 81,078 SNP markers. The log likelihood (LnP(D)) from STRUCTURE [18] analysis showed a continuous increase with the number of sub-populations (K). Therefore, we determined the optimum K value using the ∆K method. The ∆K value classified the core collection into two groups (Figure S2). In a scree plot, the proportion of variance drastically decreased until the number of principal components (PCs) reached two (Figure 1A). The extent of LD estimated by PLINK [19] showed that the average pair-wise squared correlation coefficient (r2) between alleles was dropped to half of its maximum value at 160–170 kb for the entire genome, with 140–150 kb for euchromatin and 460–470 kb for heterochromatin (Figure 1B).

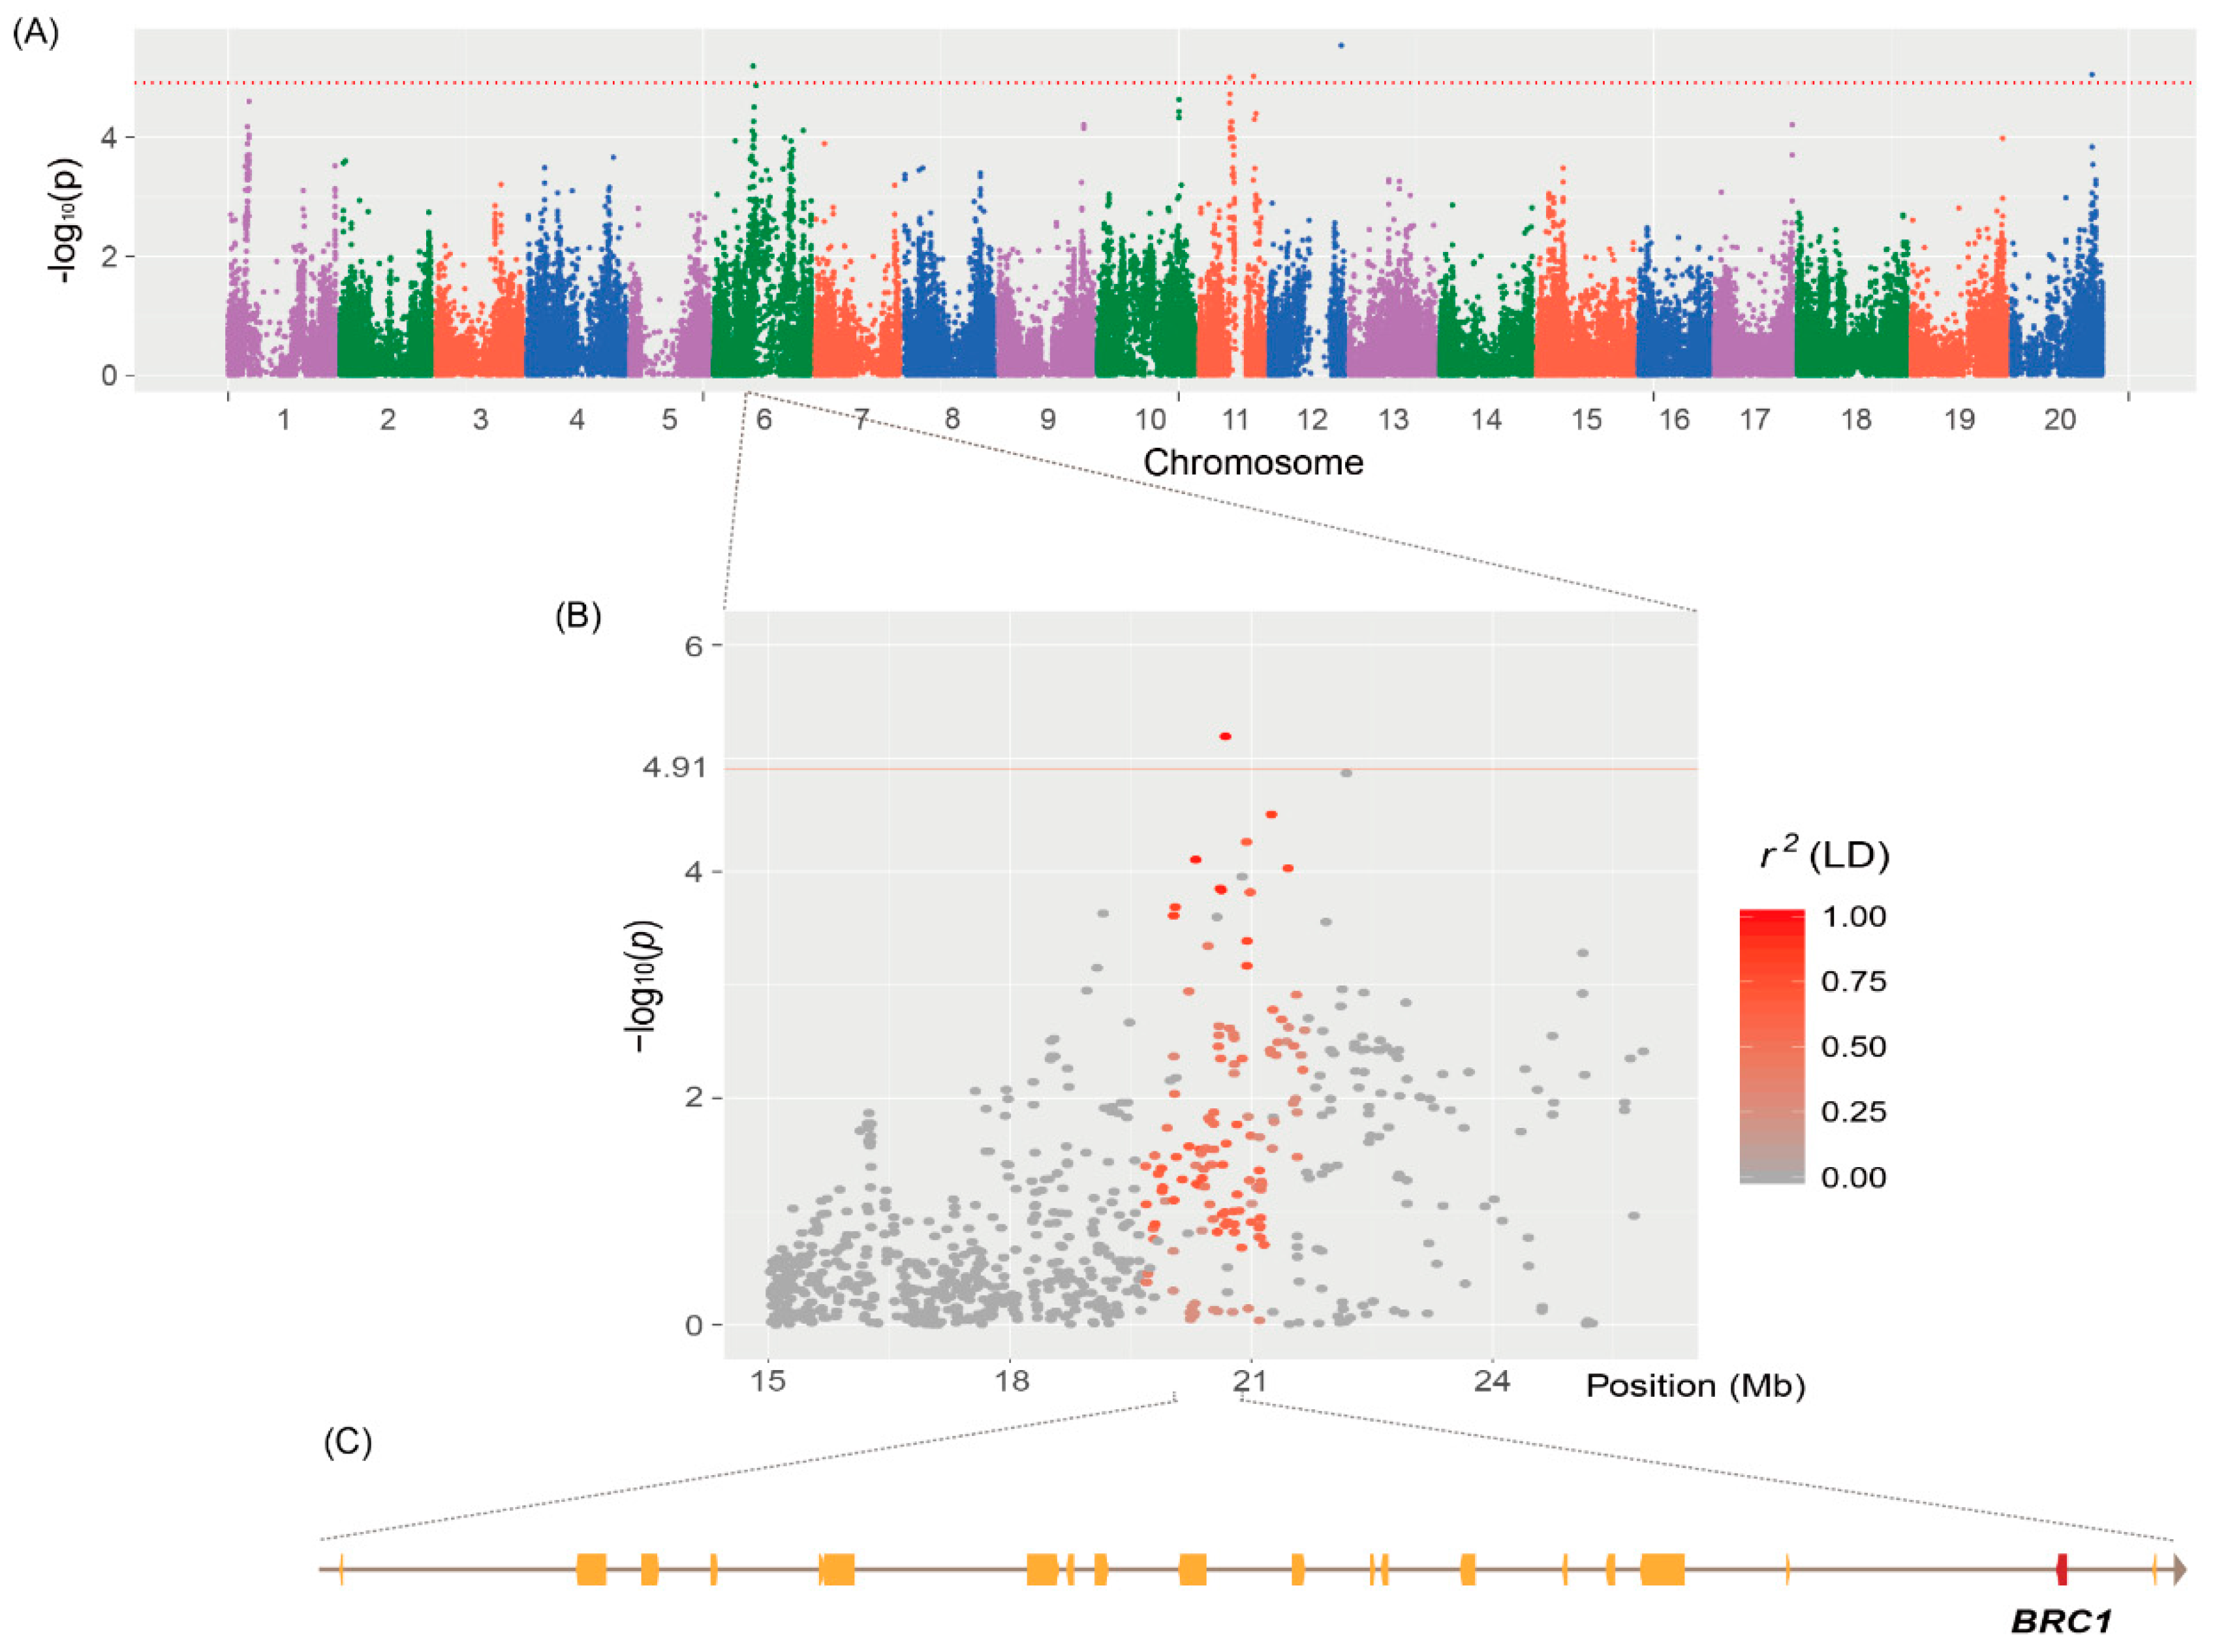
2.3. Determination of Genetic Association with Branch Numbers Using GWAS

To determine the best fitted GWAS model for branch numbers, quantile–quantile (QQ) plots generated using the generalized linear model (GLM) + population structure (Q) were compared with those generated using the mixed linear model (MLM) + Q (from principal component analysis; PCA) and kinship matrix (K) (Figure S3). The GLM + Q model showed a strong inflation of p-value (blue dots) compared with the MLM + Q (PCA) and K model (red dots), indicating erroneous inflation of false-positive signal. Thus, MLM + Q (PCA) and K model was more appropriate for the identification of QTNs associated with branch numbers in this study.
A total of five significant QTNs showing significant association with branch numbers were identified on Chr 6, 11, 12, and 20 (Table 1 and Figure 2A). The most highly significant QTN, qtnBR12-1 at 38,057,780 base pair (bp) in the euchromatic region of Chr 12, explained 6.4% of the phenotypic variation in branch numbers. The second most highly significant QTN, qtnBR6-1 at 20,663,101 bp in heterochromatin of Chr 6, accounted for 5.8% of the phenotypic variation (Figure 2B). Phenotypic variation in branch numbers explained by two other QTNs, qtnBR11-1 and qtnBR11-2 at 16,074,992 and 28,613,118 bp, respectively, in heterochromatin of Chr 11 was 5.0% and 5.6%, respectively. The last QTN, qtnBR20-1, located at 42,471,316 bp in euchromatin of Chr 20, accounted for 4.9% of the phenotypic variation in branch numbers.
On the basis of the rate of LD decay, we extended the chromosomal regions both upstream and downstream of the QTN positions, up to 140 kb for euchromatin and 460 kb for heterochromatin (Table 1). The LD blocks of qtnBR6-1, qtnBR11-1, and qtnBR11-2 were adjacent to a major QTL qBR6-1 and a minor QTL qBR11-1 reported previously [8]. The qtnBR6-1, spanning 20 protein-coding genes (Figure 2C), overlapped with the QTL qBR6-1, which has been shown to play a major role in branch development. Using the publicly available soybean RNA-seq data [20], in silico expression profiling of all 20 genes in qtnBR6-1 revealed that 13 genes, including the TCP transcription factor gene (BRC1; Glyma.06G210600), were expressed in the shoot apical meristem (SAM) (Figure 3A).

2.4. Isogenicity and Phenotypic Differences Between NIL-HB and NIL-LB Associated with qBR6-1

To validate and narrow down qtnBR6-1, we explored a set of NILs carrying HB and LB alleles of qBR6-1. NIL-HB with more branches contained HB allele derived from paternal genotype SS0404-T5-76. NIL-LB carried LB allele from maternal genotype Jiyu69, showing fewer branches. The NILs and parental genotypes, SS0404-T5-76 and Jilyu69, were resequenced at an average depth of 31.6X (Table S2). On average, 92.4% of the paired-end reads were mapped to the soybean reference genome sequence. Within 895 Mb of consensus genome sequence of the NILs with at least 10X mapping depth, a total of 286,467 nucleotide variants were identified on all chromosomes except Chr 6 (carrier chromosome) between NIL-HB and NIL-LB, resulting in 99.97% isogenicity (Table S3). In addition, the non-QTL region on the carrier Chr 6 showed 99.89% isogenicity. The QTL region of qBR6-1 on Chr 6 harbored 3798 nucleotide variants between NIL-HB and NIL-LB, of which 96.2% were shared with polymorphisms between parental genotypes SS0404-T5-76 and Jilyu69. Within the LD block of qtnBR6-1, SNPs segregating between NIL-HB and NIL-LB clustered in a 343 kb interval (20,555–20,898 kb) harboring 16 protein-coding genes (Figure 4A).
Additionally, we evaluated the effect of planting density on the branching performance of NIL-HB and NIL-LB in the field and greenhouse. The results showed a significant difference in the number of branches between NIL-HB and NIL-LB grown under low planting density (Table 2 and Figure S4). On average, NIL-HB plants had two more branches than NIL-LB plants. High planting density displayed no difference in branch numbers between NIL-HB and NIL-LB.

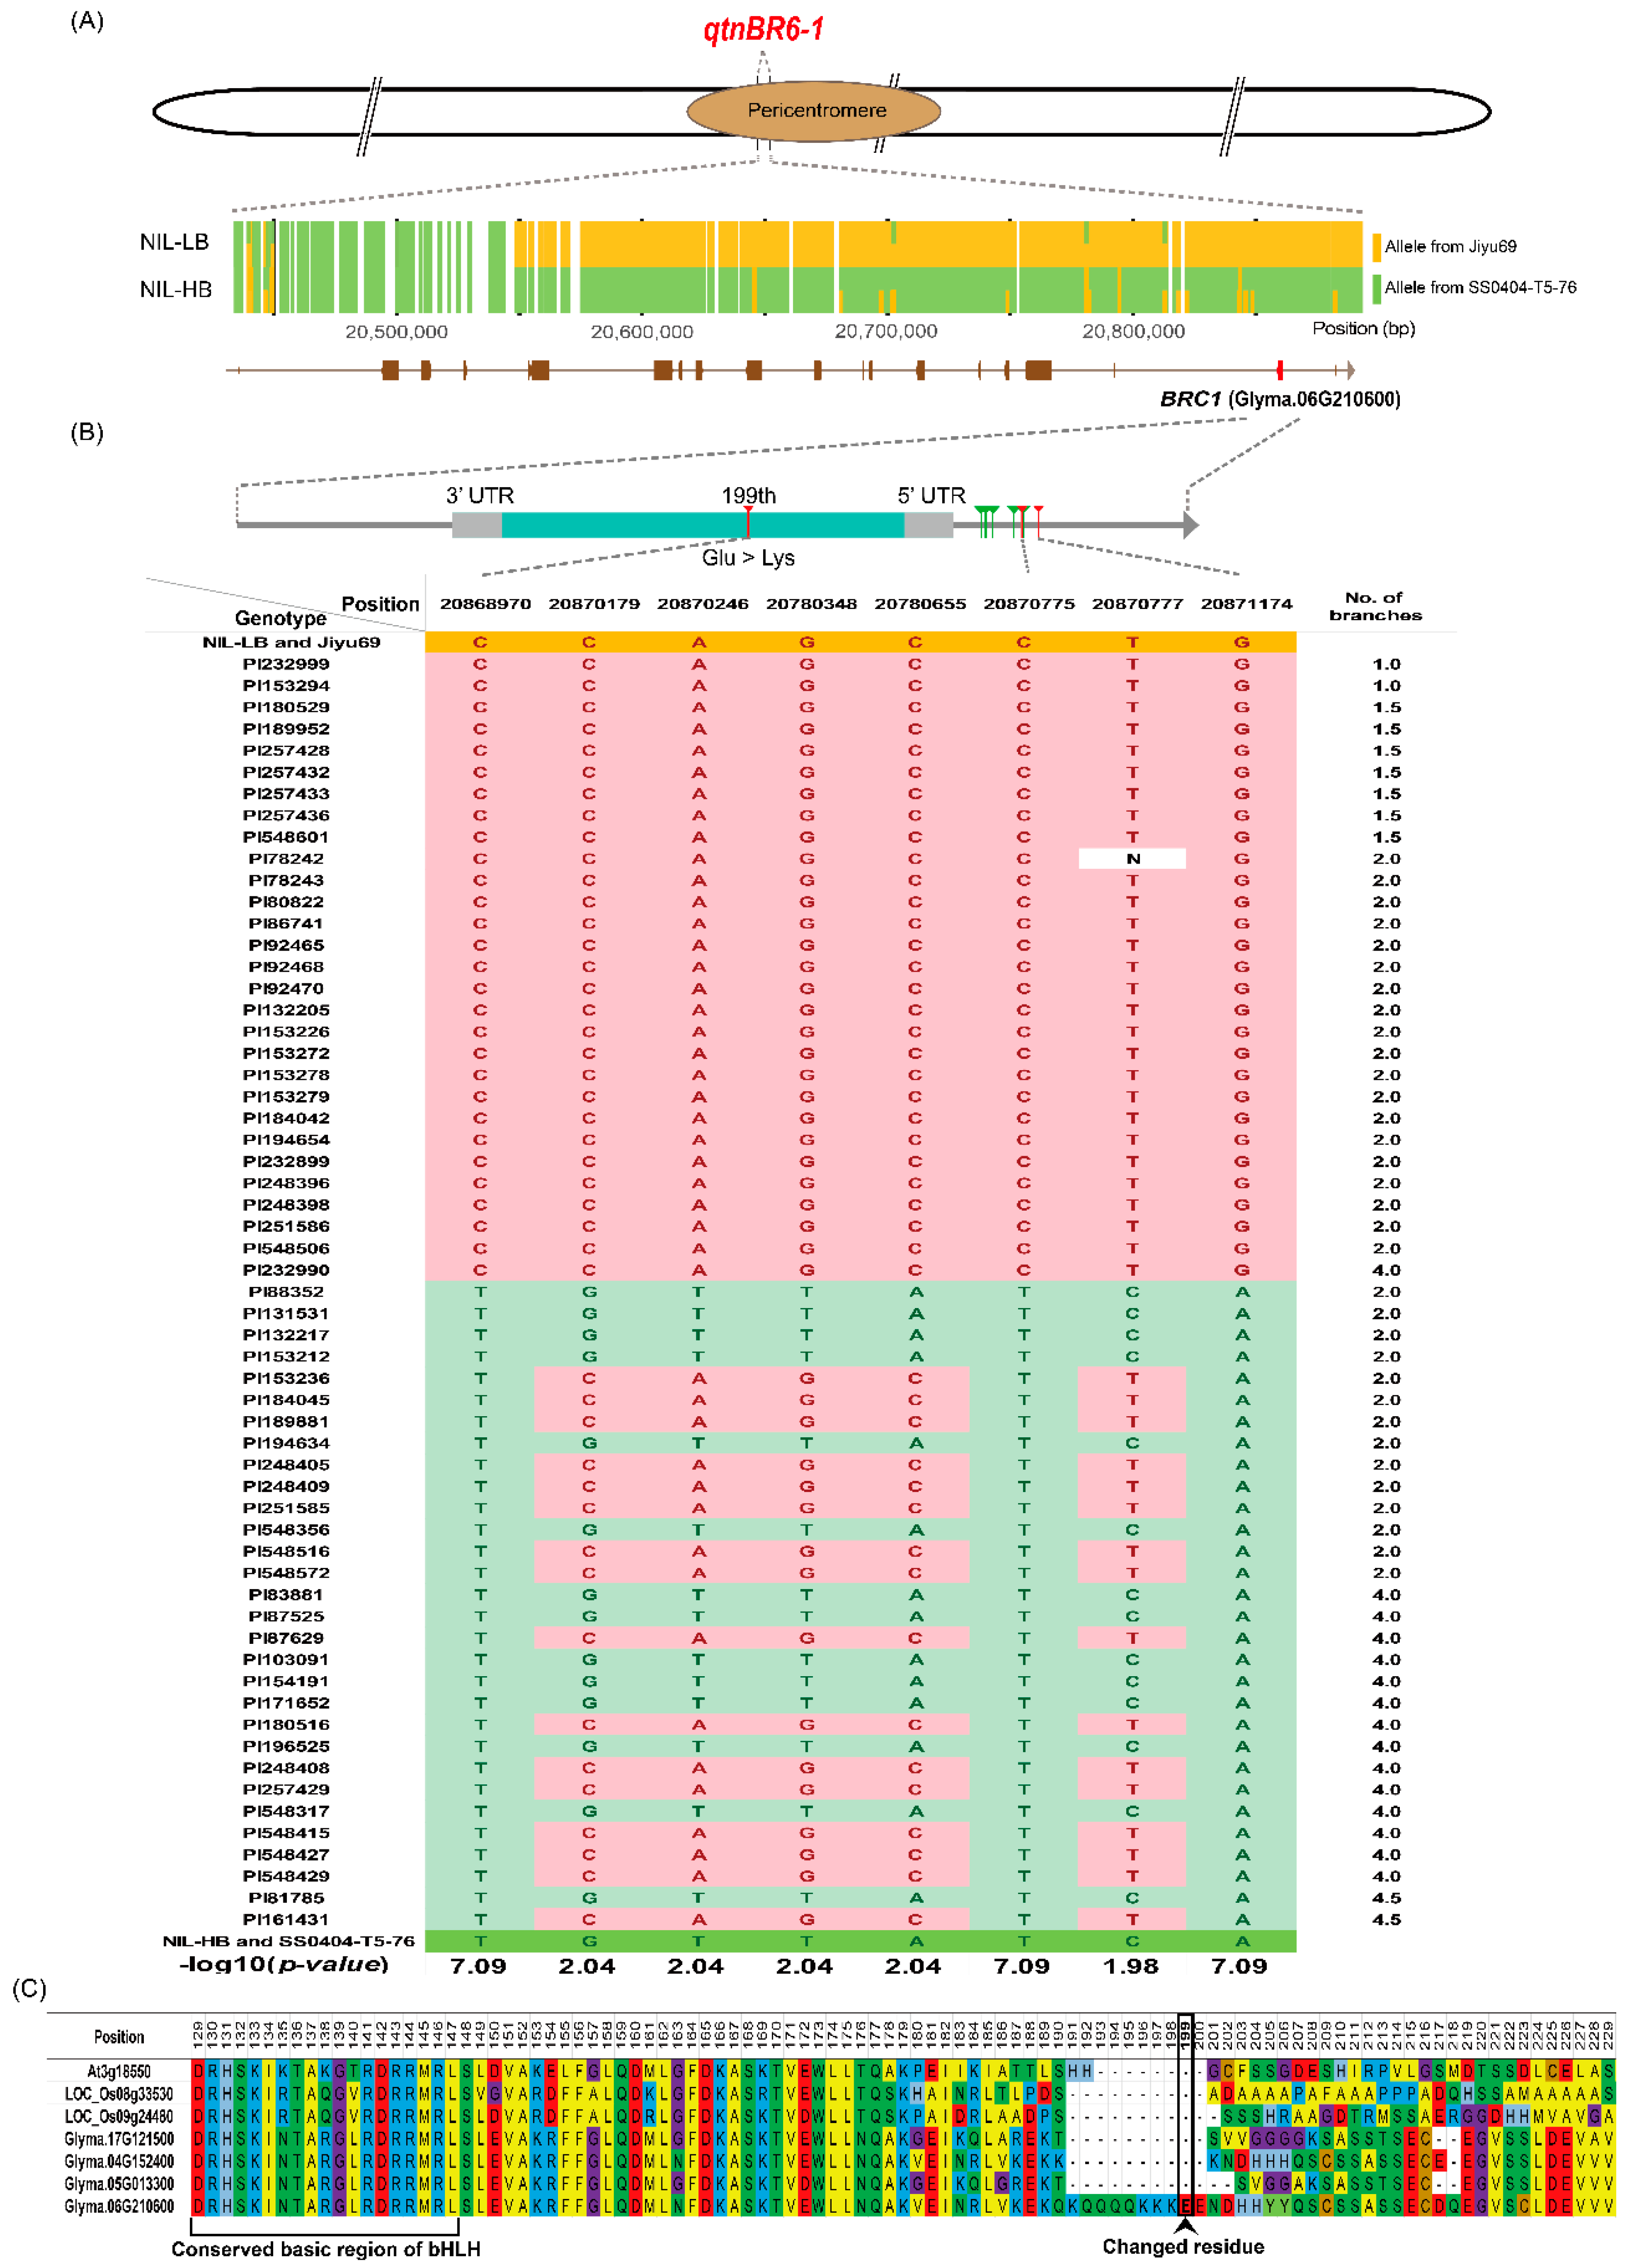
2.5. Candidate Gene Identification and Allelic Association Analysis

To narrow down the 13 candidate genes identified in the LD block of qtnBR6-1, cDNA was isolated from the shoot apex of NILs and used for expression analysis by qRT-PCR. Among these 13 genes, a multi-copy gene (Glyma.06G208900) encoding ATPase E1-E2 type family protein could not be analyzed by qRT-PCR because the primers were not sequence-specific. Of the remaining 12 genes, five were significantly down-regulated in NIL-HB; the genes encode MIZU-KUSSEI-like protein (Glyma.06G209100), P-loop containing nucleoside triphosphate hydrolases superfamily protein (Glyma.06G209400), adenine nucleotide alpha hydrolases-like superfamily protein (Glyma.06G209600), unknown protein (Glyma.06G210200), and TCP transcription factor (BRC1; Glyma.06G210600) (Figure 3B). On the basis of molecular genetic data available in Arabidopsis [21,22], BRC1 was identified as the most promising candidate gene responsible for branch development in soybean.
Analysis of the nucleotide sequence of BRC1 in NILs, Jily69, and SS0404-T5-76 revealed one SNP in the coding sequence, resulting in a missense mutation at amino acid position 199 (glutamate to lysine), and seven additional SNPs in the 2 kb upstream sequence (Figure 4B). Furthermore, the SNP in BRC1 coding sequence and two SNPs in the upstream sequence were significantly associated with branch number in 59 USDA-GRIN soybean accessions (available online: http://www.ars-grin.gov).

3. Discussion

Shoot branching influences seed yield in soybean and is regulated by a complex mechanism of axillary bud outgrowth following axillary meristem initiation [21,23]. The fate of axillary buds, that is, whether to outgrow into a branch or to remain as a bud, is determined by an orchestrated regulatory process induced by endogenous hormonal and developmental signals [24]. Such a regulatory process is affected by environmental factors such as planting density, shading, light quality, soil nitrogen content, and soil water content [3,4,25,26,27]. The soybean core collection used in this study showed a more significant effect on branch numbers than locations or interactions between genotypes and locations. We identified five QTNs showing association with branch numbers based on BLUP values from three different locations (Table 1 and Figure 2). The LD block of one of these five QTNs, qtnBR6-1, co-localized with a previously reported major QTL, qBR6-1, which was validated based on the clustering of SNPs segregating between NIL-HB and NIL-LB (Figure 4A).
The outgrowth of axillary buds is inhibited by the active shoot apex; this phenomenon is referred to as apical dominance. Decapitation abolishes apical dominance and triggers the growth of one or more axillary buds because auxin, which is synthesized in the shoot apex, is mobilized to the lower parts of plants and inhibits branch outgrowth [28]. Considering the relevance of shoot apex to branch development, we compared the expression levels of 13 genes showing transcriptional activity in SAM using publicly available RNA-seq data (Figure 3A). Among the five significantly down-regulated genes in NIL-HB (Figure 3B), we identified BRC1 (Glyma.06G210600) as the most promising candidate gene responsible for soybean shoot branching because BRC1 functions as a regulatory hub that integrates hormonal signals and external stimuli for determining the fate of axillary buds [21,22]. In Arabidopsis, BRC1 is expressed in axillary buds and SAM [21,29]. In pea (Pisum sativum L.), PsBRC1 shows the highest expression level in lateral buds and is also expressed in the shoot apex [30]. In this study, NIL-LB showed higher transcriptional activity of BRC1 in the shoot apex than NIL-HB, although the expression of BRC1 was not examined in axillary buds. Our data are consistent with previous studies showing that BRC1 orthologues in rice (Ostb1) and maize (tb1) negatively regulate branch development [21,22,31,32].
The effects of planting density and shading on branch development are well-established in plants [3,5,21,33,34]. High planting density and shading have the same effect on light quality as they both reduce the ratio of red to far red light (R/FR) [24]. Shoot branching increases under high R/FR ratios caused by low planting density, but decreases under low R/FR ratios [3,5,21,33,34]. Similarly, in this study, NILs grown under high planting density produced fewer branches than those grown under low planting density, and showed no difference in branch numbers (Table 2). However, a significant difference in branch numbers was observed between NIL-HB and NIL-LB cultivated at low planting density. This indicates that the gene regulating branch number responds to low planting density. The light signal perceived by phytochrome B (PHYB), a photoreceptor, is transduced to the endogenous signal via BRC1, which functions as a molecular mediator [34]. Under shade or high planting density, an elevated FR signal inactivates PHYB by converting the active form of phytochrome (Pr) to the inactive form (Pfr) [35]. The inactive Pfr form of PHYB up-regulates BRC1, resulting in the inhibition of branch development [34,35]. These findings link the exogenous light signal with the endogenous molecular regulator in branch development, and suggest GmBRC1 as the causal gene responsible for branch development in soybean. The function of BRC1 is highly conserved across other plant species [21,30,31,32].
The BRC1 gene and its orthologues are characterized by a highly conserved basic region of basic helix–loop–helix (bHLH) on a functional domain of TCP genes [21,31,32,36], and belong to CYCLODEA/TEOSINTE BRANCHED1 (CYC/TB1)-type TCP [37]. In this study, a missense mutation (glutamate to lysine) in the CYC/TB1-type TCP domain was identified between NIL-HB and NIL-LB, which showed a tight association with branch numbers in 59 USDA soybean accessions (Figure 4B). However, the altered amino acid residue was not located in the highly conserved basic region of bHLH, and was not conserved among other CYC/TB1-type TCP orthologues in Arabidopsis, rice, and soybean (Figure 4C). Thus, it is not clear if the difference in branch numbers between NIL-HB and NIL-LB could be attributed to the amino acid change at position 199. In addition to the SNP in BRC1 coding sequence, two out of seven SNPs within the 2 kb upstream sequence of BRC1 showed tight association with branch numbers. As both these SNPs are located in the putative promoter region of BRC1, they are predicted to affect BRC1 expression. This is consistent with previous reports that BRC1 regulates branching at the transcription level [21,31,32]; BRC1 expression was down-regulated in NIL-HB (Figure 3B). An example similar to our results is of maize tb1; sequence variation in the upstream region of tb1, resulting in low expression, is associated with increased branch development in maize [31,38,39].
In conclusion, we propose BRC1 (Glyma.06G210600) as the candidate gene regulating branch development in soybean. Further functional validation of these results by overexpression or knockout of GmBRC1 is required for a thorough understanding of the regulatory mechanism of branch development in soybean, which will provide key insights into the complex genetic modules mediating branch development in soybean. Agronomically, soybean cultivars with optimal plant architecture depending on cultivation methods can be developed based on the allelic information of BRC1 gene. In western countries including USA, soybean cultivars for high yield and mechanical harvesting can be improved by selecting genotypes with alleles contributing low branching phenotype. Besides, introgression of alleles responsible for high branching phenotype to other elite cultivars will enable breeding of high yielding soybean cultivars with high branch number and contribute to labor saving cultivation practice in Asian countries.

4. Materials and Methods

4.1. Plant Materials

A soybean core collection comprising 400 soybean genotypes with diverse origins was obtained from the National Agrobiodiversity Center in the Rural Development Administration (RDA, Jeonju, Korea) for GWAS (Table S4). To validate and narrow down the locus for branching, a set of NILs carrying HB and LB alleles of qBR6-1 was developed from an RHL selected from the F6 RIL population of Jiyu69 (low-branching) × SS0404-T5-76 (high-branching). Among five individuals in the progeny of RHL, plants showing the highest and lowest number of branches were selected as NILs carrying the HB and LB alleles, respectively, in 2016, and were designated as NIL-HB and NIL-LB, respectively. These NILs were genotyped using simple sequence repeat markers flanking qBR6-1 (Table S5). We also used 59 USDA-GRIN soybean accessions with known branch numbers to confirm the allelic association of SNPs within a candidate gene between NIL-HB and NIL-LB.
The soybean core collection was grown in three different locations, namely, Wanju (35°50′27.384″ N, 127°2′46.1826″ E), Cheonan (36°49′49.2816″ N, 127°10′1.9122″ E), and Ochang (36°43′14.0982″ N, 127°26′1.1148″ E), in Korea in 2017. NIL-HB and NIL-LB were planted in a greenhouse and experimental field of Seoul National University, Suwon, Korea (37°16′12.094″ N, 126°59′20.756″ E). In the greenhouse, three plants of each line (NIL-HB and NIL-LB) were grown in a rectangular pot (64.3 cm × 23.0 cm × 16.9 cm). The plant-to-plant and row-to-row spacing was 20 and 80 cm, respectively, in low-density planting, and 10 and 40 cm, respectively, in high-density planting. All experiments were performed in triplicate, and field evaluation of branching in NILs was conducted in 2017 and 2018.

4.2. Phenotyping of Branch Number and Statistical Analysis

The number of branches generated on the main stem of the soybean core collection genotypes and NILs was evaluated in three biological replicates. Phenotypic differences between NILs were examined by analysis of variance (ANOVA) using the R software (available online: http://www.R-project.org). To minimize the effect of environmental factors on branch numbers at three different locations in GWAS, the BLUP value was predicted by the lme4 package of R, considering the variation among genotypes and locations [40]. The BLUP values were calculated according to the following equation:
Y i k = μ + G i + L k + G L i k + e i k
where Yik represents the phenotypic measurement, μ is the total mean, Gi is the genotypic effect of the ith genotype, Lk is the effect of the kth location, GLik represents interaction between genotype and location, and eik is the residual error. The BLUP values of each soybean genotype were calculated with random effect and used as phenotypes for GWAS. Broad-sense heritability (H2) of branch numbers was calculated using the following equation:
H 2 = σ g 2 ( σ g 2 + σ g l 2 n + σ e 2 n r )
where σg2 represents genotypic variance, σgi2 is the variance of interaction between genotype and location, σe2 represents the variance of error components, n represents the number of locations, and r represents the number of replications.

4.3. Population Structure and LD Analysis

SNP genotypic data of the soybean core collection previously produced from the 180K Axiom® SoyaSNP array were explored for GWAS [41]. SNPs with minor allele frequency <0.05 and missing genotype >10% were excluded. The remaining 81,078 SNPs were used in STRUCTURE [18], PCA, kinship analysis, LD analysis, and GWAS. To stratify covariates (Q) from the population structure, STRUCTURE and PCA analyses were applied. In STRUCTURE, burn-in and Markov chain Monte Carlo (MCMC) values were set at 10,000 and 100,000, respectively. The STRUCTURE analysis was carried out for number of sub-populations (K) values ranging from 1 to 13. To evaluate the optimum K for this population, the ∆K method was applied. The use of MLM with covariates from STRUCTURE produced erroneous inflation and false-positive signals. Therefore, population stratification was analyzed using PCA, which has been previously proposed as an alternative method for investigating relatedness [42]. Therefore, covariates implemented by PCA analysis in TASSEL v5.2 [43] were adopted for MLM analysis. To determine the optimal number of PCs, a scree plot was generated based on the proportion of variance explained by PCs. The kinship matrix (K) for soybean core collection was analyzed using TASSEL v5.2 [43].
LD was analyzed using PLINK software [19] with LD window length of 1 Mb and an unlimited number of variants within LD window (--r2 --ld-window-kb 1000 --ld-window 99999). Considering the different patterns of LD decay in heterochromatin and euchromatin, genomic regions specified as pericentromeric regions in Soybase (available online: http://soybase.org) were downloaded and used in the LD analysis. The rate of LD decay for the soybean core collection was measured in physical distance, where the average pair-wise r2 value between alleles dropped to half of its maximum value.

4.4. GWAS

GWAS was conducted using TASSEL v5.2 [43]. Two statistical models, GLM + Q (from STRUCTURE) and MLM + Q (from PCA) and K, were considered. The Q and K were regarded as fixed and random effects in GLM and MLM models, respectively. Quantile–quantile plots of both models were compared for determining the best fit. The threshold p-value (1/n, where n is the number of SNPs (81,078)) was used for the identification of QTNs significantly associated with branch number.

4.5. Expression Patterns of Genes in LD Block of qtnBR6-1

The identified QTNs were extended based on the rate of LD decay, depending on the chromosomal region (euchromatin vs. heterochromatin). To investigate the expression patterns and levels of genes located within the LD block of the qtnBR6-1, RNA-seq data (fragments per kilobase of exon model per million mapped reads (FPKM) values) for nine tissues, including flower, leaf, nodule, pod, root, root hair, SAM, seed, and stem, of soybean cv. Williams 82 were obtained from Phytozome v12.0 (available online: https://phytozome.jgi.doe.gov/pz/portal.html) [20]; RNA-seq data for axillary buds were not available in the public database. A heatmap with hierarchical clustering of genes was constructed using the R package pheatmap for visualizing gene expression levels in nine tissues, based on the log2(FPKM + 1) values. Only genes expressed in SAM were selected for further analysis.

4.6. Resequencing of NIL-HB, NIL-LB, and Parental Genotypes

The two NILs (NIL-HB and NIL-LB) and their parental genotypes, SS0404-T5-76 and Jiyu69, were resequenced. Raw sequence reads were mapped to the soybean reference genome (Wm82.a2) downloaded from Phytozome [20] using BWA [44], Samtools [45], and Vcftools [46]. Annotation of SNPs was conducted using SnpEff [47]. Nucleotide positions with more than ten supporting reads per genotype were analyzed further. SNPs segregating between NIL-HB and NIL-LB in the LD block of qtnBR6-1 were compared with the sequence of SS0404-T5-76 and Jiyu69.

4.7. qRT-PCR Analysis of Candidate Genes in NILs

To determine the expression levels of selected genes in NILs, total RNA was extracted from the shoot apex (<3 mm) of NILs at the R1 stage using RibospinTM Plant (GeneAll, Seoul, Korea), and cDNA was synthesized using Bio-Rad iScriptTM cDNA Synthesis Kit (Hercules, CA, USA). Next, qRT-PCR was performed on a LightCycler® 480 (Roche Diagnostics, Laval, QC, Canada) using Bio-Rad iQTM SYBR Green Supermix Kit. Primer sequences were designed using PRIMER3plus (available online: http://www.bioinformatics.nl/cgi-bin/primer3plus/primer3plus.cgi) [48]. Appropriate primer pairs that did not amplify orthologues of target genes were selected using a stand-alone version of electronic PCR [49] (Table S5). Each qRT-PCR reaction mixture (20 µL volume) contained 100 ng cDNA template, and 300 µM each of forward and reverse primer. Amplification was performed using the following conditions: initial denaturation at 95 °C for 5 min, followed by 40 cycles of denaturation at 95 °C for 10 s, and annealing and extension at 60 °C for 1 min. Three biological samples of each NIL were analyzed in triplicate to increase statistical power. The ACTIN11 (ACT11) gene was used as a reference for data normalization. Normalized data were analyzed using the method of Livak and Schmittgen [50]. Statistical significance was analyzed using Fisher’s least significant difference (p < 0.05) in R.

4.8. Analysis of BRC1 SNPs and Amino Acid Sequence

SNPs identified in the candidate gene BRC1 based on a comparison between NIL-HB and NIL-LB were tested for association with branch number in a collection of 59 soybean accessions obtained from USDA-GRIN. Genomic DNA of each soybean accession was extracted using ExgeneTM Plant SV mini DNA extraction kit (GeneAll, Seoul, Korea). On the basis of the identified SNPs between NIL-HB and NIL-LB, primers were designed using PRIMER3Plus (Table S5) [48] and validated using an electronic PCR algorithm [49]. PCR products were sequenced using ABI 3730XL DNA analyzer (Applied Biosystems, Foster, CA, USA). Branch numbers of soybean accessions were downloaded from the GRIN website. Association analysis between branch numbers and allelic variations was performed using ANOVA. Amino acid sequences of BRC1 orthologues from Arabidopsis, rice, and soybean were aligned using MEGA7 [51].

Supplementary Materials

Supplementary materials can be found at https://www.mdpi.com/1422-0067/20/1/135/s1.

Author Contributions

Conceptualization, S.S., J.H., M.Y.K., and S.-H.L.; Methodology, S.S.; Validation, S.S.; Formal Analysis, S.S.; Investigation, S.S.; Resources, M.S.C., S.-T.K., S.-C.J., and J.-K.M.; Data Curation, S.S.; Writing—Original Draft Preparation, S.S.; Writing—Review and Editing, M.Y.K., J.H., and S.-H.L.; Visualization, S.S.; Supervision, M.Y.K., S.-C.J., and S.-H.L.; Project Administration, S.-H.L.; Funding Acquisition, S.-H.L.

Funding

This work was supported by the Next Generation BioGreen 21 Program (Code No. PJ01322401), Rural Development Administration, Republic of Korea.

Conflicts of Interest

The authors declare that there is no conflict of interest.

Abbreviations

BLUPBest linear unbiased predictor/prediction
BRC1BRANCHED1
GLMGeneralized linear model
GWASGenome-wide association study
LDLinkage disequilibrium
MLMMixed linear model
NILNear-isogenic line
QTLQuantitative trait locus
QTNQuantitative trait nucleotide
RHLResidual heterozygous line
RILRecombinant inbred line
SAMShoot apical meristem
SNPSingle nucleotide polymorphism
TCPTEOSINTE BRANCHED1/CYCLODEA/PROLIFERATING CELL FACTOR 1 and 2

References

  1. Heatherly, L.G.; Elmore, R.W. Managing Inputs for Peak Production. In Soybeans: Improvement, Production, and Uses; Agronomy Monograph 16; American Society of Agronomy, Inc.; Crop Science Society of America, Inc.; Soil Science Society of America, Inc.: Madison, WI, USA, 2004; pp. 451–536. [Google Scholar] [CrossRef]
  2. Cho, Y.; Kim, S. Growth parameters and seed yield compenets by seeding time and seed density of non-/few branching soybean cultivars in drained paddy field. Asian J. Plant Sci. 2010, 9, 140–145. [Google Scholar]
  3. Agudamu; Yoshihira, T.; Shiraiwa, T. Branch development responses to planting density and yield stability in soybean cultivars. Plant Prod. Sci. 2016, 19, 331–339. [Google Scholar] [CrossRef]
  4. Board, J. Light Interception Efficiency and Light Quality Affect Yield Compensation of Soybean at Low Plant Populations. Crop Sci. 2000, 40, 1285–1294. [Google Scholar] [CrossRef]
  5. Cox, W.J.; Cherney, J.H.; Shields, E. Soybeans Compensate at Low Seeding Rates but not at High Thinning Rates. Agron. J. 2010, 102, 1238–1243. [Google Scholar] [CrossRef]
  6. Board, J.E.; Kahlon, C.S. Morphological Responses to Low Plant Population Differ Between Soybean Genotypes. Crop Sci. 2013, 53, 1109–1119. [Google Scholar] [CrossRef]
  7. Sayama, T.; Hwang, T.-Y.; Yamazaki, H.; Yamaguchi, N.; Komatsu, K.; Takahashi, M.; Suzuki, C.; Miyoshi, T.; Tanaka, Y.; Xia, Z.; et al. Mapping and comparison of quantitative trait loci for soybean branching phenotype in two locations. Breeding Sci. 2010, 60, 380–389. [Google Scholar] [CrossRef] [Green Version]
  8. Shim, S.; Kim, M.Y.; Ha, J.; Lee, Y.-H.; Lee, S.-H. Identification of QTLs for branching in soybean (Glycine max (L.) Merrill). Euphytica 2017, 213, 225. [Google Scholar] [CrossRef]
  9. Yao, D.; Liu, Z.Z.; Zhang, J.; Liu, S.Y.; Qu, J.; Guan, S.Y.; Pan, L.D.; Wang, D.; Liu, J.W.; Wang, P.W. Analysis of quantitative trait loci for main plant traits in soybean. Genet. Mol. Res. 2015, 14, 6101–6109. [Google Scholar] [CrossRef]
  10. Chen, Q.; Zhang, Z.; Liu, C.; Xin, D.; Qiu, H.; Shan, D.; Shan, C.; Hu, G. QTL Analysis of Major Agronomic Traits in Soybean. Agr. Sci. China 2007, 6, 399–405. [Google Scholar] [CrossRef]
  11. Li, W.; Zheng, D.; Van, K.; Lee, S. QTL Mapping for Major Agronomic Traits across Two Years in Soybean (Glycine max L. Merr.). J. Crop Sci. Biotech. 2008, 11, 171. [Google Scholar]
  12. Rafalski, J.A. Association genetics in crop improvement. Curr. Opin. Plant Biol. 2010, 13, 174–180. [Google Scholar] [CrossRef] [PubMed]
  13. Zhao, K.; Tung, C.-W.; Eizenga, G.C.; Wright, M.H.; Ali, M.L.; Price, A.H.; Norton, G.J.; Islam, M.R.; Reynolds, A.; Mezey, J.; et al. Genome-wide association mapping reveals a rich genetic architecture of complex traits in Oryza sativa. Nat. Commun. 2011, 2, 467. [Google Scholar] [CrossRef] [PubMed]
  14. Tian, F.; Bradbury, P.J.; Brown, P.J.; Hung, H.; Sun, Q.; Flint-Garcia, S.; Rocheford, T.R.; McMullen, M.D.; Holland, J.B.; Buckler, E.S. Genome-wide association study of leaf architecture in the maize nested association mapping population. Nat. Genet. 2011, 43, 159–162. [Google Scholar] [CrossRef] [PubMed]
  15. Zhao, K.; Aranzana, M.J.; Kim, S.; Lister, C.; Shindo, C.; Tang, C.; Toomajian, C.; Zheng, H.; Dean, C.; Marjoram, P.; et al. An Arabidopsis Example of Association Mapping in Structured Samples. PLoS Genet. 2007, 3, e4. [Google Scholar] [CrossRef] [PubMed]
  16. Cao, Y.; Li, S.; Wang, Z.; Chang, F.; Kong, J.; Gai, J.; Zhao, T. Identification of Major Quantitative Trait Loci for Seed Oil Content in Soybeans by Combining Linkage and Genome-Wide Association Mapping. Front. Plant Sci. 2017, 8. [Google Scholar] [CrossRef] [Green Version]
  17. Zhang, J.; Song, Q.; Cregan, P.B.; Nelson, R.L.; Wang, X.; Wu, J.; Jiang, G.-L. Genome-wide association study for flowering time, maturity dates and plant height in early maturing soybean (Glycine max) germplasm. BMC Genomics 2015, 16, 217. [Google Scholar] [CrossRef] [PubMed]
  18. Pritchard, J.K.; Stephens, M.; Donnelly, P. Inference of population structure using multilocus genotype data. Genetics 2000, 155, 945–959. [Google Scholar]
  19. Purcell, S.; Neale, B.; Todd-Brown, K.; Thomas, L.; Ferreira, M.A.R.; Bender, D.; Maller, J.; Sklar, P.; de Bakker, P.I.W.; Daly, M.J.; et al. PLINK: A Tool Set for Whole-Genome Association and Population-Based Linkage Analyses. Am. J. Hum. Genet. 2007, 81, 559–575. [Google Scholar] [CrossRef] [Green Version]
  20. Schmutz, J.; Cannon, S.B.; Schlueter, J.; Ma, J.; Mitros, T.; Nelson, W.; Hyten, D.L.; Song, Q.; Thelen, J.J.; Cheng, J.; et al. Genome sequence of the palaeopolyploid soybean. Nature 2010, 463, 178–183. [Google Scholar] [CrossRef]
  21. Aguilar-Martínez, J.A.; Poza-Carrión, C.; Cubas, P. Arabidopsis BRANCHED1 Acts as an Integrator of Branching Signals within Axillary Buds. Plant Cell 2007, 19, 458–472. [Google Scholar] [CrossRef]
  22. Poza-Carrión, C.; Aguilar-Martínez, J.A.; Cubas, P. Role of TCP Gene BRANCHED1 in the Control of Shoot Branching in Arabidopsis. Plant Signal Behav. 2007, 2, 551–552. [Google Scholar] [CrossRef] [PubMed]
  23. Ghodrati, G. Study of genetic variation and broad sense heritability for some qualitative and quantitative traits in soybean (Glycine max L.) genotypes. Curr. Opin. Agr. 2013, 2. [Google Scholar]
  24. Rameau, C.; Bertheloot, J.; Leduc, N.; Andrieu, B.; Foucher, F.; Sakr, S. Multiple pathways regulate shoot branching. Front Plant Sci. 2015, 5. [Google Scholar] [CrossRef] [PubMed] [Green Version]
  25. Board, J.E.; Settimi, J.R. Photoperiod Effect before and after Flowering on Branch Development in Determinate Soybean. Agron. J. 1986, 78, 995–1002. [Google Scholar] [CrossRef]
  26. Frederick, J.R.; Camp, C.R.; Bauer, P.J. Drought-Stress Effects on Branch and Mainstem Seed Yield and Yield Components of Determinate Soybean. Crop Sci. 2001, 41, 759–763. [Google Scholar] [CrossRef]
  27. Linkemer, G.; Board, J.E.; Musgrave, M.E. Waterlogging effects on growth and yield components in late-planted soybean. Crop Sci. 1998, 38, 1576–1584. [Google Scholar] [CrossRef] [PubMed]
  28. Thimann, K.V.; Skoog, F. Studies on the growth hormone of plants the inhibiting action of the growth substance on bud development. Proc. Natl. Acad. Sci. USA 1933, 19, 714–716. [Google Scholar] [CrossRef] [PubMed]
  29. Niwa, M.; Daimon, Y.; Kurotani, K.; Higo, A.; Pruneda-Paz, J.L.; Breton, G.; Mitsuda, N.; Kay, S.A.; Ohme-Takagi, M.; Endo, M.; et al. BRANCHED1 Interacts with FLOWERING LOCUS T to Repress the Floral Transition of the Axillary Meristems in Arabidopsis[C][W][OA]. Plant Cell 2013, 25, 1228–1242. [Google Scholar] [CrossRef]
  30. Braun, N.; Germain, A. de S.; Pillot, J.-P.; Boutet-Mercey, S.; Dalmais, M.; Antoniadi, I.; Li, X.; Maia-Grondard, A.; Signor, C.L.; Bouteiller, N.; et al. The Pea TCP Transcription Factor PsBRC1 Acts Downstream of Strigolactones to Control Shoot Branching. Plant Physiol. 2012, 158, 225–238. [Google Scholar] [CrossRef]
  31. Doebley, J.; Stec, A.; Hubbard, L. The evolution of apical dominance in maize. Nature 1997, 386, 485–488. [Google Scholar] [CrossRef]
  32. Takeda, T.; Suwa, Y.; Suzuki, M.; Kitano, H.; Ueguchi-Tanaka, M.; Ashikari, M.; Matsuoka, M.; Ueguchi, C. The OsTB1 gene negatively regulates lateral branching in rice. Plant J. 2003, 33, 513–520. [Google Scholar] [CrossRef] [PubMed]
  33. Finlayson, S.A. Arabidopsis TEOSINTE BRANCHED1-LIKE 1 Regulates Axillary Bud Outgrowth and is Homologous to Monocot TEOSINTE BRANCHED1. Plant Cell Physiol. 2007, 48, 667–677. [Google Scholar] [CrossRef] [PubMed] [Green Version]
  34. Kebrom, T.H.; Brutnell, T.P.; Finlayson, S.A. Suppression of sorghum axillary bud outgrowth by shade, phyB and defoliation signalling pathways. Plant Cell Environ. 2010, 33, 48–58. [Google Scholar] [CrossRef]
  35. Minakuchi, K.; Kameoka, H.; Yasuno, N.; Umehara, M.; Luo, L.; Kobayashi, K.; Hanada, A.; Ueno, K.; Asami, T.; Yamaguchi, S.; et al. FINE CULM1 (FC1) Works Downstream of Strigolactones to Inhibit the Outgrowth of Axillary Buds in Rice. Plant Cell Physiol. 2010, 51, 1127–1135. [Google Scholar] [CrossRef] [PubMed]
  36. Cubas, P.; Lauter, N.; Doebley, J.; Coen, E. The TCP domain: a motif found in proteins regulating plant growth and development. Plant J. 1999, 18, 215–222. [Google Scholar] [CrossRef] [PubMed] [Green Version]
  37. Sorefan, K.; Booker, J.; Haurogné, K.; Goussot, M.; Bainbridge, K.; Foo, E.; Chatfield, S.; Ward, S.; Beveridge, C.; Rameau, C.; et al. MAX4 and RMS1 are orthologous dioxygenase-like genes that regulate shoot branching in Arabidopsis and pea. Genes Dev. 2003, 17, 1469–1474. [Google Scholar] [CrossRef]
  38. Clark, R.M.; Linton, E.; Messing, J.; Doebley, J.F. Pattern of diversity in the genomic region near the maize domestication gene tb1. Proc. Natl. Acad. Sci. USA 2004, 101, 700–707. [Google Scholar] [CrossRef]
  39. Clark, R.M.; Wagler, T.N.; Quijada, P.; Doebley, J. A distant upstream enhancer at the maize domestication gene tb1 has pleiotropic effects on plant and inflorescent architecture. Nat. Genet. 2006, 38, 594–597. [Google Scholar] [CrossRef]
  40. Bates, D.; Sarkar, D. lme4: Linear mixed-effects models using S4 classes. 2007. [Google Scholar]
  41. Lee, Y.-G.; Jeong, N.; Kim, J.H.; Lee, K.; Kim, K.H.; Pirani, A.; Ha, B.-K.; Kang, S.-T.; Park, B.-S.; Moon, J.-K.; et al. Development, validation and genetic analysis of a large soybean SNP genotyping array. Plant J. 2015, 81, 625–636. [Google Scholar] [CrossRef]
  42. Price, A.L.; Patterson, N.J.; Plenge, R.M.; Weinblatt, M.E.; Shadick, N.A.; Reich, D. Principal components analysis corrects for stratification in genome-wide association studies. Nat. Genet. 2006, 38, 904–909. [Google Scholar] [CrossRef]
  43. Bradbury, P.J.; Zhang, Z.; Kroon, D.E.; Casstevens, T.M.; Ramdoss, Y.; Buckler, E.S. TASSEL: software for association mapping of complex traits in diverse samples. Bioinformatics 2007, 23, 2633–2635. [Google Scholar] [CrossRef] [PubMed] [Green Version]
  44. Li, H.; Durbin, R. Fast and accurate short read alignment with Burrows-Wheeler transform. Bioinformatics 2009, 25, 1754–1760. [Google Scholar] [CrossRef] [PubMed] [Green Version]
  45. Li, H.; Handsaker, B.; Wysoker, A.; Fennell, T.; Ruan, J.; Homer, N.; Marth, G.; Abecasis, G.; Durbin, R. 1000 Genome Project Data Processing Subgroup The Sequence Alignment/Map format and SAMtools. Bioinformatics 2009, 25, 2078–2079. [Google Scholar] [CrossRef] [PubMed]
  46. Danecek, P.; Auton, A.; Abecasis, G.; Albers, C.A.; Banks, E.; DePristo, M.A.; Handsaker, R.E.; Lunter, G.; Marth, G.T.; Sherry, S.T.; et al. The variant call format and VCFtools. Bioinformatics 2011, 27, 2156–2158. [Google Scholar] [CrossRef]
  47. Cingolani, P.; Platts, A.; Wang, L.L.; Coon, M.; Nguyen, T.; Wang, L.; Land, S.J.; Lu, X.; Ruden, D.M. A program for annotating and predicting the effects of single nucleotide polymorphisms, SnpEff: SNPs in the genome of Drosophila melanogaster strain w1118; iso-2; iso-3. Fly (Austin) 2012, 6, 80–92. [Google Scholar] [CrossRef] [PubMed]
  48. Untergasser, A.; Nijveen, H.; Rao, X.; Bisseling, T.; Geurts, R.; Leunissen, J.A.M. Primer3Plus, an enhanced web interface to Primer3. Nucleic Acids Res. 2007, 35, W71–W74. [Google Scholar] [CrossRef] [PubMed]
  49. Rotmistrovsky, K.; Jang, W.; Schuler, G.D. A web server for performing electronic PCR. Nucleic Acids Res. 2004, 32, W108–W112. [Google Scholar] [CrossRef]
  50. Livak, K.J.; Schmittgen, T.D. Analysis of Relative Gene Expression Data Using Real-Time Quantitative PCR and the 2−ΔΔCT Method. Methods 2001, 25, 402–408. [Google Scholar] [CrossRef]
  51. Kumar, S.; Stecher, G.; Tamura, K. MEGA7: Molecular Evolutionary Genetics Analysis Version 7.0 for Bigger Datasets. Mol. Biol. Evol. 2016, 33, 1870–1874. [Google Scholar] [CrossRef]
Figure 1. Principal components analysis (PCA) and linkage disequilibrium (LD) decay of the soybean core collection. (A) Scree plot showing the proportion of variance explained by principal components (PCs). (B) LD decay based on pairwise r2 values. Blue line represents the overall rate of LD decay. Red and green lines indicate LD decay patterns of euchromatin and heterochromatin, respectively.
Ijms 20 00135 g001
Figure 2. Genome-wide association study (GWAS) of branch numbers in the soybean core collection. (A) Genome-wide Manhattan plot of branch numbers. (B) LD region harboring qtnBR6-1 on Chr 6. The pair-wise r2 values between markers in LD are presented along a color gradient ranging from gray to red. The p-value threshold is indicated with red horizontal lines in Manhattan plots. (C) Protein-coding genes located in the LD block of qtnBR6-1.
Ijms 20 00135 g002
Figure 3. Expression patterns of genes located in the LD block of qtnBR6-1. (A) Heatmap showing the expression patterns of 20 genes obtained from the publicly available RNA-seq data. Gene expression values of log2(FPKM+1) were used to generate the heatmap. (B) Comparison of expression levels of selected genes in the shoot apical meristem between NILs with high-branching (HB) and low-branching (LB) alleles (NIL-HB and NIL-LB, respectively). The red and green bars indicate mean expression level of genes for nine samples (three biological replicates x three technical replicates) of each NIL (NIL-LB and NIL-HB), respectively. Black variance bars represent standard error of the mean (SEM). Statistically significant differences in relative gene expression between NIL-HB and NIL-LB are indicated with asterisks (*, p < 0.05; **, p < 0.01; ***, p < 0.001). NS, not significant.
Ijms 20 00135 g003
Figure 4. Allelic association of nucleotide variants in BRC1 with branch numbers and protein sequence alignment of BRC1. (A) Physical location of qtnBR6-1 in the pericentromeric region of Chr 6, and a cluster of single nucleotide polymorphism (SNPs) segregating between NIL-HB and NIL-LB. The SNPs between NIL-HB and NIL-LB within the LD block of qtnBR6-1 are originated from SS0404-T5-76 (high-branching, green) and Jiyu69 (low-branching, orange), respectively. The X-axis indicates the genomic position (bp). (B) Allelic association of SNPs in BRC1 with branch numbers among 59 United States Department of Agriculture (USDA) soybean accessions. Among eight SNPs, one missense mutation and two SNPs upstream of BRC1, indicated by red bars, were associated with branch numbers in 59 USDA soybean accessions. (C) Protein sequence alignment of BRC1 orthologues. The missense mutation (glutamate to lysine) at amino acid position 199 is outlined with a black box.
Ijms 20 00135 g004
Table 1. Quantitative trait nucleotides (QTNs) associated with branch numbers in the soybean core collection identified by genome-wide association study (GWAS).
QTN IDMarker IDChr aMarker Position (bp)p-ValuePhenotypic R2 (%)Chromosomal LocationLinkage Disequilibrium BlockNo. of GenesKnown QTLReference b
qtnBR6-1AX-90305605620,663,1016.43 × 10−65.8Heterochromatin20,433,10120,893,10120qBR6-1[8]
qtnBR11-1AX-905124261116,074,9929.98 × 10−65.0Heterochromatin15,844,99216,304,99213qBR11-1[8]
qtnBR11-2AX-904727181128,613,1189.51 × 10−65.6Heterochromatin28,383,11828,843,11823qBR11-1[8]
qtnBR12-1AX-904193631238,057,7802.89 × 10−66.4Euchromatin37,987,78038,127,78014
qtnBR20-1AX-905191992042,471,3168.88 × 10−64.9Euchromatin42,401,31642,541,31613
a Chr represents the soybean chromosome. b Reference represented reference article for previously reported quantitative trait loci (QTL).
Table 2. Effect of planting density on the branch number of soybean near-isogenic lines (NILs) carrying high-branching (HB) and low-branching (LB) alleles (NIL-HB and NIL-LB, respectively) at the quantitative trait loci (QTL) qBR6-1.
YearPlanting DensityGrowth ConditionNIL-HBNIL-LBp-Value
2017LowGreenhouse5.8 ± 1.73.4 ± 0.70.0001
Field14.5 ± 1.112.2 ± 2.10.019
2018LowField7.1 ± 1.45.1 ± 1.60.0003
High3.3 ± 1.92.6 ± 0.80.057

