Article

Characterization of the XTH Gene Family: New Insight to the Roles in Soybean Flooding Tolerance

1
Institutes of Agricultural Science and Technology Development, Joint International Research Laboratory of Agriculture and Agri-Product Safety, Co-Innovation Center for Modern Production Technology of Grain Crops, Yangzhou University, Yangzhou 225009, China
2
National Center for Soybean Biotechnology and Division of Plant Sciences, University of Missouri, Columbia, MO 65211, USA
3
Noble Research Institute, 2510 Sam noble Pkwy, Ardmore, OK 73401, USA
*
Authors to whom correspondence should be addressed.
Int. J. Mol. Sci. 2018, 19(9), 2705; https://doi.org/10.3390/ijms19092705
Submission received: 26 June 2018 / Revised: 5 September 2018 / Accepted: 6 September 2018 / Published: 11 September 2018
(This article belongs to the Special Issue Plant Cell Wall Proteins and Development)

Abstract

:
Xyloglucan endotransglycosylases/hydrolases (XTHs) are a class of enzymes involved in the construction and remodeling of cellulose/xyloglucan crosslinks and play an important role in regulating cell wall extensibility. However, little is known about this class of enzymes in soybean. Here, 61 soybean XTH genes (GmXTHs) were identified and classified into three subgroups through comparative phylogenetic analysis. Genome duplication greatly contributed to the expansion of GmXTH genes in soybean. A conserved amino acid motif responsible for the catalytic activity was identified in all GmXTHs. Further expression analysis revealed that most GmXTHs exhibited a distinct organ-specific expression pattern, and the expression level of many GmXTH genes was significantly associated with ethylene and flooding stress. To illustrate a possible role of XTH genes in regulating stress responses, the Arabidopsis AtXTH31 gene was overexpressed in soybean. The generated transgenic plants exhibited improved tolerance to flooding stress, with a higher germination rate and longer roots/hypocotyls during the seedling stage and vegetative growth stages. In summary, our combined bioinformatics and gene expression pattern analyses suggest that GmXTH genes play a role in regulating soybean stress responses. The enhanced soybean flooding tolerance resulting from the expression of an Arabidopsis XTH also supports the role of XTH genes in regulating plant flooding stress responses.

1. Introduction

Xyloglucan endotransglycosylases/hydrolases (XET/XTHs also named XTHs) are classified as glycoside hydrolase family 16 (available online: http://www.cazy.org/fam/GH16.html) and play an important role in organ elongation by modifying xyloglucan chains or catalyzing the hydrolysis of xyloglucan [1,2,3,4]. Several studies have emphasized the significant role of this gene family in the regulation of cell wall extensibility. Overexpression of the BcXTH1 gene from Brassica campestris enhanced stem elongation in Arabidopsis by promoting cell expansion and elongation [5]. Increased SlXET1 activity affects the xyloglucan structure during the fruit ripening and softening process in transgenic tomato fruit [6]. Overexpression of GhXTH1 in cotton loosens and elongates cell wall fibers due to cleavage down the xyloglucan-cellulose chains [7,8]. PtxtXET16-34 is strongly expressed in primary-walled xylem. Transgenic hybrid Aspen analysis indicated that wood cell expansion and xyloglucan content were affected when the PtxtXET16-34 gene was overexpressed [9]. AtXTH31 regulates cell wall xyloglucan content, and AtXTH21 influences the development of primary roots by regulating the deposition of cellulose and the thickness of the cell wall in Arabidopsis [10,11].
It was reported that the XTH enzyme activity may vary with changes in environmental conditions (i.e., abiotic stresses), and that hormones play important roles in tuning XTH activity during plant development. XET activity in the maize primary root elongation zone contributes to cell wall loosening at low water potential, which is partly regulated by abscisic acid (ABA) [12,13]. Low water potential decreased the XET activity in the hypocotyl elongation zone of dark-grown soybean [14]. A decrease in XET activity was also reported in the basal 5–10 mm of maize primary roots treated with polyethylene glycol solution, which reduced the cell wall extensibility and cell elongation in that region [15]. CaXTH3 overexpressing transgenic Arabidopsis showed improved tolerance to water deficit and less tolerance to high salinity compared to wild type [16]. OsXTH8, which is highly expressed in the vascular bundles of leaf sheath and young nodal roots in rice, was upregulated by gibberellic acid. Repressed growth in transgenic rice was associated with knocking down the expression of OsXTH8 [17]. Loss of function of AtXTH31 reduces sensitivity to ABA and faster germination in Arabidopsis [18]. Downregulation of XTH8 and XTH31 is also responsible for the reduced leaf cell expansion of the Arabidopsis siz1 mutant in an SA-dependent manner [19]. The homologue of GmXTH16 in maize is induced by flooding and ethylene and is associated with aerenchyma development [20].
As the third most cultivated crop worldwide, soybean provides protein, oil, and plant natural products for human and animal consumption, but its production is limited by environmental constraints [21,22,23]. Among the major abiotic stresses, soybean is particularly sensitive to flooding stress, as plant growth and grain yields are markedly reduced in flooded soil [24]. The downregulation of gene expression related to cell wall metabolism, cellulose synthesis, and cell wall degradation caused by flooding indicates that cell wall biosynthesis is inhibited by flooding [25]. Therefore, functional characterisation of the XTH gene family in soybean will be very useful for revealing the mechanism of soybean flooding resistance. However, little is known about soybean XTHs, except for the report showing that pBRU1 (GmXTH16) is involved in brassinosteroid-regulated soybean epicotyls elongation [26]. The availability of soybean genome sequences and comparative analysis of the XTH gene family across plant species provide an excellent opportunity to explore the XTH diversity in soybean. In this study, genome-wide analyses of soybean XTHs were performed, including phylogenetic analysis, chromosomal distribution, structural, and conserved motif (DExDxEFLG) analysis. Then, a comparative analysis of the XTH gene family transcriptome in soybean tissues was performed. Further functional validation of the roles of AtXTH31 was executed in transgenic soybean during the early seedling stage under flooding stress.

2. Results

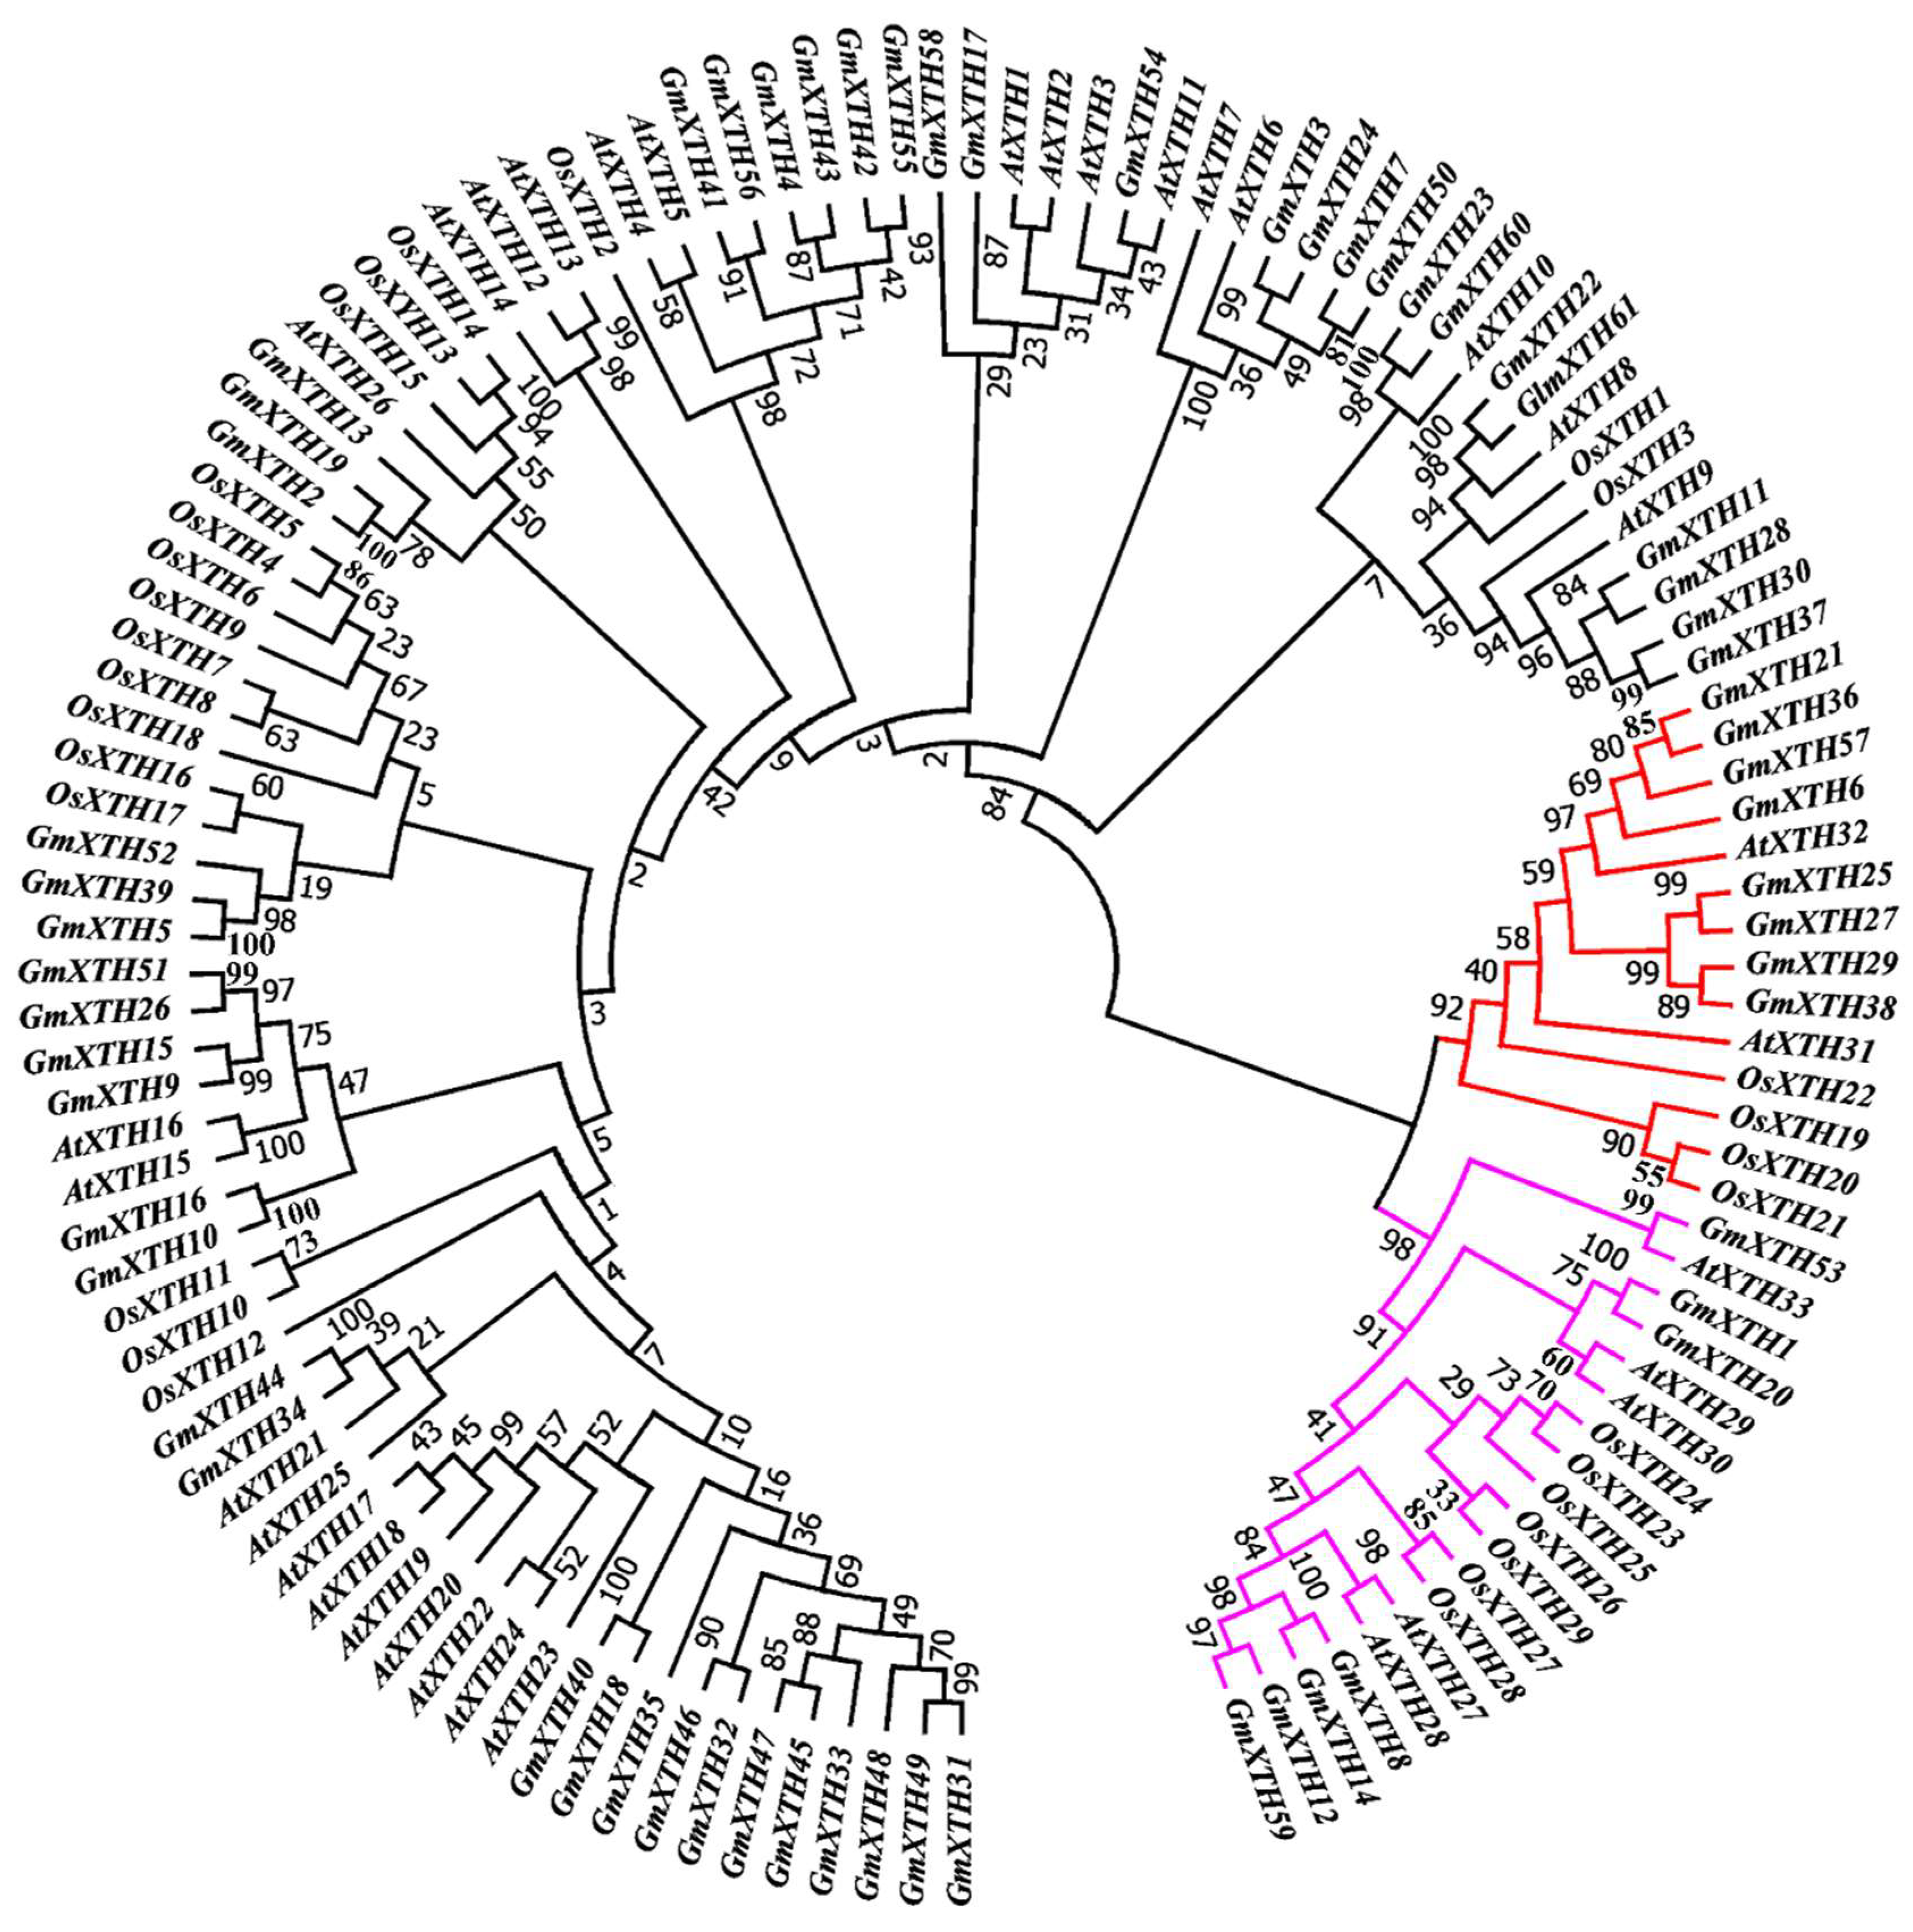
2.1. Genome-Wide Identification of Soybean XTH Family and Phylogenetic Relationship

A total of 61 GmXTHs were identified with a blasting core value over 100 by using the AtXTH31 amino acid sequence as query. They were designated GmXTH1 through GmXTH61 according to their positions on chromosomes 1 to 20 (Supplemental Table S1). The putative proteins encoded by these GmXTHs document the conserved structural features of the XTHs.
An unrooted phylogenetic analysis was constructed using a total of 123 full-length XTH protein sequences from Arabidopsis (AtXTH), rice (OsXTH), and soybean (GmXTH). According to the NJ phylogenetic tree, 46 GmXTH genes were clustered in group I/II, and 15 members were classified in group III (Figure 1). Two major groups have been previously classified based on the sequence similarity as group I/II and group III in Arabidopsis and rice [27,28]. Phylogenetic analysis revealed that the soybean GmXTH gene family was expanded widely in contrast to Arabidopsis and rice, which may correspond to the larger genome of soybean. Group III is further divided into two subgroups: group IIIA (red) and group IIIB (pink), which contains eight and seven GmXTH genes, respectively.

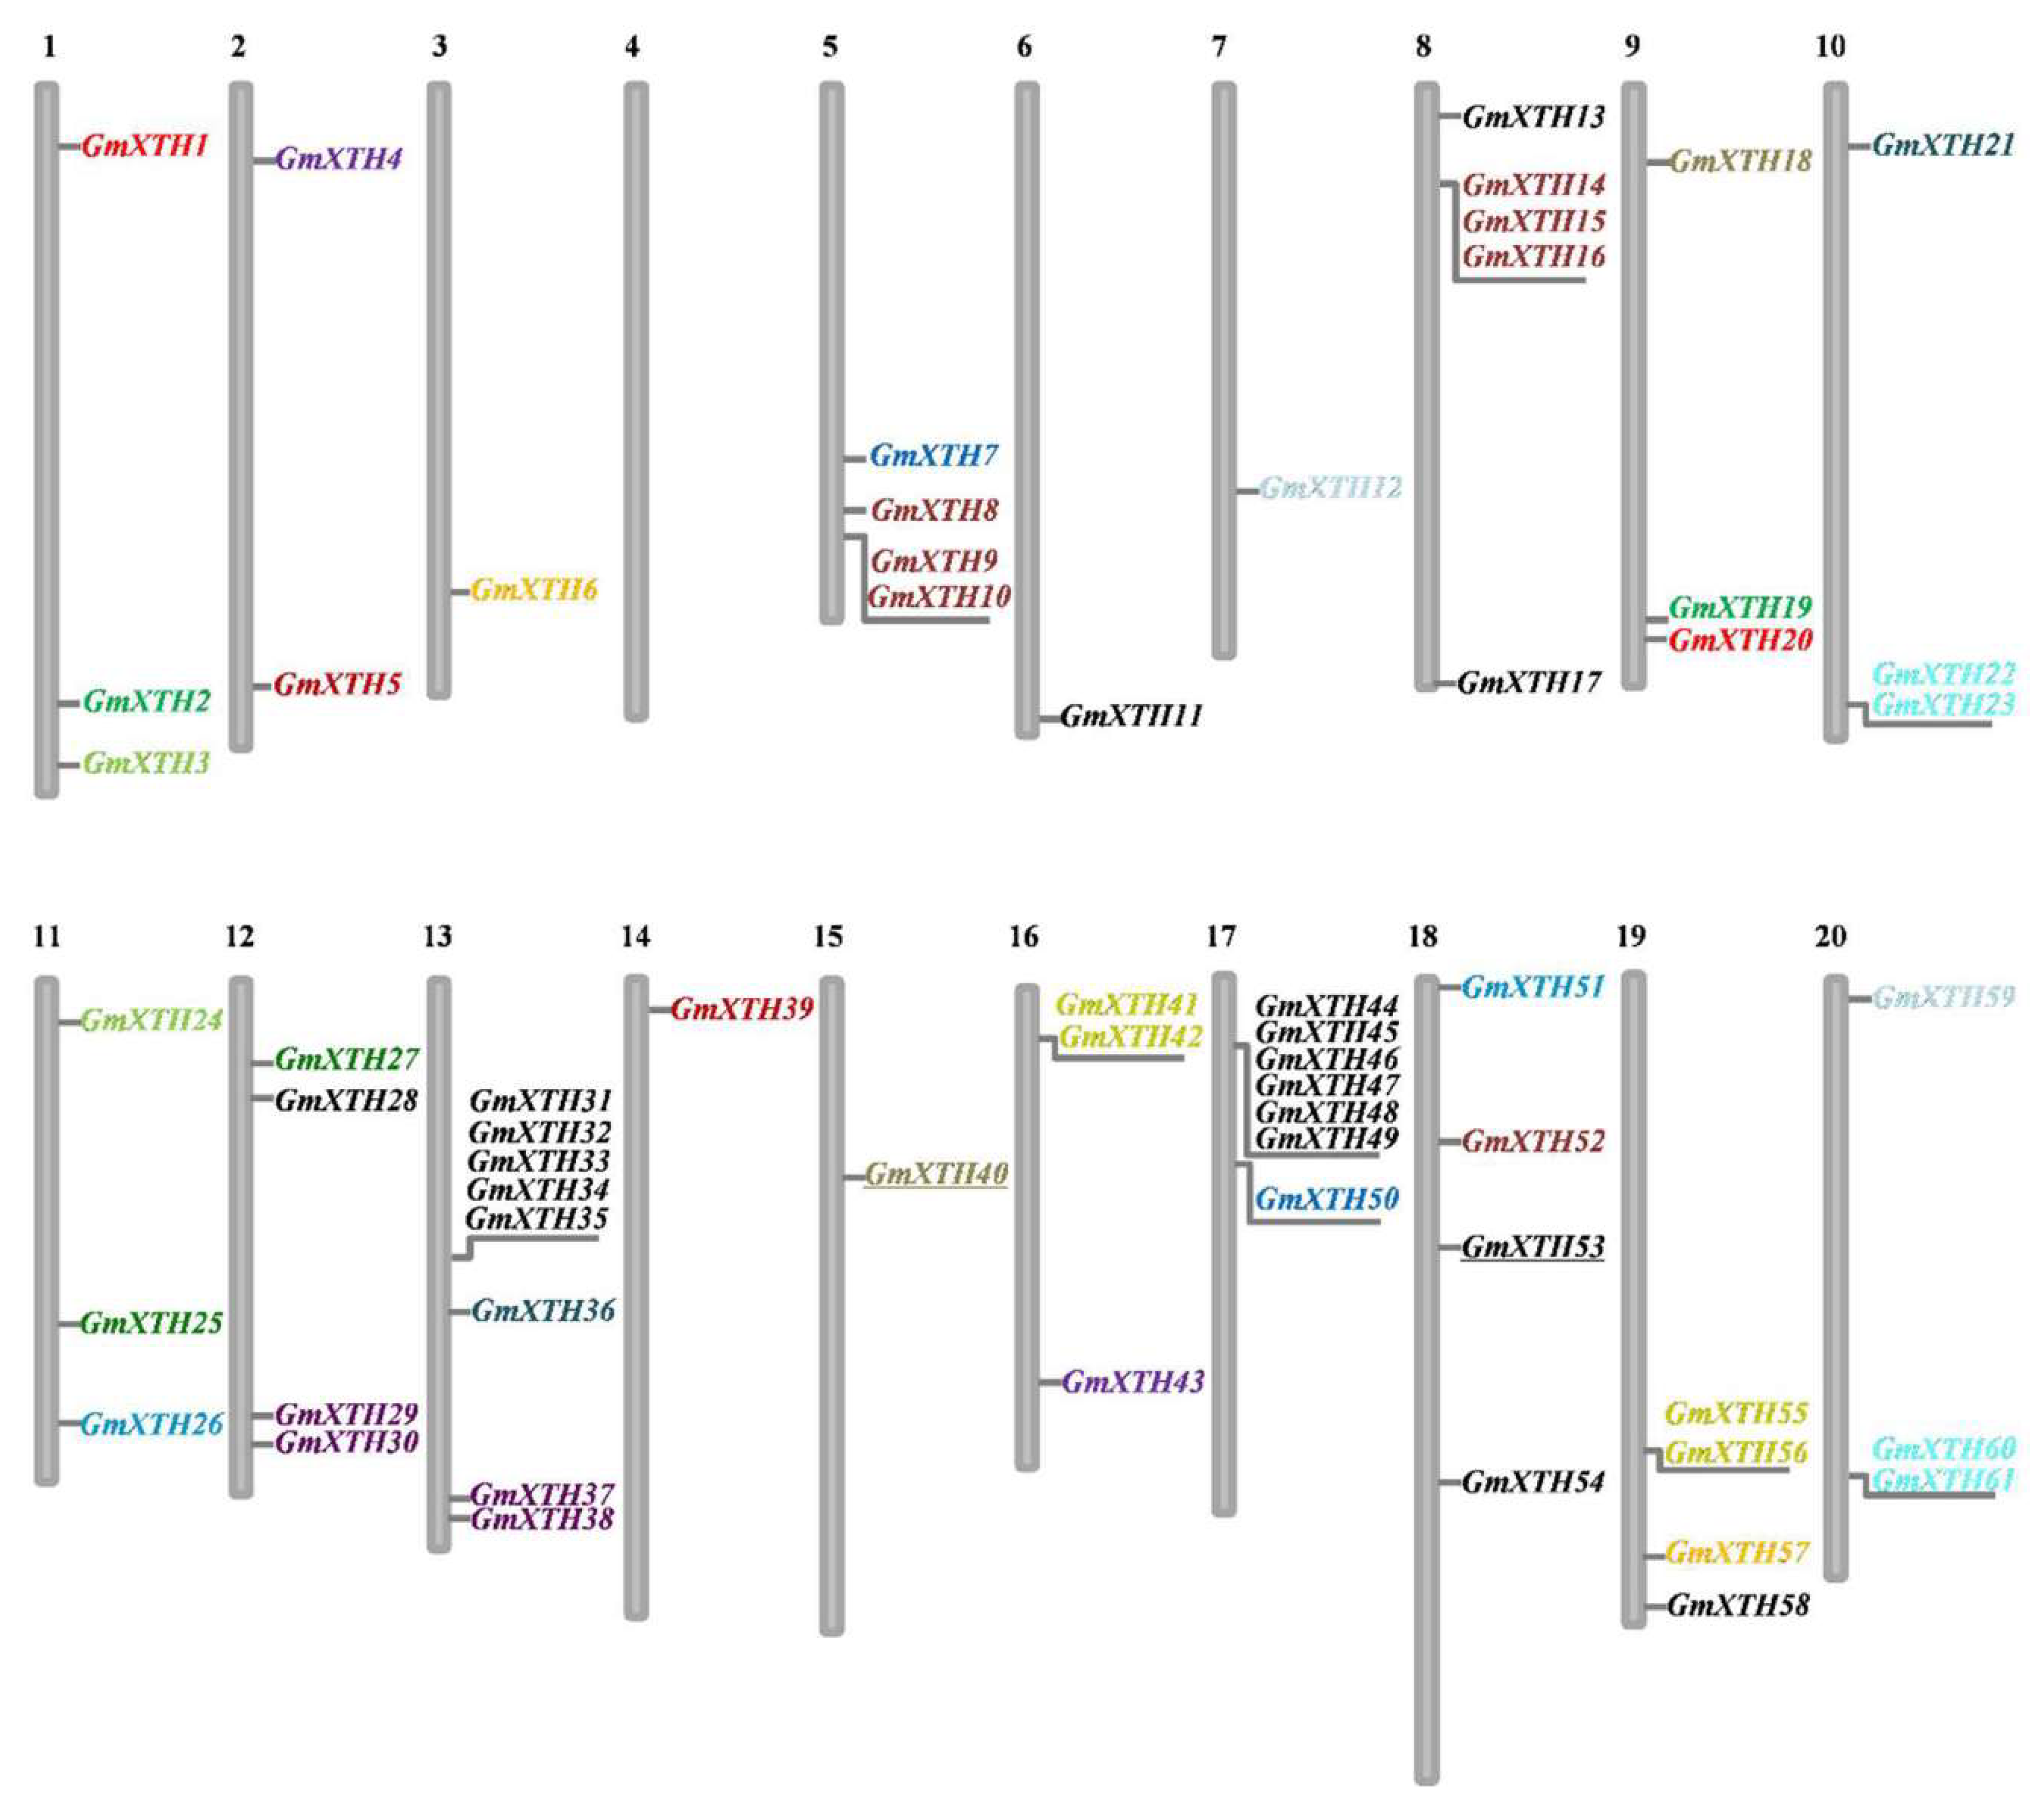
2.2. Chromosomal Location and Duplication Process of GmXTHs

Genome localization analysis revealed that GmXTHs were widely dispersed across 19 of the 20 chromosomes (Figure 2). Most GmXTH genes were distributed on the chromosome arms, except for two genes (GmXTH40 and GmXTH53) which are located in the heterochromatin regions around the centromeric repeats. Chromosome 13 contained the largest number (eight XTH genes), followed by seven on chromosome 17 and five on chromosome 8. No XTH genes were found on chromosome 4, and the remaining chromosomes each contained one to four XTH genes.
Here, we found that tandem duplication or segmental duplication was involved in the expansion of the GmXTH gene family (Supplementary Table S3). Mapping the XTH genes to their chromosome physical positions (Figure 3) revealed that many XTH genes were clustered together, suggesting that they might be the result of tandem duplication events. For example, GmXTH31, 32, 33, 34, and 35 on chromosome 13 and GmXTH44, 45, 46, 47, 48, and 49 on chromosome 17 come from tandem duplication. GmXTH41/42 pair and GmXTH55/56 pair come from tandem duplication. In addition, most of the segmental duplications of GmXTH genes occurred approximately 13 Million years ago when Glycine-specific duplication occurred in the soybean genome (Schmutz et al., 2010, [29] Supplementary Table S3). The Ka/Ks ratio for each segmentally duplicated gene pair varied from 0.06 to 0.46. This analysis suggests that all mutations in paralogous GmXTH genes are neutral or disadvantageous, as their Ka/Ks ratios were less than 1. In general, tandem and segmental duplication contributed to XTH gene expansion in soybean. Only seven genes (GmXTH11, GmXTH13, GmXTH17, GmXTH28, GmXTH53, GmXTH54, and GmXTH58) were not involved in duplication events.

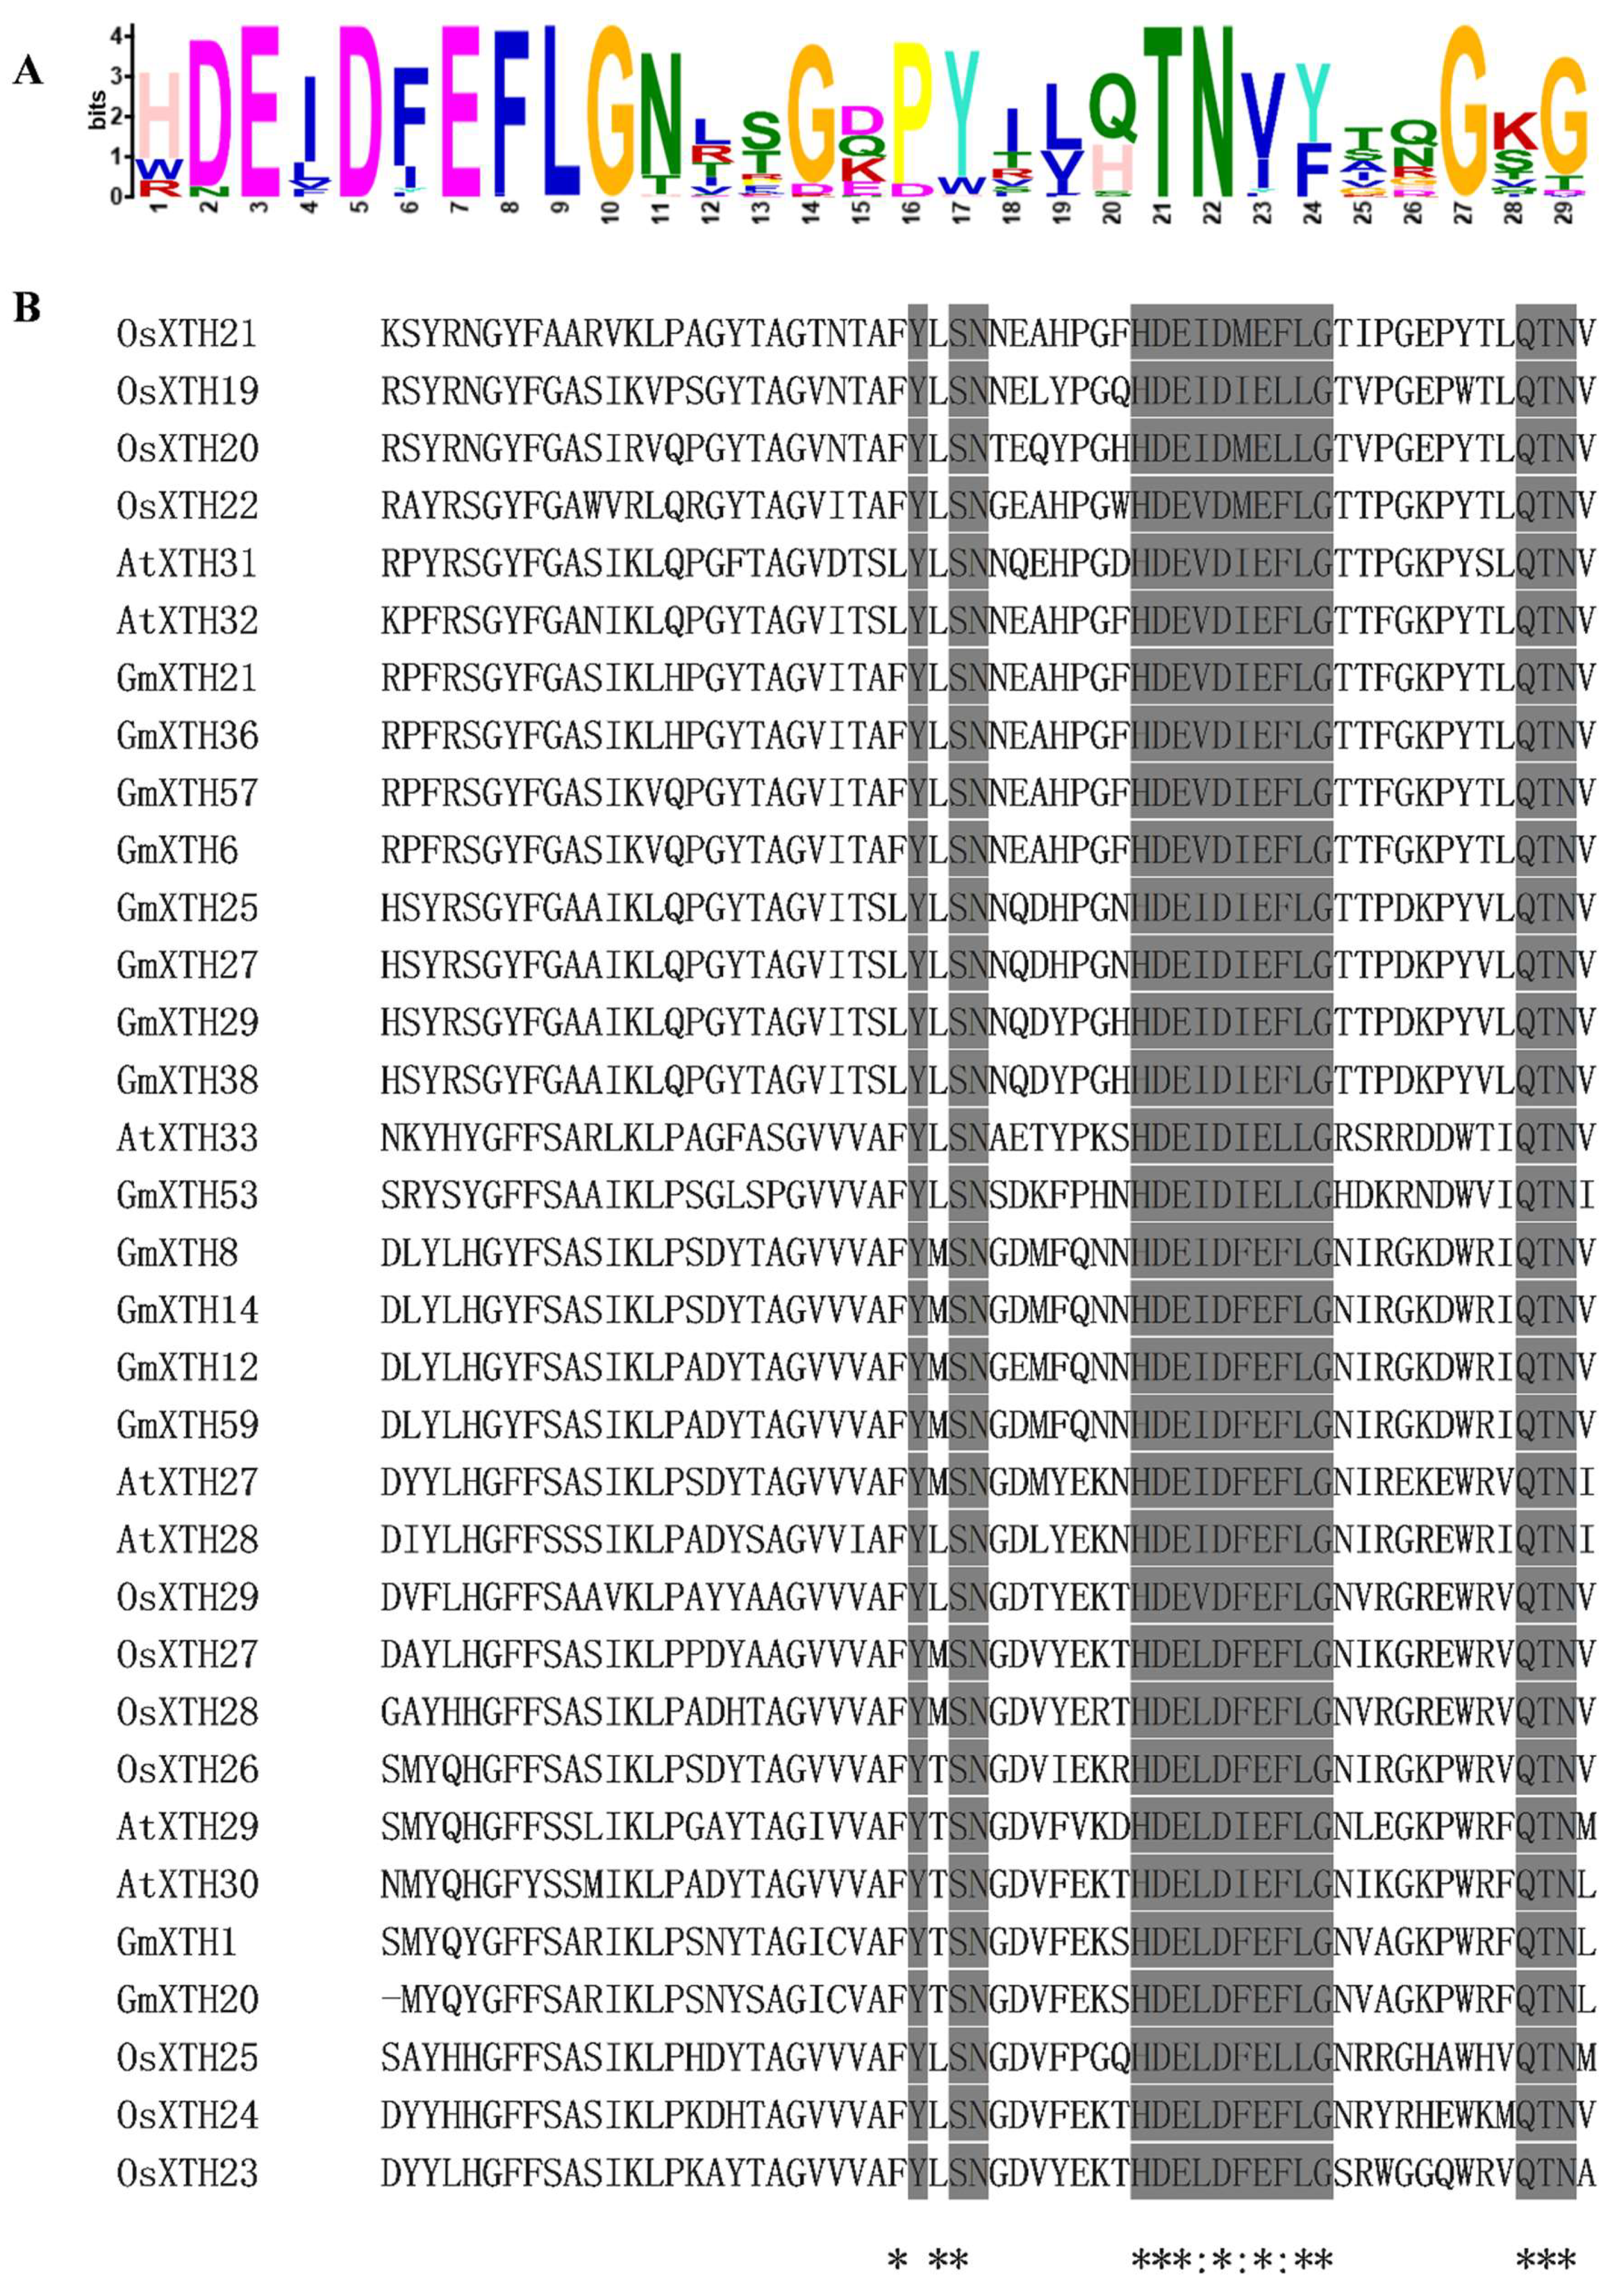
2.3. Gene Structure and Conserved Protein Motif Analysis

To gain further insights into the evolutionary relationships among GmXTH genes, the exon/intron structures were predicted based on the alignment of coding sequence (CDS) sequences with corresponding genomic DNA sequences. As illustrated in Supplementary Figure S1, all members of the GmXTH family contain three or four exons. Several genes showed a different structure; for example, GmXTH44 has an extremely long 5′ untranslated region (UTR), and GmXTH39, GmXTH5, and GmXTH58 have no 5′ and 3′ UTRs.
All GmXTH proteins contained the conserved amino acid motif DExDxEFLG (Figure 3A), which is predicted to be responsible for the catalytic activity [30,31]. Therefore, GmXTHs reported here may cut/rejoin xyloglucan chains or catalyze the hydrolysis of xyloglucan. Compared with the genes of group III, this conserved motif could be extended upstream and downstream with a more conserved motif among Arabidopsis, rice, and soybean (Figure 3B).

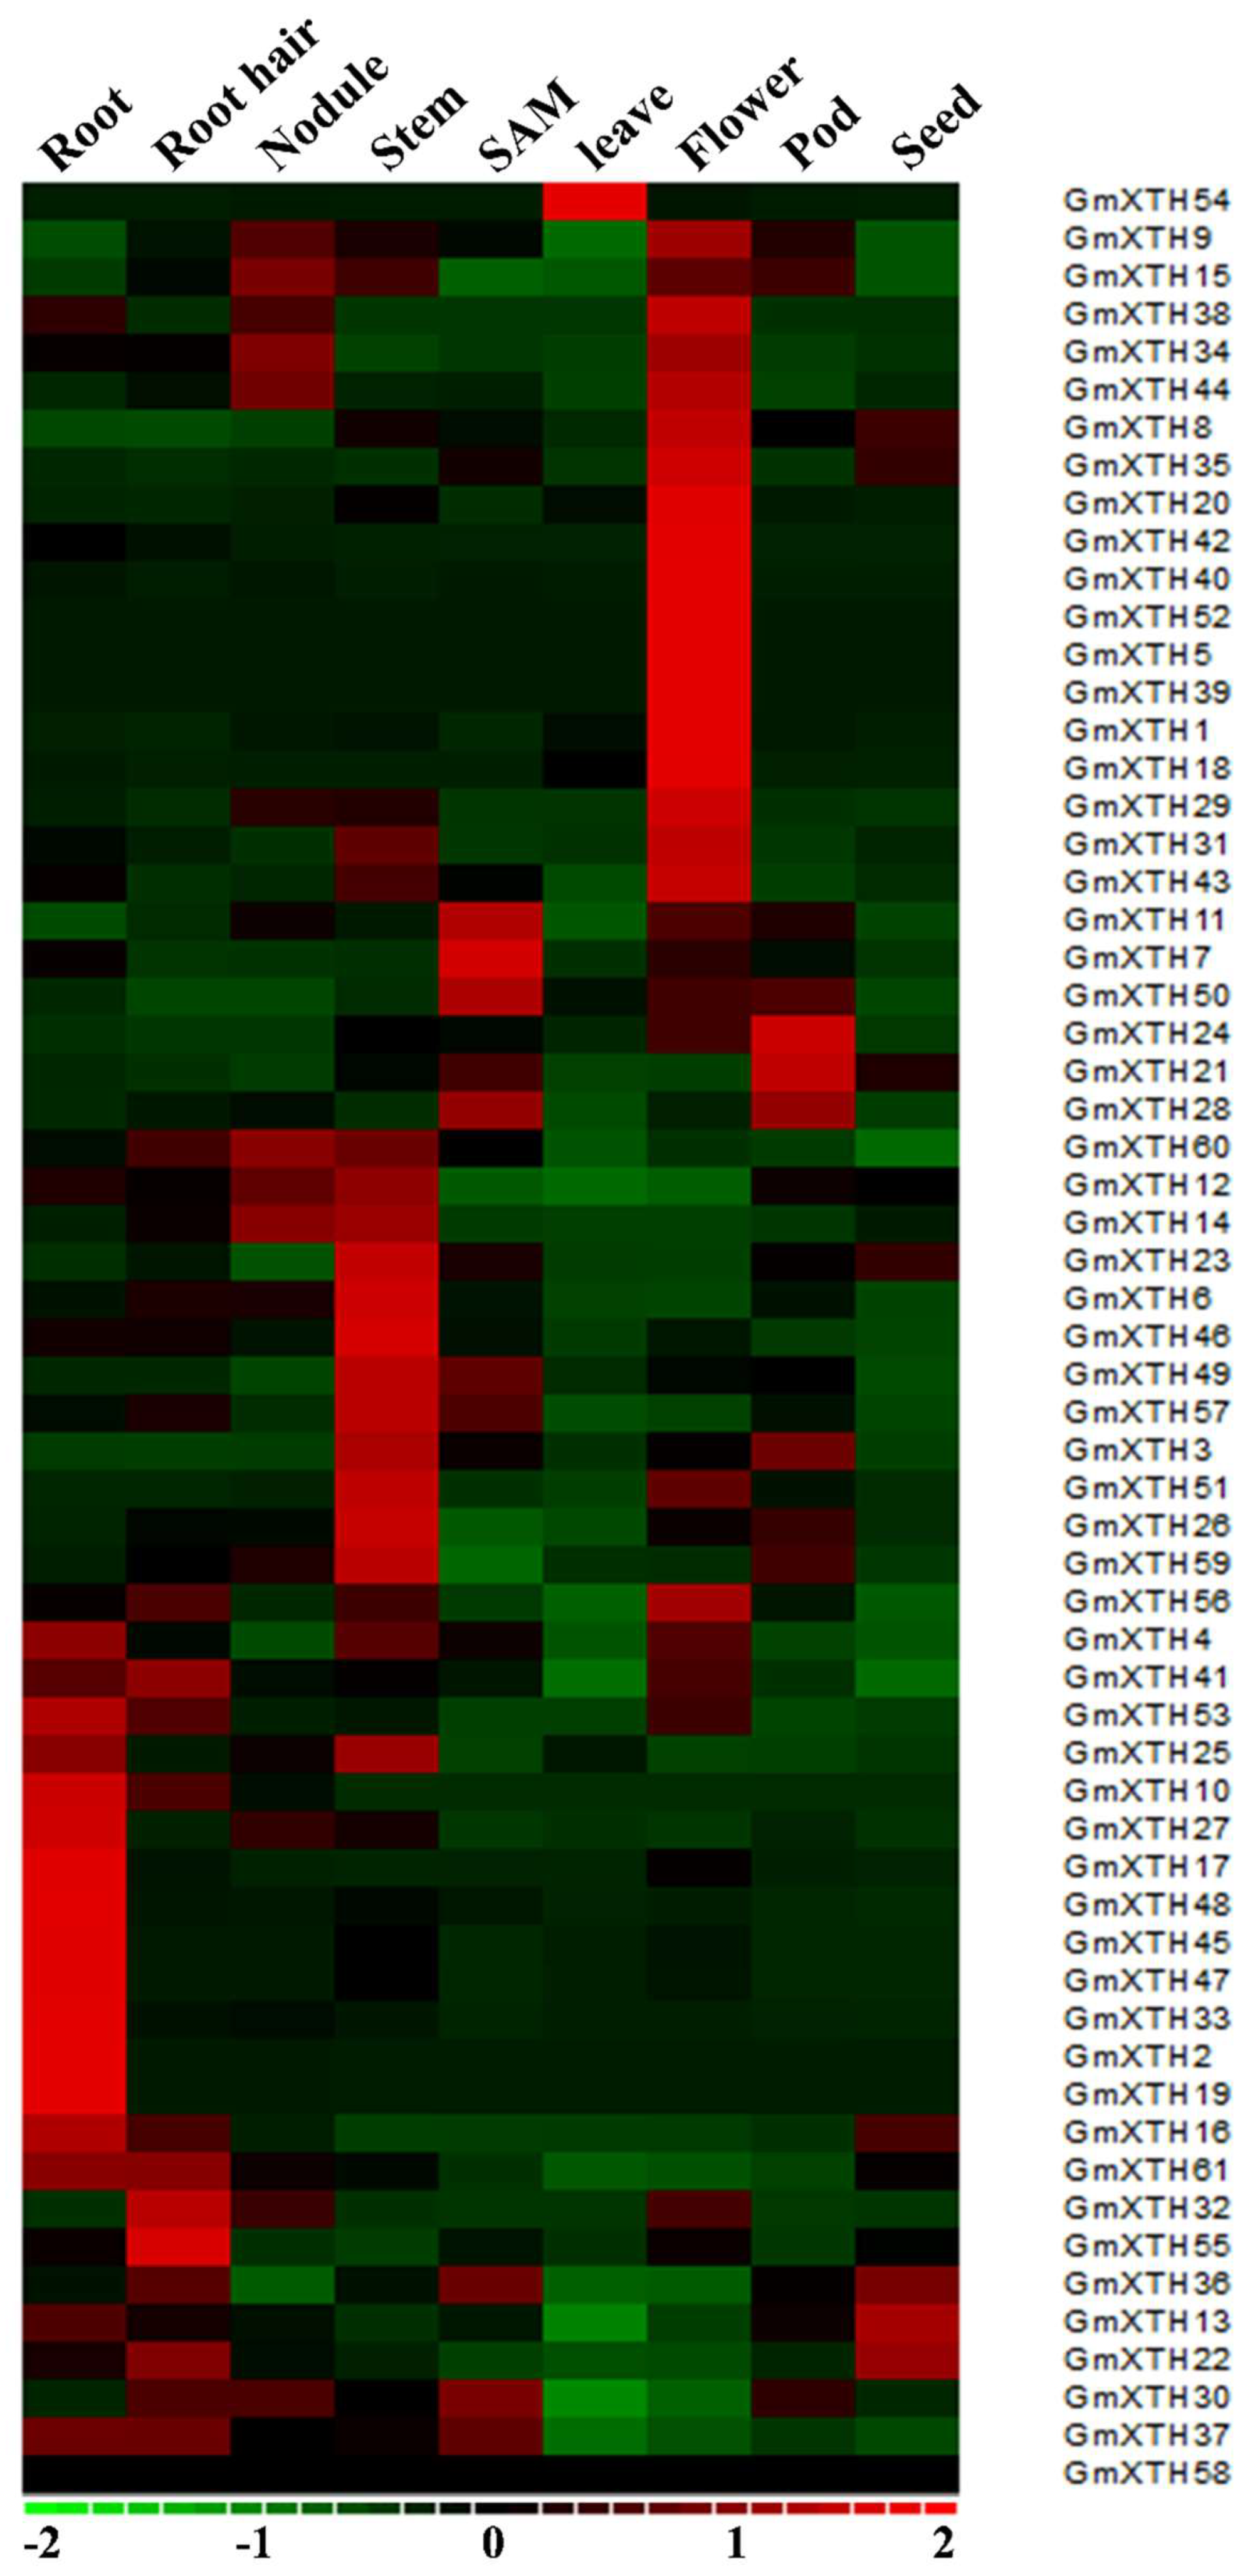
2.4. GmXTHs Show an Organ-Specific Expression Pattern

To determine the expression patterns of GmXTH genes, we used publicly available genome-wide transcriptome data of soybean organs as a resource [32]. As shown in Figure 4, GmXTH genes are broadly expressed in various soybean organs. However, most of the GmXTHs exhibit distinct tissue-specific expression patterns. For example, fourteen GmXTHs (XTH4, 41, 53, 10, 27, 17, 48, 45, 47, 33, 2, 19, 16, and 61) were highly expressed in roots, eighteen GmXTHs (XTH9, 38, 34, 44, 8, 35, 20, 42, 40, 52, 5, 39, 1, 18, 29, 31, 43, and 56) were highly expressed in flowers, thirteen GmXTHs (XTH60, 12, 14, 23, 6, 46, 49, 57, 3, 51, 26, 59, and 25) were highly expressed in stems, and three GmXTHs (XTH 36, 13, and 22) highly expressed in seeds, whereas expression levels were relatively low in other organs. In contrast, several organs only contained one or a few genes that showed specific expression patterns. For example, GmXTH54 was the only gene highly expressed in leaves compared with other organs, and GmXTH55 was the only gene highly expressed in root hair compared with other organs.
No sequence reads were found for GmXTH58 in any of the soybean organs included in the study, indicating that GmXTH58 is probably a pseudogene or expressed under special conditions or at specific developmental stages. No GmXTH gene showed specifically higher expression level in nodules. Similar expression patterns were found for some phylogenetically paired genes. For example, GmXTH25 and GmXTH27 from group IIIA were highly expressed in roots, and GmXTH29 and GmXTH38 from group IIIA were highly expressed in flowers. GmXTH14, GmXTH12, and GmXTH59 from group IIIB were highly expressed in stems.

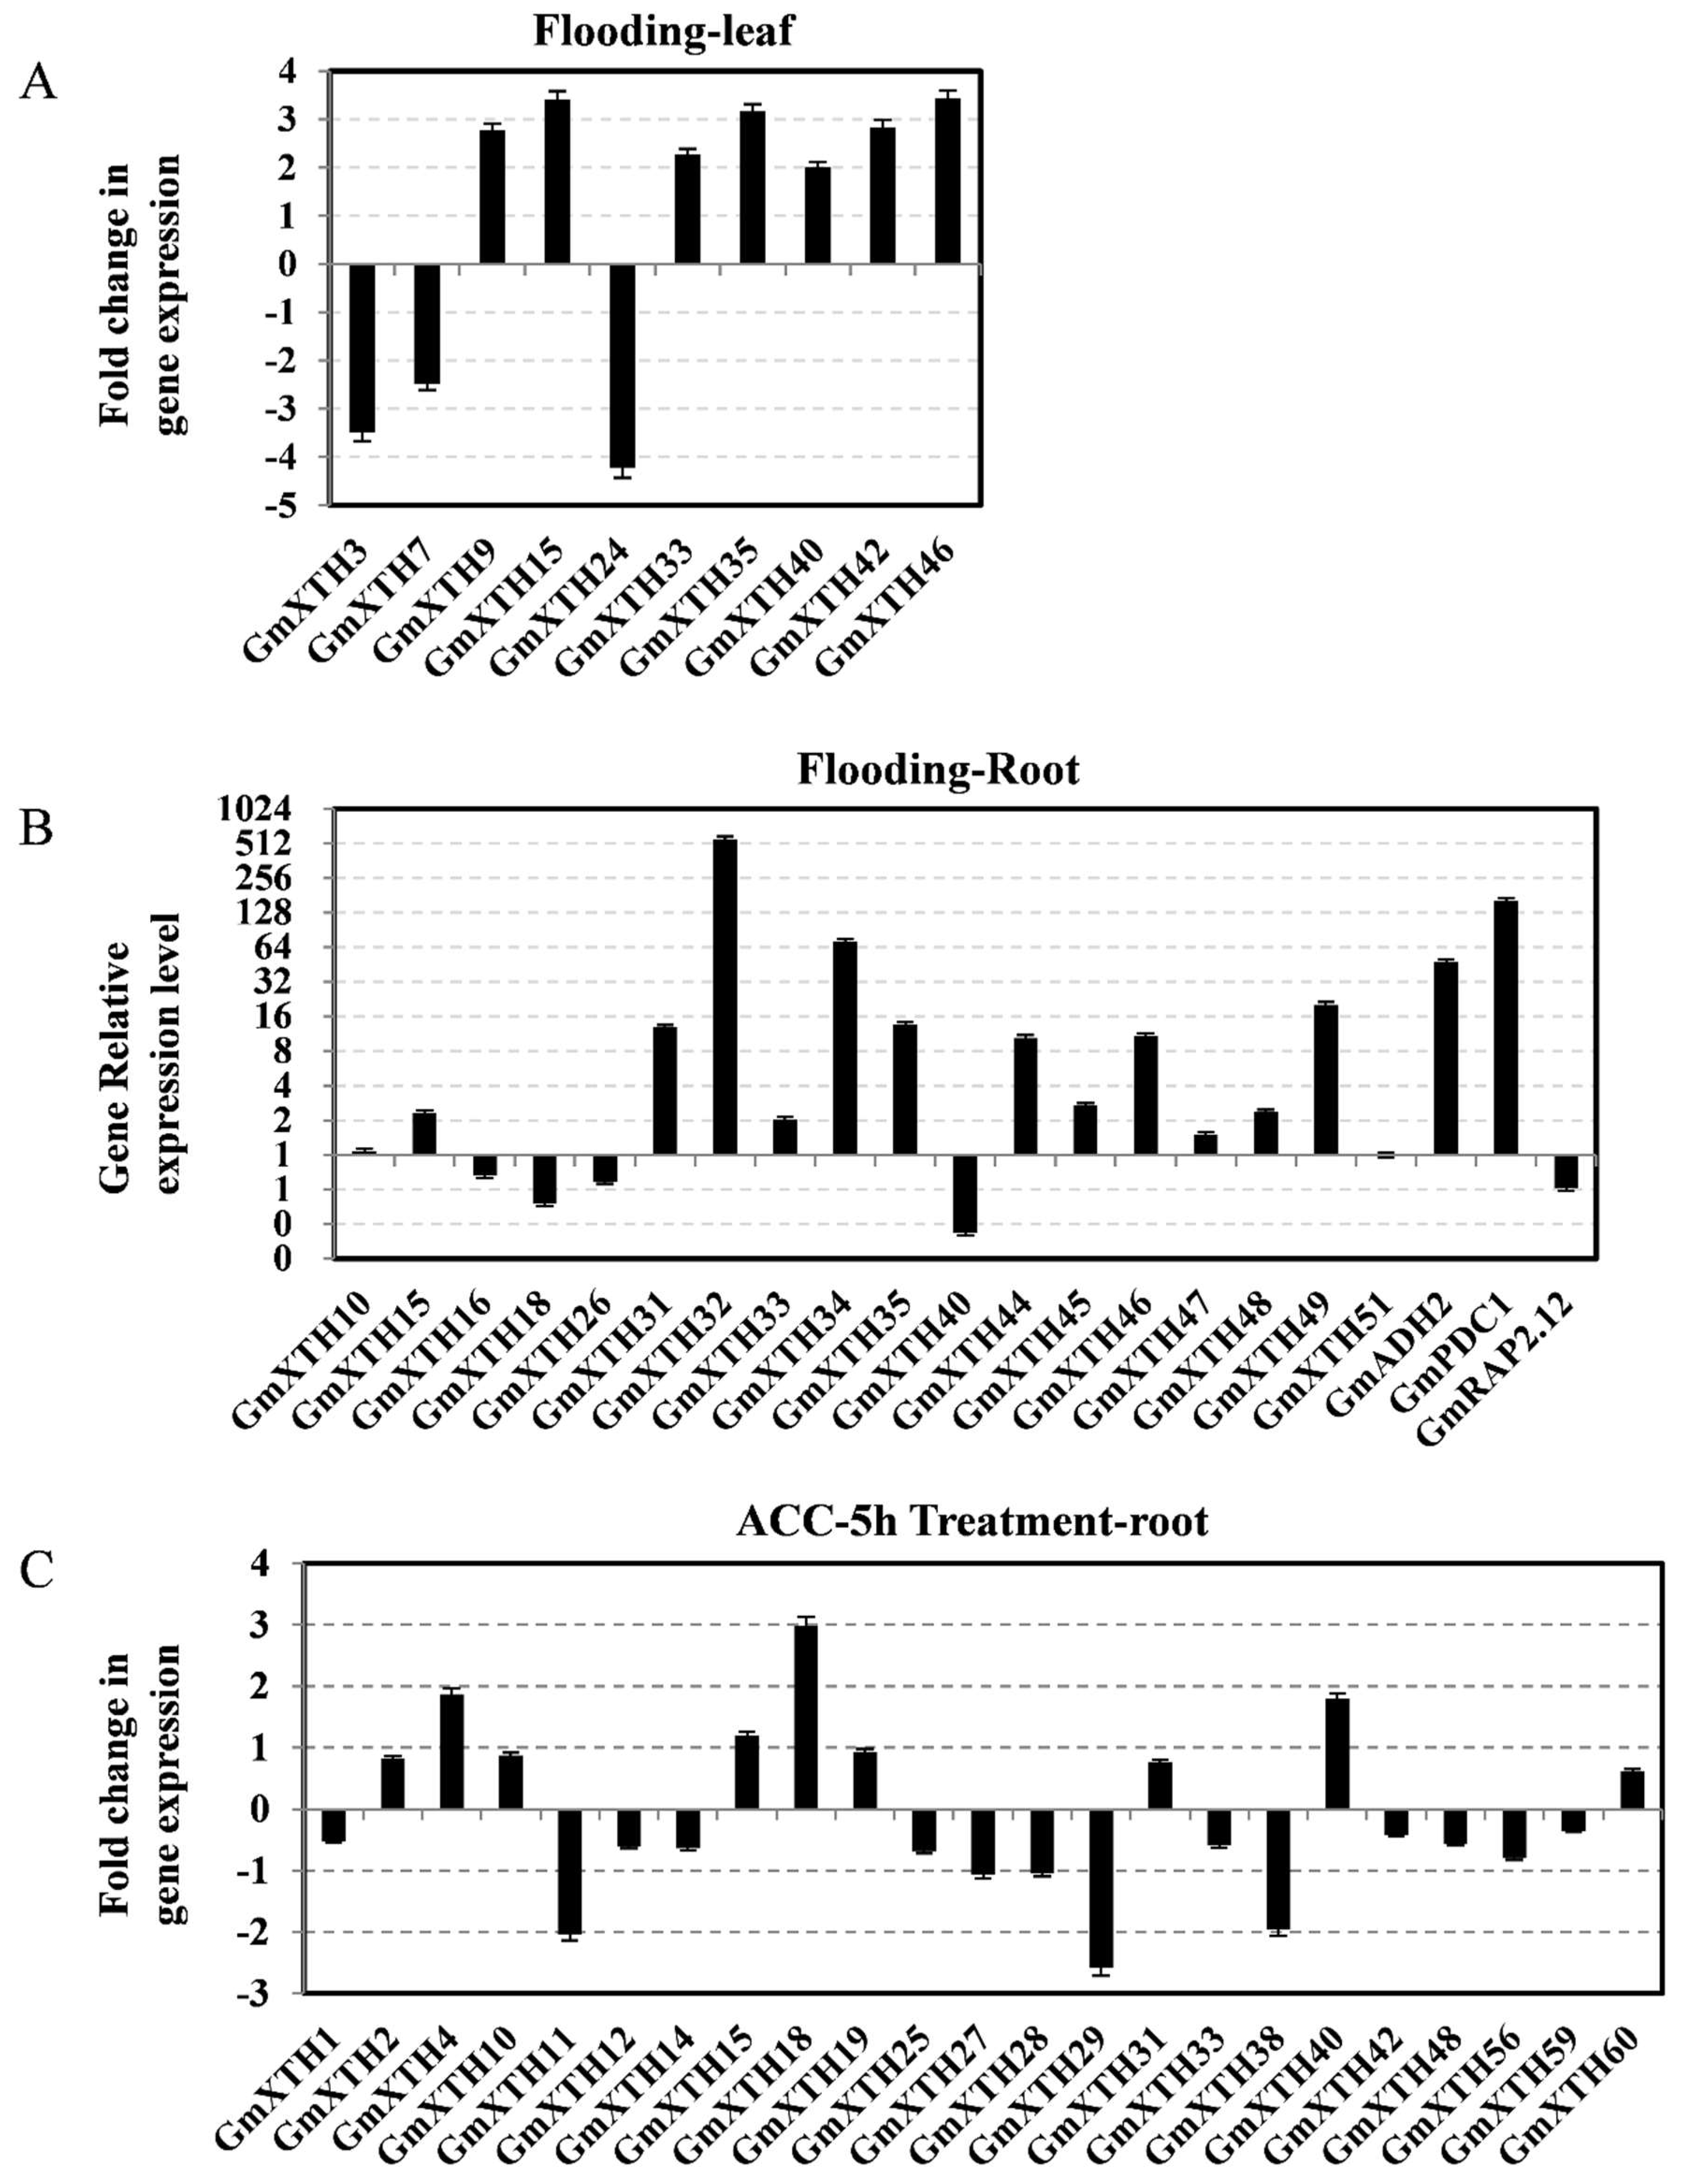
2.5. Expression Patterns of GmXTHs Correlated with Flooding Stress

Identification of the regulatory elements indicated that one 4-bp oxygen-deficiency response element (S000493 GTAC) was significantly enriched in most GmXTH promoter regions, except GmXTH23 and GmXTH55 (Supplementary Table S4). Most GmXTH genes contain more than 3 response elements. The main effect of flooding is hypoxia, which reduces submerged plant normal growth and nutrient/water uptake [33]. These results suggest that the GmXTH gene family may play important roles during soybean sustained flooding stress.
To further assess whether the expression profiles of GmXTH genes are changed under flooding stress, soybean seedlings (Williams 82 genotype) were exposed to flooding conditions for 7 days [34], and their leaves were collected for gene expression analysis by RNA-seq method. Ten out of sixty-one genes were significantly regulated under flooding stress (Figure 5A), and all genes were located in group I/II. Then, the gene expression levels of twenty genes from group I/II were assessed in soybean hypocotyl and root organs under 2 days of flooding stress by quantitative Real-Time PCR (qRT-PCR) method. The results indicated that GmXTH32 and GmXTH34, together with the marker genes GmADH2 and GmPDC1 [35,36], were predominantly upregulated by flooding stress, and all others showed higher expression levels than the untreated control, except four genes that were slightly downregulated (Figure 5B).
Ethylene will quickly accumulate under flooding conditions, and many regulators of submergence respond to ethylene [33,37]. To further investigate the relationship between the expression level of GmXTH genes and ethylene, we monitored the abundance of 61 GmXTH transcripts in soybean root tissue exposed to 50 μM 1-Aminocyclopropane-1-carboxylic acid (ACC) for 5 h by RNA-seq method (Wang and Nguyen et al., University of Missouri, Columbia, MO. Williams 82, 2015). We found that twenty-three GmXTH genes were significantly regulated under ACC treatment (Figure 5). Among them, GmXTH18 was highly induced, and GmXTH29 was highly down-regulated. Interestingly, GmXTH25, 27, 28, and 29 (group IIIA) were downregulated. We also found the GmXTH40 was oppositely adjusted by flooding in leaf and root tissues. GmXTH32 and GmXTH34 were significantly induced by flooding in roots but not in leaves. Interestingly, a similar expression pattern was found for the tandem or segmental duplicated gene pairs located on chr13 and chr17. For example, GmXTH31 and GmXTH49 are both upregulated, and GmXTH18 and GmXTH40 are both downregulated by flooding stress in the root (Figure 5).

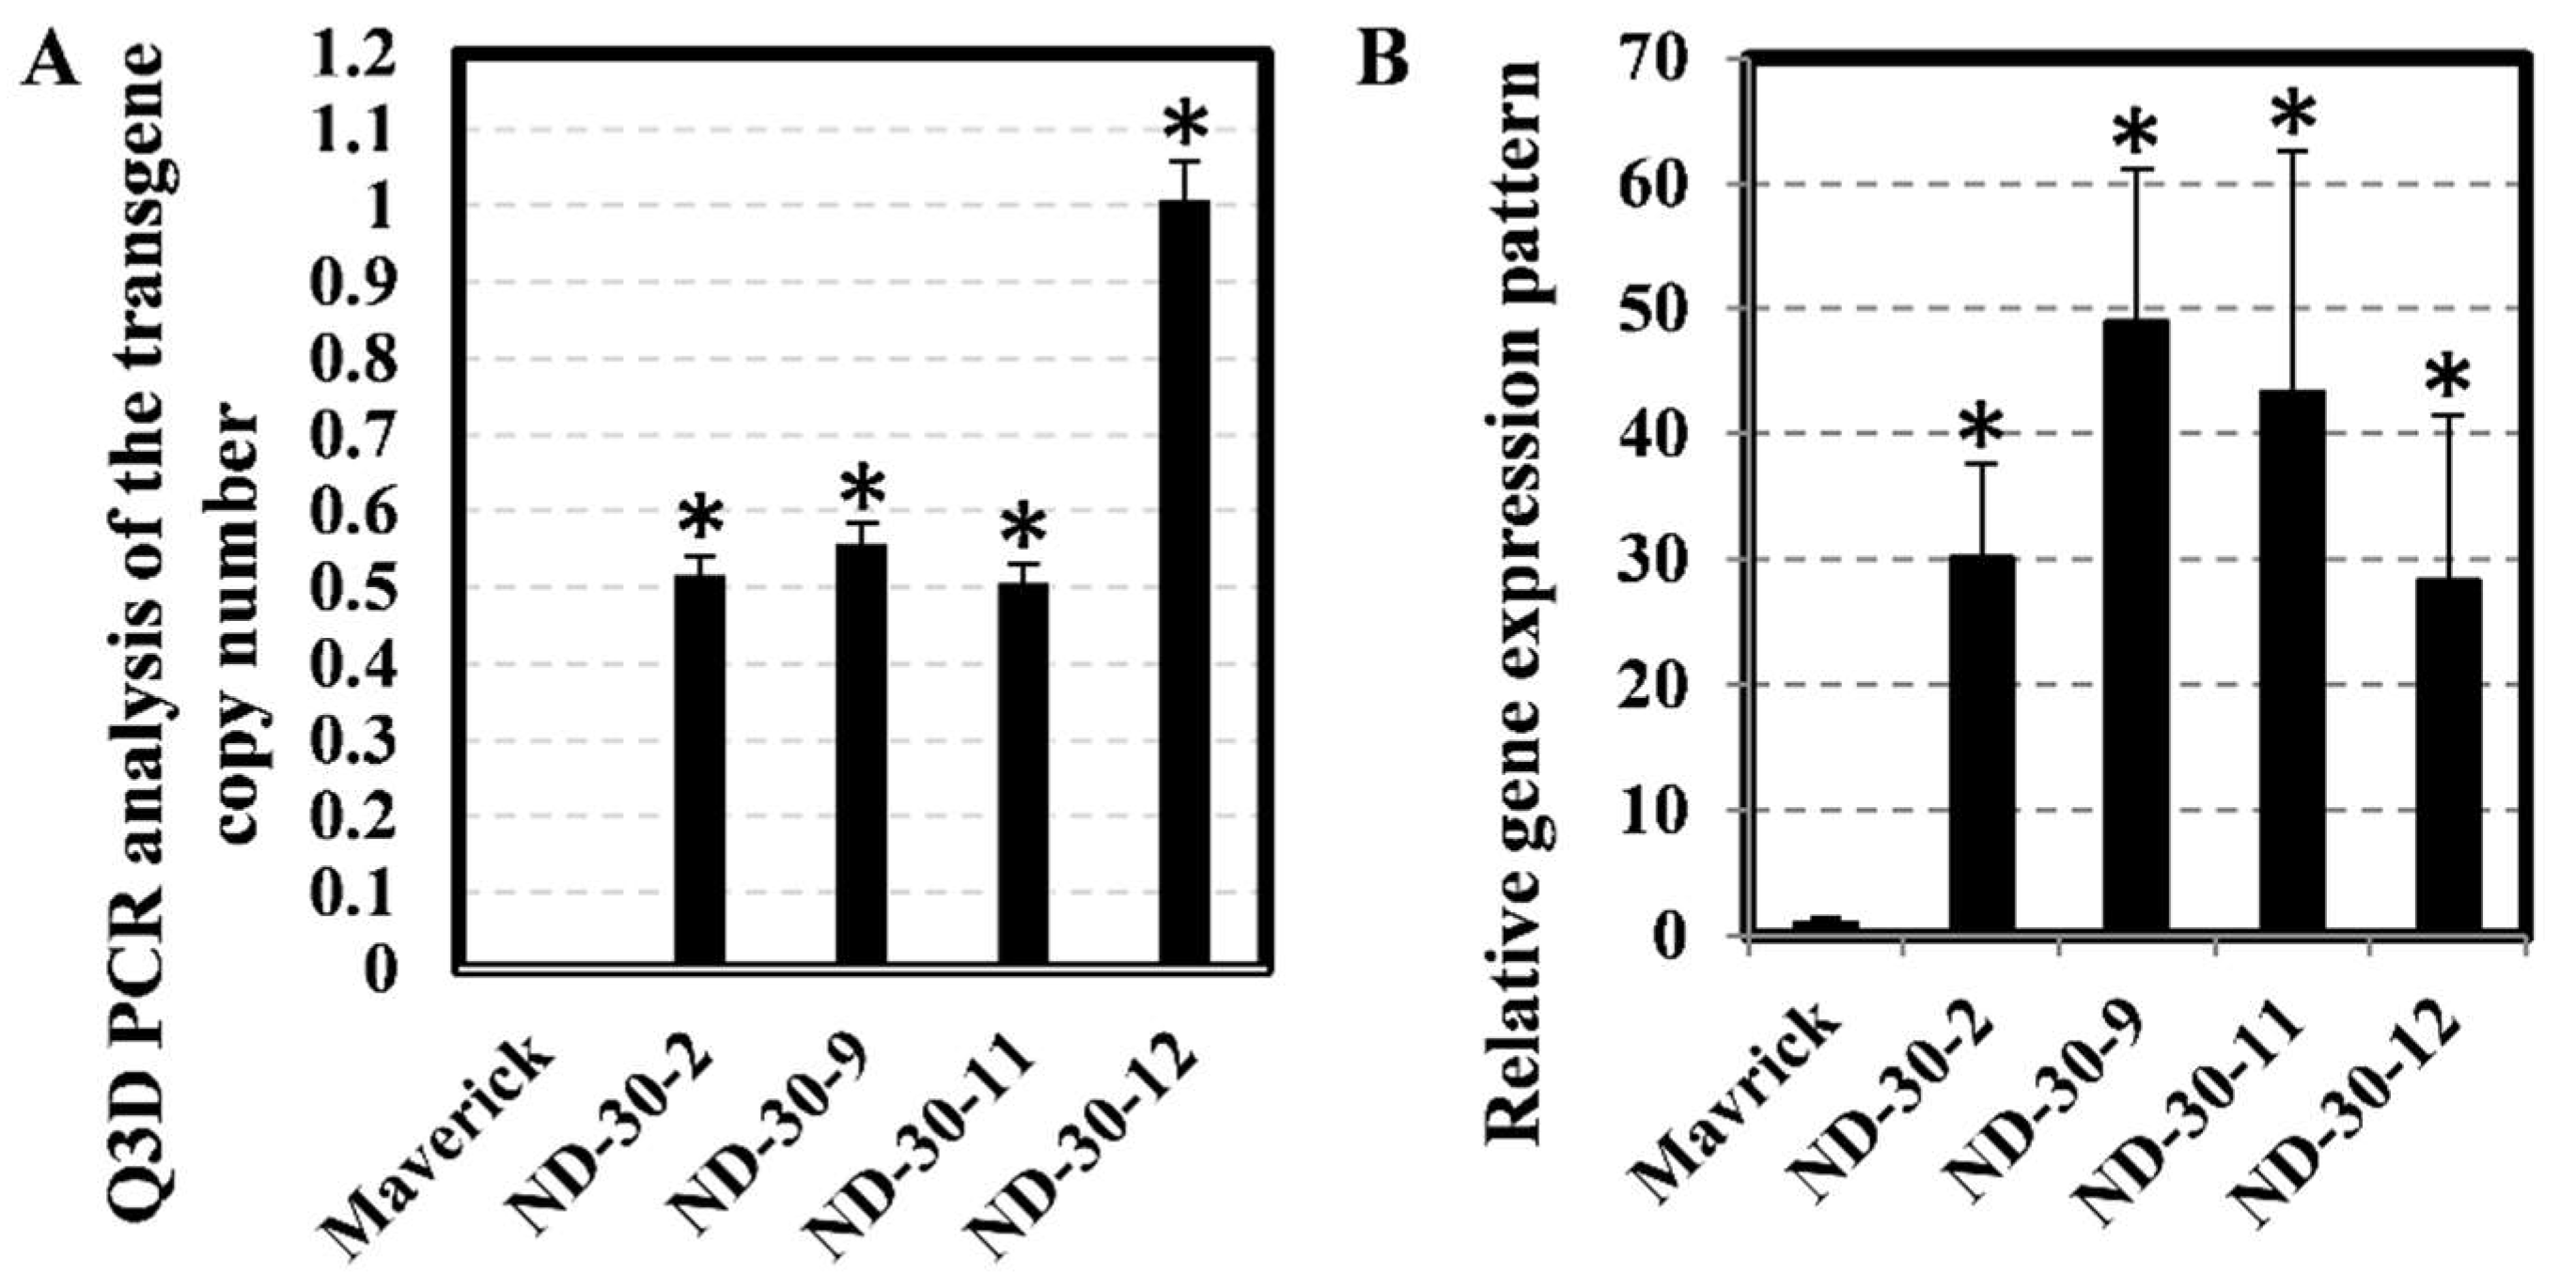
2.6. Stable Transgenic Soybean with Overexpression of AtXTH31

To further characterize how XTH genes affect root morphology and maintain physiological response under flooding conditions during soybean seedling development, AtXTH31 (under the control of the AtMyb2 promoter) was transformed into soybean (cultivar Maverick). Over twenty independent transgenic events were generated, and six events were first identified through the general PCR method. Subsequently, the copy number variation of the transgene in those events (T0 generation) was inferred using the Q3D PCR method. Three events (Code: ND-30-2, ND-30-9 and ND-30-11) contained one copy number of the transgene, and one event (Code: ND-30-12) showed two copies of inserts (Figure 6A). However, the other two events showed a very low copy number (less than 0.5), which indicates that those events are chimeras (transgenic plant or plant part that is a mixture of two or more genetically different types of cells). Homozygous T3 transgenic soybean lines from the above events were obtained and confirmed using herbicide-resistance segregation analysis. An ND-30-12 single copy insert line was chosen from segregated T1 generation by the Q3D PCR method.
The transcript abundance of AtXTH31 in different T3 homozygous transgenic soybean lines was investigated using qRT-PCR. Lines ND-30-2 and ND-30-12 had approximately 28-fold increases compared to the non-transgenic control, whereas lines ND-30-9 and ND-30-11 had moderately high (between 43-fold to 48-fold) increases (Figure 6B).

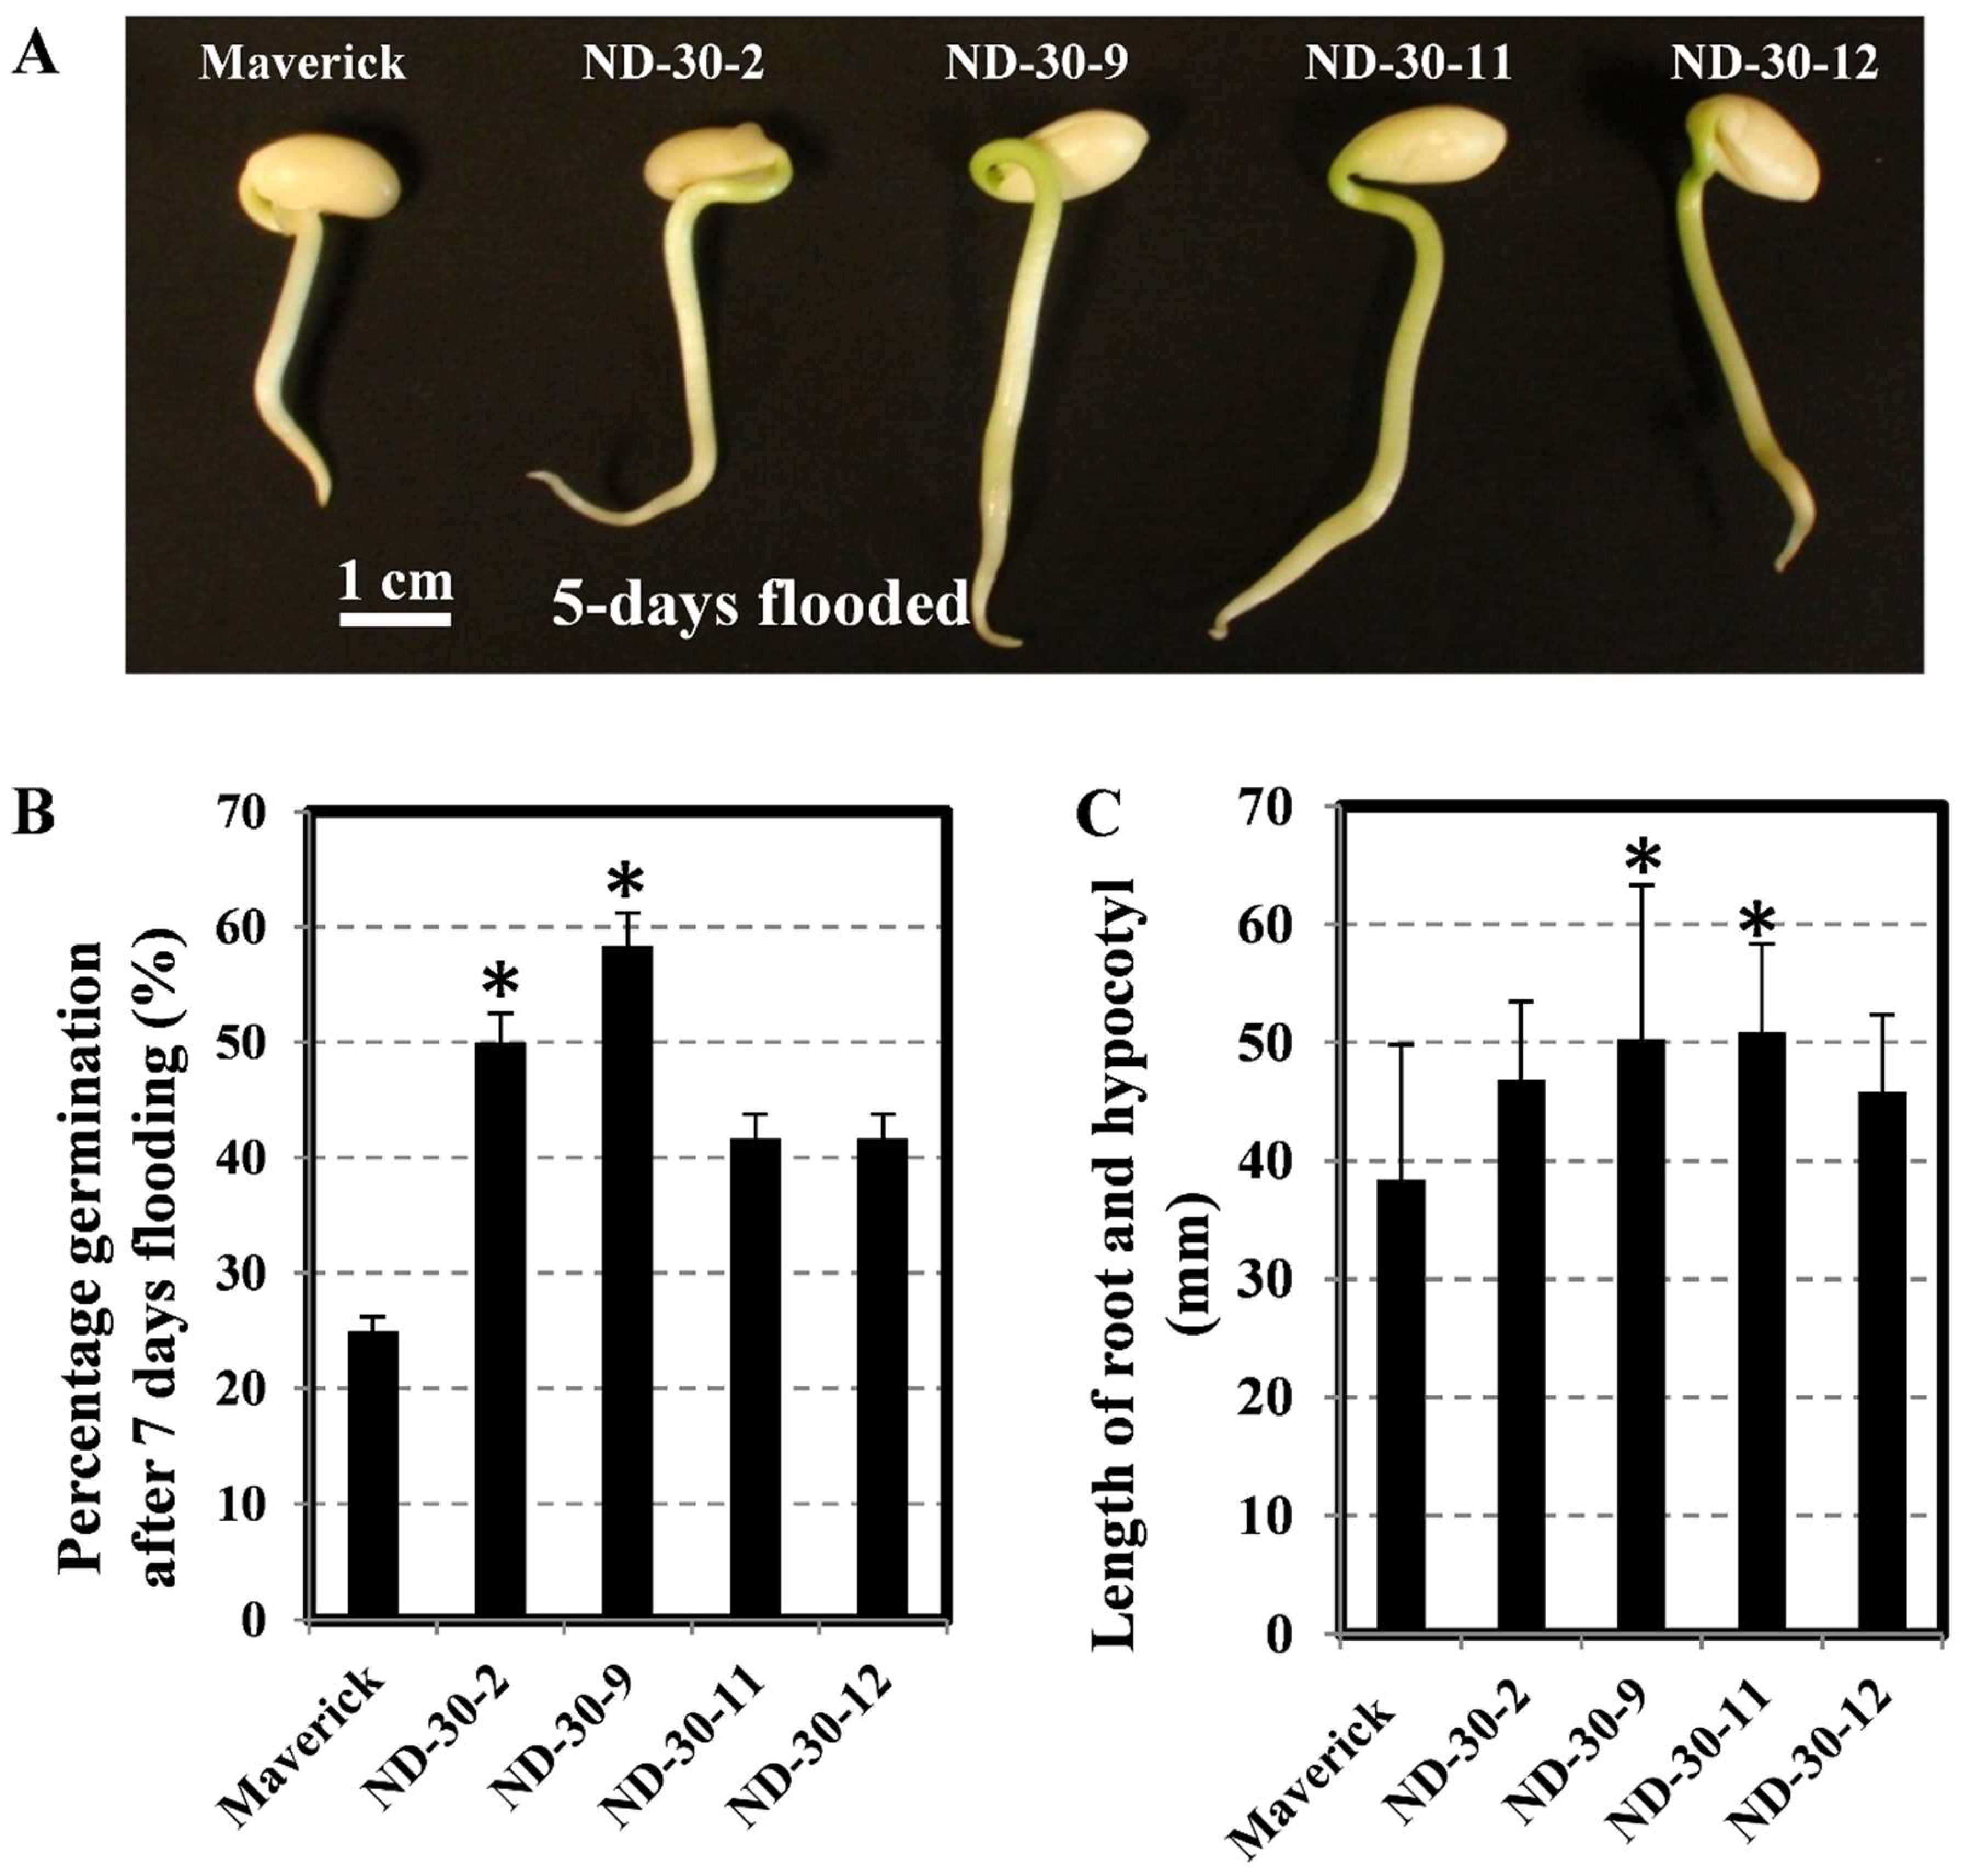
2.7. Transgenic Soybean Exhibits Tolerance to Flooding during the Germination Stage

In a comparison of the flooding tolerance between the control and transgenic lines, the germination rate of each line was counted first. As shown in Figure 7, all transgenic soybean lines had longer roots and hypocotyls (range from 45 mm to 51 mm) than the control (38 mm) after 5 days of flooding (Figure 7A). Four transgenic homozygous T3 transgenic lines with varied transgene expression conferred a range of tolerance with an increase in germination rate after 7 days of flooding, which ranged from 40% to 58% and two lines (ND-30-2 and ND-30-9) showed significant increase (Figure 7B). The length of roots and hypocotyls in the two lines (ND-30-9 and ND-30-11) was significantly greater than that in the control (Figure 7C). These results indicated that overexpressed AtXTH31 in soybean induced higher germination rate, and enhanced root/hypocotyl elongation compared with susceptible parent Maverick.

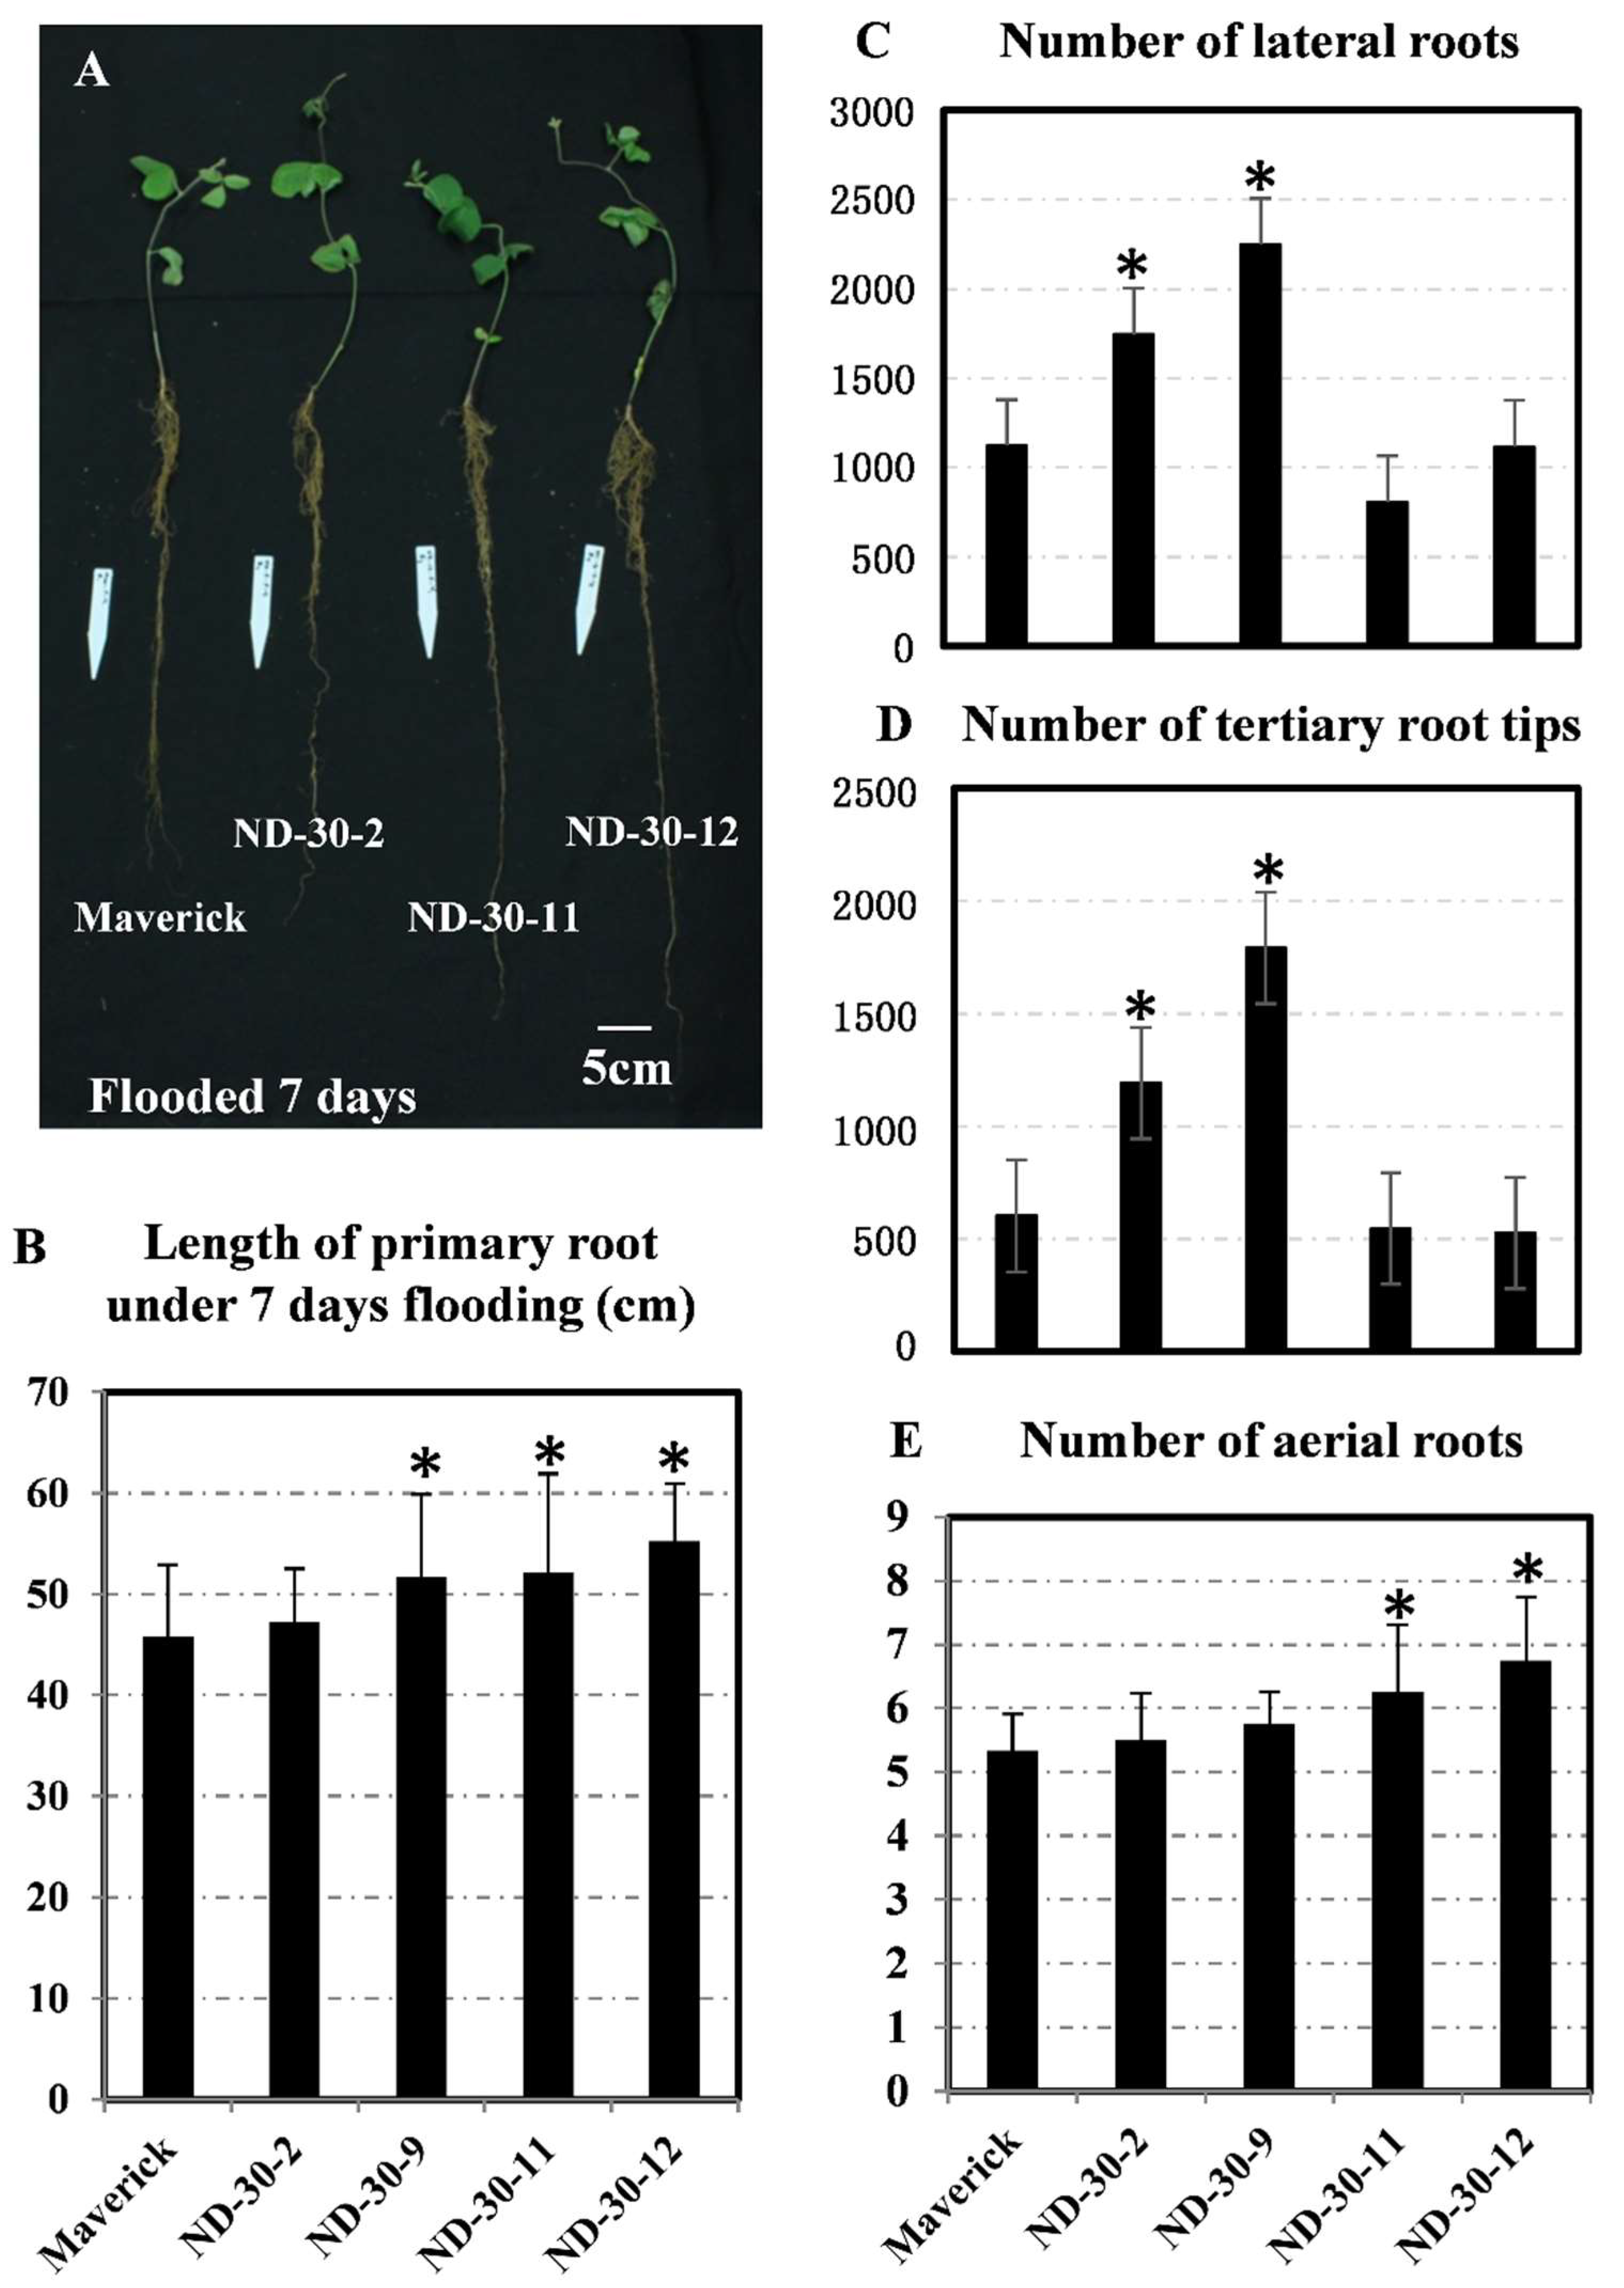
2.8. Transgenic Soybean Exhibits Tolerance to Flooding during the Vegetative Stage

Similarly, the ability of transgenic seedlings (V1 stage) to withstand flooding was then investigated. Seedlings were grown up to the V1 stage and flooded for 14 days (Figure 8A). We found that the primary root of transgenic plants was longer than that of non-transgenic controls under flooding conditions. Except for ND-30-2, the roots of all other three transgenic plants showed a significant increase in length (Figure 8B). In addition, two transgenic events (ND-30-2 and ND-30-9) showed great number of lateral roots and tertiary root tips as a response to flooding. Meanwhile, we observed that aerial root formation significantly increased in other two lines than the wild type (Figure 8E). Thus, ectopic expression of AtXTH31 in soybean could promote root development under flooding conditions and provide enhanced tolerance to flooding stress.

3. Discussion

The XTH gene family has been identified in several plant species, including Arabidopsis [27], rice [28], barley [38], poplar [39], tomato [40], and bryophyte [41]. In this study, we report the identification and characterization of the soybean XTH gene family and make a comparison to Arabidopsis and rice. Expression pattern analysis suggested that GmXTHs may play an important role under flooding stress. Transgenic soybean plants overexpressing AtXTH31 showed an increase in tolerance to flooding, along with the increased aerial root number and elongated primary root length.

3.1. Charaterization of GmXTHs Gene Family

Although the role of plant XTHs in regulating cell wall extensibility is well known, there is limited information on the XTH gene family size and the evolutionary relationships between XTH genes in soybean. Previous phylogenetic studies showed that XTHs form three groups in Arabidopsis and rice [27,28]. The number of GmXTH genes identified was substantially higher than in Arabidopsis and rice, and clustered into three groups. Further, the evolutionary mechanism analysis suggested that GmXTHs family expanded partly due to segmental and tandem duplication events. These duplication events further contributed to the conserved protein motif and gene structure. These GmXTHs genes displayed differential expression patterns either between different organs or under flooding stress. For example, GmXTH22 showed the highest expression level in root hair and seeds, but GmXTH23 exhibited the highest expression level in stems. GmXTH29 and GmXTH30 showed the highest and lower expression levels in flower tissue, respectively. The expression patterns of these paralogous pairs suggest that GmXTH gene family might have undergone sub-functionalization or neofunctionalization during the subsequent evolution process. Considering these facts, the characterization of GmXTH gene family provides valuable information on the evolution of the XTH soybean gene family and underlines basis for future research.

3.2. The Expression Patterns of GmXTHs Were Regulated by Flooding and Ethylene

Flooding causes severe production losses in soybean [42,43] through inhibition of stem and root growth, decreased photosynthesis, and induced leaf abscission and premature fruit drop [20,44,45]. Therefore, investigating gene expression patterns of the GmXTH gene family can help us advance the fundamental understanding of how soybean adjusts to flooding stress during growth and development.
In this study, we found that the expression pattern of GmXTHs may confer precise regulation with temporal, spatial, and environmental conditions. One of the main effects of flooding is the deprivation of oxygen from plant roots, and low oxygen will increase the synthesis of ethylene [46]. Ethylene production was higher in soybean waterlogging-tolerant lines than in susceptible lines [47]. It has been reported that the expression of XTH genes is associated with shoot elongation, which is promoted by ethylene in arrowhead tubers [48]. Several AtXTH genes were differentially regulated during ACC-induced inhibition of Arabidopsis root cell elongation [49]. Ethylene increases XTH and EXPANSIN7 (EXP7) expression in Arabidopsis roots [50]. Accordingly, investigation of GmXTH expression levels under ACC treatment will provide more hints to further gene functional analysis. In this study, we found that 23 GmXTH genes were significantly regulated by ethylene in soybean roots, indicating that the hormone ethylene plays important roles in GmXTH-mediated cell wall remodeling during flooding stress. However, further analysis is needed to reveal the relationship between hormone ACC and cell wall remodeling by regulating XTH transcription level in soybean.

3.3. The Biological Function of AtXTH31 in Soybean Root Development Under Flooding Stress

It was reported that the elongation of soybean roots was suppressed in the first 24 h and then significantly retarded after 48 h under flooding stress, which indicated that the flooding responses in the initial stages are critical for soybean growth and survival [51]. The XTH activity in the hypocotyl elongation zone of dark-grown soybean decreases when the root is exposed to low water potential [14], which directly indicates that XTH may be involved in the abiotic stress response. In this paper, the phenotypes of transgenic soybean plants carrying AtXTH31 gene on seedling growth under flooding conditions were studied. AtXTH31 belongs to subgroup IIIA, which was predicted to exhibit hydrolase activity with higher activity in vitro than XET activity [10,52]. AtXTH31 exhibits a root-specific expression pattern and is involved in Arabidopsis cell wall modification and cell elongation [27]. The xth31 mutant shows slower root elongation [10]. Therefore, the AtXTH31 gene was selected for heterologous overexpression in soybean. Here we found that transgenic soybean’s ability to produce more adventitious roots and longer primary roots corresponded to an increase in tolerance under flooding stress during early seedling development. It was reported that soybean root length was positively correlated with waterlogging tolerance in soybean germplasm lines [53,54]. Waterlogging-tolerant soybean lines normally developed more adventitious roots than waterlogging-susceptible lines [47,55]. Clearly, our results indicate that XTH-mediated cell wall adjustment may play a critical role in the adaptation of plants to flooding stress, and AtXTH31 could be a useful candidate gene to develop flooding tolerance lines through molecular transgenic breeding methods. However, the corresponding tolerance mechanisms demand further investigation.

3.4. Digital PCR Provides a Simple and Accurate Method for Soybean Transgene Copy Number Analysis

Detection and quantification of transgene copy numbers are very important in characterizing transgenic plants. Recently, the application of digital PCR for the precise analysis of transgene copy numbers in crops has been reported in an array of crops [56,57,58]. This technology accelerates molecular breeding workflow in transgenic plants, enhances data quality in characterizing transgenes, and finally benefits the environment. However, no reports have been available on soybean for detecting copy number variations by the application of digital PCR until now.
In our study, digital PCR technology was applied to validate the transgenic AtXTH31 copy numbers using T0 plants. Here, the digital PCR method provided more accurate results than those provided by Southern blotting and classical PCR. For example, chimeric plants (a plant or plant part that is a mixture of two or more genetically different types of cells) can be easily identified through the ratio of copy numbers. Furthermore, the dPCR method was continuously used to identify homozygous plants in the T1 generation, which saved the experiment time and no need to evaluate the homozygous lines through calculating the segregation rate of T2. In particular, the dPCR method was successfully applied to choose single-copy insert transgenic lines through analysis of copy number variation in the T1 generation. In summary, the dPCR method provides a very useful technical support for the transgenic soybean research community.

4. Materials & Methods

4.1. Identification, Chromosomal Location, and Structural Organization of GmXTH Family Members in Glycine Max

All sequence information for genes and proteins was retrieved by searching Phytozome v10.3 database (available online: http://www.phytozome.net) with a BLASTP algorithm using the AtXTH31 amino acid sequence. The chromosome location of each GmXTH was obtained from Phytozome. The exon/intron organizations of GmXTHs were visualized with the Gene Structure Display Server program ([59] GSDS: available online: http://gsds.cbi.pku.edu.cn/).

4.2. Protein Sequence Alignment, Phylogenetic Analysis, and Gene Duplications of GmXTH Genes

Multiple sequence alignments were constructed using ClustalW2 (available online: http://www.ebi.ac.uk/Tools/clustalw2/index.html). Subsequently, a phylogenetic tree was constructed using the neighbor-joining method and implemented using the MEGA7 software tool [60]. The reliability of an inferred tree was confirmed with bootstrap analysis performed with 1000 replications. The evolutionary distances were computed using the Poisson correction method [61] and are in the units of the number of amino acid substitutions per site. A total of 123 coding sequences from Arabidopsis, rice, and soybean were collected for phylogenetic analysis. All positions containing gaps and missing data were eliminated. The Ks (synonymous substitutions per synonymous site) and Ka (non-synonymous substitutions per non-synonymous site) values were extracted from the Plant Genome Duplication Database (PGDD: available online: http://chibba.agtec.uga.edu/duplication/), and these were used for calculating the approximate dates of duplication events. The date of duplication events was subsequently estimated according to the equation T = Ks/2λ, in which the mean synonymous substitution rate (λ) for soybean is 6.1 × 10⁻⁹ [62].

4.3. Plant Growth, Hormonal/Flooding Treatments, and Tissue Collection

Soybean cultivar Williams 82 was used for gene expression pattern analysis. For ethylene precursor 1-aminocyclopropane-1-carboxylic acid (ACC) treatment, plants were grown in 4-gallon pots (Greenhouse megastore, USA) containing a 3:1 mixture of turface and sand in a growth chamber under the conditions of 28/20 °C day/night temperature, 14/10 h light/dark photoperiod, 800 μmol m−2 s−1 light intensity and 60% humidity. Two-week-old plants were sprayed with 50 μM ACC (or a mock solution without ACC) on the leaf, irrigated with 2 l of hormone solution in a plastic case and then incubated for 5 h before root tissue collection.
For flooding stress treatment, two-day-old seedlings cultivated on quartz sand were completely submerged in 700 ml of water for 5 days at 25 °C with a light/dark cycle (600 μmol m−2 s−1, 16 h light/8 h dark). The water level was kept at 2 cm above the quartz sand surface, and control seedlings were grown with a water level below the quartz sand surface. Roots and hypocotyls were collected from soybean seedlings. The collected tissues were frozen immediately in liquid nitrogen and stored at −80 °C. All samples were collected in biological triplicate.
For waterlogging treatment, transgenic and control seeds were sown in cones filled with turface and sand in the ratio of 2:1. The cones with plants at the V1 stage were kept inside a tub and flooded above the soil level (>2 cm high) for 14 days. The greenhouse temperatures (24~26 °C) were exactly the same during day and night. The heating system turned on when temperatures were below 23.8 °C. A passive cooling ridge vent opened when temperatures were above 26.6 °C. Active cooling fans turned on when temperatures were above 29.4 °C. The shade was set to stay open all the time, and the HID lights were set to be on at all levels between 5 am and 7 pm.

4.4. Promoter Analysis

The DNA sequences 2000 bp upstream of the translation start site (ATG) were extracted from the soybean genome, and the presence and abundance of the known cis-elements were analyzed with the help of the program SOGO (available online: https://sogo.dna.affrc.go.jp/cgi-bin/sogo.cgi?lang=en&pj=640&action=page&page=newplace).

4.5. Expression Profiling Using RNA-seq Datasets

The RNA-seq data generated by Libault et al. [32] from nine different soybean tissues (William 82 genotype) including flowers, leaves, nodules, pods, roots, root hairs, seeds, shoot apical meristems, and stems were used to analyze expression patterns of GmXTHs members. Chen et al. [34] generated RNA-seq data using soybean (Williams 82 genotype) leaf tissue under flooding stress. Briefly, flooding stress was imposed at the soybean V4 stage (four unfolded trifoliate leaves) by placing the pots into a larger pot filled up to a water level of 4 cm above the soil surface for 7 days.

4.6. RNA Extraction for Expression Pattern Analysis

The frozen samples were ground to powder in liquid nitrogen with a mortar and pestle. Approximately 100 mg tissue samples were used for RNA extraction using a RNeasy Plant mini kit (Cat# 74904, Qiagen, Valencia, CA, USA) according to the manufacturer’s protocol. On-Column DNA digestion performed by following the RNase-Free DNase kit (Cat#79254, Qiagen) manufacturer’s protocol. The quality and quantity of RNA were assessed using a Nanodrop® 1000 spectrophotometer (Thermo Scientific, Wilmington, DE, USA).

4.7. Quantitative RT-PCR Analysis

A total of 2 µg RNA from each sample was reverse-transcribed to cDNA in 20 µL reaction volume using RNA to cDNA Ecopry™ Premix (Double primed) cDNA Synthesis Kit (Cat# 639549, Clontech, Foster City, CA, USA) according to the manufacturer’s protocol. PCR was performed in a 10 µL reaction volume using the Maxima SYBR Green/ROX qPCR Master Mix (Cat# K0223, Thermo, USA) on the ABI7900HT detection system machine (ABI PRISM® 7900HT, Foster City, CA, USA). The results from three biological replicates and two technical replicates were used for data analysis. The PCR conditions were as follows: 50 °C for 2 min, 95 °C for 10 min, and 40 cycles of 95 °C for 15 s, and 60 °C for 1 min. To normalize the gene expression levels, the actin (Glyma.18G290800) gene was used as an internal control. All novel primers were designed using the Primer3 web interface (available online: http://frodo.wi.mit.edu/primer3/ [63,64]. The primer sequences are listed in Supplementary Table S2.

4.8. Construction of the pZY101-AtXTH31 Vector, Agrobacterium-mediated Soybean (Glycine max) Transformation and Progeny Segregation Analysis

The gene-specific primer pair 5′-CATGCCATGGATGGCTTTGTCTCTTATCTTTC-3′ and 5′-CATGCCATGGCTAACATTCTGGTGTTTGGG-3′ was designed to isolate the full-length CDS of AtXTH31 from Arabidopsis. The PCR product (902 bp) was cloned into the pCR4-TOPO vector, and the positive plasmid was fully sequenced with M13 sequencing primers. The AtXTH31 gene sequence was inserted into the pCNSH.131. AtMyb2p-Gus vector, which contained the Myb2 promoter. Finally, the whole cassette contained a promoter, and the gene sequence was moved into the pZY101-Asc binary vector. An improved Agrobacterium-mediated transformation of the soybean cotyledonary node system [65] was performed using the elite genotype “Maverick”. To determine the segregation of gene of interest and selectable marker gene, at least 30 plants from each T0 event were screened using leaf paint (100 mg/L glufosinate, Sigma, St. Louis, MO, USA) analysis carried out for the T0 generation. T2 progeny from the T1 generation was similarly analyzed to identify homozygous T1 lines for subsequent study.

4.9. DNA Extraction and Quantification and PCR Confirmation of Transgenes

DNA was extracted from the transgenic plant leaves (mixed leaf tissue) using CTAB methods [66]. DNA concentrations and quality were initially estimated using a Nanodrop spectrometer (Thermo Fisher Scientific, Waltham, MA, USA) and then estimated using a QuantiT dsDNA HS Kit (Invitrogen, Thermo Fisher Scientific, Waltham, MA, USA). The concentrations from the Qubit assays were used to quantify the DNA input in each PCR reaction. Primers were designed to detect the AtXTH31 gene of interest and the bar gene as the selectable marker gene (Supplementary Table S2). PCR conditions were as follows: 95 °C hot start 30 s, followed by 36 cycles of 95 °C denaturing 10 s, 55 °C annealing 10 s, and 72 °C extension 1 min, followed by 72 °C final extension 10 min. PCR products were analyzed on an agarose gel, and events were considered transgenic if they displayed an approximately 800 bp band for the gene of interest and a 500 bp band for the bar gene. Four positive transgenic events were obtained and used for further phenotype analysis.

4.10. TaqMan Assays and QuantStudio 3D Digital PCR Analysis for Soybean AtXTH31 Transgenic Copy Number Variation

The following equipment and chemicals were used from Applied Biosystems (Waltham, MA, USA), Thermo Fisher Scientific, USA: QuantStudio™ 3D Imager (Cat#: PN4489084), QuantStudio™ 3D Loader (Cat#: PN4482592), Dual Flat Block GeneAmpR PCR System 9700 (Cat#: PN4428235), Tilt Base & chip adapters (Cat#: PN4486414 and 4485513), QuantStudio™ 3D Digital PCR 20K Chips (Cat#: PN4485507), and QuantStudio™ 3D Digital PCR Master Mix (Cat#: PN4485718). The probe was designed and synthesized by Life Technology Company. The dPCR reaction volume was 20 µL and contained 10 µL 2× TaqMan 3D mix, 1 µL 20× FAM labeled primers and probe, 1 µL 20× VIC labeled primers and probe, 1 µL DNA samples (40 ng/ µL), and 7 µL nuclease-free water. In total, 14.5 µL each reaction product was loaded on the chips. Data analysis was conducted using QuantStudio™ 3D Analysis Suite™ Cloud Software as described previously [55]. The designed probes could only amplify transgene AtXTH31 to ensure that no soybean homologous genes were detected. The ratio of the copy number of AtXTH31 with lectin in the same soybean material was calculated as follows: (copies/µL of the AtXTH31 transgene)/(copies/µL of the lectin gene Glyma.02G009600) in the same PCR reaction product. Soybean transgenic plants contained a single insert copy when the ratio value was equal to 0.5 and two insert copies when the ratio value was equal to 1. The ratio value was less than 0.5 when chimeric transgenic plants were found. The primers and probe sequences are shown in Supplementary Table S2.

5. Conclusions

In conclusion, our results showed that the soybean genome contains 61 XTH genes, the largest family of XTH proteins characterized in any organism to date. The results of phylogenetic analysis and chromosome location/structure provide an overview of the soybean GmXTH gene family. The results of the segmental and tandem duplication during expansion of the GmXTH gene family provide a genome-wide evolutionary overview. The results of conserved amino acid motif analysis and expression pattern analysis further provide insight into their putative function. Additionally, functional analysis of AtXTH31 in a heterologous system suggests that the higher germination rate and longer roots/hypocotyls induced by the increased XTH activity may be responsible for the flooding tolerance of transgenic plants. Further comprehensive experiments may be required to elucidate the cellular locations and functions to understand the biological role of XTHs in soybean.

Supplementary Materials

Supplementary materials can be found at https://www.mdpi.com/1422-0067/19/9/2705/s1. Supplementary Table S1: Information related to the 61 genes homologous to XTH genes in the soybean genome; Supplementary Table S2: Oligonucleotide primer sequences used in this work; Supplementary Table S3: Estimate of the dates of the segmental duplication events of the soybean XTH gene pairs; Supplementary Figure S1: Exon-intron structure of soybean XTHs; Supplementary Table S4: Search for cis-elements in the GmXTH gene promoters.

Author Contributions

L.S. designed the experiments, analyzed the data, and prepared the manuscript. B.V. worked on the gene clone and vector construction. S.P. worked on the transgenic soybean phenotype analysis. J.W. analyzed the digital PCR data. H.T.N. conceived and supervised the project. All authors have read, revised, and approved the manuscript.

Acknowledgments

We acknowledge Missouri Soybean Merchandising Council, USA and Yang Zhou Science and Technology Bureau (YZ2018156), China for financial support and Plant Transformation Core Facility at the University of Missouri for soybean transformation. We thank Thermo Scientific (Life Technology) for supporting the Q3D PCR equipment. We thank Caifu Chen, Yalei Wu, Pius Brzoska, and David Keys for digital PCR technical support. We thank Yongqin Wang and Chenglin Chai for helping with plant hormone treatment. We thank Mackensie Murphy and Raymond Mutava for their help on the transgenic plant flooding assay.

Conflicts of Interest

The authors declare no conflict of interest.

References

  1. Cantarel, B.L.; Coutinho, P.M.; Rancurel, C.; Bernard, T.; Lombard, V.; Henrissat, B. The Carbohydrate-Active EnZymes database (CAZy): An expert resource for Glycogenomics. Nucleic Acids Res. 2009, D233–D238. [Google Scholar] [CrossRef] [PubMed]
  2. Fry, S.C.; Smith, R.C.; Renwick, K.F.; Martin, D.J.; Hodge, S.K.; Matthews, K.J. Xyloglucan endotransglycosylase, a new wall-loosening enzyme activity from plants. Biochem. J. 1992, 282, 821–828. [Google Scholar] [CrossRef] [PubMed] [Green Version]
  3. Thompson, J.E.; Fry, S.C. Restructuring of wall-bound xyloglucan by transglycosylation in living plant cells. Plant J. 2001, 26, 23–34. [Google Scholar] [CrossRef] [PubMed] [Green Version]
  4. Van Sandt, V.S.; Suslov, D.; Verbelen, J.P.; Vissenberg, K. Xyloglucan endotransglucosylase activity loosens a plant cell wall. Ann. Bot. 2007, 100, 1467–1473. [Google Scholar] [CrossRef] [PubMed]
  5. Shin, Y.K.; Yum, H.; Kim, E.S.; Cho, H.; Gothandam, K.M.; Hyun, J.; Chung, Y.Y. BcXTH1, a Brassica campestris homologue of Arabidopsis XTH9, is associated with cell expansion. Planta 2006, 224, 32–41. [Google Scholar] [CrossRef] [PubMed]
  6. Miedes, E.; Herbers, K.; Sonnewald, U.; Lorences, E.P. Overexpression of a cell wall enzyme reduces xyloglucan depolymerization and softening of transgenic tomato fruits. J. Agric. Food Chem. 2010, 58, 5708–5713. [Google Scholar] [CrossRef] [PubMed]
  7. Lee, J.; Burns, T.H.; Light, G.; Sun, Y.; Fokar, M.; Kasukabe, Y.; Allen, R.D. Xyloglucan endotransglycosylase/hydrolase genes in cotton and their role in fiber elongation. Planta 2010, 232, 1191–1205. [Google Scholar] [CrossRef] [PubMed]
  8. Shao, M.Y.; Wang, X.D.; Ni, M.; Bibi, N.; Yuan, S.N.; Malik, W.; Zhang, H.P.; Liu, Y.X.; Hua, S.J. Regulation of cotton fiber elongation by xyloglucan endotransglycosylase/hydrolase genes. Genet. Mol. Res. 2011, 10, 3771–3782. [Google Scholar] [CrossRef] [PubMed]
  9. Nishikubo, N.; Takahashi, J.; Roos, A.A.; Derba-Maceluch, M.; Piens, K.; Brumer, H.; Teeri, T.T.; Stålbrand, H.; Mellerowicz, E.J. Xyloglucan endo-transglycosylase-mediated xyloglucan rearrangements in developing wood of hybrid aspen. Plant Physiol. 2011, 155, 399–413. [Google Scholar] [CrossRef] [PubMed]
  10. Zhu, X.F.; Shi, Y.Z.; Lei, G.J.; Fry, S.C.; Zhang, B.C.; Zhou, Y.H.; Braam, J.; Jiang, T.; Xu, X.Y.; Mao, C.Z.; et al. XTH31, encoding an in vitro XEH/XET-active enzyme, regulates aluminum sensitivity by modulating in vivo XET action, cell wall xyloglucan content, and aluminum binding capacity in Arabidopsis. Plant Cell 2012, 24, 4731–4747. [Google Scholar] [CrossRef] [PubMed] [Green Version]
  11. Liu, Y.B.; Lu, S.M.; Zhang, J.F.; Liu, S.; Lu, Y.T. A xyloglucan endotransglucosylase/hydrolase involves in growth of primary root and alters the deposition of cellulose in Arabidopsis. Planta 2007, 226, 1547–1560. [Google Scholar] [CrossRef] [PubMed]
  12. Wu, Y.; Spollen, W.G.; Sharp, R.E.; Hetherington, P.R.; Fry, S.C. Root Growth Maintenance at Low Water Potentials (Increased Activity of Xyloglucan Endotransglycosylase and Its Possible Regulation by Abscisic Acid). Plant Physiol. 1994, 106, 607–615. [Google Scholar] [CrossRef] [PubMed] [Green Version]
  13. Moore, J.P.; Vicré-Gibouin, M.; Farrant, J.M.; Driouich, A. Adaptations of higher plant cell walls to water loss: Drought vs desiccation. Physiol. Plant. 2008, 134, 237–245. [Google Scholar] [CrossRef] [PubMed]
  14. Wu, Y.; Jeong, B.R.; Fry, S.C.; Boyer, J.S. Change in XET activities, cell wall extensibility and hypocotyl elongation of soybean seedlings at low water potential. Planta 2005, 220, 593–601. [Google Scholar] [CrossRef] [PubMed]
  15. Pritchard, J.; Hetherington, P.R.; Fry, S.C.; Tomos, A.D. Xyloglucan endotransglycosylase activity, microfibril orientation and the profiles of cell wall properties along growing regions of maize roots. J. Exp. Bot. 1993, 44, 1281–1289. [Google Scholar] [CrossRef]
  16. Cho, S.K.; Kim, J.E.; Park, J.A.; Eom, T.J.; Kim, W.T. Constitutive expression of abiotic stress-inducible hot pepper CaXTH3, which encodes a xyloglucan endotransglucosylase/hydrolase homolog, improves drought and salt tolerance in transgenic Arabidopsis plants. FEBS Lett. 2006, 580, 3136–3144. [Google Scholar] [CrossRef] [PubMed]
  17. Jan, A.; Yang, G.; Nakamura, H.; Ichikawa, H.; Kitano, H.; Matsuoka, M.; Komatsu, S. Characterization of a xyloglucan endotransglucosylase gene that is up-regulated by gibberellin in rice. Plant Physiol. 2004, 136, 3670–3681. [Google Scholar] [CrossRef] [PubMed]
  18. Endo, A.; Tatematsu, K.; Hanada, K.; Duermeyer, L.; Okamoto, M.; Yonekura-Sakakibara, K.; Saito, K.; Toyoda, T.; Kawakami, N.; Kamiya, Y.; et al. Tissue-specific transcriptome analysis reveals cell wall metabolism, flavonol biosynthesis and defense responses are activated in the endosperm of germinating Arabidopsis thaliana seeds. Plant Cell Physiol. 2012, 53, 16–27. [Google Scholar] [CrossRef] [PubMed]
  19. Miura, K.; Lee, J.; Miura, T.; Hasegawa, P.M. SIZ1 controls cell growth and plant development in Arabidopsis through salicylic acid. Plant Cell Physiol. 2010, 51, 103–113. [Google Scholar] [CrossRef] [PubMed] [Green Version]
  20. Saab, I.N.; Sachs, M.M. A flooding-induced xyloglucan endo-transglycosylase homolog in maize is responsive to ethylene and associated with aerenchyma. Plant Physiol. 1996, 112, 385–391. [Google Scholar] [CrossRef] [PubMed] [Green Version]
  21. Stacey, G.; Vodkin, L.; Parrott, W.A.; Shoemaker, R.C. National science foundation-sponsored workshop report. Draft plan for soybean genomics. Plant Physiol. 2004, 135, 59–70. [Google Scholar] [CrossRef] [PubMed]
  22. Manavalan, L.P.; Guttikonda, S.K.; Tran, L.S.; Nguyen, H.T. Physiological and molecular approaches to improve drought resistance in soybean. Plant Cell Physiol. 2009, 50, 1260–1276. [Google Scholar] [CrossRef] [PubMed]
  23. Valliyodan, B.; Ye, H.; Song, L.; Murphy, M.; Shannon, J.G.; Nguyen, H.T. Genetic diversity and genomic strategies for improving drought and waterlogging tolerance in soybeans. J. Exp. Bot. 2017, 68, 1835–1849. [Google Scholar] [CrossRef] [PubMed]
  24. Ye, H.; Song, L.; Chen, H.; Valliyodan, B.; Ali, L.; Vuong, T.; Wu, C.; Orlowski, J.; Buckley, B.; Chen, P.; et al. A Major Natural Genetic Variation Associated with Root System Architecture and Plasticity Improves Waterlogging Tolerance and Yield in Soybean. Plant Cell Environ. 2018, 41, 2169–2182. [Google Scholar] [CrossRef] [PubMed]
  25. Nanjo, Y.; Maruyama, K.; Yasue, H.; Yamaguchi-Shinozaki, K.; Shinozaki, K.; Komatsu, S. Transcriptional responses to flooding stress in roots including hypocotyl of soybean seedlings. Plant Mol. Biol. 2011, 77, 129–144. [Google Scholar] [CrossRef] [PubMed]
  26. Zurek, D.M.; Clouse, S.D. Molecular cloning and characterization of a brassinosteroid-regulated gene from elongating soybean (Glycine max L.) epicotyls. Plant Physiol. 1994, 104, 161–170. [Google Scholar] [CrossRef] [PubMed]
  27. Yokoyama, R.; Nishitani, K. A comprehensive expression analysis of all members of a gene family encoding cell-wall enzymes allowed us to predict cis-regulatory regions involved in cell-wall construction in specific organs of Arabidopsis. Plant Cell Physiol. 2001, 42, 1025–1033. [Google Scholar] [CrossRef] [PubMed]
  28. Yokoyama, R.; Rose, J.K.; Nishitani, K. A surprising diversity and abundance of xyloglucan endotransglucosylase/hydrolases in rice. Classification and expression analysis. Plant Physiol. 2004, 134, 1088–1099. [Google Scholar] [CrossRef] [PubMed]
  29. Schmutz, J.; Cannon, S.B.; Schlueter, J.; Ma, J.; Mitros, T.; Nelson, W.; Hyten, D.L.; Song, Q.; Thelen, J.J.; Cheng, J.; et al. Genome sequence of the palaeopolyploid soybean. Nature 2010, 463, 178–183. [Google Scholar] [CrossRef] [PubMed]
  30. Planas, A.; Juncosa, M.; Lloberas, J.; Querol, E. Essential catalytic role of Glu134 in endo-β-1,3-1,4-d-glucan 4-glucanohydrolase from B. licheniformis as determined by site-directed mutagenesis. FEBS Lett. 1992, 308, 141–145. [Google Scholar] [CrossRef]
  31. Juncosa, M.; Pons, J.; Dot, T.; Querol, E.; Planas, A. Identification of active site carboxylic residues in Bacillus licheniformis 1,3-1,4-beta-d-glucan 4-glucanohydrolase by site-directed mutagenesis. J. Biol. Chem. 1994, 269, 14530–14535. [Google Scholar] [PubMed]
  32. Libault, M.; Farmer, A.; Joshi, T.; Takahashi, K.; Langley, R.J.; Franklin, L.D.; He, J.; Xu, D.; May, G.; Stacey, G. An integrated transcriptome atlas of the crop model Glycine max, and its use in comparative analyses in plants. Plant J. 2010, 63, 86–99. [Google Scholar] [CrossRef] [PubMed]
  33. Tamang, B.G.; Magliozzi, J.O.; Maroof, M.A.S.; Fukao, T. Physiological and transcriptomic characterization of submergence and reoxygenation responses in soybean seedlings. Plant, Cell Environ. 2014, 37, 2350–2365. [Google Scholar] [CrossRef] [PubMed]
  34. Chen, W.; Yao, Q.; Patil, G.B.; Agarwal, G.; Deshmukh, R.K.; Lin, L.; Wang, B.; Wang, Y.; Prince, S.J.; Song, L.; et al. Identification and Comparative Analysis of Differential Gene Expression in Soybean Leaf Tissue under Drought and Flooding Stress Revealed by RNA-Seq. Front. Plant Sci. 2016, 7. [Google Scholar] [CrossRef] [PubMed] [Green Version]
  35. Komatsu, S.; Deschamps, T.; Hiraga, S.; Kato, M.; Chiba, M.; Hashiguchi, A.; Tougou, M.; Shimamura, S.; Yasue, H. Characterization of a novel flooding stress-responsive alcohol dehydrogenase expressed in soybean roots. Plant Mol. Biol. 2011, 77, 309–322. [Google Scholar] [CrossRef] [PubMed]
  36. Kürsteiner, O.; Dupuis, I.; Kuhlemeier, C. The pyruvate decarboxylase1 gene of Arabidopsis is required during anoxia but not other environmental stresses. Plant Physiol. 2003, 132, 968–978. [Google Scholar] [CrossRef] [PubMed]
  37. Hattori, Y.; Nagai, K.; Furukawa, S.; Song, X.J.; Kawano, R.; Sakakibara, H.; Wu, J.; Matsumoto, T.; Yoshimura, A.; Kitano, H.; et al. The ethylene response factors SNORKEL1 and SNORKEL2 allow rice to adapt to deep water. Nature 2009, 460, 1026–1030. [Google Scholar] [CrossRef] [PubMed]
  38. Strohmeier, M.; Hrmova, M.; Fischer, M.; Harvey, A.J.; Fincher, G.B.; Pleiss, J. Molecular modeling of family GH16 glycoside hydrolases: Potential roles for xyloglucan transglucosylases/hydrolases in cell wall modification in the poaceae. Protein Sci. 2004, 13, 3200–3213. [Google Scholar] [CrossRef] [PubMed]
  39. Geisler-Lee, J.; Geisler, M.; Coutinho, P.M.; Segerman, B.; Nishikubo, N.; Takahashi, J.; Aspeborg, H.; Djerbi, S.; Master, E.; Andersson-Gunnerås, S.; et al. Poplar carbohydrate-active enzymes. Gene identification and expression analyses. Plant Physiol. 2006, 140, 946–962. [Google Scholar] [CrossRef] [PubMed]
  40. Saladié, M.; Rose, J.K.; Cosgrove, D.J.; Catalá, C. Characterization of a new xyloglucan endotransglucosylase/hydrolase (XTH) from ripening tomato fruit and implications for the diverse modes of enzymic action. Plant J. 2006, 47, 282–295. [Google Scholar] [CrossRef] [PubMed] [Green Version]
  41. Yokoyama, R.; Uwagaki, Y.; Sasaki, H.; Harada, T.; Hiwatashi, Y.; Hasebe, M.; Nishitani, K. Biological implications of the occurrence of 32 members of the XTH (xyloglucan endotransglucosylase/hydrolase) family of proteins in the bryophyte Physcomitrella patens. Plant J. 2010, 64, 645–656. [Google Scholar] [CrossRef] [PubMed] [Green Version]
  42. Linkemer, G.; Board, J.E.; Musgrave, M.E. Waterlogging effects on growth and yield components in late-planted soybean. Crop Sci. 1998, 38, 1576–1584. [Google Scholar] [CrossRef] [PubMed]
  43. Wuebker, E.F.; Mullen, R.E.; Koehler, K. Flooding and temperature effects on soybean germination. Crop Sci. 2001, 41, 1857–1861. [Google Scholar] [CrossRef]
  44. Vartapetian, B.B.; Jackson, M.B. Plant adaptations to anaerobic stress. Ann. Bot. 1997, 79, 3–20. [Google Scholar] [CrossRef]
  45. Komatsu, S.; Yamamoto, R.; Nanjo, Y.; Mikami, Y.; Yunokawa, H.; Sakata, K. A comprehensive analysis of the soybean genes and proteins expressed under flooding stress using transcriptome and proteome techniques. J. Proteome Res. 2009, 8, 4766–4778. [Google Scholar] [CrossRef] [PubMed]
  46. Jackson, M.B.; Colmer, T.D. Response and adaptation by plants to flooding stress. Ann. Bot. 2005, 96, 501–505. [Google Scholar] [CrossRef] [PubMed]
  47. Kim, Y.H.; Hwang, S.J.; Waqas, M.; Khan, A.L.; Lee, J.H.; Lee, J.D.; Nguyen, H.T.; Lee, I.J. Comparative analysis of endogenous hormones level in two soybean (Glycine max L.) lines differing in waterlogging tolerance. Front. Plant Sci. 2015, 6, 714. [Google Scholar] [CrossRef] [PubMed]
  48. Ookawara, R.; Satoh, S.; Yoshioka, T.; Ishizawa, K. Expression ofα-expansin and xyloglucan endotransglucosylase/hydrolase genes associated with shoot elongation enhanced by anoxia, ethylene and carbon dioxide in arrowhead (Sagittaria pygmaea Miq.) tubers. Ann. Bot. 2005, 96, 693–702. [Google Scholar] [CrossRef] [PubMed]
  49. Markakis, M.N.; De Cnodder, T.; Lewandowski, M.; Simon, D.; Boron, A.; Balcerowicz, D.; Doubbo, T.; Taconnat, L.; Renou, J.P.; Höfte, H.; et al. Identification of genes involved in the ACC-mediated control of root cell elongation in Arabidopsis thaliana. BMC Plant Biol. 2012, 12, 208. [Google Scholar] [CrossRef] [PubMed] [Green Version]
  50. Cho, H.T.; Cosgrove, D.J. Regulation of root hair initiation and expansin gene expression in Arabidopsis. Plant Cell 2002, 14, 3237–3253. [Google Scholar] [CrossRef] [PubMed]
  51. Hashiguchi, A.; Sakata, K.; Komatsu, S. Proteome analysis of early-stage soybean seedlings under flooding stress. J. Proteome Res. 2009, 8, 2058–2069. [Google Scholar] [CrossRef] [PubMed]
  52. Baumann, M.J.; Eklöf, J.M.; Michel, G.; Kallas, A.M.; Teeri, T.T.; Czjzek, M.; Brumer, H. 3rd. Structural evidence for the evolution of xyloglucanase activity from xyloglucan endo-transglycosylases: Biological implications for cell wall metabolism Fry. Plant Cell 2007, 9, 1947–1963. [Google Scholar] [CrossRef] [PubMed]
  53. Sakazono, S.; Nagata, T.; Matsuo, R.; Kajihara, S.; Watanabe, M.; Ishimoto, M.; Shimamura, S.; Harada, K.; Takahashi, R.; Mochizuki, T. Variation in root development response to flooding among 92 soybean lines during early growth stages. Plant Prod. Sci. 2014, 17, 228–236. [Google Scholar] [CrossRef]
  54. Jitsuyama, Y. Morphological root responses of soybean to rhizosphere hypoxia reflect waterlogging tolerance. Can. J. Plant Sci. 2015, 95, 999–1005. [Google Scholar] [CrossRef] [Green Version]
  55. Valliyodan, B.; Van Toai, T.T.; Alves, J.D.; de Fátima, P.; Goulart, P.; Lee, J.D.; Fritschi, F.B.; Rahman, M.A.; Islam, R.; Shannon, J.G.; et al. Expression of root-related transcription factors associated with flooding tolerance of soybean (Glycine max). Int. J. Mol. Sci. 2014, 15, 17622–17643. [Google Scholar] [CrossRef] [PubMed]
  56. Corbisier, P.; Bhat, S.; Partis, L.; Xie, V.R.; Emslie, K.R. Absolute quantification of genetically modified MON810 maize (Zea mays L.) by digital polymerase chain reaction. Anal. Bioanal. Chem. 2010, 396, 2143–2150. [Google Scholar] [CrossRef] [PubMed]
  57. Wan, J.R.; Song, L.; Wu, Y.L.; Brzoska, P.; Keys, D.; Chen, C.F.; Valliyodan, B.; Shannon, J.G.; Nguyen, T.H. Application of Digital PCR in the Analysis of Transgenic Soybean Plants. Adv. Biosci. Biotechnol. 2016, 7, 403–417. [Google Scholar] [CrossRef]
  58. Collier, R.; Dasgupta, K.; Xing, Y.P.; Hernandez, B.T.; Shao, M.; Rohozinski, D.; Kovak, E.; Lin, J.; de Oliveira, M.L.P.; Stover, E.; et al. Accurate measurement of transgene copy number in crop plants using droplet digital PCR. Plant J. 2017, 90, 1014–1025. [Google Scholar] [CrossRef] [PubMed] [Green Version]
  59. Hu, B.; Jin, J.; Guo, A.Y.; Zhang, H.; Luo, J.; Gao, G. GSDS 2.0: An upgraded gene feature visualization server. Bioinformatics 2015, 3, 1296–1297. [Google Scholar] [CrossRef] [PubMed]
  60. Kumar, S.; Stecher, G.; Tamura, K. MEGA7: Molecular Evolutionary Genetics Analysis version 7.0 for bigger datasets. Mol. Biol. Evol. 2016, 33, 1870–1874. [Google Scholar] [CrossRef] [PubMed] [Green Version]
  61. Zuckerkandl, E.; Pauling, L. Evolutionary divergence and convergence in proteins. In Evolving Genes and Proteins; Bryson, V., Vogel, H.J., Eds.; Academic Press: New York, NY, USA, 1965; pp. 97–166. [Google Scholar]
  62. Lynch, M.; Conery, J.S. The evolutionary fate and consequences of duplicate genes. Science 2000, 290, 1151–1155. [Google Scholar] [CrossRef] [PubMed]
  63. Koressaar, T.; Remm, M. Enhancements and modifications of primer design program Primer3. Bioinformatics 2007, 23, 1289–1291. [Google Scholar] [CrossRef] [PubMed] [Green Version]
  64. Untergasser, A.; Cutcutache, I.; Koressaar, T.; Ye, J.; Faircloth, B.C.; Remm, M.; Rozen, S.G. Primer3-new capabilities and interfaces. Nucleic Acids Res. 2012, 40, E115. [Google Scholar] [CrossRef] [PubMed]
  65. Zeng, P.; Vadnais, D.; Zhang, Z.; Polacco, J. Refined glufosinate selection in Agrobacterium-mediated transformation of soybean [Glycine max (L.) Merr.]. Plant Cell Rep. 2004, 22, 478–482. [Google Scholar] [CrossRef] [PubMed]
  66. Vuong, T.D.; Sleper, D.A.; Shannon, J.G.; Nguyen, H.T. Novel quantitative trait loci for broad-based resistance to soybean cyst nematode (Heterodera glycines Ichinohe) in soybean PI 567516C. Theor. Appl. Genet. 2010, 121, 1253–1266. [Google Scholar] [CrossRef] [PubMed]
Figure 1. An unrooted phylogenetic tree for AtXTH, OsXTH, and GmXTH genes. A phylogenetic tree was constructed using the neighbor-joining method implemented in MEGA7. The number beside the branches represents bootstrap values based on 1000 replications. The XTH members are classified into three subfamilies. Genes from groups I/II and III are shown in the black and red/pink lines, respectively. Group III was designated group IIIA (red) and group IIIB (pink).
Ijms 19 02705 g001
Figure 2. Chromosomal location of 61 GmXTH genes along soybean’s 20 chromosomes. Physical map showed the distribution of the Glycine max XTH genes along the 20 chromosomes with colors indicating duplicated gene pairs. The chromosome number is indicated at the bottom.
Ijms 19 02705 g002
Figure 3. Conserved protein motifs in soybean XTHs. (A) Motifs in XTH protein sequences of 61 GmXTH identified with the MEME tool. (B) Alignment of the putative-site amino acid residues in group III XTH proteins from Arabidopsis, rice, and soybean constructed with the CLUSTALW2 program. Amino acid residues that are identical within this motif are indicated by gray shading. “*” means that the residues or nucleotides in that column are identical in all sequences in the alignment. “:” means that conserved substitutions have been observed.
Ijms 19 02705 g003
Figure 4. Heatmap of the expression profiles of the GmXTH gene family in nine organs. Relative organ expression levels of GmXTHs based on RNA-seq data were used to construct the heatmap. The expression values (Reads Per Kilobase Million) were median-cantered and normalized for each gene in different tissues before transforming to color scale. The color bar at the bottom shows the range of expression values from highest expression level (red) to lowest expression level (green), and 0 is the median expression level (Black). SAM (Shoot Apical Meristem).
Ijms 19 02705 g004
Figure 5. Expression patterns of individual XTH genes in response to flooding and ACC treatment studied by qRT-PCR or RNA-seq. (A) Expression pattern of individual XTH genes in response to 24 h flooding treatment in root and hypocotyl organs of two-day-old soybean seedlings. (B,C) Organ-specific expression analysis showed that most XTH genes were unregulated by the ACC in the root tissue, but there was no significant difference in the aerial parts of the three-week-old soybean. Three flooding-related homologous marker genes in soybean were studied as positive controls. Fold change (Log2) of relative gene expression (Actin (Glyma.18G290800)) of soybean was used as the normalization control.
Ijms 19 02705 g005
Figure 6. Calculation of transgene AtXTH31 copy numbers and relative expression levels in four transgenic events. (A) Ratios of copy number between AtXTH31 and lectin gene (Glyma.02G009600) were determined by digital PCR in soybean T0 transgenic generation. Soybean transgenic plants contained a single insert copy when the ratio value was equal to 0.5 and two insert copies when the ratio value was equal to 1. (B) The relative expression of AtXTH31 in T3 homozygous transgenic soybean roots determined by qRT-PCR. The relative levels of transcripts were normalized to the soybean actin gene (Glyma.18G290800). Bars represent mean values of three biological replicates (standard error). * indicates significantly different at p < 0.05 as tested by Fisher’s least significant difference. Non-transgenic Maverick soybean as a control and MYB2:AtXTH31 transgenic soybean lines ND-30-2, ND-30-9, ND-30-11, and ND-30-12 with overexpression of AtXTH31 were studied.
Ijms 19 02705 g006
Figure 7. Soybean AtXTH31 transgenic plants show an enhanced germination ratio and elongated root and hypocotyl under flooding conditions. (A) Two-day-old seedlings were flooded with water for 5 days. Bar indicates 1 cm. (B) The germination rate of transgenic and wild-type plants under 7 days of flooding. (C) Length of roots and hypocotyls of flooded Maverick soybean and transgenic seedlings. (n ≥ 30). * indicates differences between the maverick and transgenic soybean (p < 0.05).
Ijms 19 02705 g007
Figure 8. Soybean AtXTH31 transgenic plants show an enhanced flooding tolerance phenotype by promoting adventitious roots, lateral roots, tertiary root tips, and elongated primary roots. (A) Flooding effects on soybean seedlings. The V1 stage seedlings were flooded with water for 7 days. Bar indicates 5 cm. (B) Length of primary root compared between transgenic and control soybean plants under 7 days of flooding conditions. (CE) The effects of flooding on number of lateral roots, tertiary root tips and adventitious roots per transgenic plant. (n ≥ 20). * indicates differences between the maverick and transgenic soybean (p < 0.05).
Ijms 19 02705 g008

