Impact of Spaceflight and Artificial Gravity on the Mouse Retina: Biochemical and Proteomic Analysis

 , , ,
, , , 
Abstract

1. Introduction
2. Results
2.1. Apoptosis in Retinal Endothelial Cells Following Spaceflight
2.2. 4-Hydroxynonenal (4-HNE) Immunoreactivity Following Spaceflight
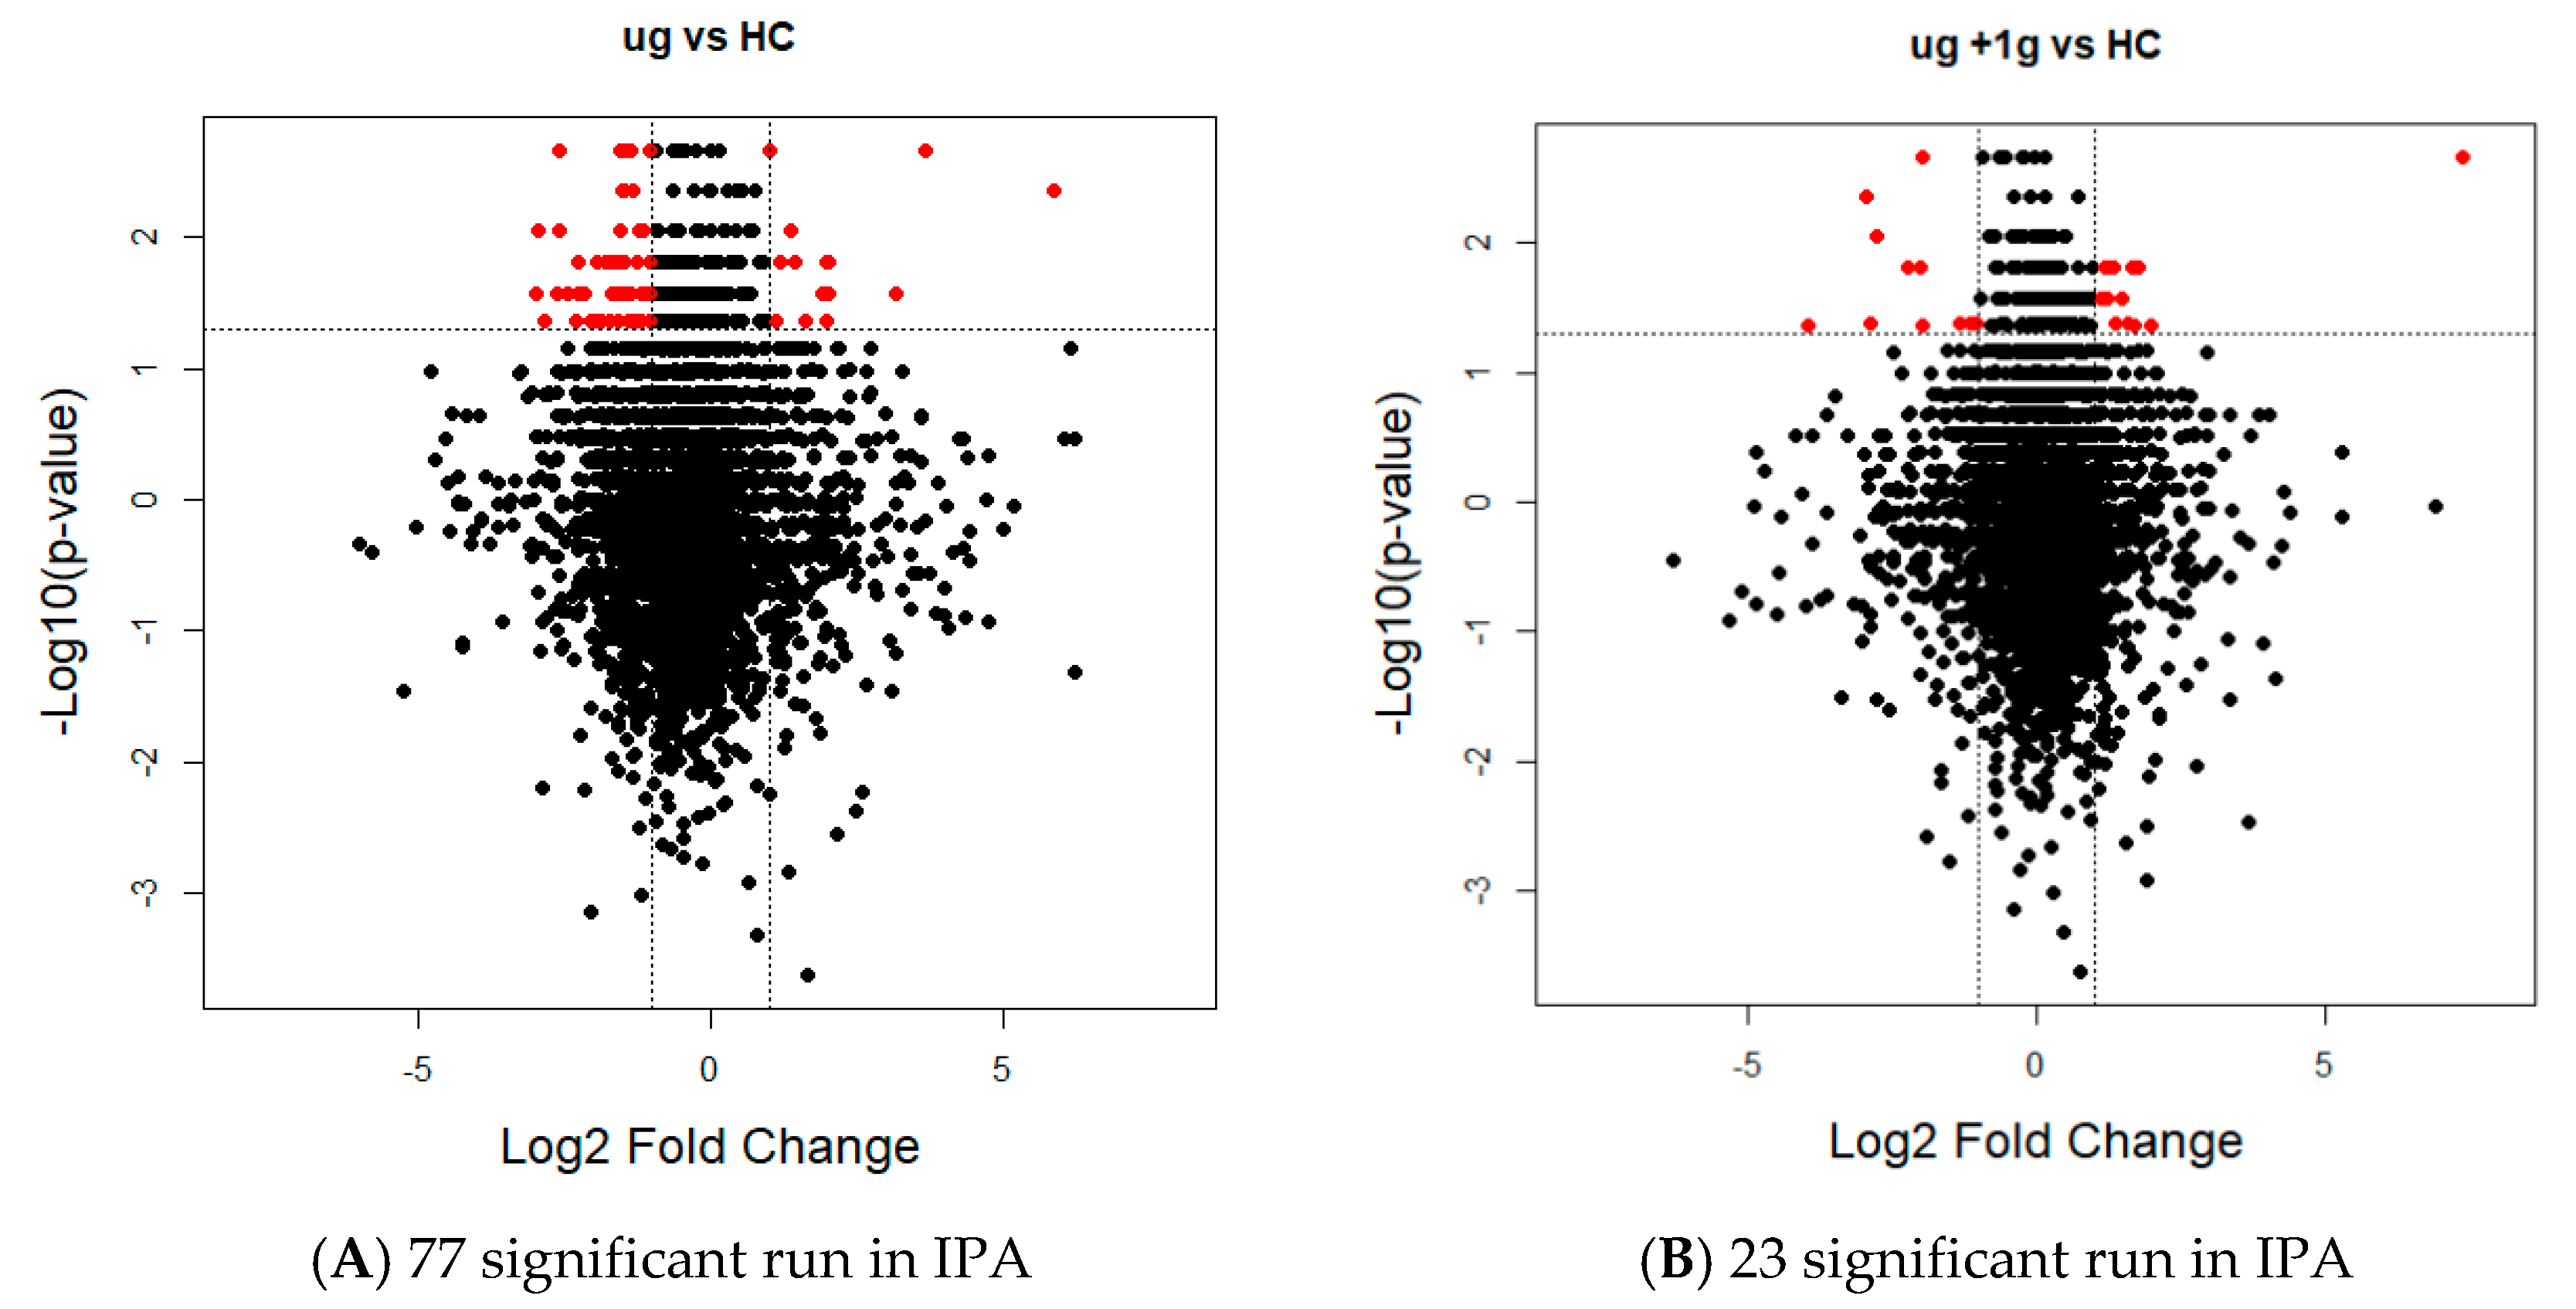
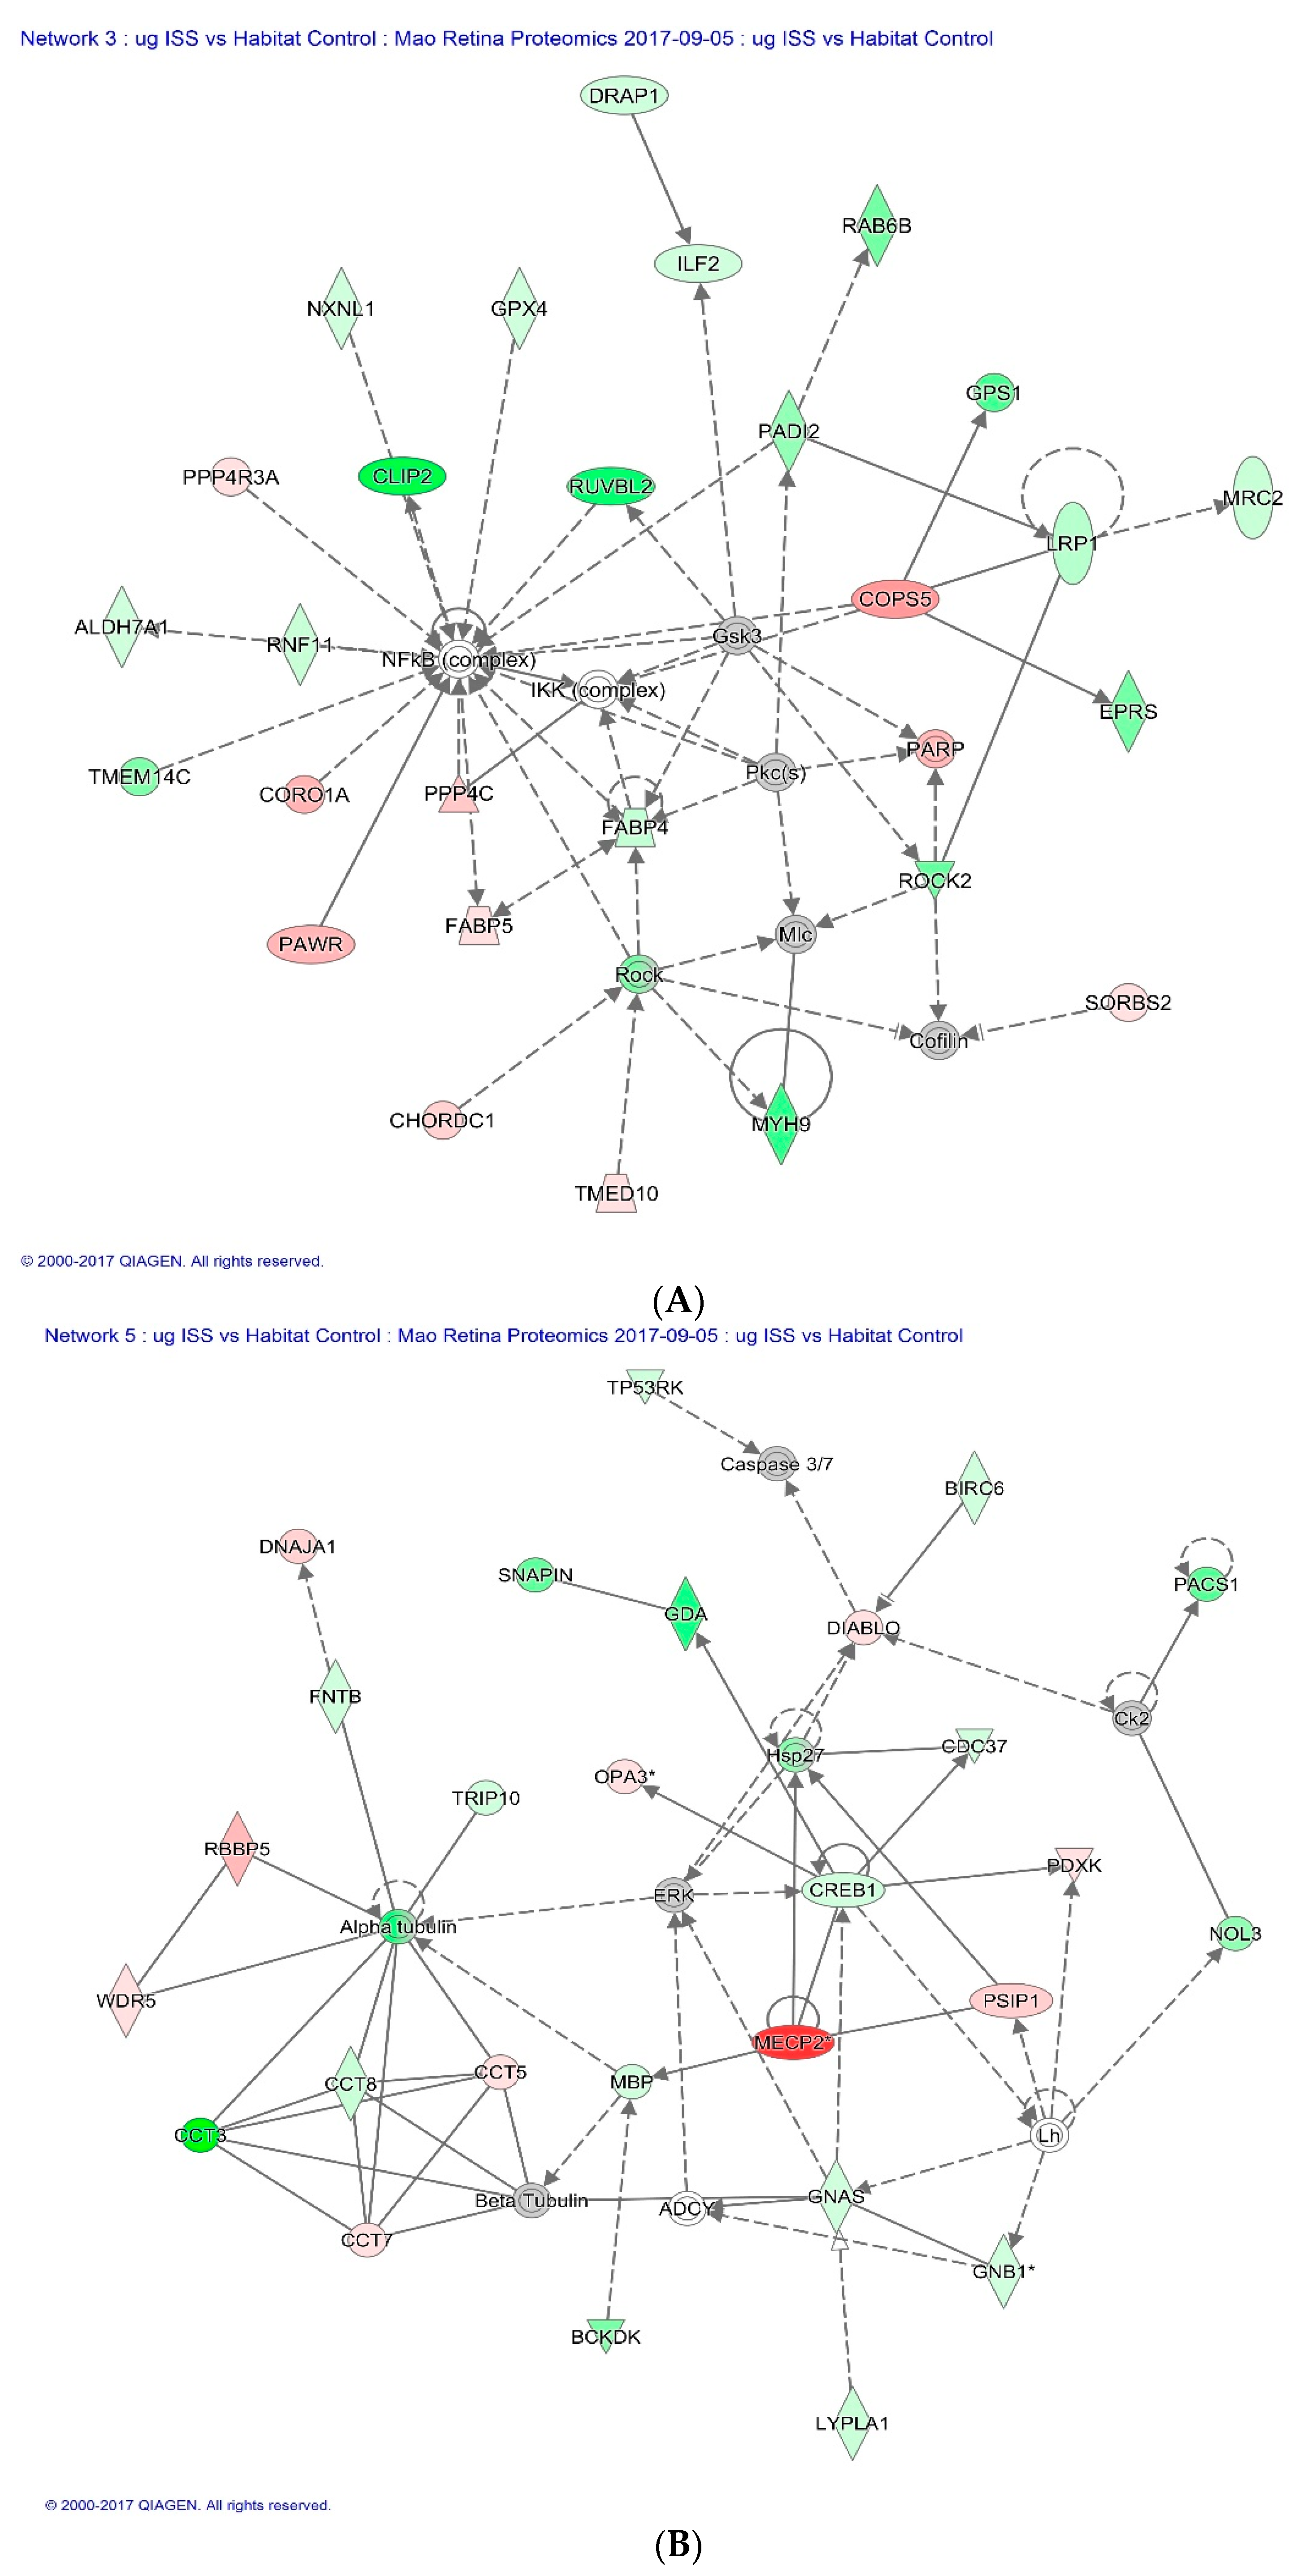
2.3. Proteomics on Mouse Ocular Tissue
3. Discussion
4. Material and Methods
4.1. Spaceflight and Mouse Condition
4.2. Dissecting and Preservation of Mouse Eyes after Spaceflight
4.3. Immunohistochemistry Assays and Histology
4.4. Mass Spectrometry
4.5. Data Analysis
4.6. Statistical Analysis
5. Conclusions
Author Contributions
Acknowledgements
Conflicts of Interest
References
- Mader, T.H.; Gibson, C.R.; Pass, A.F.; Kramer, L.A.; Lee, A.G.; Fogarty, J.; Tarver, W.J.; Dervay, J.P.; Hamilton, D.R.; Sargsyan, A.; et al. Optic disc edema, globe flattening, choroidal folds, and hyperopic shifts observed in astronauts after long-duration space flight. Ophthalmology 2011, 118, 2058–2069. [Google Scholar] [CrossRef] [PubMed]
- Mao, X.W.; Pecaut, M.J.; Stodieck, L.S.; Ferguson, V.L.; Bateman, T.A.; Bouxsein, M.; Jones, T.A.; Moldovan, M.; Cunningham, C.E.; Chieu, J.; et al. Space flight environment induces mitochondrial oxidative damage in ocular tissue. Radiat. Res. 2013, 180, 340–350. [Google Scholar] [CrossRef] [PubMed]
- Zhao, H.W.; Zhao, J.; Hu, L.N.; Liang, J.N.; Shi, Y.Y.; Nie, C.; Qiu, C.Y.; Nan, X.S.; Li, Y.X.; Gao, F.L.; et al. Effect of long-term weightlessness on retina and optic nerve in tail-suspension rats. Int. J. Ophthalmol. 2016, 9, 825–830. [Google Scholar] [PubMed]
- Tombran-Tink, J.; Barnstable, C.J. Space flight environment induces degeneration in the retina of rat neonates. In Retinal Degenerative Diseases; Joe, G.H., Robert, E.A., Matthew, M.L., Eds.; Springer: Boston, MA, USA, 2006; pp. 417–424. [Google Scholar]
- Wade, C.E. Responses across the gravity continuum: Hypergravity to microgravity. Adv. Space Biol. Med. 2005, 10, 225–245. [Google Scholar] [PubMed]
- Zhang, R.; Ran, H.H.; Ma, J.; Bai, Y.G.; Lin, L.J. NAD(P)H oxidase inhibiting with apocynin improved vascular reactivity in tail-suspended hindlimb unweighting rat. J. Physiol. Biochem. 2012, 68, 99–105. [Google Scholar] [CrossRef] [PubMed]
- Chen, H.L.; Qu, L.N.; Li, Q.D.; Bi, L.; Huang, Z.M.; Li, Y.H. Simulated microgravity-induced oxidative stress in different areas of rat brain. Sheng Li Xue Bao 2009, 61, 108–114. [Google Scholar] [PubMed]
- Yang, T.B.; Zhong, P.; Qu, L.N.; Yuan, Y.H. Space flight and peroxidative damage. Space Med. Med. Eng. 2003, 16, 455–458. [Google Scholar]
- Zhan, H.; Chen, L.M.; Xin, Y.M.; Tang, G.X.; Wen, J. Effects of tea polyphenols on cerebral lipid peroxidation, liver and renal functions in rats after repeated +Gz stress. Space Med. Med. Eng. 1999, 12, 1–5. [Google Scholar]
- Shiba, D.; Mizuno, H.; Yumoto, A.; Shimomura, M.; Kobayashi, H.; Morita, H.; Shimbo, M.; Hamada, M.; Kudo, T.; Shinohara, M.; et al. Development of new experimental platform ‘MARS’—Multiple Artificial-gravity Research System—To elucidate the impacts of micro/partial gravity on mice. Sci. Rep. 2017, 7, 10837. [Google Scholar] [CrossRef] [PubMed]
- Clement, G. International roadmap for artificial gravity research. NPJ Microgravity 2017, 3, 29. [Google Scholar] [CrossRef] [PubMed]
- Oliveros, J.C. An Interactive Tool for Comparing Lists with Venn’s Diagrams. Available online: http://bioinfogp.cnb.csic.es/tools/venny/index.html (accessed on 5 September 2017).
- Krey, J.F.; Wilmarth, P.A.; Shin, J.B.; Klimek, J.; Sherman, N.E.; Jeffery, E.D.; Choi, D.; David, L.L.; Barr-Gillespie, P.G. Accurate label-free protein quantitation with high-and low-resolution mass spectrometers. J. Proteome Res. 2014, 13, 1034–1044. [Google Scholar] [CrossRef] [PubMed]
- Krämer, A.; Green, J.; Pollard, J.; Tugendreich, S. Causal analysis approaches in ingenuity pathway analysis. Bioinformatics 2014, 30, 523–530. [Google Scholar] [CrossRef] [PubMed]
- Grigor’ev, A.I.; Fedorov, B.M. Stress under normal, hypokinesia simulating weightlessness, and during flights in space. Hum. Physiol. 1996, 22, 139–147. [Google Scholar] [PubMed]
- De Zeeuw, C.I.; Hoogenraad, C.C.; Goedknegt, E.; Hertzberg, E.; Neubauer, A.; Grosveld, F.; Galjart, N. CLIP-115, a novel brain-specific cytoplasmic linker protein, mediates the localization of dendritic lamellar bodies. Neuron 1997, 19, 1187–1199. [Google Scholar] [CrossRef]
- Hoogenraad, C.C.; Akhmanova, A.; Galjart, N.; de Zeeuw, C.I. LIMK1 and CLIP-115: Linking cytoskeletal defects to Williams syndrome. Bioessays 2004, 26, 141–150. [Google Scholar] [CrossRef] [PubMed]
- Hoogenraad, C.C.; Akhmanova, A.; Grosveld, F.; de Zeeuw, C.I.; Galjart, N. Functional analysis of CLIP-115 and its binding to microtubules. J. Cell Sci. 2000, 113, 2285–2297. [Google Scholar] [PubMed]
- Meyer-Lindenberg, A.; Mervis, C.B.; Berman, K.F. Neural mechanisms in Williams syndrome: A unique window to genetic influences on cognition and behavior. Nat. Rev. Neurosci. 2006, 7, 380–393. [Google Scholar] [CrossRef] [PubMed]
- Meyer-Lindenberg, A.; Mervis, C.B.; Sarpal, D.; Koch, P.; Steele, S.; Kohn, P.; Marenco, S.; Morris, C.A.; Das, S.; Kippenhan, S.; et al. Functional, structural, and metabolic abnormalities of the hippocampal formation in Williams syndrome. J. Clin. Investig. 2005, 115, 1888–1895. [Google Scholar] [CrossRef] [PubMed]
- Adkins, N.L.; Georgel, P.T. MeCP2: Structure and function. Biochem. Cell Biol. 2011, 89, 1–11. [Google Scholar] [CrossRef] [PubMed]
- Guy, J.; Cheval, H.; Selfridge, J.; Bird, A. The role of MeCP2 in the brain. Annu. Rev. Cell Dev. Biol. 2011, 27, 631–652. [Google Scholar] [CrossRef] [PubMed]
- Ausio, J.; de Paz, A.M.; Esteller, M. MeCP2: The long trip from a chromatin protein to neurological disorders. Trends Mol. Med. 2014, 20, 487–498. [Google Scholar] [CrossRef] [PubMed]
- Wang, C.; Wang, F.; Li, Z.; Cao, Q.; Huang, L.; Chen, S. MeCP2-mediated epigenetic regulation in senescent endothelial progenitor cells. Stem Cell Res. Ther. 2018, 9, 87. [Google Scholar] [CrossRef] [PubMed]
- Montgomery, K.R.; Titus, A.L.S.; Wang, L.; D’Mello, S.R. Elevated MeCP2 in Mice Causes Neurodegeneration Involving Tau Dysregulation and Excitotoxicity: Implications for the Understanding and Treatment of MeCP2 Triplication Syndrome. Mol. Neurobiol. 2018. [Google Scholar] [CrossRef] [PubMed]


| Protein Names | Function | Fold-Changes |
|---|---|---|
| MECP2 | Cell cycle, neurological disorder | 5.85 |
| TMEM 109 | Cell death and survival, neurological disease | 3.69 |
| S100A10 | Cell cycle | 3.19 |
| HECT D4 | Neuronal signaling | 2.04 |
| XPO 1 | Cell cycle | 2.02 |
| CLIP2 | Neuronal cell structure and function | −2.96 |
| SOGA3 | Glucose metabolism | −2.94 |
| CBFB | Cell repair | −2.83 |
| RAB6A | Cellular assembly | −2.63 |
| PYGB | Immune cell trafficking | −2.58 |
| HSD17B12 | Cell death and survival | −2.57 |
| RUVBL2 | Cell repair | −2.42 |
| NPLOC4 | Cellular organization | −2.29 |
| DAP3 | Apoptosis | −2.25 |
| SGCA | Cell cycle | −2.24 |
| Protein Names | Function | Fold-Changes |
|---|---|---|
| CAPN3 | Molecular transport | 7.38 |
| CAVIN2 | Vascular permeability | −3.93 |
| EDC4 | Lipid metabolism | −2.94 |
| KLC2 | Cell death and survival | −2.87 |
| ClIP2 | Neuronal cell structure and function | −2.74 |
| MAP4 | Lipid metabolism | −2.22 |
| Protein Names | Function | Fold-Changes |
|---|---|---|
| RPL10 | Cell death and survival | 4.60 |
| C3 | Cell morphology and assembly | 4.29 |
| CLASP1 | Cell assembly and organization | 4.26 |
| HDGFL2 | Angiogenesis and neuronal signaling | 4.22 |
| RPS27L | Protein synthesis | 4.16 |
| THTPA | Protein phosphorylation | 3.91 |
| TPM1 | Cell structure and function | 3.91 |
| NCND | Cell cycle | 3.76 |
| RPL23 | Protein catabolism | 3.69 |
| CNPYS | Cellular metabolism | −6.27 |
| ITGA5 | Cell signaling | −5.93 |
| SF3A2 | Cell signaling | −5.42 |
| ENOPH1 | Cellular structure | −4.60 |
| SMUG1 | Cellular organization and repair | −4.02 |
| KYAT3 | Cell metabolism | −3.86 |
| FBXO22 | Protein catabolism | −3.03 |
© 2018 by the authors. Licensee MDPI, Basel, Switzerland. This article is an open access article distributed under the terms and conditions of the Creative Commons Attribution (CC BY) license (http://creativecommons.org/licenses/by/4.0/).
Share and Cite
Mao, X.W.; Byrum, S.; Nishiyama, N.C.; Pecaut, M.J.; Sridharan, V.; Boerma, M.; Tackett, A.J.; Shiba, D.; Shirakawa, M.; Takahashi, S.; et al. Impact of Spaceflight and Artificial Gravity on the Mouse Retina: Biochemical and Proteomic Analysis. Int. J. Mol. Sci. 2018, 19, 2546. https://doi.org/10.3390/ijms19092546
Mao XW, Byrum S, Nishiyama NC, Pecaut MJ, Sridharan V, Boerma M, Tackett AJ, Shiba D, Shirakawa M, Takahashi S, et al. Impact of Spaceflight and Artificial Gravity on the Mouse Retina: Biochemical and Proteomic Analysis. International Journal of Molecular Sciences. 2018; 19(9):2546. https://doi.org/10.3390/ijms19092546
Chicago/Turabian StyleMao, Xiao W., Stephanie Byrum, Nina C. Nishiyama, Michael J. Pecaut, Vijayalakshmi Sridharan, Marjan Boerma, Alan J. Tackett, Dai Shiba, Masaki Shirakawa, Satoru Takahashi, and et al. 2018. "Impact of Spaceflight and Artificial Gravity on the Mouse Retina: Biochemical and Proteomic Analysis" International Journal of Molecular Sciences 19, no. 9: 2546. https://doi.org/10.3390/ijms19092546
APA StyleMao, X. W., Byrum, S., Nishiyama, N. C., Pecaut, M. J., Sridharan, V., Boerma, M., Tackett, A. J., Shiba, D., Shirakawa, M., Takahashi, S., & Delp, M. D. (2018). Impact of Spaceflight and Artificial Gravity on the Mouse Retina: Biochemical and Proteomic Analysis. International Journal of Molecular Sciences, 19(9), 2546. https://doi.org/10.3390/ijms19092546