Article

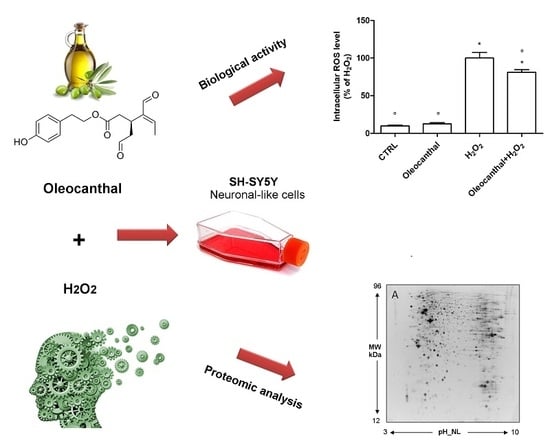
A Proteomic Approach to Uncover Neuroprotective Mechanisms of Oleocanthal against Oxidative Stress

1
Department of Clinical and Experimental Medicine, University of Pisa, 56126 Pisa, Italy
2
School of Pharmacy, University of Camerino, 62032 Camerino, Italy
3
Department for Life Quality Studies, Alma Mater Studiorum, University of Bologna, 47921 Rimini, Italy
4
Department of Pharmacy, University of Pisa, 56126 Pisa, Italy
5
Department of Rheumatology, GIGA Research, Centre Hospitalier Universitaire (CHU) de Liège, University of Liège, 4000 Liège, Belgium
6
Department of Medical, Oral and Biotechnological Sciences, University G. d’Annunzio of Chieti-Pescara, 65127 Pescara, Italy
7
Institute of Biochemistry and Clinical Biochemistry, Catholic University, 00198 Rome, Italy
*
Author to whom correspondence should be addressed.
These authors contributed equally to this work.
Int. J. Mol. Sci. 2018, 19(8), 2329; https://doi.org/10.3390/ijms19082329
Submission received: 3 July 2018 / Revised: 31 July 2018 / Accepted: 1 August 2018 / Published: 8 August 2018
(This article belongs to the Special Issue Olive Bioactives, Nutraceuticals and Health)

Abstract

:
Neurodegenerative diseases represent a heterogeneous group of disorders that share common features like abnormal protein aggregation, perturbed Ca2+ homeostasis, excitotoxicity, impairment of mitochondrial functions, apoptosis, inflammation, and oxidative stress. Despite recent advances in the research of biomarkers, early diagnosis, and pharmacotherapy, there are no treatments that can halt the progression of these age-associated neurodegenerative diseases. Numerous epidemiological studies indicate that long-term intake of a Mediterranean diet, characterized by a high consumption of extra virgin olive oil, correlates with better cognition in aged populations. Olive oil phenolic compounds have been demonstrated to have different biological activities like antioxidant, antithrombotic, and anti-inflammatory activities. Oleocanthal, a phenolic component of extra virgin olive oil, is getting more and more scientific attention due to its interesting biological activities. The aim of this research was to characterize the neuroprotective effects of oleocanthal against H2O2-induced oxidative stress in neuron-like SH-SY5Y cells. Moreover, protein expression profiling, combined with pathways analyses, was used to investigate the molecular events related to the protective effects. Oleocanthal was demonstrated to counteract oxidative stress, increasing cell viability, reducing reactive oxygen species (ROS) production, and increasing reduced glutathione (GSH) intracellular level. Proteomic analysis revealed that oleocanthal significantly modulates 19 proteins in the presence of H2O2. In particular, oleocanthal up-regulated proteins related to the proteasome, the chaperone heat shock protein 90, the glycolytic enzyme pyruvate kinase, and the antioxidant enzyme peroxiredoxin 1. Moreover, oleocanthal protection seems to be mediated by Akt activation. These data offer new insights into the molecular mechanisms behind oleocanthal protection against oxidative stress.

Graphical Abstract

1. Introduction

With the acceleration of the size of the aging population, the world is now experiencing the “aging era” characterized by an increased incidence of neurodegenerative diseases like Alzheimer’s disease (AD) and Parkinson’s disease (PD) [1]. Neurodegenerative diseases represent a heterogeneous group of disorders whose common characteristic is the progressive and selective loss of neurons. Although many studies have been carried out to understand the pathophysiology of neurodegenerative diseases over the years, more efforts are still needed to uncover the processes that trigger these disorders. Despite different aetiologies, neurodegenerative disorders share common features like abnormal protein aggregation, perturbed Ca2+ homeostasis, excitotoxicity, impairment of mitochondrial functions, apoptosis, inflammation, and oxidative stress [2,3]. Oxidative stress is an imbalance between accumulation and removal of reactive oxygen species (ROS). The brain is especially susceptible to oxidative stress due to its high oxygen consumption, high content of oxidizable polyunsaturated fatty acids, and low level of endogenous antioxidants and antioxidant enzymes [4,5,6]. It has been shown that oxidative stress is involved in the onset and progression of neurodegenerative diseases like PD [2,7,8,9,10] and AD [11,12,13].
Despite recent advances in the research of biomarkers, early diagnosis, and pharmacotherapy, there are no treatments that can halt the progression or reverse the brain changes of any age-associated neurodegenerative diseases. This is likely due to the multifactorial nature of these pathologies that arise from a confluence of multiple, toxic insults.
Diet is considered one of the most important factors in lifestyle. Diet strongly influences the occurrence of cardiovascular and neurodegenerative diseases and, hence, a healthy lifestyle can be related to healthy aging [14]. Numerous epidemiological studies indicate that long-term intake of a Mediterranean diet, characterized by a high consumption of extra virgin olive oil, correlates with better cognition in aged populations [15,16,17]. Olive oil phenolic compounds have been demonstrated to possess different biological activities like antioxidant [18], antithrombotic [19], and anti-inflammatory [20] activities. Oleocanthal, a dialdehydic form of (−)-deacetoxyligstroside glycoside, is one of the phenolic components of extra virgin olive oil [21]. Even though oleocanthal makes up only 10% of the olive’s phenols, it is getting more and more scientific attention due to its interesting biological activities [22,23]. Oleocanthal is responsible for the bitter and pungent taste of extra virgin olive oil, and has anti-inflammatory properties similar to the nonsteroidal anti-inflammatory drug ibuprofen [24]. In vitro, it has been shown that oleocanthal is effective on the key mediators of AD pathogenesis, amyloid-β and hyper-phosphorylated tau proteins [25,26,27,28], which contribute significantly to neurodegeneration and memory loss [29]. Moreover, oleocanthal reduces astrocyte activation and interleukin-1β levels in vivo [21]. Studies on the antioxidant activities of oleocanthal are limited. Only one study carried out in isolated human monocytes showed that oleocanthal inhibits nicotinamide adenine dinucleotide phosphate oxidase (NOX) activity and reduces the intracellular level of superoxide anion [30].
The aim of this research was to characterize the neuroprotective effects of oleocanthal against H2O2-induced oxidative stress in the neuron-like SH-SY5Y cell line. Moreover, protein expression profiling, combined with pathways analyses, was used to investigate the molecular events related to the protective effects, and to gain insight into the underlying mechanisms of neuroprotection and oxidative damage.

2. Results

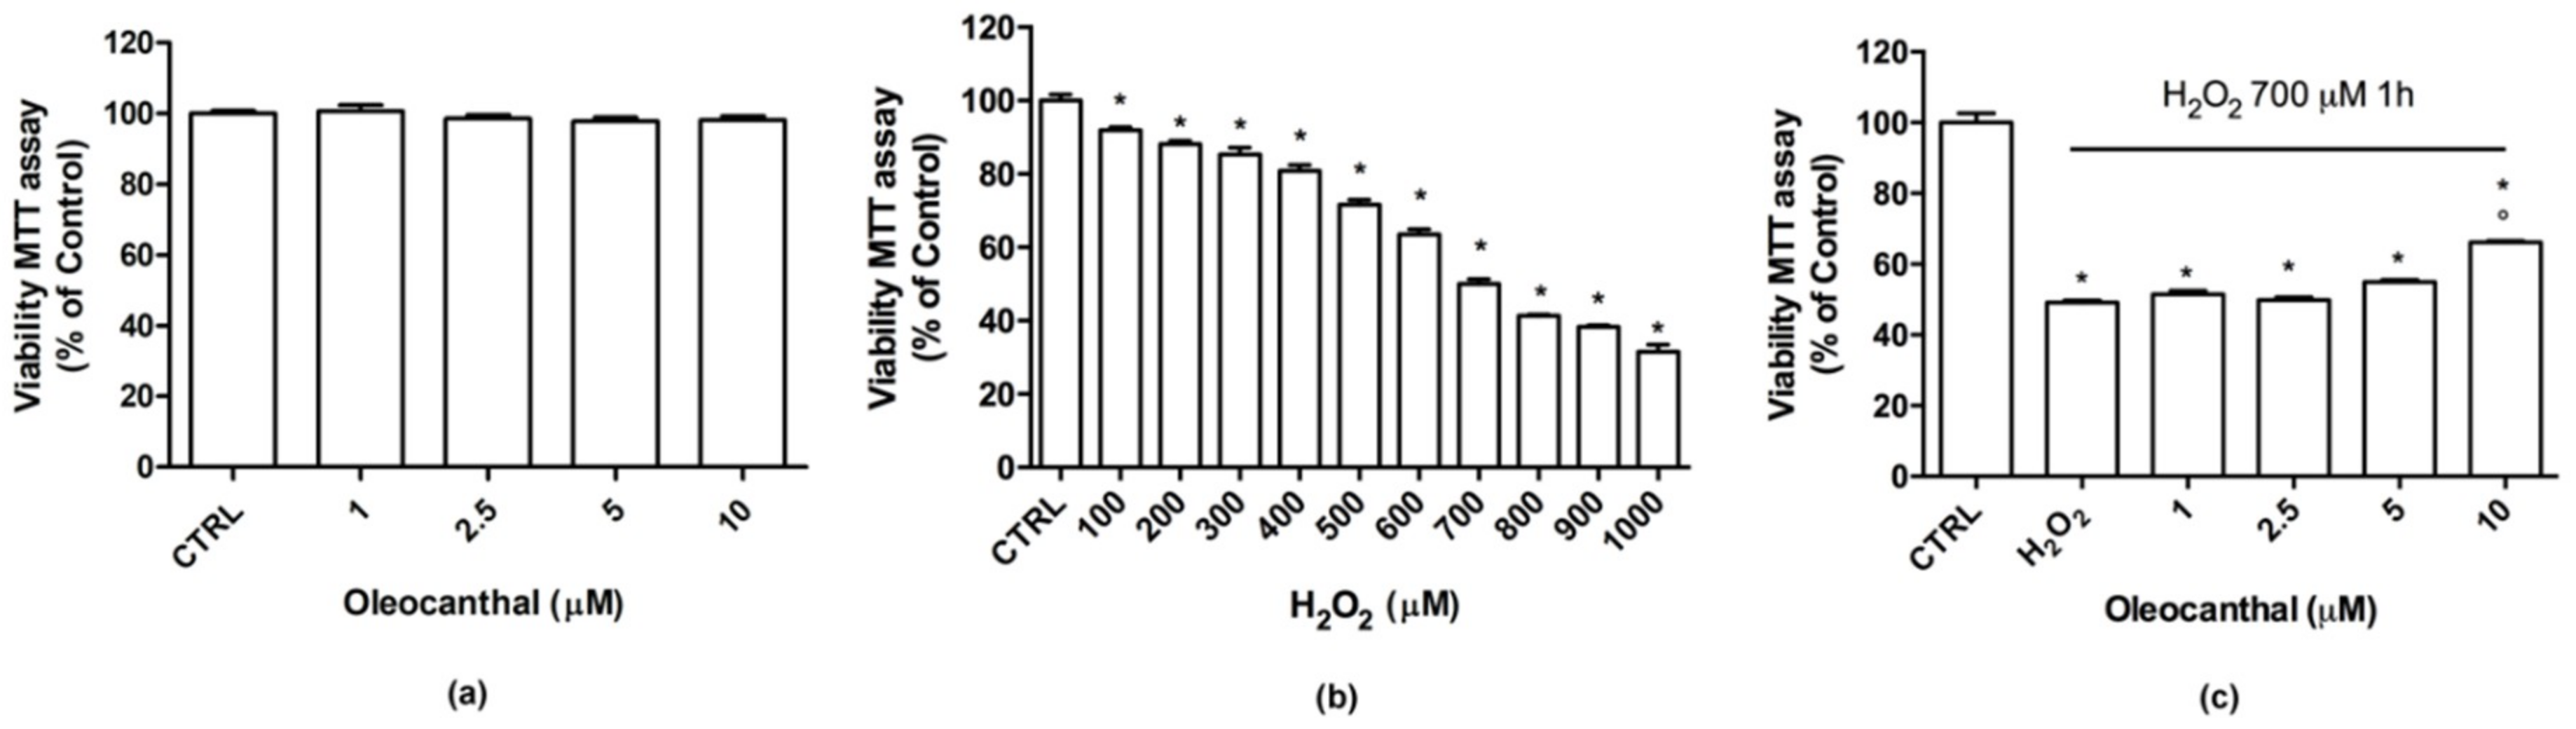
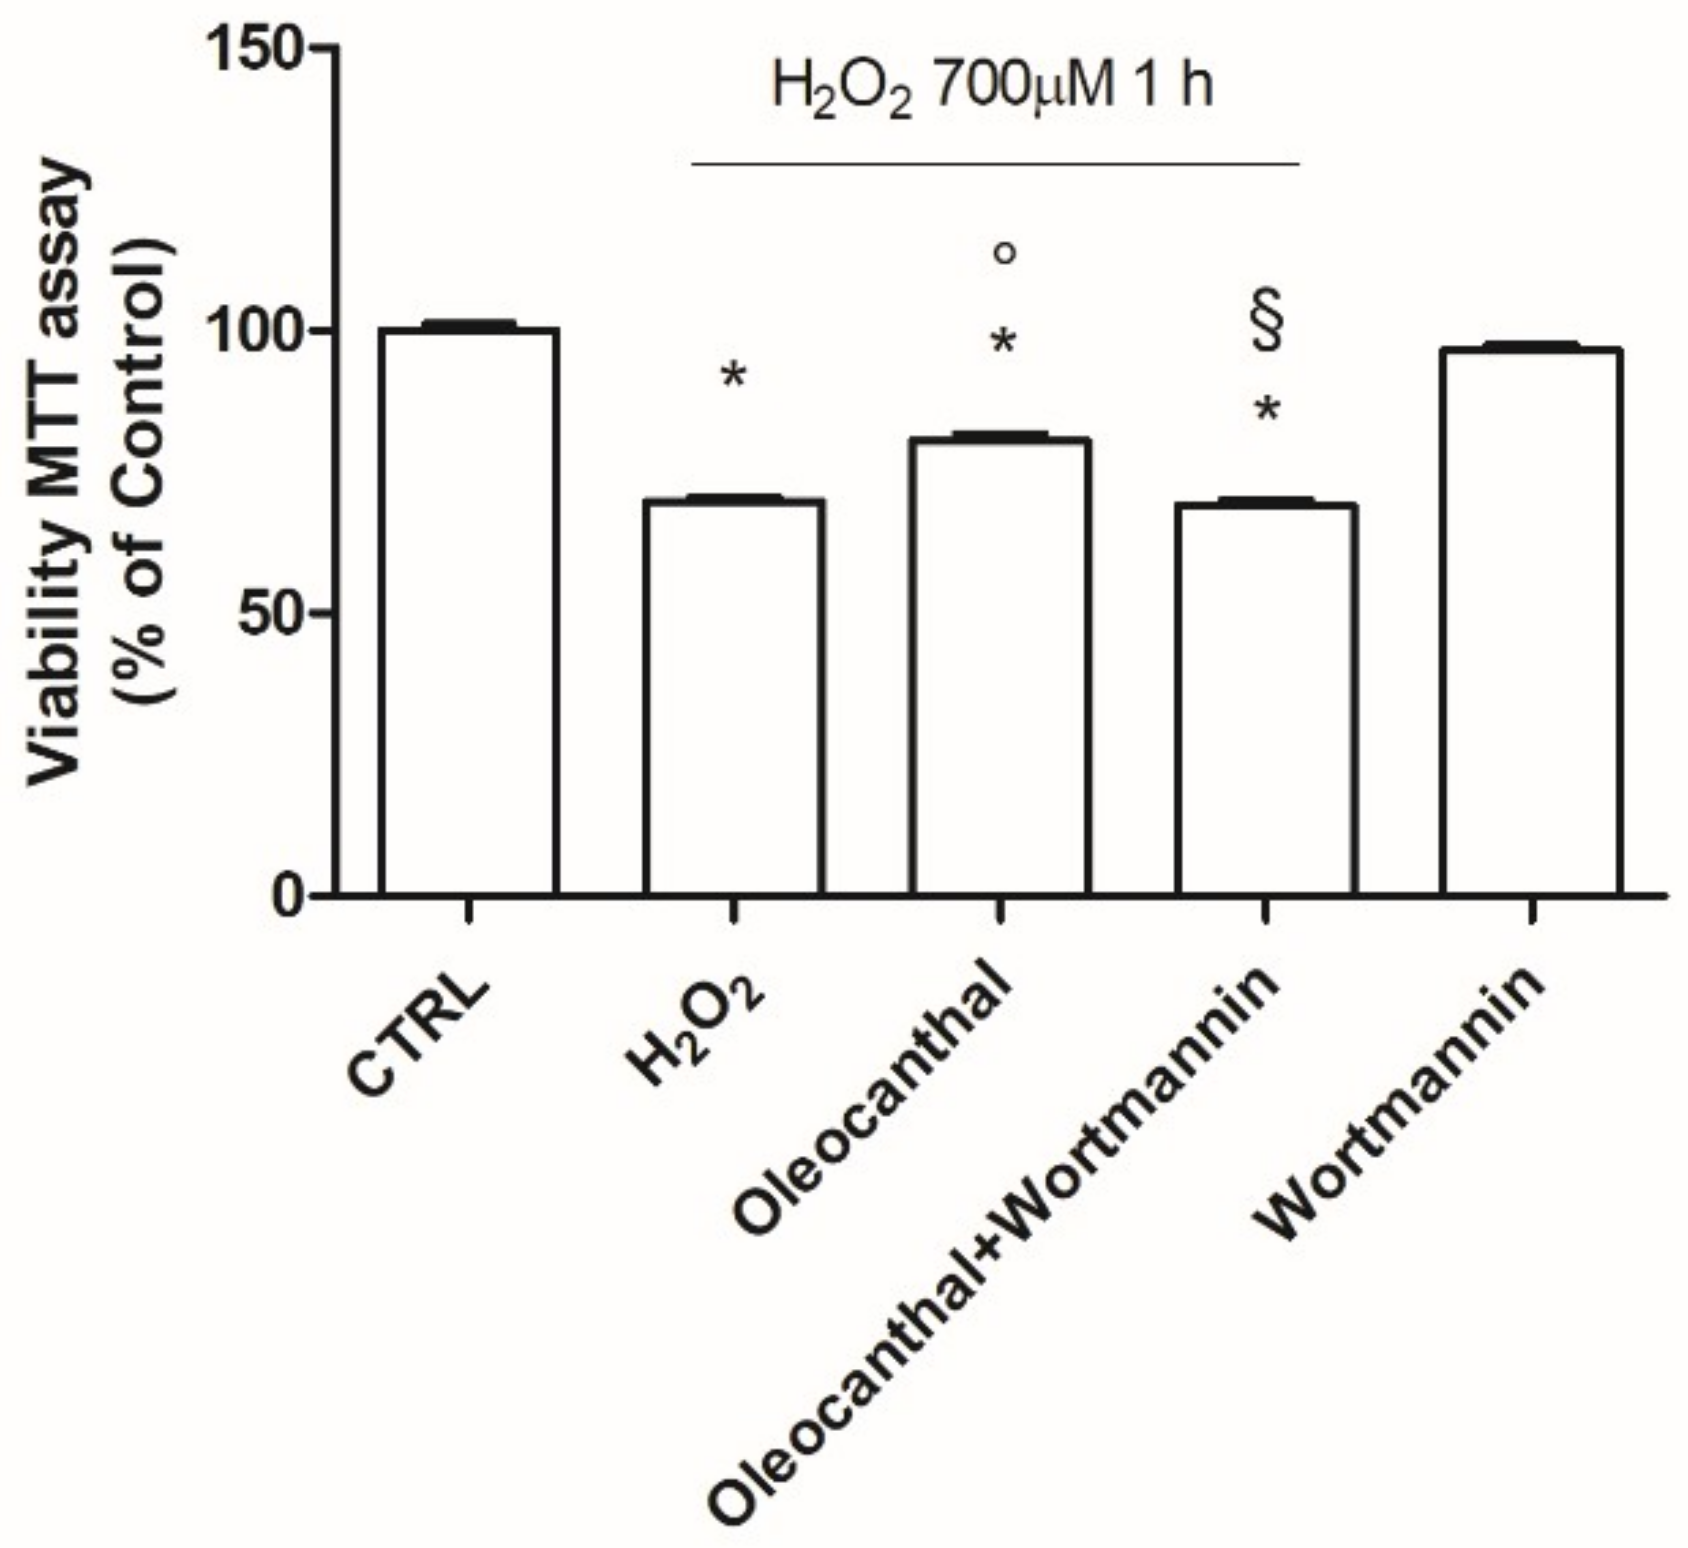
2.1. Neuroprotective Effects of Oleocanthal against H2O2-Induced Damage

To investigate the potential cytotoxicity of oleocanthal, differentiated SH-SY5Y cells were treated with different concentrations (1–10 µM) of oleocanthal for 24 h (Figure 1a). Of note, oleocanthal did not show any effect on cell viability at any tested concentrations. To study the potential protective activity of oleocanthal against oxidative injury, cells were treated with increasing concentrations (1–10 µM) of oleocanthal before the induction of oxidative stress by 700 µM H2O2 exposure for 1 h (Figure 1c). This peroxide concentration has been chosen as it reduces cell viability by 50% with respect to control cells (Figure 1b). Moreover, similar H2O2 concentrations have been recently used by Piras et al. [31] in differentiated SH-SY5Y cells.
Cell viability was measured by 3-(4,5-dimethylthiazol-2-yl)-2,5diphenyl-tetrazolium bromide (MTT) assay. As expected, H2O2 significantly reduced cell viability with respect to control cells. Quantities of 1 to 5 µM oleocanthal were not able to counteract peroxide’s deleterious effects as cell viability was comparable to that of H2O2-treated cells. On the contrary, 10 µM oleocanthal significantly increased cell viability with respect to H2O2-treated cells. For these reasons, the subsequent experiments were carried out using 10 µM oleocanthal.

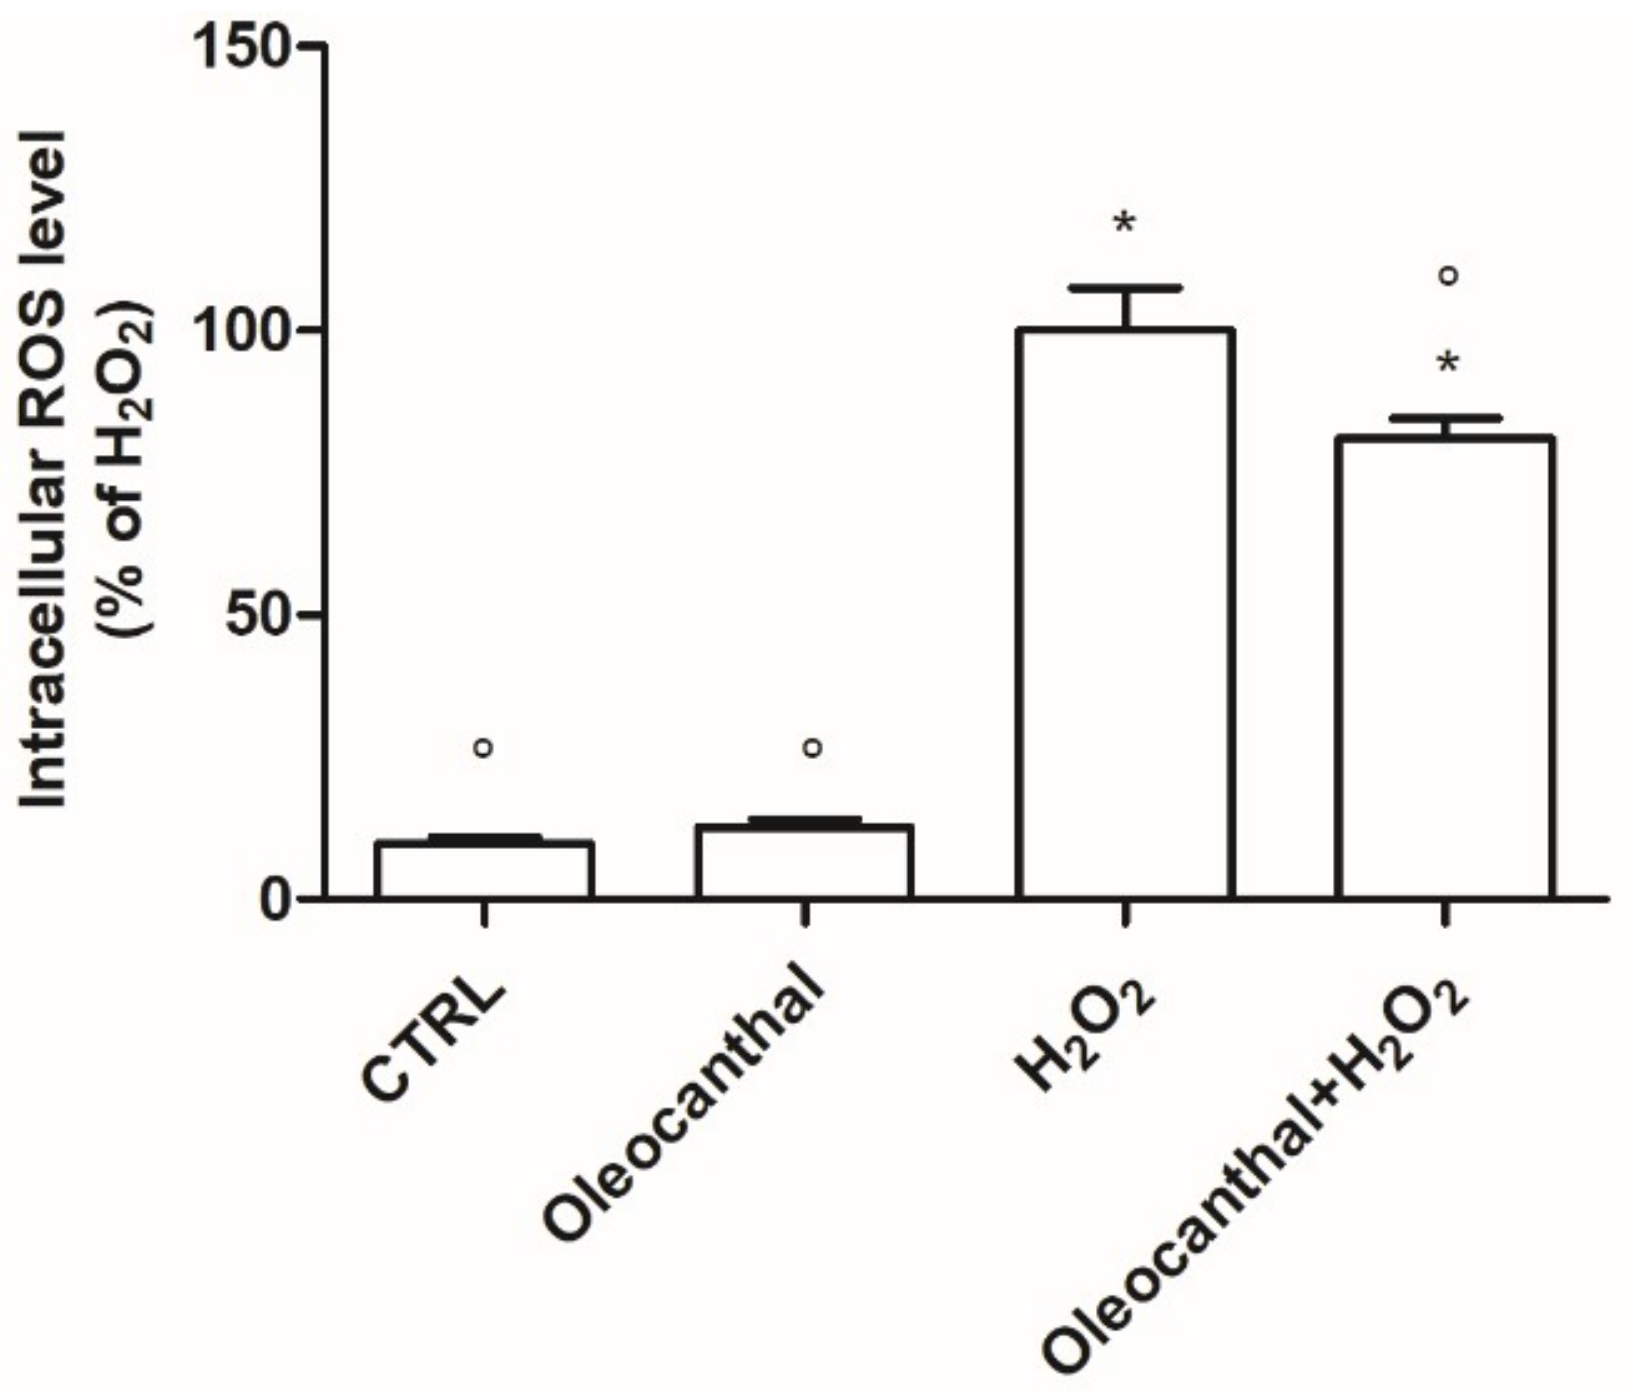
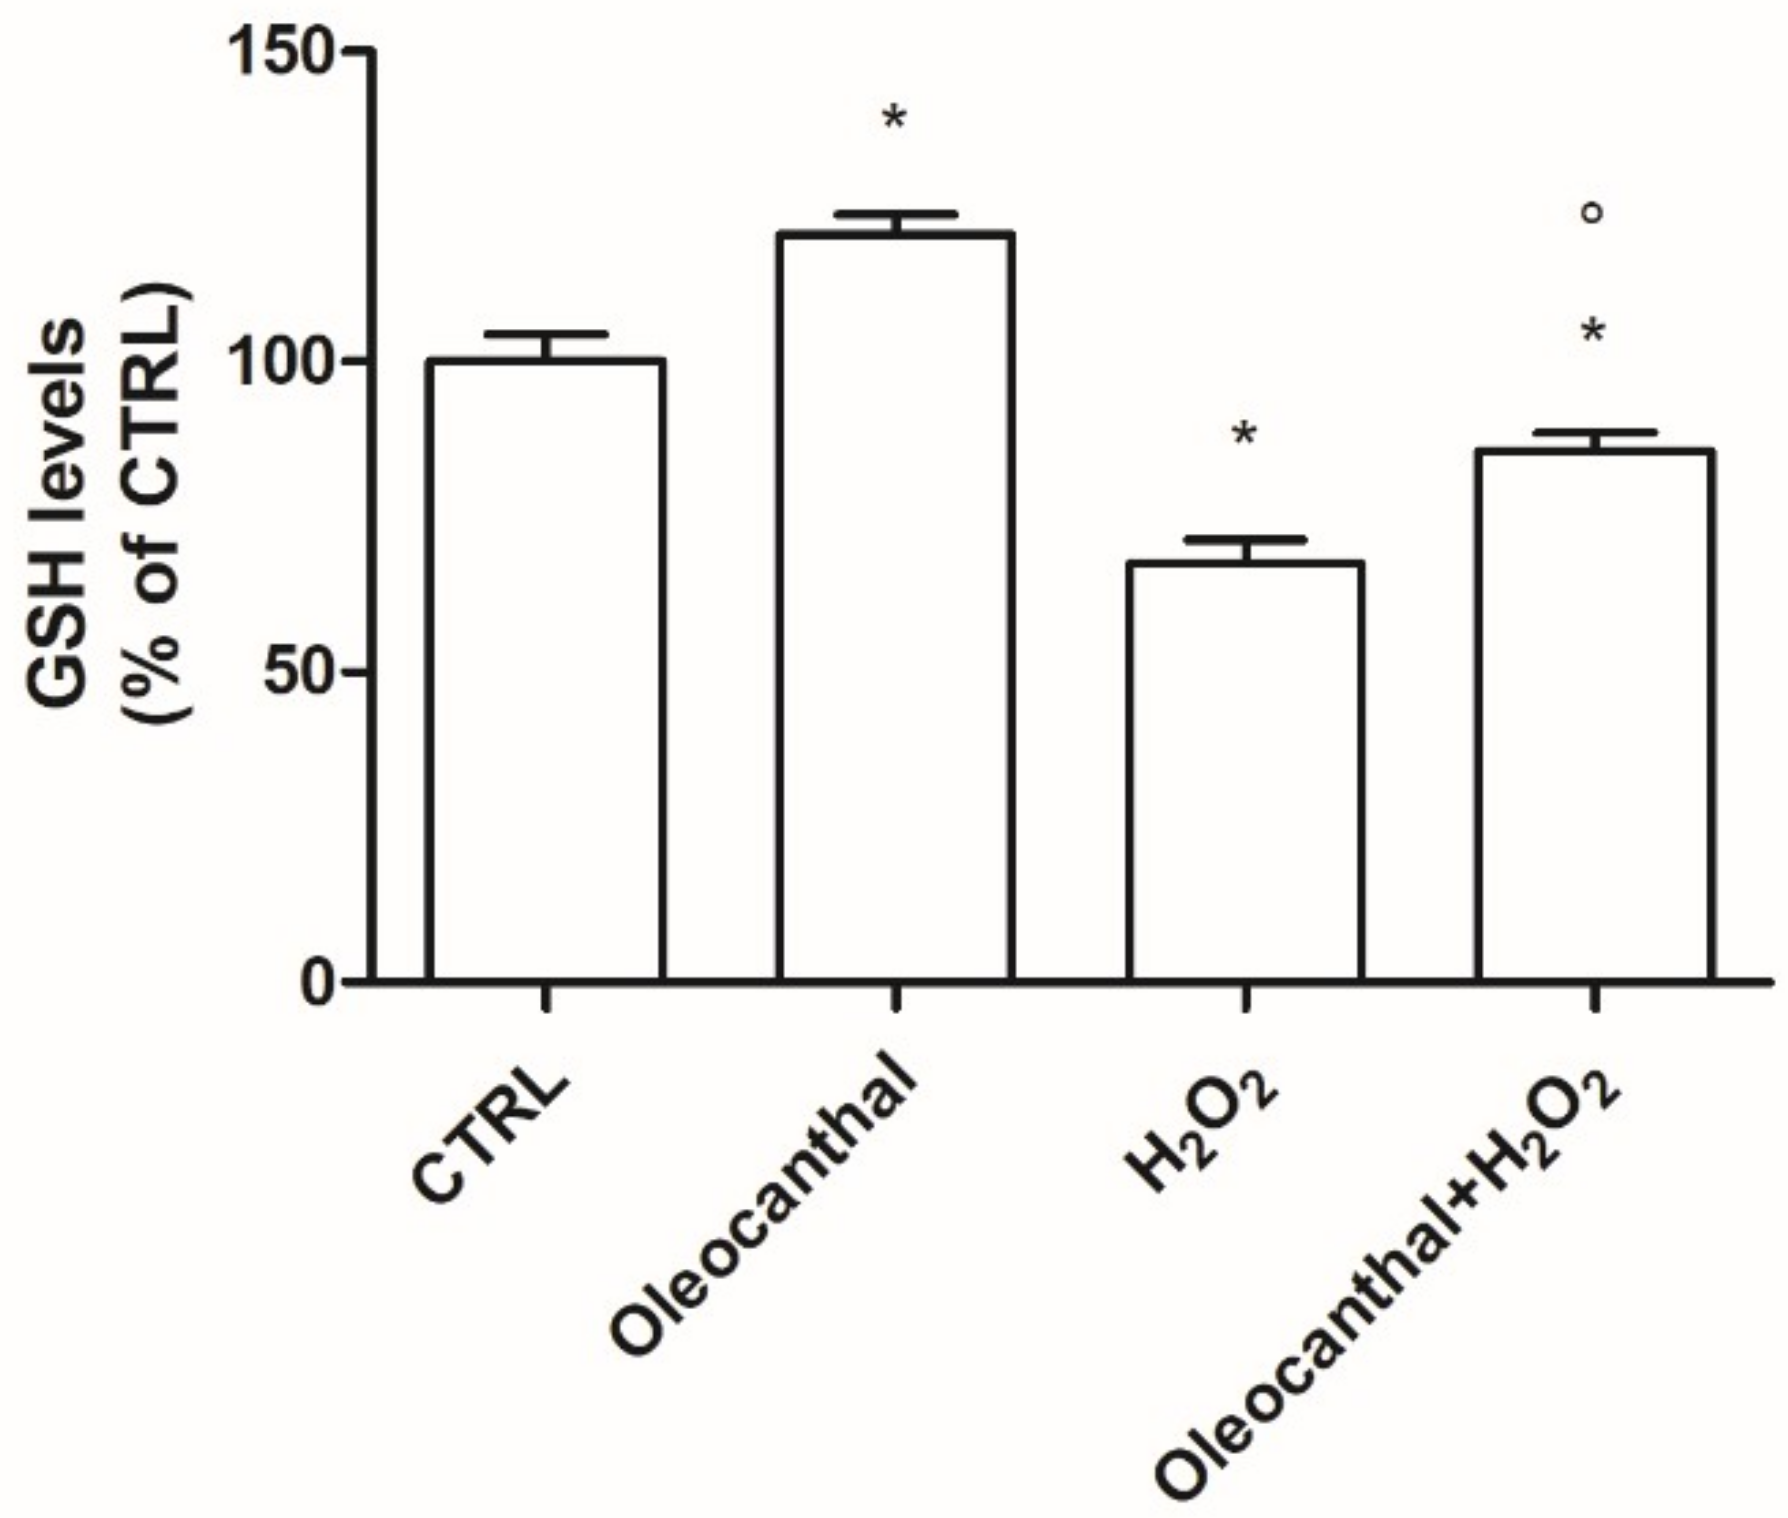
2.2. Antioxidant Activity of Oleocanthal against H2O2-Induced Oxidative Stress

The ability of oleocanthal to counteract H2O2-induced intracellular ROS production was investigated by the 2,7-dichlorodihydrofluorescein diacetate (DCFH-DA) assay. As illustrated in Figure 2, incubation of differentiated SH-SY5Y cells with H2O2 resulted in a significant and marked increase in intracellular ROS levels. Oleocanthal, in contrast, significantly reduced intracellular ROS levels compared to H2O2. There was no change in ROS levels after treatment with oleocanthal alone.
As GSH is the most abundant endogenous antioxidant [32], we next evaluated the effect of oleocanthal treatment in the absence/presence of H2O2 on intracellular GSH levels by monochlorobimane (MCB) assay (Figure 3). Interestingly, oleocanthal alone was able to increase GSH levels compared with control cells. Exposure to H2O2 caused a significant decrease in GSH levels; meanwhile, pretreatment with oleocanthal significantly increased the amount of GSH compared with in H2O2-treated cells.

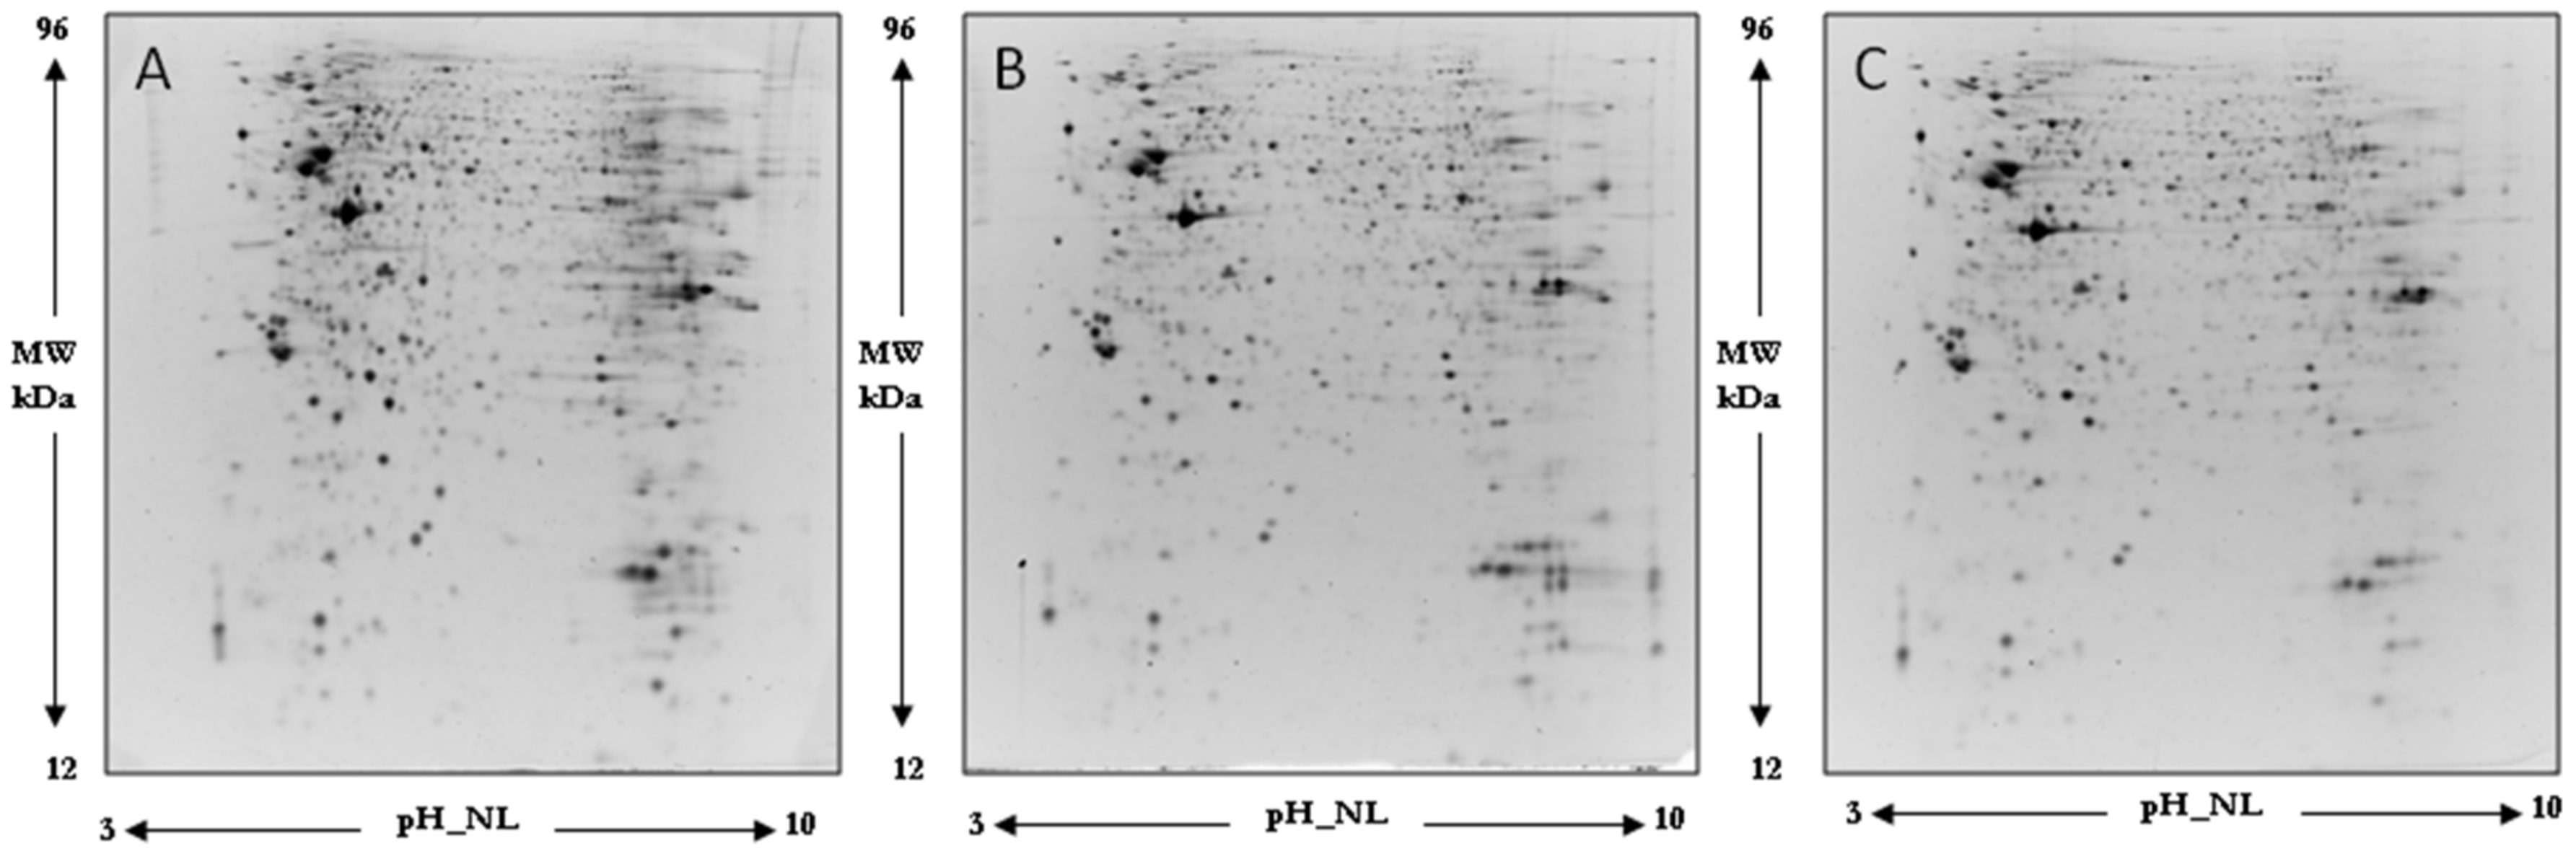
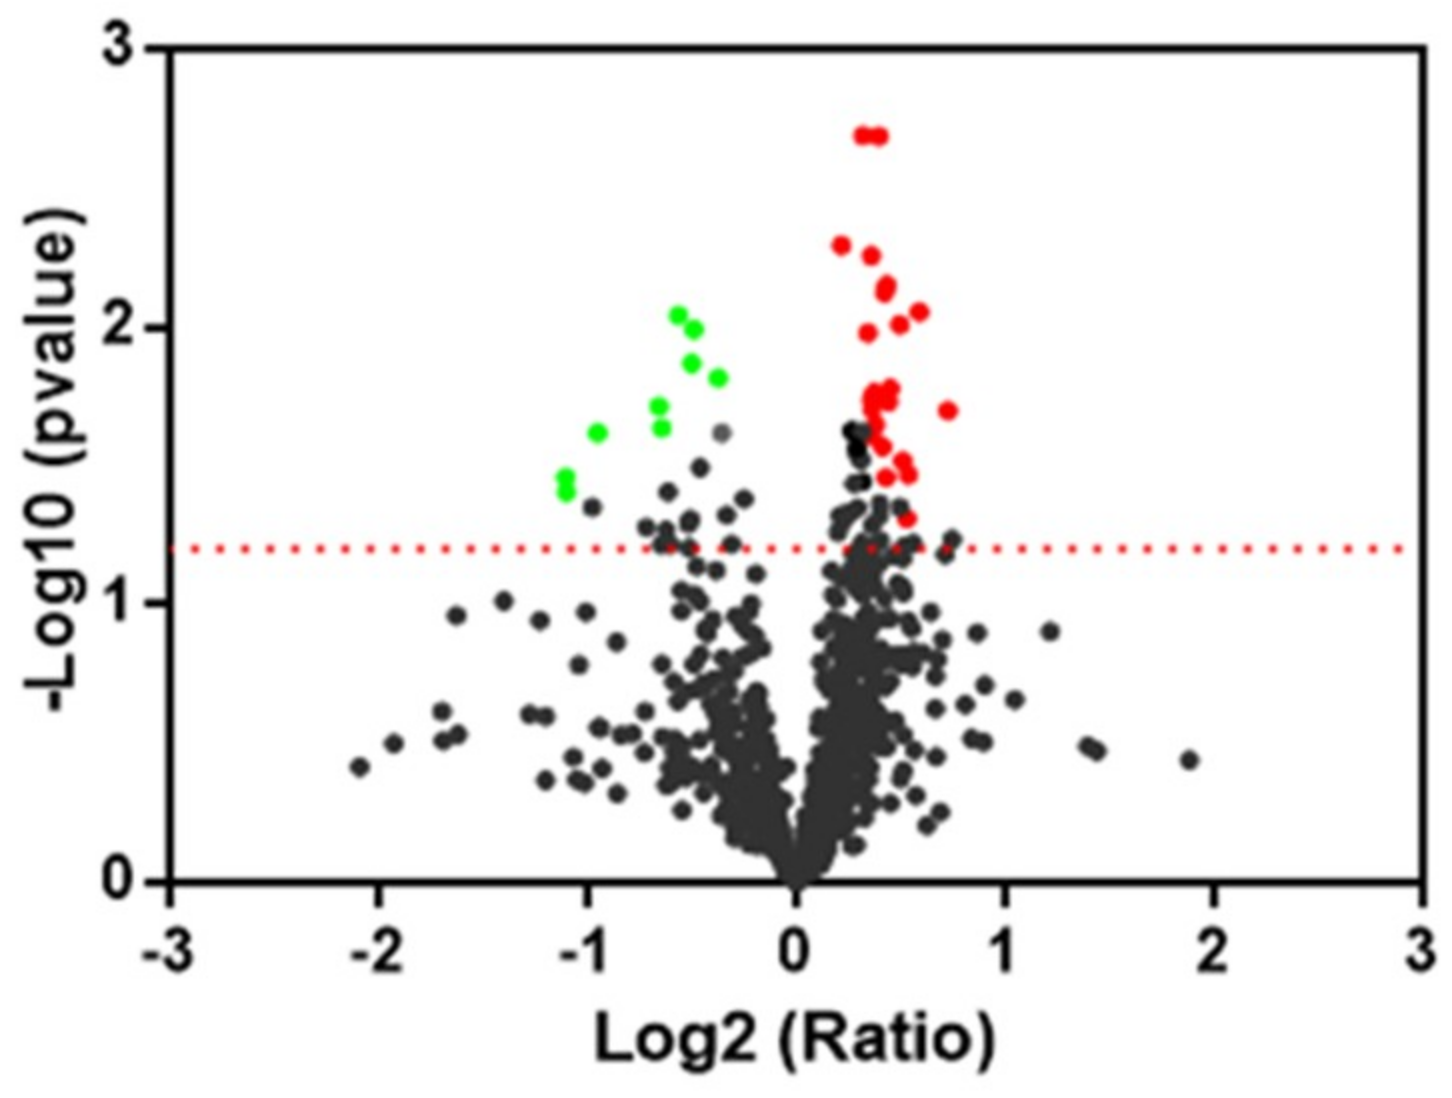
2.3. Protein Expression Analysis

Figure 4 illustrates a representative two-dimensional electrophoresis (2DE) image of differentiated SH-SY5Y human neuroblastoma cellular protein extracts. The quality of the gels was assessed by the software Same Spot which includes the SpotCheck function. SpotCheck is a separate quality control workflow which allowed us to objectively assess the quality of our gels images. We selected a “gold standard” gel (a reference gel) and each gel was tested against it; the software confirmed that we ran gels in a reproducible manner.
Overall, an average of 1100 ± 150 spots was found within a nonlinear pH range from 3 to 10.
Normalized spot volumes were analyzed by the ANOVA test to detect the proteins which were significantly (p < 0.05, q value < 0.05) differentially expressed among different comparisons. Regarding comparison with the control of the 46 spots detected as modified by the treatment with H2O2, 6 were up- and 40 down-regulated. Twelve spots were found differentially expressed in cells treated with oleocanthal; 5 were up- and 7 down-regulated. Finally, of the 46 spots significantly modified by the addition of oleocanthal + H2O2, 14 were up- and 32 down-regulated.
To investigate the protection of oleocanthal against the detrimental effect of H2O2, a comparison between oleocanthal + H2O2 vs. H2O2 was carried out. A volcano plot was constructed to represent fold change in protein expression (Figure 5). By this way, 31 spots were found with significant change of expression; 22 were up- and 9 down-regulated.
All spots of interest were selected and excised from the gel and identified by nano-LC-ESI-MS/MS.
A list of identified proteins, with molecular weight (MW), isoelectric point (pI), score, and coverage values of MS/MS is shown in Table 1, while Table 2 and Table 3 show the protein names, ratio, and p values of proteins resulting as significantly changed in the comparison between H2O2 vs. control and oleocanthal + H2O2 vs. H2O2, respectively.

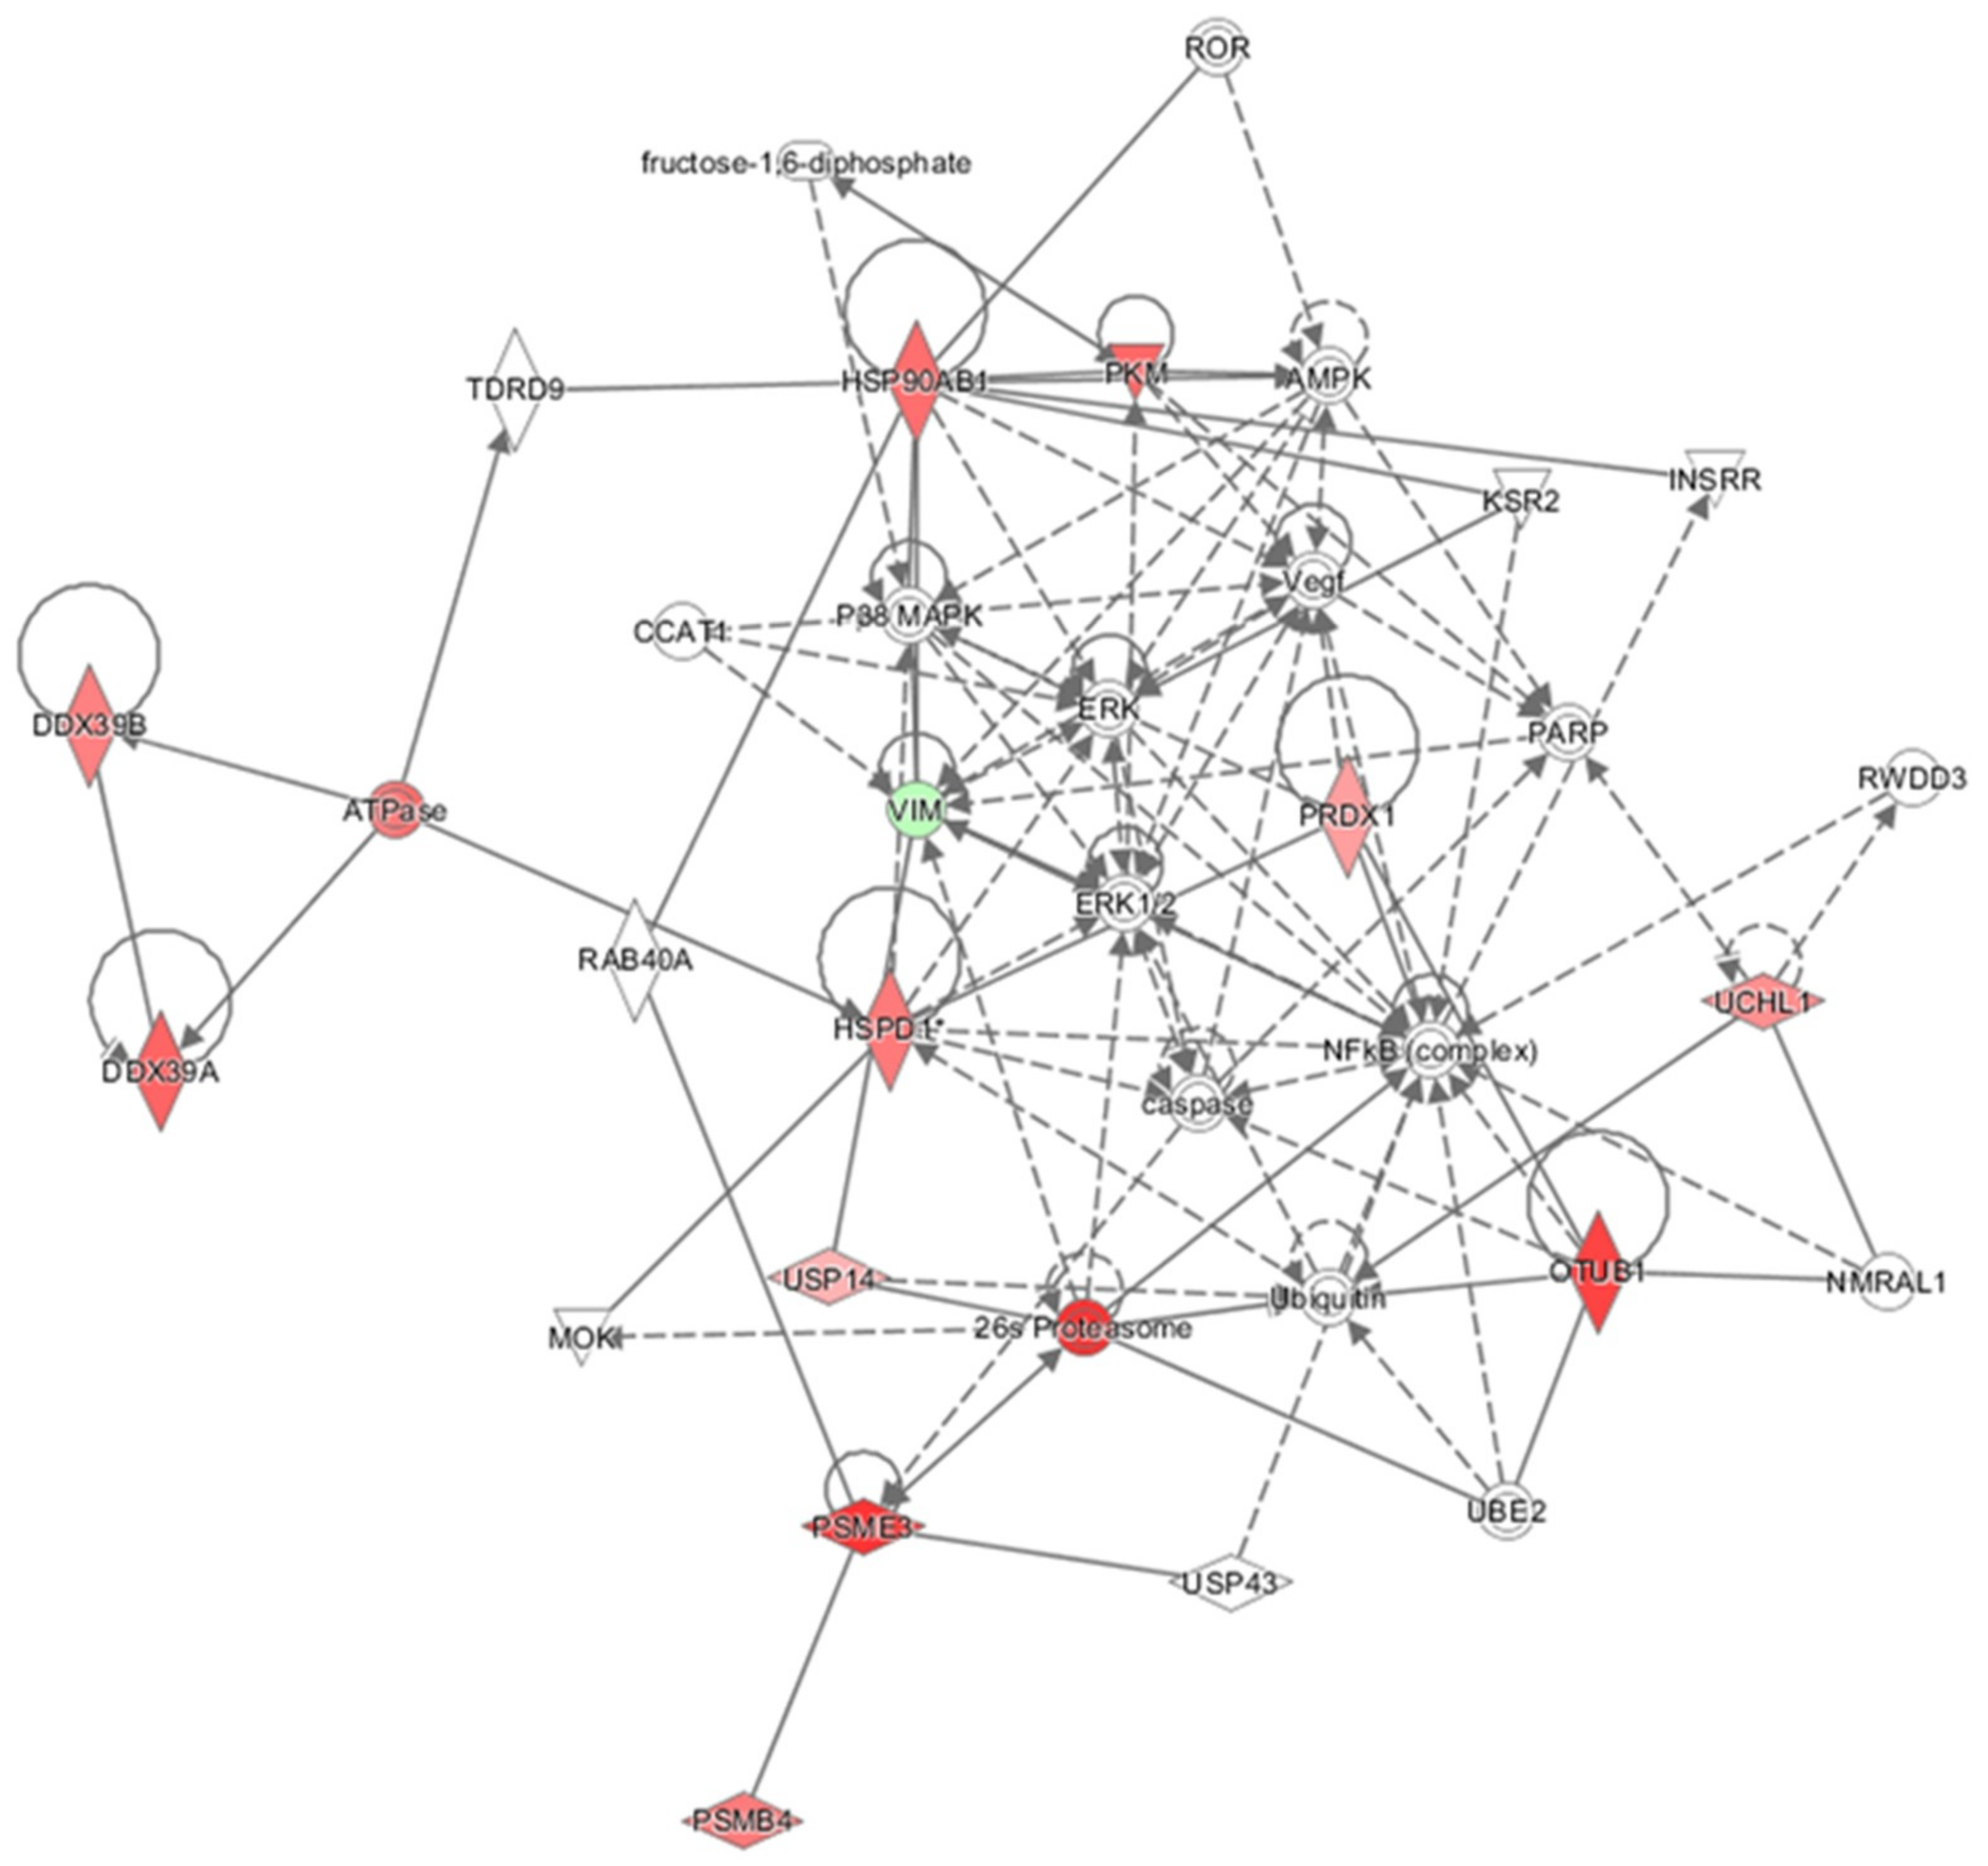
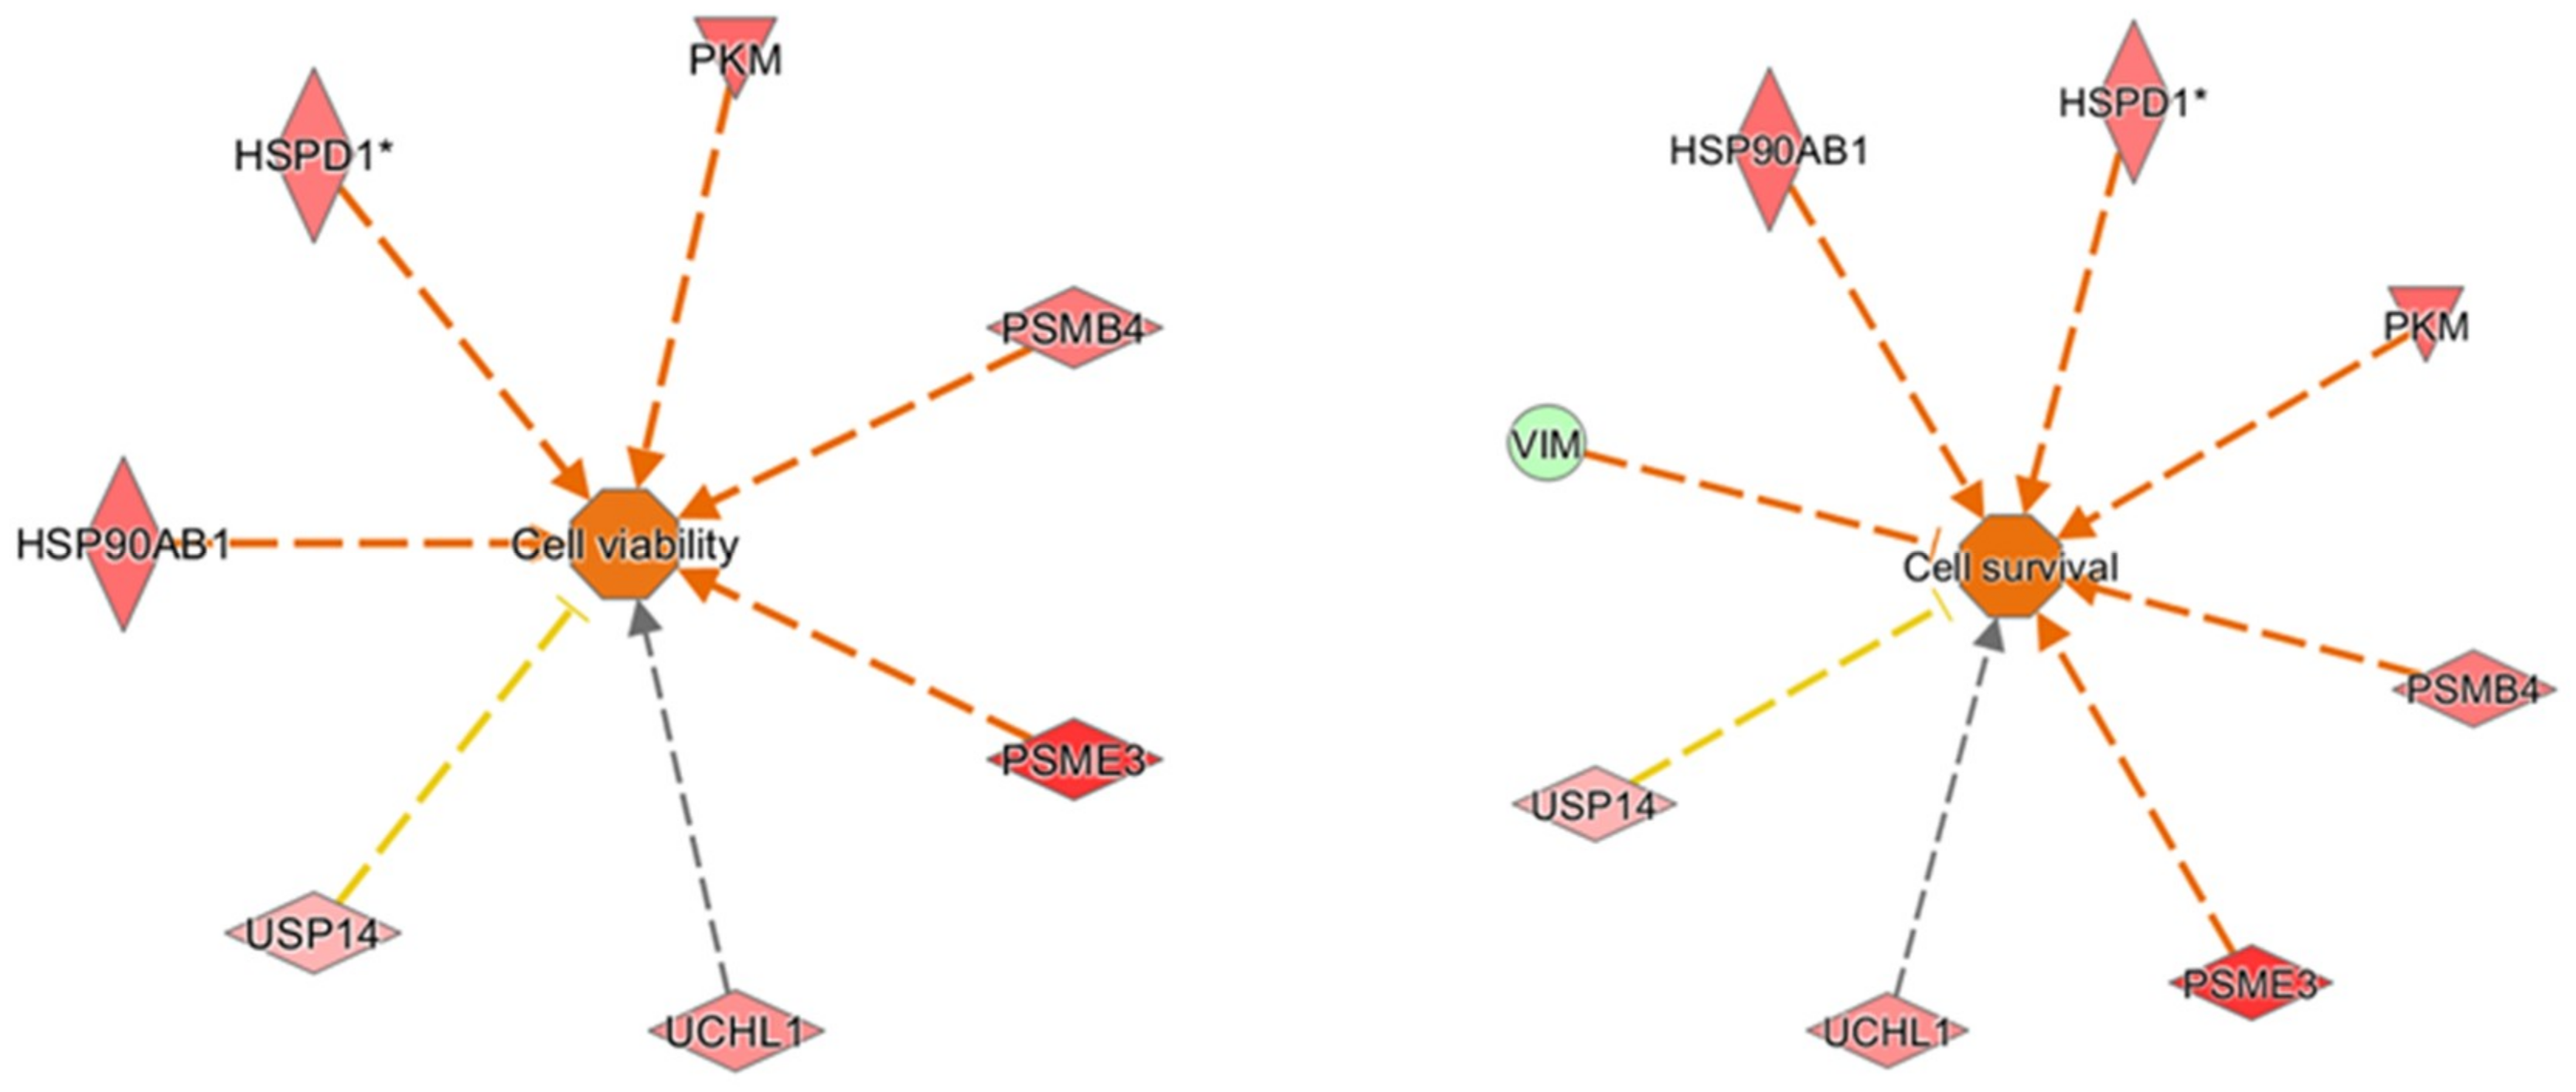
2.4. Pathway and Network Analysis

For the oleocanthal + H2O2 vs. H2O2 comparison, proteins found differentially expressed were included in the Ingenuity Pathways Analysis (IPA) analysis to identify molecular and cellular functions and to investigate whether these proteins work together in specific networks. Therefore, the software generated a main network (Figure 6) with associated biofunctions “Cancer, Organismal Injury, and Abnormalities” and focused on canonical pathways which showed our differentially expressed molecules to fall into functional categories such as protein synthesis, protein degradation, cell death and survival, and cellular function and maintenance. All the proteins found to be up- and down-regulated may concur in an upstream regulator analysis to predict if transcription factors or genes could be activated or inactivated in agreement with the z-score value (z-score > 2 and p < 0.05). Two activated transcription regulators were found: MYCN (z = 2.0) and NFE2L2 (z = 2.17). Furthermore, hypothetical activated and inhibited master regulators in derived causal networks were suggested by the analysis (Table 4).

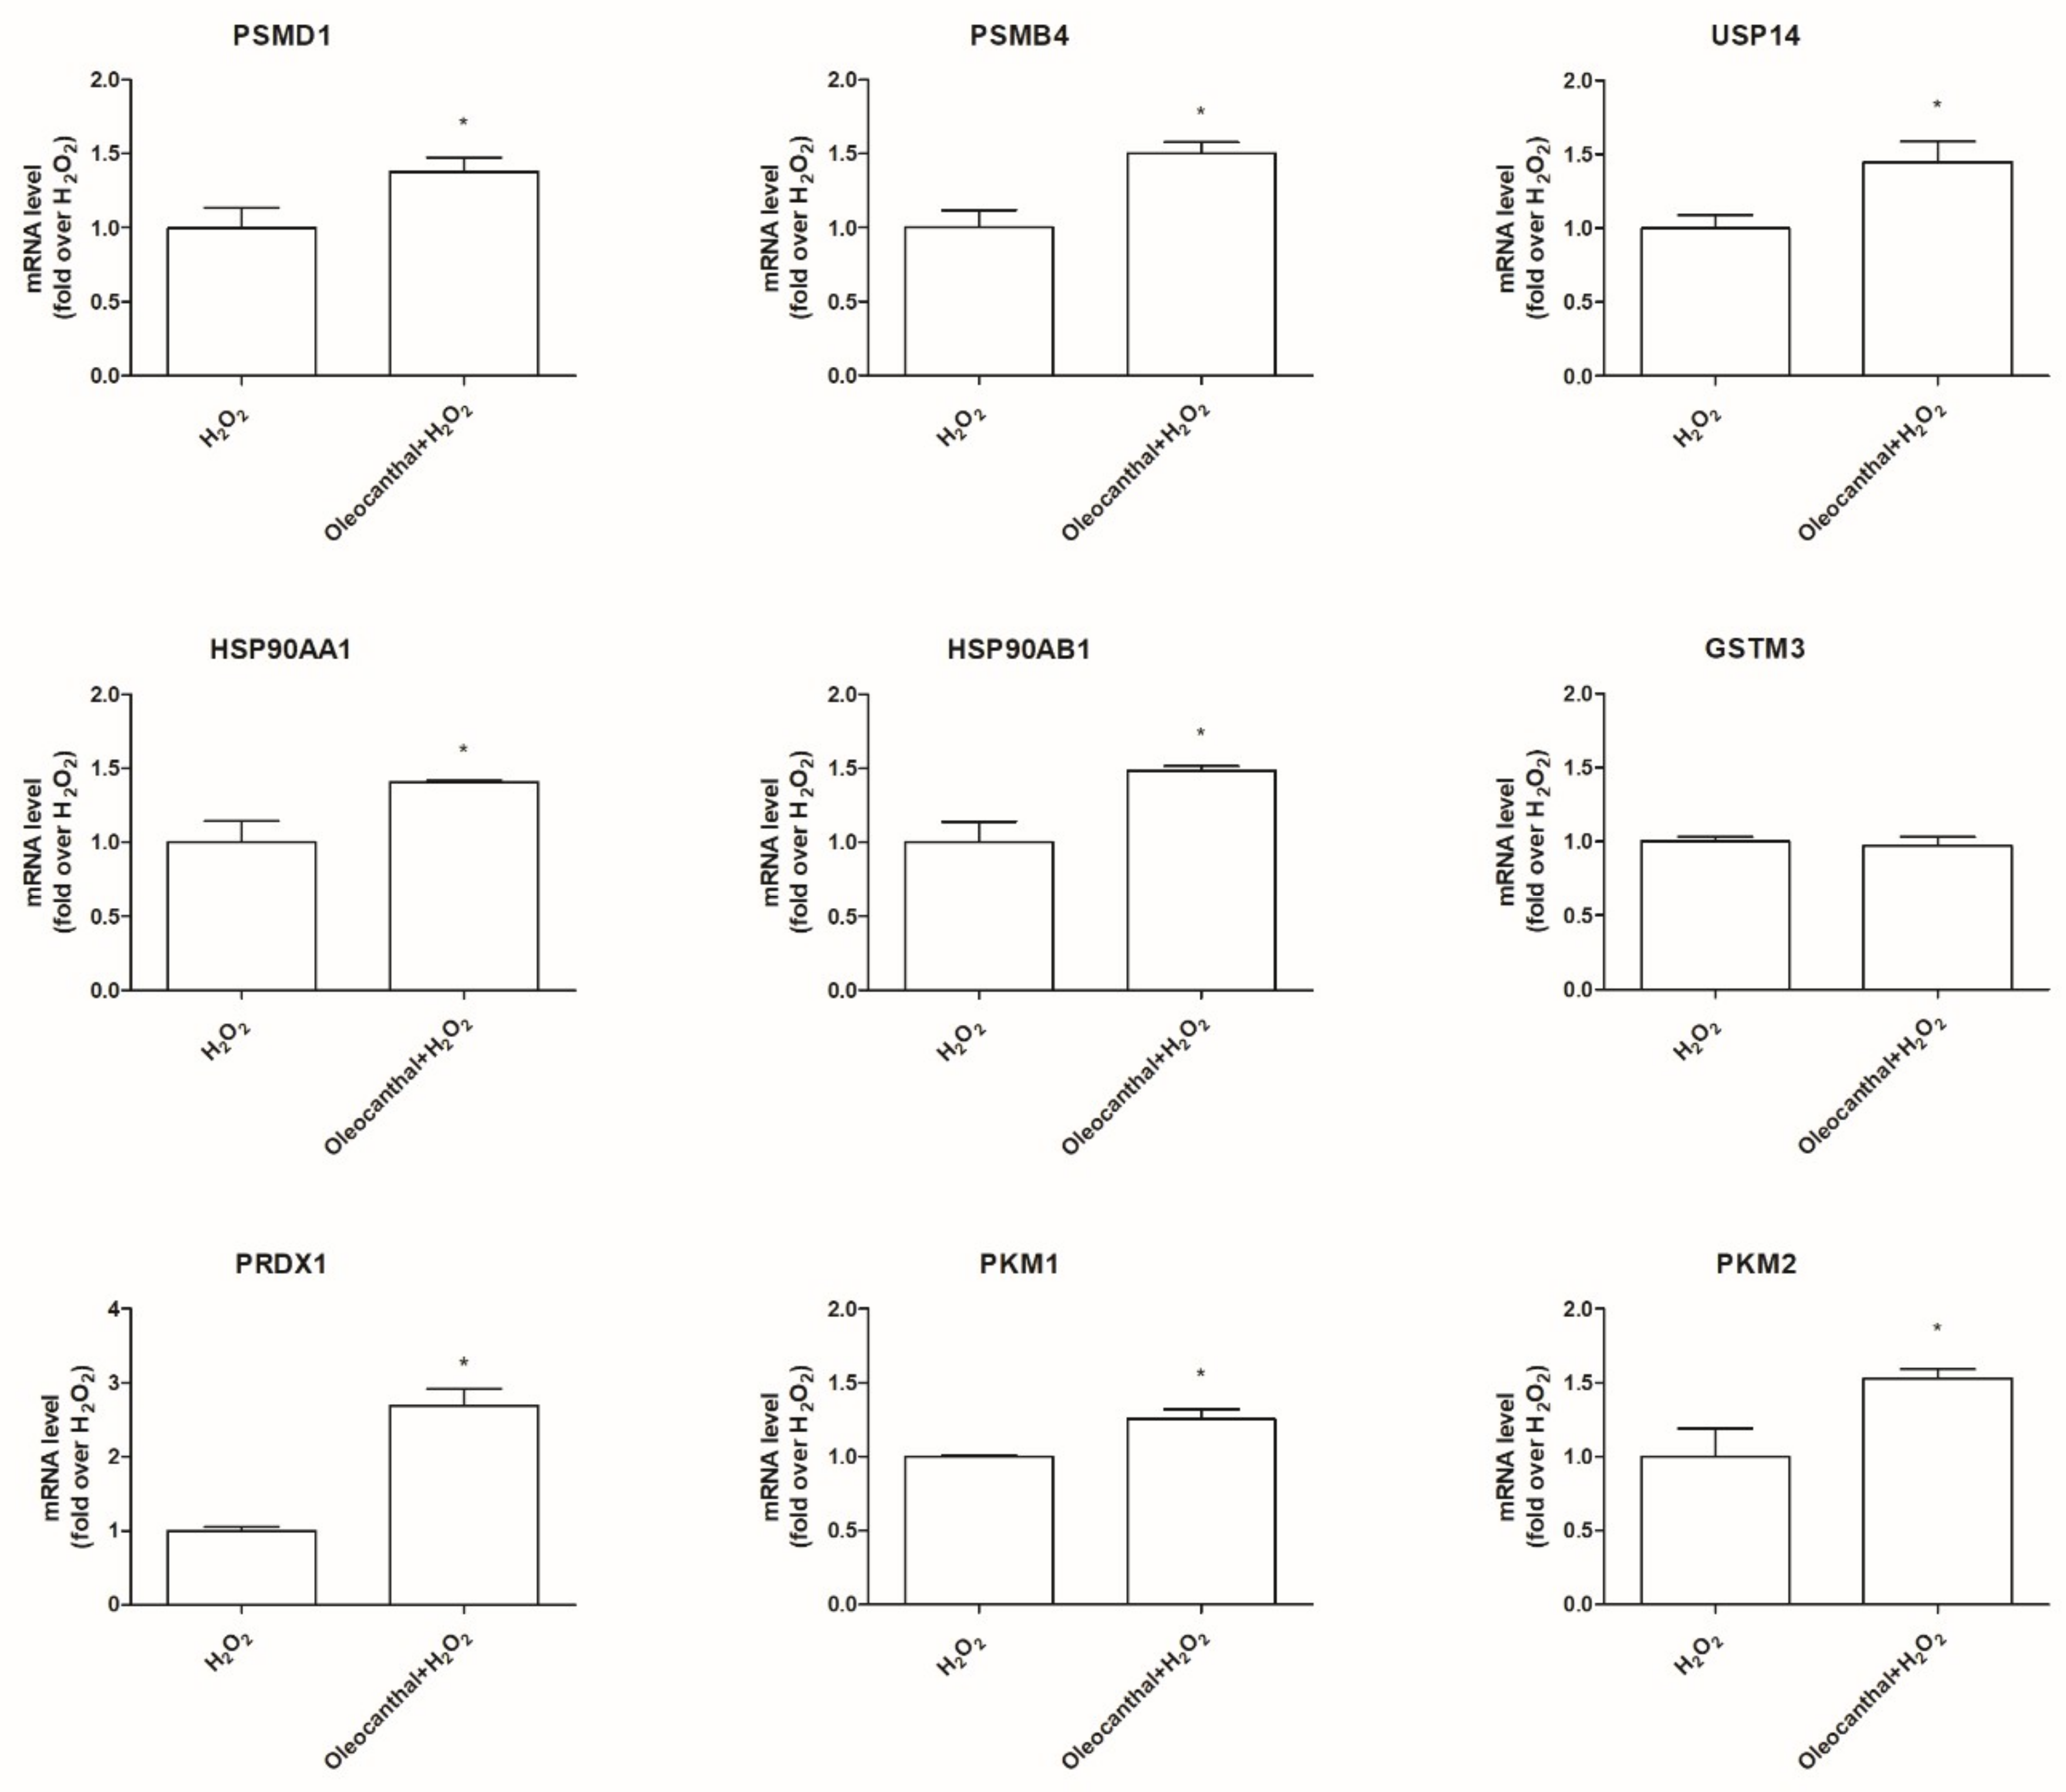
2.5. Transcriptional Validation of Proteomic Data Using RT-Polymerase Chain Reaction (PCR) Assays

We selected 9 genes encoding significantly expressed proteins for RT-PCR validation: HSP90AA1, HSP90AB1 which encode for the isoforms α and β of the heat shock protein Hsp90; PSMD1, PSMB4, and USP14 which encode for proteasome 26S subunit non-ATPase 1 (Psmd1), proteasome subunit β 4 (Psmb4), and ubiquitin carboxyl-terminal hydrolase 14 (Usp14), which are related to the proteasome activity; GSTM3 and PRDX1, which encode for the antioxidant enzymes glutathione S-transferase mu 3 (Gstm3) and peroxiredoxin 1 (Prdx1); and PKM1 and PKM2, which encode for the isoforms 1 and 2 of the glycolytic enzyme pyruvate kinase (Pkm). As shown in Figure 7, except for Gstm3, whose expression was not modulated by oleocanthal in the presence of H2O2, all the other genes were up- or down-regulated in agreement with data reported in Table 2.

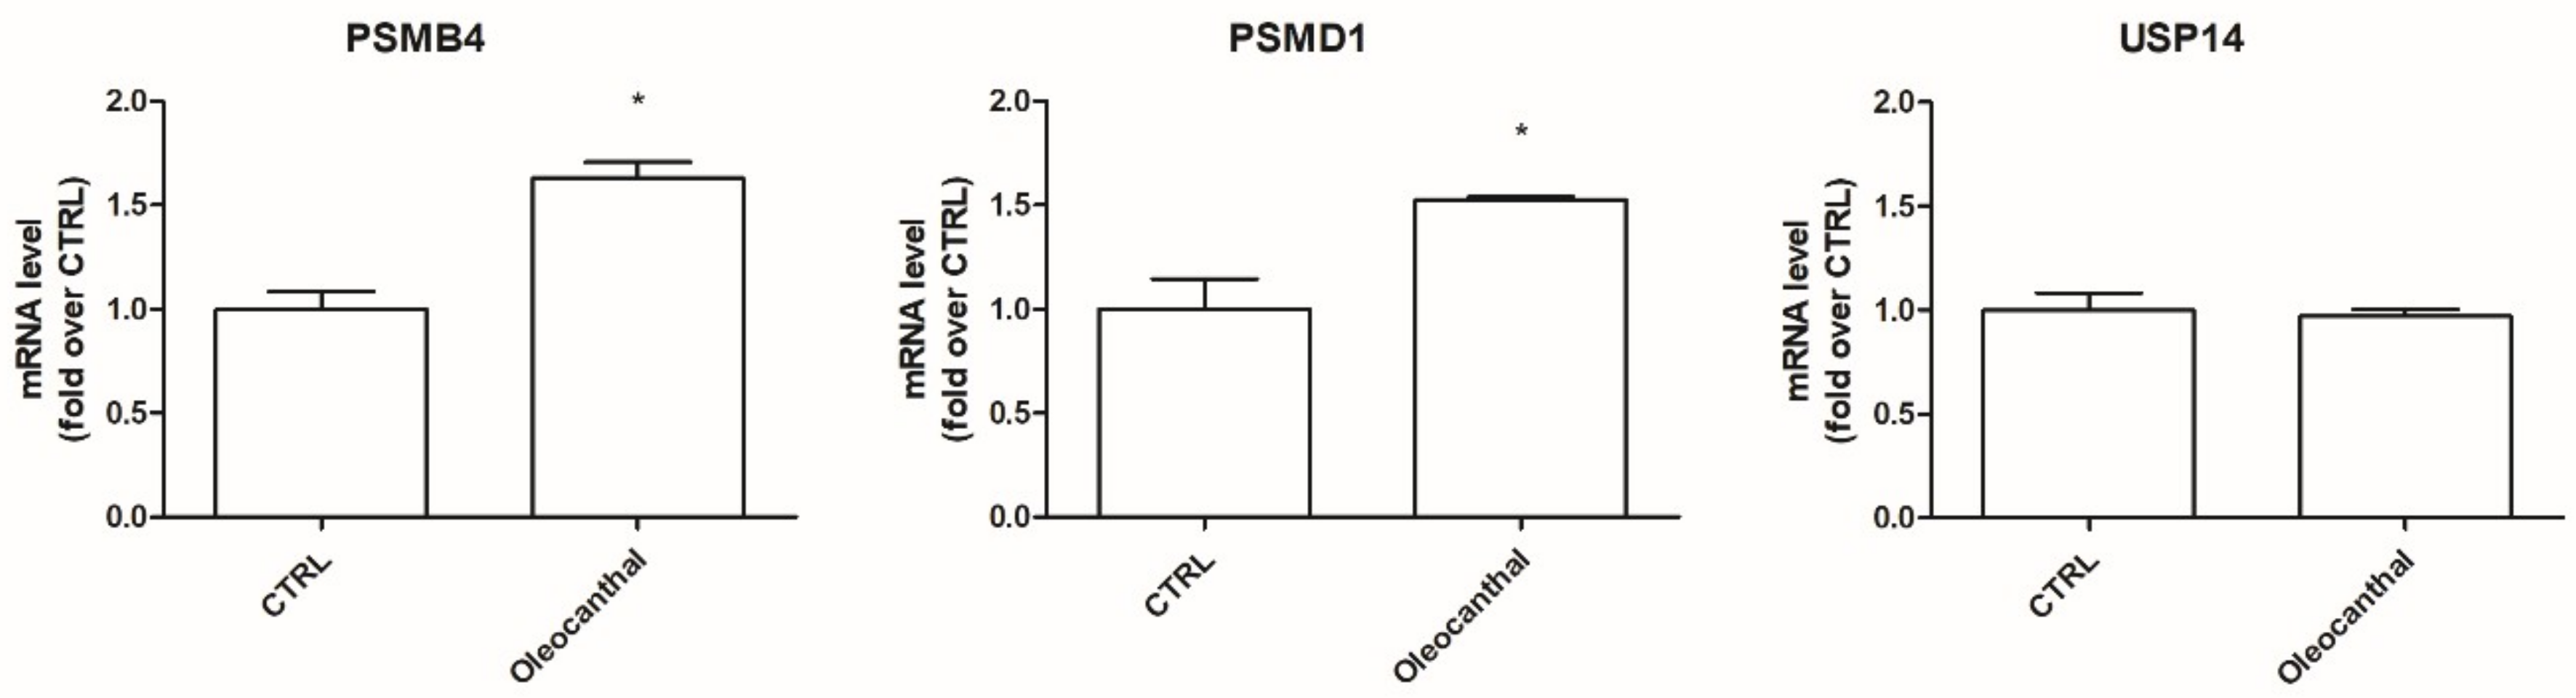
2.6. Role of Oleocanthal in the Modulation of the Ubiquitin–Proteasome System

Proteomic and RT-PCR results demonstrated that oleocanthal in the presence of peroxide is able to up-regulate two proteasomal subunits with respect to H2O2, suggesting its positive role in the degradation of misfolded and oxidized proteins; on the other hand, it up-regulates the expression of the de-ubiquitinating enzyme Usp14 that reduces the number of proteins conveyed to the proteasome. To better investigate this conflicting point, we studied the effect of oleocanthal on these three proteins in the absence of oxidative stress by RT-PCR (Figure 8). Interestingly, in the absence of oxidative stress, oleocanthal up-regulated proteasome subunits Psmb4 and Psmd1 but did not influence Usp14 expression.

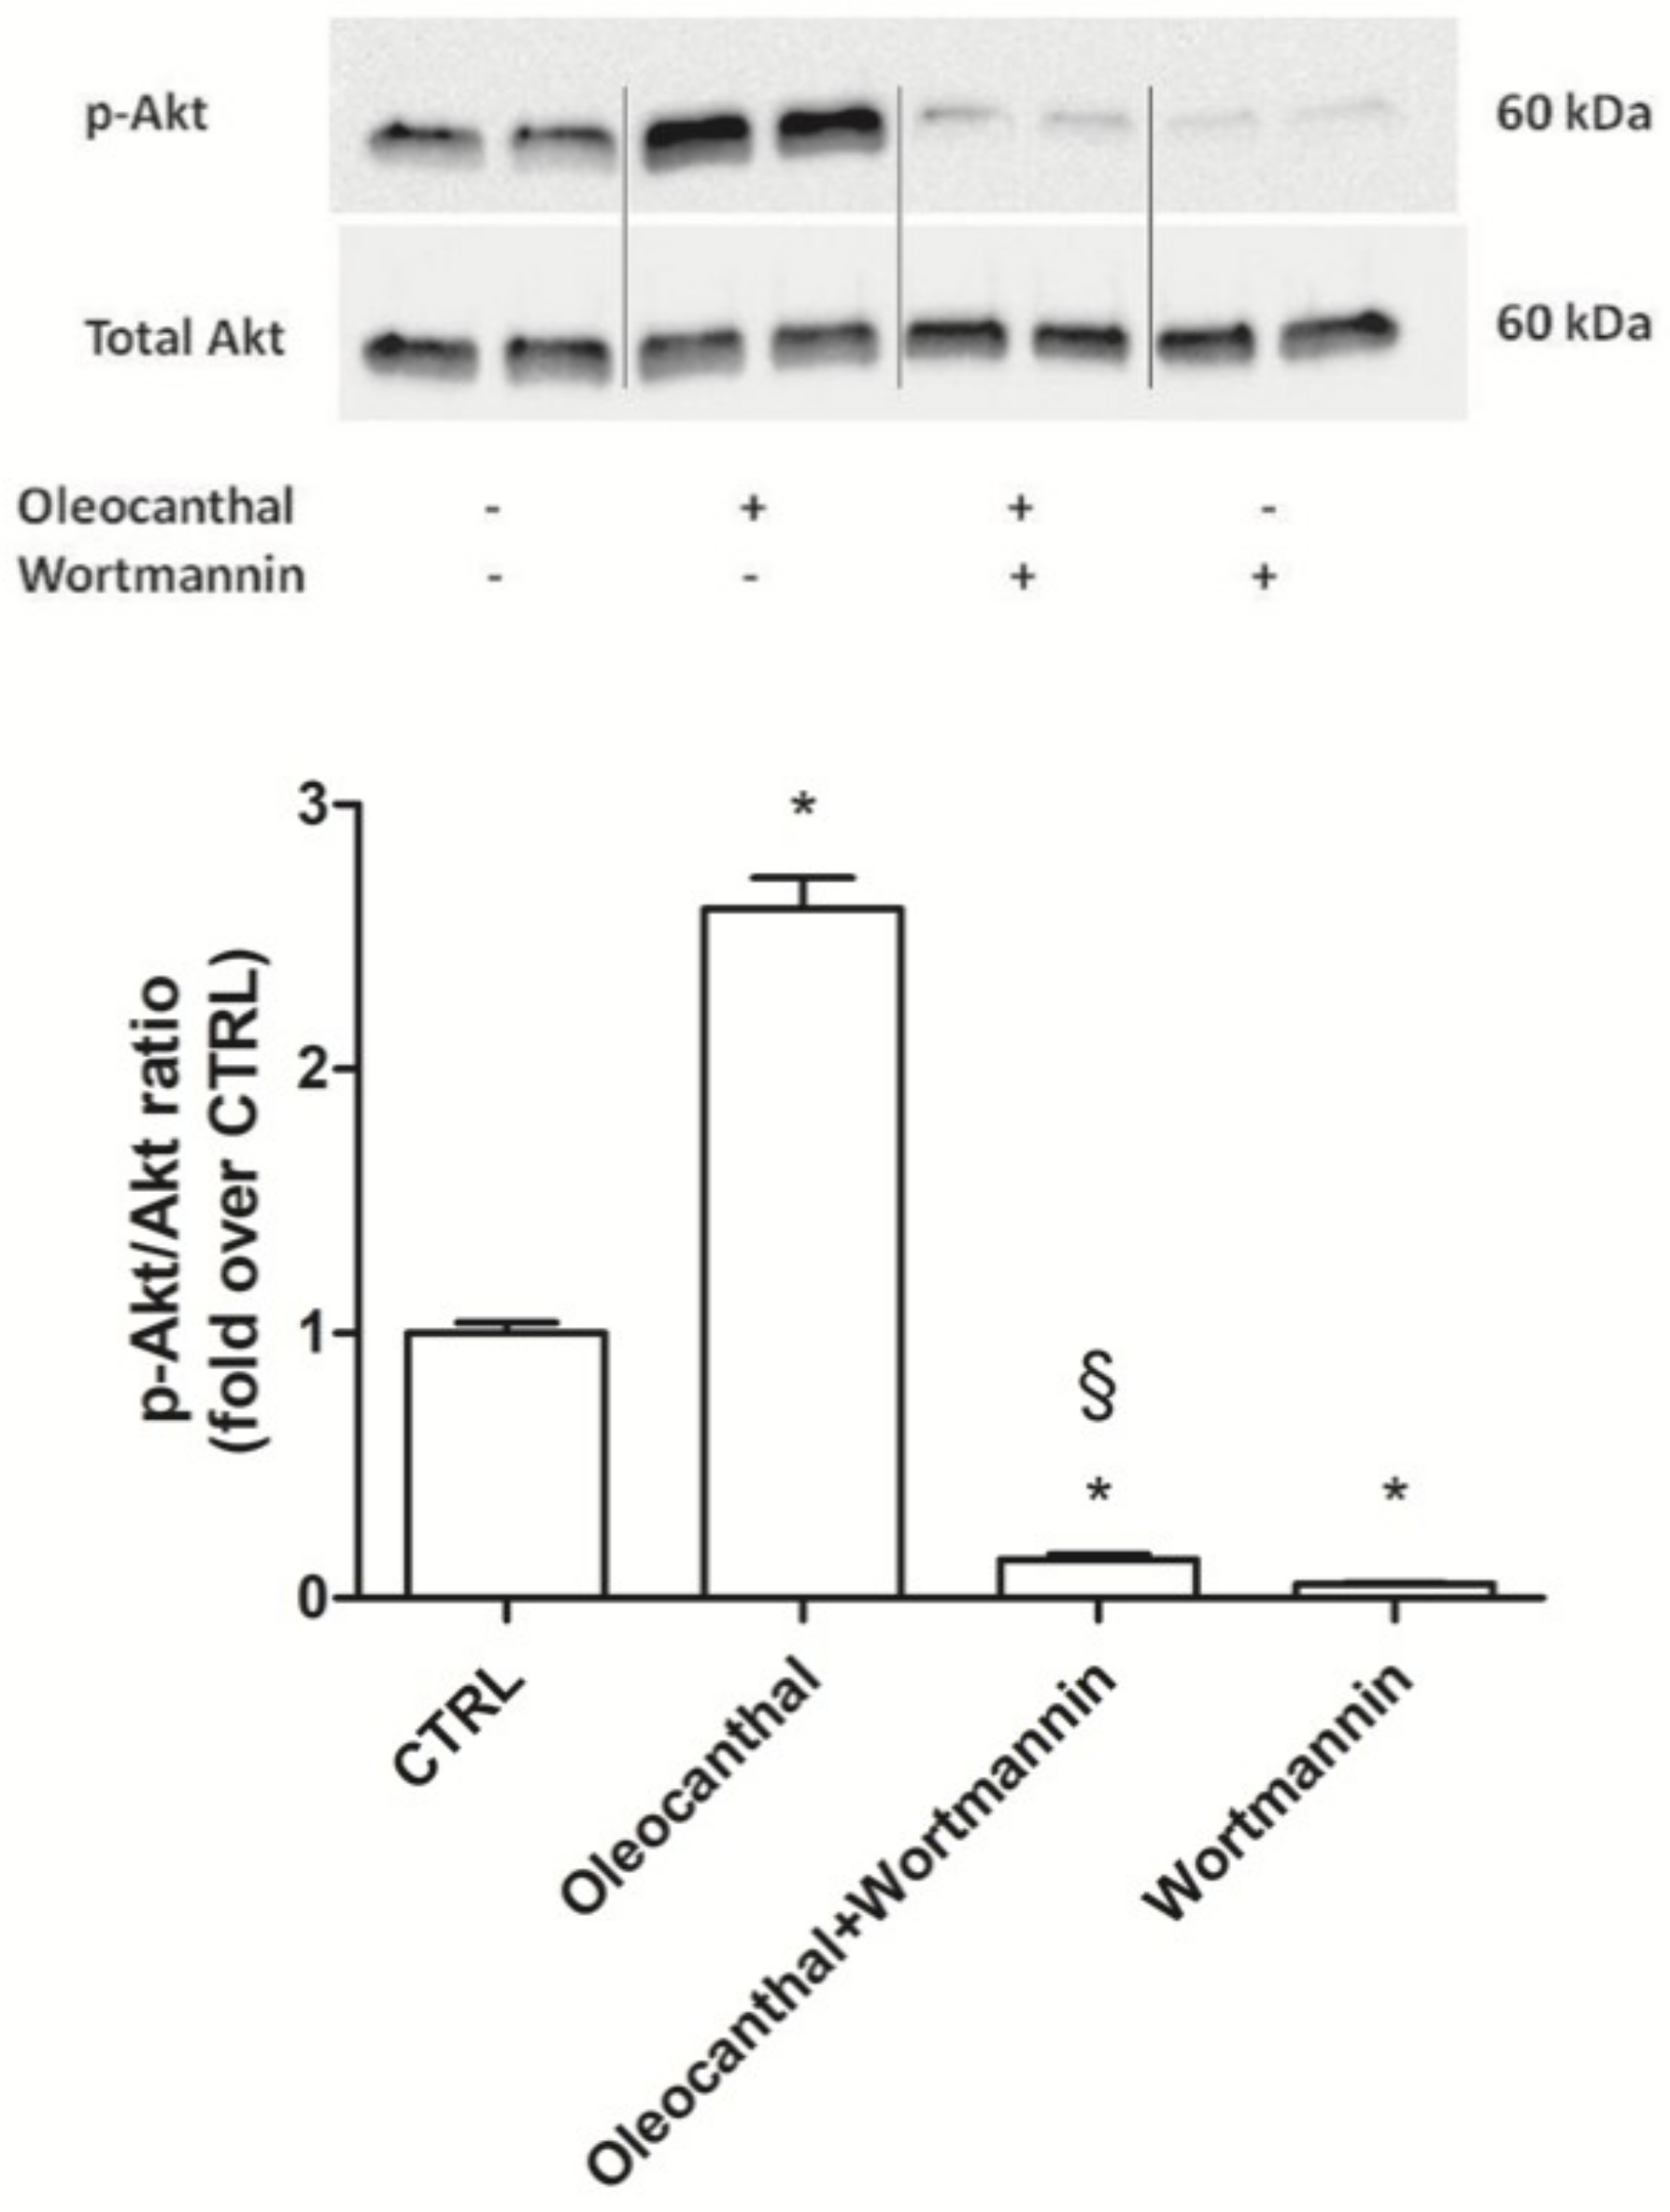
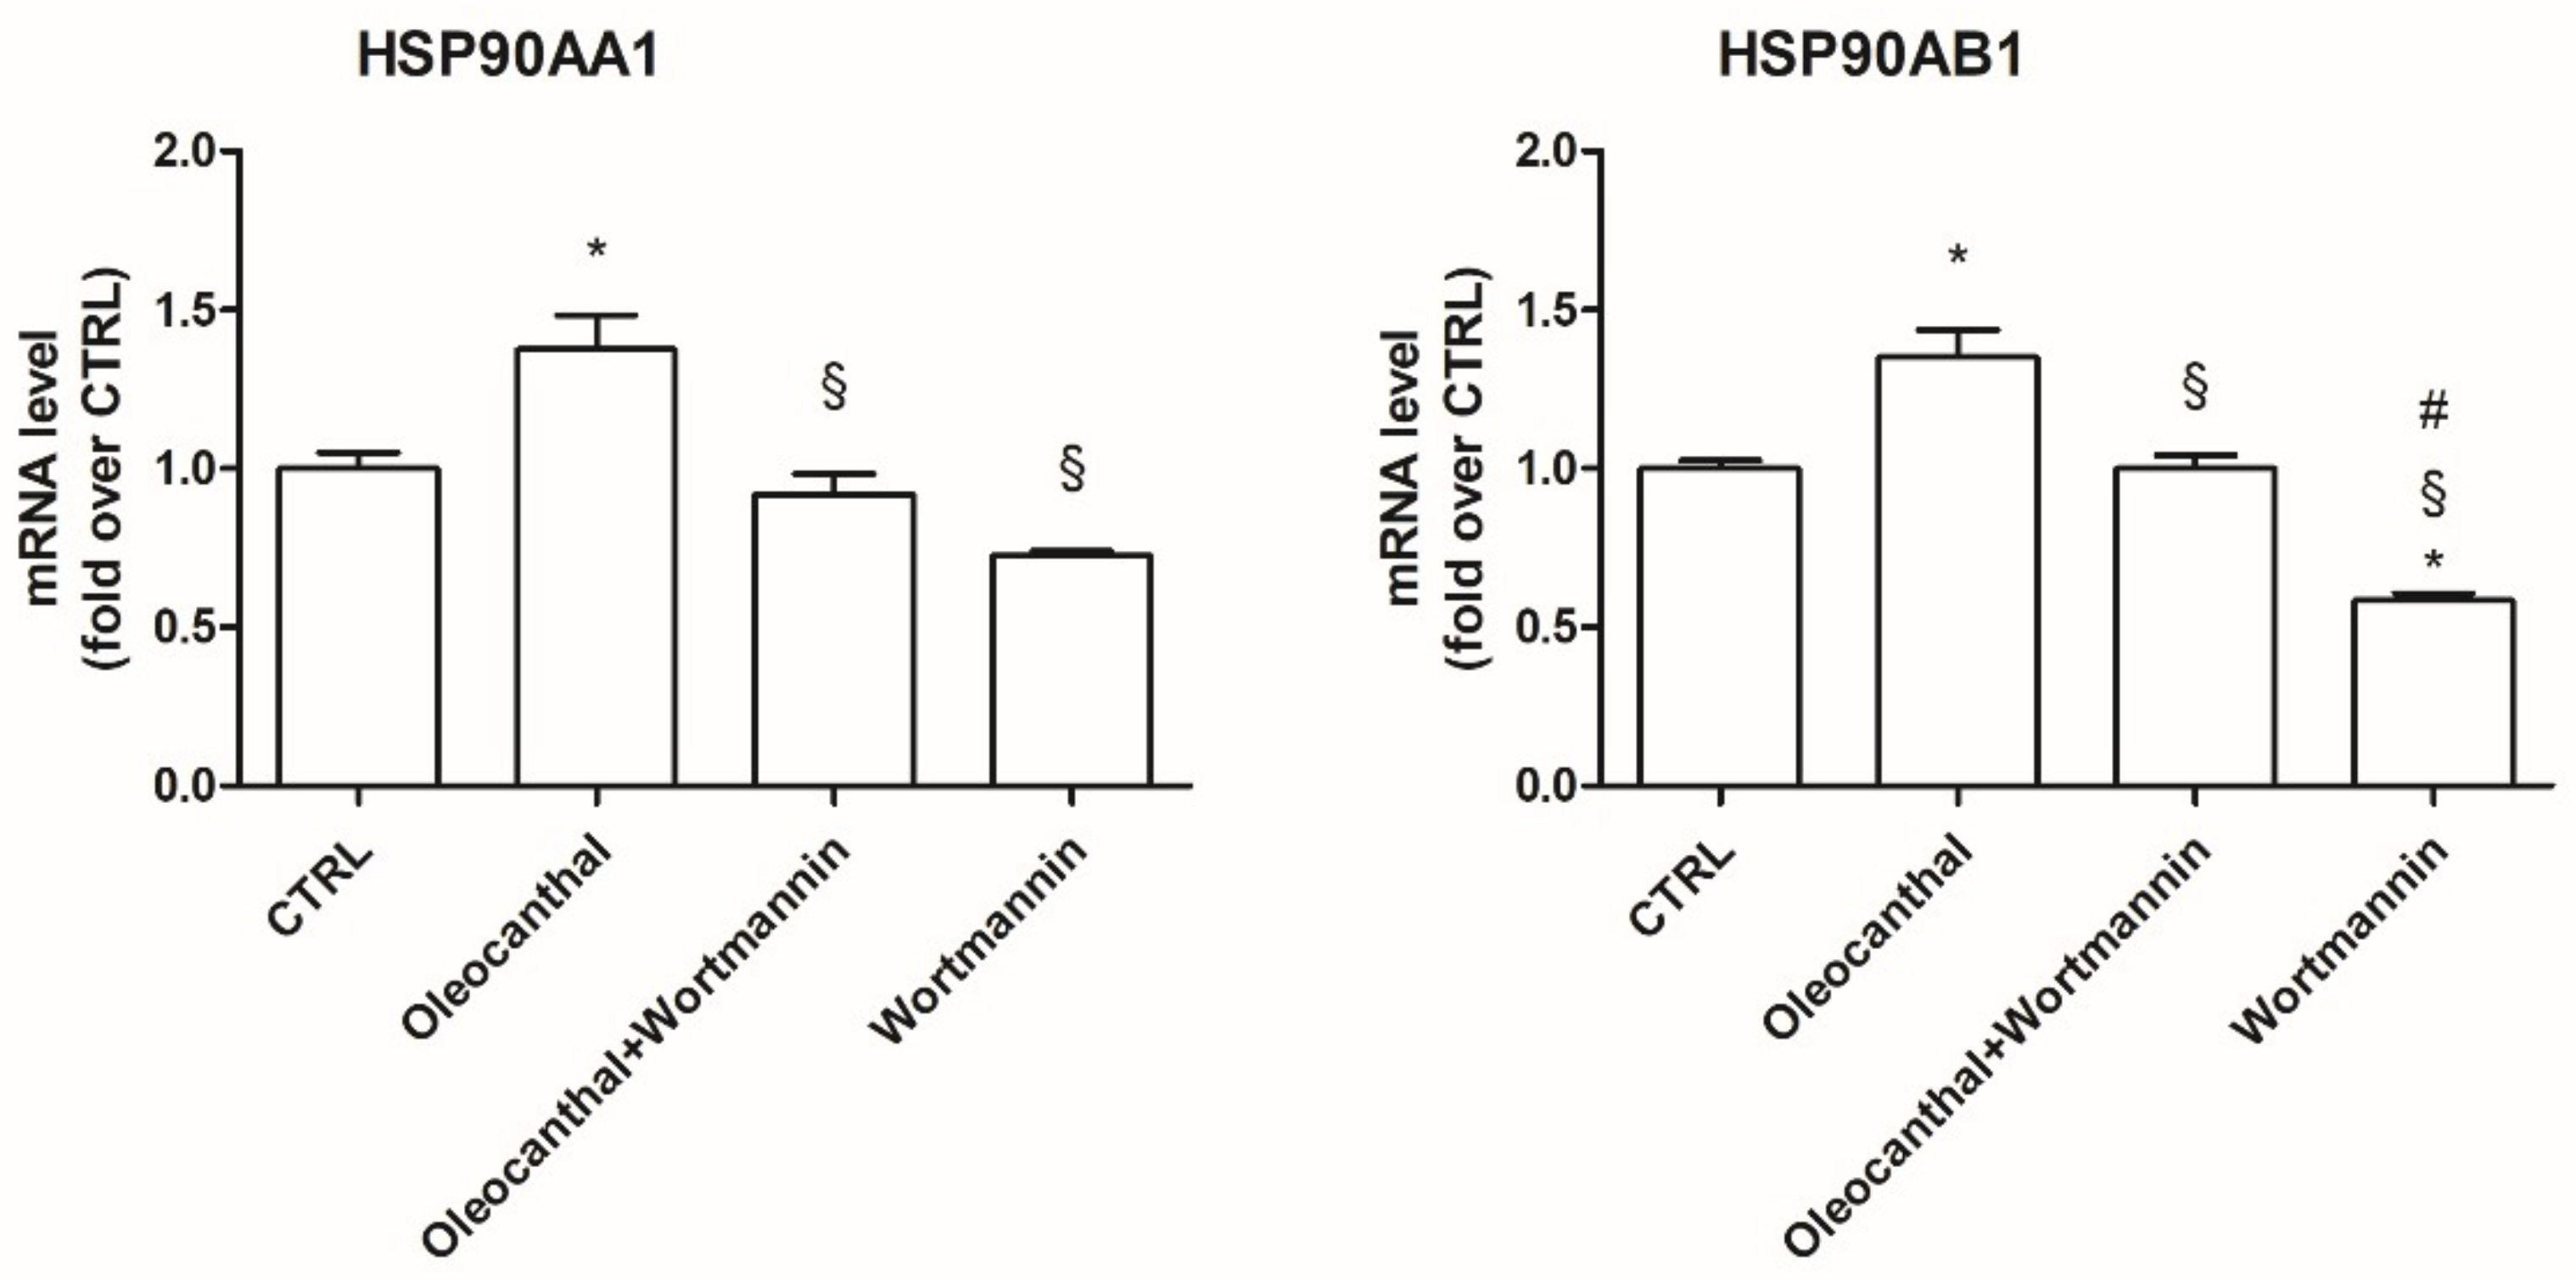
2.7. Involvement of HSP90 in Oleocanthal Protection against Oxidative Stress

As our proteomic and transcriptional data showed a marked and significant up-regulation of Hsp90α and β by oleocanthal in the presence of H2O2 with respect to H2O2 alone, we decided to investigate the role of these heat shock proteins in the observed oleocanthal protection against peroxide. A strict correlation between Akt activity and Hsp90 has been demonstrated [33], so we studied the effect of oleocanthal treatment on both Akt activation (phosphorylation) (Figure 9) and Hsp90α and β expression (Figure 10) in the absence/presence of wortmannin, which affects various signal transduction cascades by inhibiting phosphatidylinositol-3-kinases (PI3Ks), thereby blocking Akt phosphorylation. Interestingly, oleocanthal induced a strong activation of Akt (Figure 9). As expected, in the presence of wortmannin the phosphorylated form of Akt was quite undetectable. Oleocanthal treatment was able to significantly up-regulate both Hsp90 isoforms; meanwhile, wortmannin completely abrogated the up-regulation induced by oleocanthal, maintaining Hsp90α and β levels comparable to those in control cells. In order to clarify the involvement of these heat shock proteins in oleocanthal protection against oxidative stress, SH-SY5Y cells were treated with oleocanthal in the absence/presence of wortmannin and exposed to H2O2; cell viability was evaluated by MTT assay (Figure 11). Interestingly, in the presence of wortmannin, cell viability of oleocanthal-treated cells was comparable to that of H2O2-treated cells, suggesting that Hsp90 and/or Akt are essential to conferring neuroprotection against peroxide.

3. Discussion

In this study, we demonstrated that oleocanthal significantly protects differentiated human neuroblastoma SH-SY5Y cell line from oxidative stress induced by H2O2. In particular, oleocanthal reduces intracellular ROS levels and increases endogenous GSH levels. To further elucidate the mechanisms behind oleocanthal’s neuroprotective activity we used proteomic analysis that revealed an involvement of the ubiquitin–proteasome system, heat shock proteins, pyruvate kinases, and peroxiredoxin 1. Proteomic data were validated by real-time PCR analysis in order to have a complementary and wider vision of oleocanthal effect on both gene and protein expression. Since the levels of transcription of the selected genes were similar to their translation, we considered the comparable change in mRNA levels as a validation of proteomic data. A fundamental issue in the study of nutraceutical compounds is their bioavailability. The pharmacokinetics and bioavailability of oleocanthal have been poorly investigated. Under simulated gastric acid conditions, it has been shown that oleocanthal is stable in acidic conditions at 37 °C and almost half of the oleocanthal diffused from the oil phase into the aqueous solution [34]. Only one study has investigated the bioavailability of oleocanthal by identifying oleocanthal and its metabolites in urines, demonstrating oleocanthal metabolism in the human body [35]. Oleocanthal is mainly metabolized through phase I metabolism, like hydroxylation, hydrogenation, and hydration. Some of the hydrogenated oleocanthal metabolites are further metabolized through phase II metabolism [35]. Even if no studies directly examined the blood–brain barrier (BBB) permeability of oleocanthal, different studies indirectly demonstrated its ability to reach the brain. In particular, Qosa et al. reported a decreased amyloid load in the hippocampus of TgSwDI mice after oleocanthal treatment [21]; meanwhile, in C57BL/6 mice, Abuznait et al. demonstrated that oleocanthal induces P-gp and LRP1, which are responsible for Aβ clearance across the BBB, and increases Aβ degradation by up-regulating Aβ-degrading enzymes [25], strongly suggesting its ability to reach the brain.
The ubiquitin–proteasome system is the main proteolytic complex responsible for the removal of misfolded and damaged intracellular proteins, often produced upon oxidative stress [36]. The proteasome is a non-lysosomal threonine protease [37] that degrades both normal and damaged proteins into short peptides by the internal protease activities [38,39]. It has been observed that the impairment of the ubiquitin–proteasome system is implicated in the pathogenesis of many neurodegenerative diseases [40] like Alzheimer’s disease, Parkinson’s disease, Lewy body dementia, Pick disease, frontotemporal dementia, and Huntington’s disease (HD) [41]. On these bases, the induction of the proteasome system has been emerging as a therapeutic target to counteract these diseases. To our best knowledge, no studies have explored the effect of oleocanthal on the ubiquitin–proteasome system upon oxidative stress. Interestingly, our proteomic data, obtained in the presence of oxidative stress, indicate the up-regulation of two proteasome subunits, namely, the 26S proteasome non-ATPase regulatory subunit and the proteasome subunit β type-4, and the up-regulation of the ubiquitin carboxyl-terminal hydrolases 14 (Usp14). As Usp14 negatively regulates proteasome activity by ubiquitin chain disassembly as well as by a noncatalytic mechanism [42], oleocanthal, in the presence of oxidative stress, has two opposite effects: on one side, it up-regulates the proteasome and, on the other side, it up-regulates Usp14, abrogating the suggested enhancement of the proteasome activity. For this reason, we examined the effect of oleocanthal in the absence of oxidative stress by real-time PCR. Intriguingly, in normal conditions, oleocanthal is able to induce proteasome activity as it up-regulates proteasome subunits Psmd1 and Psmb4 and does not affect Usp14 expression, suggesting that oleocanthal could have a role in the degradation of misfolded proteins rather than in the degradation of oxidized ones. Our observations are in agreement with different studies that demonstrated that oleocanthal counteracts neurodegenerative diseases by enhancing the clearance of misfolded proteins like amyloid-β, phosphorylated tau, and α-synuclein [27,43,44].
Hsp90 is a chaperone protein important for maintaining stability, maturation, and signaling of Hsp90 client proteins [45]. It has been demonstrated that Hsp90 maintains cell proliferation and cell survival by different mechanisms. Hsp90 may inhibit apoptosis by binding to apoptotic peptidase-activating factor 1, resulting in the prevention of apoptosome formation, caspase activation, and apoptotic cell death [46]. In addition, Taiyab et al. showed that inhibition of Hsp90 results in ER stress-induced apoptosis in rat histiocytoma [47]. A strict correlation between Hsp90 and Akt has been demonstrated [33], as the inhibition of the binding of Akt to Hsp90 inactivates Akt and makes cells more susceptible to apoptosis-inducing stimuli [48]. Interestingly, Xie et al. observed that the inhibition of Akt activity led to a reduction of Hsp90 level, suggesting that Akt activation can elevate Hsp90 protein levels [49]. Our data demonstrated that oleocanthal, upon oxidative stress, is able to up-regulate Hsp90. As Hsp90 acts with Akt, we also evaluated the effect of oleocanthal treatment on Akt activation (phosphorylation). As expected, we measured a strong and significative activation of Akt. Moreover, Akt inhibition by wortmannin led to the inhibition of the up-regulation of Hsp90 induced by oleocanthal, in agreement with the previous observation by Xie et al. Of note, the fact that wortmannin totally abrogated oleocanthal protection against oxidative stress suggests a fundamental role of Akt and/or Hsp90 in the protective mechanisms elicited by oleocanthal against oxidative stress in SH-SY5Y neuronal cells. As wortmannin can affect other signaling cascades apart from Akt, we could not exclude that oleocanthal regulates neuroprotective effects through other signaling pathways. Further studies are necessary to fully elucidate this aspect.
Our proteomic and expression data indicated a significative up-regulation of Pkm1 and Pkm2 by oleocanthal in the presence of oxidative stress. Pyruvate kinase, catalyzing the final rate-limiting step in glycolysis, is a crucial enzyme for glucose metabolism and energy production in the brain. Elevated levels of pyruvate kinase have been suggested to be protective in neurodegeneration as decreased aerobic glycolysis in the brain leads to a loss of cell survival mechanisms that counter pathogenic processes underlying neurodegeneration [50]. Moreover, Luo et al. demonstrated that Pkm hinders the Aβ fibrillation and reduces the toxicity of Aβ aggregates in SH-SY5Y cells, suggesting that Pkm interferes with the stability of the Aβ oligomer by hydrophobic and hydrophilic interactions of its surface [51].
Oleocanthal also induced a strong up-regulation of the antioxidant enzyme Prdx1 in the presence of H2O2, as indicated by our proteomic and expression results. Peroxiredoxins play an important role in cell proliferation, redox signaling, differentiation, and gene expression [52,53]. In particular, Prdx1 eliminates hydrogen peroxide produced during cellular metabolism [54] and participates in cell survival by enhancing the expression of the pro-survival factor protein kinase B (PKB) [55]. The role of Prdx1 in AD has been recently highlighted by Majd et al. who observed reduced levels of Prdx1 and 2 in postmortem brains of AD [56]; meanwhile, Schreibelt et al. analyzed the functional role of Prdx1 using a brain endothelial cell line overexpressing Prdx1 and showed that enhanced Prdx1 expression in brain endothelial cells increased BBB integrity and reduced monocyte adhesion to and migration across a brain endothelial cell layer [57].
Focusing on proteomic results, the quantitative two-dimensional analysis showed that the insult induced by peroxide induced a significantly different expression of four Prdx in the human neuroblastoma SH-SY5Y cell line. Interestingly, two near spots, different for the pI value and for level of expression, were detected for PRDX1, 2, and 6 in our samples, suggesting the presence of post-translational modification. Post-translational modification and intracellular protein–protein interactions have the potential to influence Prdx catalytic activity and susceptibility to hyperoxidation [58]. We found for all three Prdx an increase of expression of more acidic spots and a significant reduction of more basic spots in the H2O2 sample with respect to the control. The protective effect of oleocanthal takes place by way of an increase of more acidic spots of Prx1. The nature of this modification needs to be investigated and underlines a mechanism of control of protein activity.
Finally, all proteins found differentially expressed from a comparison of oleocanthal + H2O2 vs. H2O2 were analyzed by IPA to explore in depth the network, functions, and molecules (e.g., upstream regulators) that could play a role in the protection induced by oleocanthal. The molecular functions defined by our differentially expressed proteins were well arranged in protein synthesis, cell death and survival, protein degradation, and cellular function and maintenance. On the other hand, the up-regulation of heat shock protein and proteasome members in addition to ubiquitin enzymes and pyruvate kinase concurred to predict cellular viability and vitality (Figure 12). As concerns upstream regulators, intriguing results arose from the IPA analysis. Along the list of noteworthy potential activated or inhibited upstreams were NFE2L2, HSF1, and ATF7.
NFE2L2, which encodes for the transcription factor Nrf2, is important for the coordinated up-regulation of genes in response to oxidative stress. Very recent studies showed neuroprotective actions [59,60] through the activation of Akt/Nrf2/antioxidant enzymes in neuronal cells. On the other hand, the significant up-regulation of the active form of Akt that we found in our results agrees with an activation state of Nrf2.
HSF1 works as a stress-inducible and DNA-binding transcription factor that plays a central role in the transcriptional activation of the heat shock response, leading to the expression of a large number of chaperone heat shock proteins. A central role of HSF1 in synaptic fidelity and memory consolidation has been recently suggested by Hooper and coworkers [61] who showed that the activation of HSF1 alone augmented vesicle transport and synaptic scaffolding proteins. Meanwhile, HSF1 agonists can improve cognitive function in dementia models and activation of neuroprotective signaling pathways. Finally, HSF1 protected neurons from death caused by accumulation of misfolded proteins. This neuroprotection result was abrogated by inhibition of classical deacetylases such as SIRT1 [62].
As concerns ATG7 (autophagy-related 7), a predicted inhibition was advanced by IPA analysis. ATG7 is an E1-like activating enzyme involved in the 2-ubiquitin-like systems required for cytoplasm-to-vacuole transport and autophagy. Recent findings reveal that selective neuronal deletion of ATG7 is strongly protective against neuronal death and overall brain hypoxic–ischemic injury [63].
Overall, our results, combined with IPA analysis, suggest that the major part of protein targets of oleocanthal in response to peroxide insult belongs to the proteostasis network including proteasome, ubiquitin, and chaperone proteins which move to restore equilibrium between protein synthesis, folding, trafficking, secretion, and degradation in different cell compartments. Moreover, our findings add new evidence on the effects of oleocanthal on heat shock protein 90, Pkm1 and 2, and Prdx1.

4. Materials and Methods

4.1. Materials

MTT, DCFH-DA, H2O2, dimethyl sulfoxide (DMSO), MCB, Phosphate-Buffered Saline (PBS), bovine serum albumin (BSA) Dulbecco’s modified Eagle’s medium (DMEM), fetal bovine serum (FBS), penicillin/streptomycin, wortmannin, primers listed in Table 5, mammalian protease inhibitor mixture, radioimmunoprecipitation assay (RIPA) buffer, all trans retinoic acid (RA), and all other chemicals of the highest analytical grade were purchased from Sigma Chemical (St. Louis, MO, USA). PhosSTOP was purchased from Roche Diagnostics (Mannheim, Germany).

4.2. Cell Culture and Treatments

The SH-SY5Y human neuroblastoma cell line was obtained from Sigma-Aldrich (Milan, Italy). Cells were grown in DMEM supplemented with 10% (v/v) of FBS, 2 mM glutamine, 50 U/mL of penicillin, and 50 μg/mL of streptomycin and maintained at 37 °C in a humidified incubator with 5% CO2 as previously reported [64]. Cell differentiation was induced, reducing serum levels of the medium to 1% with 10 µM of RA for seven days prior to treatments. Differentiated SH-SY5Y were treated with oleocanthal for 1 or 24 h. Oleocanthal was dissolved in DMSO and kept at −20 °C until use. The control group was treated with an equivalent volume of the vehicle alone. Oxidative stress was induced by exposing cells to 700 µM H2O2.

4.3. MTT Assay

Cells were treated with different concentrations of oleocanthal (1–10 µM) for 24 h prior to induction of oxidative stress. Cell viability was evaluated by measuring formazan formation as previously reported [64,65]. Briefly, after treatments, cells were incubated with 0.5 mg/mL of MTT solution for 1 h at 37 °C. After incubation, MTT was removed and 100 µL of DMSO were added, and the absorbance was recorded at λ = 595 nm using a microplate spectrophotometer (VICTOR3 V Multilabel Counter; PerkinElmer, Wellesley, MA, USA).

4.4. Intracellular ROS Production Assay

The production of intracellular reactive oxygen species was evaluated using the fluorescent probe DCFH-DA as reported in [66]. Briefly, differentiated SH-SY5Y were treated with oleocanthal for 24 h and then incubated with 10 µM DCFH-DA in DMEM w/o FBS for 30 min. After DCFH-DA removal, cells were incubated with H2O2 for 30 min. Cells were washed with PBS and the fluorescence was measured using 485 nm excitation and 535 nm emission with a microplate spectrofluorometer (VICTOR3 V Multilabel Counter, PerkinElmer, Wellesley, MA, USA).

4.5. Intracellular GSH Levels Assay

The levels of reduced glutathione (GSH) were evaluated by a fluorometric assay, using the fluorescent probe MCB [64,67]. Briefly, differentiated SH-SY5Y pretreated with oleocanthal were exposed to H2O2 for 1 h and incubated with 50 µM MCB in serum-free medium for 30 min at 37 °C. After incubation, cells were washed in PBS and the fluorescence was measured at 355 nm (excitation) and 460 nm (emission) with a microplate spectrofluorometer (VICTOR3 V Multilabel Counter; PerkinElmer, Wellesley, MA, USA).

4.6. RNA Extraction

Total RNA was extracted using an RNeasy Mini Kit (QIAGEN GmbH, Hilden, Germany), following the manufacturer’s protocol. The yield and purity of the RNA were measured using a NanoVue Spectrophotometer (GE Healthcare, Milano, Italy).

4.7. Analysis of mRNA Levels by Reverse Transcriptase Polymerase Chain Reaction

cDNA was obtained by reverse transcribing mRNA starting from 1 μg of total RNA using an iScript cDNA Synthesis Kit (BIO-RAD, Hercules, CA, USA), following the manufacturer’s protocol. The subsequent polymerase chain reaction (PCR) was performed in a total volume of 10 μL containing 2.5 μL (12.5 ng) of cDNA, 5 μL SsoAdvanced Universal SYBR Green Supermix (BIO-RAD), and 0.5 μL (500 nM) of each primer. The primers used are reported in Table 5; 18S rRNA was used as reference gene.

4.8. Western Blotting

After treatments, differentiated SH-SY5Y were collected and homogenized in RIPA buffer with a mammalian protease inhibitor mixture and PhosSTOP. Samples were boiled for 5 min prior to separation on 10% MiniPROTEAN TGX Precast Protein Gels (BIO-RAD, Hercules, CA, USA). The proteins were transferred to a nitrocellulose membrane (Hybond-C; GE Healthcare, Buckinghamshire, UK) in Tris-glycine buffer at 110 V for 90 min. Membranes were then incubated in a blocking buffer containing 5% (w/v) skimmed milk and incubated with anti-phospho-Akt, anti-Akt (Cell Signaling Technology, Beverly, MA, USA), and anti-β-actin (Sigma-Aldrich), which was used as internal normalizer, overnight at 4 °C on a three-dimensional rocking table. The results were visualized by chemiluminescence using Clarity Western Enhanced Chemiluminescence (ECL) reagent according to the manufacturer’s protocol (BIO-RAD). Semiquantitative analysis of specific immuno-labeled bands was performed using ImageLabTM 5.2 Software (BIO-RAD).

4.9. Sample Preparation for Proteomic Analysis

For proteomic analysis, differentiated SH-SY5Y cells (about 7 × 10⁵ cells) were treated with oleocanthal or H2O2, or with both for 24 h as described above. At the end of treatment, cells were collected and washed with PBS. After centrifugation (1000× g for 5 min), the resulting pellets were immediately frozen and stored at −80 °C until use. For proteomic studies, each condition was performed in triplicate.

4.10. 2DE Analysis

Cell pellets were resuspended in rehydration solution [68], and protein contents of resulting protein extracts were measured with an RC-DC Protein Assay from Bio-Rad.
2DE was carried out as previously described [69]. Briefly, 200 µg of proteins were filled up to 450 μl in rehydration solution. Immobiline Dry-Strips (GE Health Care Europe; Uppsala, Sweden); 18 cm, nonlinear gradient pH 3–10) were rehydrated overnight in the sample and then transferred to the Ettan IPGphor Cup Loading Manifold (GE Healthcare) for isoelectrofocusing (IEF). The second dimension (Sodium Dodecyl Sulphate-Polyacrylamide Gel Electrophoresis; SDS-PAGE) was carried out by transferring the proteins to 12% polyacrylamide, running at 16 mA per gel and 10 °C for about 16 h, using the Protean® Plus Dodeca Cell (Bio-Rad). The gels were stained with Ruthenium II tris (bathophenanthroline disulfonate) tetrasodium salt (SunaTech Inc., Suzhou, China) (RuBP). ImageQuant LAS4010 (GE Health Care) was used for the acquisition of images. The analysis of images was performed using Same Spot (v4.1, TotalLab, Newcastle Upon Tyne, UK) software. The spot volume ratios between the four different conditions were calculated using the average spot normalized volume of the three biological replicates performed in duplicate. The software included statistical analysis calculations.

4.11. 2DE Statistical Analysis

A comparison among the different treatments was performed. The significance of the differences of normalized volume for each spot was calculated by the software Same Spot including the analysis of variance (ANOVA test). The protein spots of interest were cut out from the gel and identified by LC-MS analysis.

4.12. Spot Digestion and Protein Identification

The gel pieces were washed twice with the wash buffer (25 mM NH4HCO3 in 50% acetonitrile (ACN)). Afterwards, proteins were reduced with 10 mM ditiothreitol (DTT) (45 min, 56 °C), and alkylated with 55 mM iodoacetamide (IAA) (30 min, RT, in the dark). After two washes with the wash buffer, spots were completely dried in a centrivap vacuum centrifuge. The dried pieces of gel were rehydrated for 30 min at 4 °C in 30 μL of trypsin porcine (Promega, Madison, WI, USA) solution (3 ng/μL in 100 mM NH4HCO3) and then incubated at 37 °C overnight. The reaction was stopped by adding 10% trifluoroacetic acid (TFA). Samples were analyzed by LC-MS as described [70] using a shorter chromatographic gradient and in autoMS mode. Each digested spot sample was analyzed by LC-MS/MS using a Proxeon EASY-nLCII (Thermo Fisher Scientific, Milan, Italy) chromatographic system coupled to a Maxis HD UHR-TOF (Bruker Daltonics GmbH, Bremen, Germany) mass spectrometer. Peptides were loaded on the EASY-Column TM C18 trapping column (2 cm L., 100 µm I.D, 5 µm ps, Thermo Fisher Scientific), and subsequently separated on an Acclaim PepMap100 C18 (75 µm I.D., 25 cm L, 5 µm ps, Thermo Fisher Scientific) nanoscale chromatographic column. The flow rate was set to 300 nL/min and the gradient was from 2% to 20% of B in 12 min followed by 20 to 45% in 9 min and from 45% to 90% in 2 min (total run time 35 min). Mobile phase A was 0.1% formic acid in H2O and mobile phase B was 0.1% formic acid in acetonitrile. The mass spectrometer, typically providing a 60,000 full width at half maximum (FMHW) resolution throughout the mass range, was equipped with a nanoESI spray source. The mass spectrometer was operated in Data Dependent Acquisition mode (DDA), using N2 as the collision gas for collision-induced dissociation (CID) fragmentation. Precursors in the range 400 to 2200 m/z (excluding 1220.0–1224.5 m/z) with a preferred charge state +2 to +5 and absolute intensity above 4706 counts were selected for fragmentation in a fixed cycle time of 3 s. After two spectra, the precursors were actively excluded from selection for 36 s. Isolation width and collision energy for MS/MS fragmentation were set according to the mass and charge state of the precursor ions (from 2+ to 5+ and from 21 to 55 eV). In-source reference lock mass (1221.9906 m/z) was acquired online throughout runs.
The raw data were processed using PEAKS Studio v7.5 software (Bioinformatic Solutions Inc., Waterloo, ON, Canada) using the function “correct precursor only”. The mass lists were searched against the nextprot database including isoforms (version as of June 2017; 42,151 entries) using 10 ppm and 0.05 Da as the highest error tolerances for parent and fragment ions, respectively. Carbamidomethylation of cysteines was selected as fixed modification and oxidation of methionines and deamidation of asparagine and glutamine as variable modifications allowing 2 missed cleavages.

4.13. Network Analysis

Proteins differentially expressed obtained from the oleocanthal + H2O2 vs. H2O2 comparison were functionally analyzed through the use of QIAGEN’s Ingenuity Pathway Analysis (IPA, QIAGEN Redwood City, CA, USA, www.qiagen.com/ingenuity) with the aim to determine the predominant canonical pathways and interaction network involved. Swiss-Prot accession numbers and official gene symbols were inserted into the software along with corresponding comparison ratios and p values. The network proteins associated with biological functions and/or diseases in the Ingenuity Pathways Knowledge Base were considered for the analysis. The created networks describe functional relationships among proteins based on known associations in the literature. A comparison of the different analyses was created and the upstream regulators whose activity appears to change in a significant manner according to the activation z-score value were shown. Finally, to generate plausible causal networks which explain observed expression changes, hidden connections in upstream regulators were also uncovered.

Author Contributions

Conceptualization, L.G., C.A., M.M., A.L. and S.H.; Formal analysis, L.G., C.A., M.C.B., S.L., F.C., M.R., M.D., M.M. and M.R.M.; Funding acquisition, S.H.; Investigation, L.G., C.A., M.C.B., S.L., F.C., M.R. and M.R.M.; Supervision, A.U., C.M., A.L. and S.H.; Writing—original draft, L.G., C.A. and M.C.B.; Writing—review & editing, A.L. and S.H.

Funding

This work was supported by MIUR-PRIN 2015 (N. 20152HKF3Z).

Conflicts of Interest

The authors declare no conflict of interest.

Abbreviations

2DETwo-dimensional electrophoresis
ADAlzheimer’s disease
ANOVAAnalysis of variance
BBBBlood–brain barrier
BSABovine serum albumin
CIDCollision-induced dissociation
DCFH-DA2,7-Dichlorodihydrofluorescein diacetate
DDAData dependent acquisition mode
DMEMDulbecco’s modified Eagle’s medium
DMSODimethyl sulfoxide
DTTDitiothreitol
ECLEnhanced chemiluminescence
FMHWFull width at half maximum
GSHReduced glutathione
Gstm3Glutathione S-transferase mu 3
IEFIsoelectrofocusing
IPAIngenuity pathways aanalysis
MCBMonochlorobimane
MTT3-(4,5-Dimethylthiazol-2-yl)-2,5diphenyl-tetrazolium bromide)
NOXNicotinamide adenine dinucleotide phosphate oxidase
PBSPhosphate-buffered saline
PCRPolymerase chain reaction
PDParkinson’s disease
PrdxPeroxiredoxin
PrkPyruvate kinase
Psmb4Proteasome subunit β 4
Psmd1Proteasome 26S subunit non-ATPase 1
RAAll trans retinoic acid
RIPARadioimmunoprecipitation assay
ROSReactive oxygen species
SDS-PAGESodium dodecyl sulfate polyacrylamide gel electrophoresis
Usp14Ubiquitin carboxyl-terminal hydrolase 14

References

  1. Hampel, H.; Frank, R.; Broich, K.; Teipel, S.J.; Katz, R.G.; Hardy, J.; Herholz, K.; Bokde, A.L.; Jessen, F.; Hoessler, Y.C.; et al. Biomarkers for Alzheimer’s disease: Academic, industry and regulatory perspectives. Nat. Rev. Drug Discov. 2010, 9, 560–574. [Google Scholar] [CrossRef] [PubMed]
  2. Mandel, S.; Grunblatt, E.; Riederer, P.; Gerlach, M.; Levites, Y.; Youdim, M.B. Neuroprotective strategies in Parkinson’s disease: An update on progress. CNS Drugs 2003, 17, 729–762. [Google Scholar] [CrossRef] [PubMed]
  3. Dauer, W.; Przedborski, S. Parkinson’s disease: Mechanisms and models. Neuron 2003, 39, 889–909. [Google Scholar] [CrossRef]
  4. Halliwell, B. Reactive oxygen species and the central nervous system. J. Neurochem. 1992, 59, 1609–1623. [Google Scholar] [CrossRef] [PubMed]
  5. Hamilton, M.L.; van Remmen, H.; Drake, J.A.; Yang, H.; Guo, Z.M.; Kewitt, K.; Walter, C.A.; Richardson, A. Does oxidative damage to dna increase with age? Proc. Natl. Acad. Sci. USA 2001, 98, 10469–10474. [Google Scholar] [CrossRef] [PubMed]
  6. Aruoma, O.I. Neuroprotection by dietary antioxidants: New age of research. Die Nahrung 2002, 46, 381–382. [Google Scholar] [CrossRef]
  7. Tatton, W.G.; Chalmers-Redman, R.; Brown, D.; Tatton, N. Apoptosis in parkinson’s disease: Signals for neuronal degradation. Ann. Neurol. 2003, 53 (Suppl. 3), S61–S72. [Google Scholar] [CrossRef]
  8. Jenner, P.; Olanow, C.W. Oxidative stress and the pathogenesis of Parkinson’s disease. Neurology 1996, 47, 161S–170S. [Google Scholar] [CrossRef]
  9. Henchcliffe, C.; Beal, M.F. Mitochondrial biology and oxidative stress in Parkinson disease pathogenesis. Nat. Clin. Pract. Neurol. 2008, 4, 600–609. [Google Scholar] [CrossRef] [PubMed]
  10. Navarro, A.; Boveris, A. Brain mitochondrial dysfunction and oxidative damage in Parkinson’s disease. J. Bioenerg. Biomembr. 2009, 41, 517–521. [Google Scholar] [CrossRef] [PubMed]
  11. Nunomura, A.; Perry, G.; Aliev, G.; Hirai, K.; Takeda, A.; Balraj, E.K.; Jones, P.K.; Ghanbari, H.; Wataya, T.; Shimohama, S.; et al. Oxidative damage is the earliest event in Alzheimer disease. J. Neuropathol. Exp. Neurol. 2001, 60, 759–767. [Google Scholar] [CrossRef] [PubMed]
  12. Nunomura, A.; Perry, G.; Pappolla, M.A.; Wade, R.; Hirai, K.; Chiba, S.; Smith, M.A. RNA oxidation is a prominent feature of vulnerable neurons in Alzheimer’s disease. J. Neurosci. 1999, 19, 1959–1964. [Google Scholar] [CrossRef] [PubMed]
  13. Castellani, R.J.; Harris, P.L.; Sayre, L.M.; Fujii, J.; Taniguchi, N.; Vitek, M.P.; Founds, H.; Atwood, C.S.; Perry, G.; Smith, M.A. Active glycation in neurofibrillary pathology of Alzheimer disease: N(epsilon)-(carboxymethyl) lysine and hexitol-lysine. Free Radic. Biol. Med. 2001, 31, 175–180. [Google Scholar] [CrossRef]
  14. Shlisky, J.; Bloom, D.E.; Beaudreault, A.R.; Tucker, K.L.; Keller, H.H.; Freund-Levi, Y.; Fielding, R.A.; Cheng, F.W.; Jensen, G.L.; Wu, D.; et al. Nutritional considerations for healthy aging and reduction in age-related chronic disease. Adv. Nutr. 2017, 8, 17–26. [Google Scholar] [CrossRef] [PubMed]
  15. Féart, C.; Samieri, C.; Barberger-Gateau, P. Mediterranean diet and cognitive function in older adults. Curr. Opin. Clin. Nutr. Metab. Care 2010, 13, 14–18. [Google Scholar] [CrossRef] [PubMed] [Green Version]
  16. Loughrey, D.G.; Lavecchia, S.; Brennan, S.; Lawlor, B.A.; Kelly, M.E. The impact of the Mediterranean diet on the cognitive functioning of healthy older adults: A systematic review and meta-analysis. Adv. Nutr. 2017, 8, 571–586. [Google Scholar] [PubMed]
  17. Angeloni, C.; Malaguti, M.; Barbalace, M.C.; Hrelia, S. Bioactivity of olive oil phenols in neuroprotection. Int. J. Mol. Sci. 2017, 18, 2230. [Google Scholar] [CrossRef] [PubMed]
  18. Ferroni, F.; Maccaglia, A.; Pietraforte, D.; Turco, L.; Minetti, M. Phenolic antioxidants and the protection of low density lipoprotein from peroxynitrite-mediated oxidations at physiologic CO2. J. Agric. Food Chem. 2004, 52, 2866–2874. [Google Scholar] [CrossRef] [PubMed]
  19. Petroni, A.; Blasevich, M.; Salami, M.; Papini, N.; Montedoro, G.F.; Galli, C. Inhibition of platelet aggregation and eicosanoid production by phenolic components of olive oil. Thromb. Res. 1995, 78, 151–160. [Google Scholar] [CrossRef]
  20. Maiuri, M.C.; de Stefano, D.; di Meglio, P.; Irace, C.; Savarese, M.; Sacchi, R.; Cinelli, M.P.; Carnuccio, R. Hydroxytyrosol, a phenolic compound from virgin olive oil, prevents macrophage activation. Naunyn. Schmiedebergs Arch. Pharmacol. 2005, 371, 457–465. [Google Scholar] [CrossRef] [PubMed]
  21. Qosa, H.; Batarseh, Y.S.; Mohyeldin, M.M.; El Sayed, K.A.; Keller, J.N.; Kaddoumi, A. Oleocanthal enhances amyloid-β clearance from the brains of TgSwDI mice and in vitro across a human blood-brain barrier model. ACS Chem. Neurosci. 2015, 6, 1849–1859. [Google Scholar] [CrossRef] [PubMed]
  22. Fogliano, V.; Sacchi, R. Oleocanthal in olive oil: Between myth and reality. Mol. Nutr. Food Res. 2006, 50, 5–6. [Google Scholar] [CrossRef] [PubMed]
  23. Servili, M.; Esposto, S.; Fabiani, R.; Urbani, S.; Taticchi, A.; Mariucci, F.; Selvaggini, R.; Montedoro, G.F. Phenolic compounds in olive oil: Antioxidant, health and organoleptic activities according to their chemical structure. Inflammopharmacology 2009, 17, 76–84. [Google Scholar] [CrossRef] [PubMed]
  24. Beauchamp, G.K.; Keast, R.S.; Morel, D.; Lin, J.; Pika, J.; Han, Q.; Lee, C.H.; Smith, A.B.; Breslin, P.A. Phytochemistry: Ibuprofen-like activity in extra-virgin olive oil. Nature 2005, 437, 45–46. [Google Scholar] [CrossRef] [PubMed]
  25. Abuznait, A.H.; Qosa, H.; Busnena, B.A.; El Sayed, K.A.; Kaddoumi, A. Olive-oil-derived oleocanthal enhances β-amyloid clearance as a potential neuroprotective mechanism against Alzheimer’s disease: In vitro and in vivo studies. ACS Chem. Neurosci. 2013, 4, 973–982. [Google Scholar] [CrossRef] [PubMed]
  26. Monti, M.C.; Margarucci, L.; Tosco, A.; Riccio, R.; Casapullo, A. New insights on the interaction mechanism between tau protein and oleocanthal, an extra-virgin olive-oil bioactive component. Food Funct. 2011, 2, 423–428. [Google Scholar] [CrossRef] [PubMed]
  27. Pitt, J.; Roth, W.; Lacor, P.; Smith, A.B.; Blankenship, M.; Velasco, P.; de Felice, F.; Breslin, P.; Klein, W.L. Alzheimer’s-associated Aβ oligomers show altered structure, immunoreactivity and synaptotoxicity with low doses of oleocanthal. Toxicol. Appl. Pharmacol. 2009, 240, 189–197. [Google Scholar] [CrossRef] [PubMed]
  28. Li, W.; Sperry, J.B.; Crowe, A.; Trojanowski, J.Q.; Smith, A.B.; Lee, V.M. Inhibition of tau fibrillization by oleocanthal via reaction with the amino groups of tau. J. Neurochem. 2009, 110, 1339–1351. [Google Scholar] [CrossRef] [PubMed] [Green Version]
  29. Selkoe, D.J. Alzheimer’s disease: Genes, proteins, and therapy. Physiol. Rev. 2001, 81, 741–766. [Google Scholar] [CrossRef] [PubMed]
  30. Rosignoli, P.; Fuccelli, R.; Fabiani, R.; Servili, M.; Morozzi, G. Effect of olive oil phenols on the production of inflammatory mediators in freshly isolated human monocytes. J. Nutr. Biochem. 2013, 24, 1513–1519. [Google Scholar] [CrossRef] [PubMed]
  31. Piras, S.; Furfaro, A.L.; Brondolo, L.; Passalacqua, M.; Marinari, U.M.; Pronzato, M.A.; Nitti, M. Differentiation impairs bach1 dependent ho-1 activation and increases sensitivity to oxidative stress in SH-SY5Y neuroblastoma cells. Sci. Rep. 2017, 7, 7568. [Google Scholar] [CrossRef] [PubMed]
  32. Sinha, R.; Sinha, I.; Calcagnotto, A.; Trushin, N.; Haley, J.S.; Schell, T.D.; Richie, J.P. Oral supplementation with liposomal glutathione elevates body stores of glutathione and markers of immune function. Eur. J. Clin. Nutr. 2018, 72, 105–111. [Google Scholar] [CrossRef] [PubMed]
  33. Yun, B.G.; Matts, R.L. Hsp90 functions to balance the phosphorylation state of Akt during C2C12 myoblast differentiation. Cell Signal. 2005, 17, 1477–1485. [Google Scholar] [CrossRef] [PubMed]
  34. Romero, C.; Medina, E.; Vargas, J.; Brenes, M.; De Castro, A. In vitro activity of olive oil polyphenols against helicobacter pylori. J. Agric. Food Chem. 2007, 55, 680–686. [Google Scholar] [CrossRef] [PubMed]
  35. García-Villalba, R.; Carrasco-Pancorbo, A.; Nevedomskaya, E.; Mayboroda, O.A.; Deelder, A.M.; Segura-Carretero, A.; Fernández-Gutiérrez, A. Exploratory analysis of human urine by LC-ESI-TOF MS after high intake of olive oil: Understanding the metabolism of polyphenols. Anal. Bioanal. Chem. 2010, 398, 463–475. [Google Scholar] [CrossRef] [PubMed]
  36. Carvalho, A.N.; Marques, C.; Rodrigues, E.; Henderson, C.J.; Wolf, C.R.; Pereira, P.; Gama, M.J. Ubiquitin-proteasome system impairment and MPTP-induced oxidative stress in the brain of C57BL/6 wild-type and GSTP knockout mice. Mol. Neurobiol. 2013, 47, 662–672. [Google Scholar] [CrossRef] [PubMed]
  37. Ciechanover, A. Proteolysis: From the lysosome to ubiquitin and the proteasome. Nat. Rev. Mol. Cell. Biol. 2005, 6, 79–87. [Google Scholar] [CrossRef] [PubMed]
  38. Bhutani, N.; Piccirillo, R.; Hourez, R.; Venkatraman, P.; Goldberg, A.L. Cathepsins L and Z are critical in degrading polyglutamine-containing proteins within lysosomes. J. Biol. Chem. 2012, 287, 17471–17482. [Google Scholar] [CrossRef] [PubMed]
  39. Coux, O.; Tanaka, K.; Goldberg, A.L. Structure and functions of the 20s and 26s proteasomes. Annu. Rev. Biochem. 1996, 65, 801–847. [Google Scholar] [CrossRef] [PubMed]
  40. McKinnon, C.; Tabrizi, S.J. The ubiquitin-proteasome system in neurodegeneration. Antioxid. Redox Signal. 2014, 21, 2302–2321. [Google Scholar] [CrossRef] [PubMed]
  41. Yasuhara, T.; Hara, K.; Sethi, K.D.; Morgan, J.C.; Borlongan, C.V. Increased 8-OHDG levels in the urine, serum, and substantia nigra of hemiparkinsonian rats. Brain Res. 2007, 1133, 49–52. [Google Scholar] [CrossRef] [PubMed]
  42. Lee, B.H.; Lu, Y.; Prado, M.A.; Shi, Y.; Tian, G.; Sun, S.; Elsasser, S.; Gygi, S.P.; King, R.W.; Finley, D. Usp14 deubiquitinates proteasome-bound substrates that are ubiquitinated at multiple sites. Nature 2016, 532, 398–401. [Google Scholar] [CrossRef] [PubMed]
  43. van Assema, D.M.; Lubberink, M.; Bauer, M.; van der Flier, W.M.; Schuit, R.C.; Windhorst, A.D.; Comans, E.F.; Hoetjes, N.J.; Tolboom, N.; Langer, O.; et al. Blood-brain barrier p-glycoprotein function in Alzheimer’s disease. Brain 2012, 135, 181–189. [Google Scholar] [CrossRef] [PubMed]
  44. Batarseh, Y.S.; Mohamed, L.A.; Al Rihani, S.B.; Mousa, Y.M.; Siddique, A.B.; El Sayed, K.A.; Kaddoumi, A. Oleocanthal ameliorates amyloid-β oligomers’ toxicity on astrocytes and neuronal cells: In vitro studies. Neuroscience 2017, 352, 204–215. [Google Scholar] [CrossRef] [PubMed]
  45. Wandinger, S.K.; Richter, K.; Buchner, J. The Hsp90 chaperone machinery. J. Biol. Chem. 2008, 283, 18473–18477. [Google Scholar] [CrossRef] [PubMed]
  46. Schmitt, E.; Gehrmann, M.; Brunet, M.; Multhoff, G.; Garrido, C. Intracellular and extracellular functions of heat shock proteins: Repercussions in cancer therapy. J. Leukoc. Biol. 2007, 81, 15–27. [Google Scholar] [CrossRef] [PubMed]
  47. Taiyab, A.; Sreedhar, A.S.; Rao, C.M. Hsp90 inhibitors, GA and 17AAG, lead to ER stress-induced apoptosis in rat histiocytoma. Biochem. Pharmacol. 2009, 78, 142–152. [Google Scholar] [CrossRef] [PubMed]
  48. Sato, S.; Fujita, N.; Tsuruo, T. Modulation of Akt kinase activity by binding to Hsp90. Proc. Natl. Acad. Sci. USA 2000, 97, 10832–10837. [Google Scholar] [CrossRef] [PubMed] [Green Version]
  49. Xie, L.; Tiong, C.X.; Bian, J.S. Hydrogen sulfide protects SH-SY5Y cells against 6-hydroxydopamine-induced endoplasmic reticulum stress. Am. J. Physiol. Cell Physiol. 2012, 303, C81–C91. [Google Scholar] [CrossRef] [PubMed]
  50. Harris, R.A.; Tindale, L.; Cumming, R.C. Age-dependent metabolic dysregulation in cancer and Alzheimer’s disease. Biogerontology 2014, 15, 559–577. [Google Scholar] [CrossRef] [PubMed]
  51. Luo, J.; Wärmländer, S.K.; Gräslund, A.; Abrahams, J.P. Non-chaperone proteins can inhibit aggregation and cytotoxicity of Alzheimer amyloid β peptide. J. Biol. Chem. 2014, 289, 27766–27775. [Google Scholar] [CrossRef] [PubMed]
  52. Rhee, S.G.; Yang, K.S.; Kang, S.W.; Woo, H.A.; Chang, T.S. Controlled elimination of intracellular H2O2: Regulation of peroxiredoxin, catalase, and glutathione peroxidase via post-translational modification. Antioxid. Redox Signal. 2005, 7, 619–626. [Google Scholar] [CrossRef] [PubMed]
  53. Immenschuh, S.; Baumgart-Vogt, E. Peroxiredoxins, oxidative stress, and cell proliferation. Antioxid. Redox Signal. 2005, 7, 768–777. [Google Scholar] [CrossRef] [PubMed]
  54. Kim, S.H.; Fountoulakis, M.; Cairns, N.; Lubec, G. Protein levels of human peroxiredoxin subtypes in brains of patients with Alzheimer’s disease and down syndrome. J. Neural Transm. Suppl. 2001, 223–235. [Google Scholar]
  55. Chang, R.; Wang, E. Mouse translation elongation factor eEF1A-2 interacts with Prdx-I to protect cells against apoptotic death induced by oxidative stress. J. Cell Biochem. 2007, 100, 267–278. [Google Scholar] [CrossRef] [PubMed]
  56. Majd, S.; Power, J.H.T. Oxidative stress and decreased mitochondrial superoxide dismutase 2 and peroxiredoxins 1 and 4 based mechanism of concurrent activation of ampk and mtor in Alzheimer’s disease. Curr. Alzheimer Res. 2018, 15, 764–776. [Google Scholar] [CrossRef] [PubMed]
  57. Schreibelt, G.; van Horssen, J.; Haseloff, R.F.; Reijerkerk, A.; van der Pol, S.M.; Nieuwenhuizen, O.; Krause, E.; Blasig, I.E.; Dijkstra, C.D.; Ronken, E.; et al. Protective effects of peroxiredoxin-1 at the injured blood-brain barrier. Free Radic. Biol. Med. 2008, 45, 256–264. [Google Scholar] [CrossRef] [PubMed]
  58. Bolduc, J.A.; Nelson, K.J.; Haynes, A.C.; Lee, J.; Reisz, J.A.; Graff, A.H.; Clodfelter, J.E.; Parsonage, D.; Poole, L.B.; Furdui, C.M.; et al. Novel hyperoxidation resistance motifs in 2-Cys peroxiredoxins. J. Biol. Chem. 2018. [Google Scholar] [CrossRef] [PubMed]
  59. Pasban-Aliabadi, H.; Esmaeili-Mahani, S.; Abbasnejad, M. Orexin-A protects human neuroblastoma SH-SY5Y cells against 6-hydroxydopamine-induced neurotoxicity: Involvement of PKC and PI3K signaling pathways. Rejuvenation Res. 2017, 20, 125–133. [Google Scholar] [CrossRef] [PubMed]
  60. Yoo, J.M.; Lee, B.D.; Sok, D.E.; Ma, J.Y.; Kim, M.R. Neuroprotective action of N-acetyl serotonin in oxidative stress-induced apoptosis through the activation of both TrkB/CREB/BNDF pathway and Akt/Nrf2/antioxidant enzyme in neuronal cells. Redox Biol. 2017, 11, 592–599. [Google Scholar] [CrossRef] [PubMed]
  61. Hooper, P.L.; Durham, H.D.; Török, Z.; Crul, T.; Vígh, L. The central role of heat shock factor 1 in synaptic fidelity and memory consolidation. Cell Stress Chaperones 2016, 21, 745–753. [Google Scholar] [CrossRef] [PubMed] [Green Version]
  62. Verma, P.; Pfister, J.A.; Mallick, S.; D’Mello, S.R. HSF1 protects neurons through a novel trimerization- and HSP-independent mechanism. J. Neurosci. 2014, 34, 1599–1612. [Google Scholar] [CrossRef] [PubMed]
  63. Xie, C.; Ginet, V.; Sun, Y.; Koike, M.; Zhou, K.; Li, T.; Li, H.; Li, Q.; Wang, X.; Uchiyama, Y.; et al. Neuroprotection by selective neuronal deletion of Atg7 in neonatal brain injury. Autophagy 2016, 12, 410–423. [Google Scholar] [CrossRef] [PubMed] [Green Version]
  64. Angeloni, C.; Malaguti, M.; Rizzo, B.; Barbalace, M.C.; Fabbri, D.; Hrelia, S. Neuroprotective effect of sulforaphane against methylglyoxal cytotoxicity. Chem. Res. Toxicol. 2015, 28, 1234–1245. [Google Scholar] [CrossRef] [PubMed]
  65. Angeloni, C.; Motori, E.; Fabbri, D.; Malaguti, M.; Leoncini, E.; Lorenzini, A.; Hrelia, S. H2O2 preconditioning modulates phase ii enzymes through p38 MAPK and PI3K/Akt activation. Am. J. Physiol. Heart Circ. Physiol. 2011, 300, H2196–H2205. [Google Scholar] [CrossRef] [PubMed]
  66. Angeloni, C.; Teti, G.; Barbalace, M.C.; Malaguti, M.; Falconi, M.; Hrelia, S. 17β-estradiol enhances sulforaphane cardioprotection against oxidative stress. J. Nutr. Biochem. 2017, 42, 26–36. [Google Scholar] [CrossRef] [PubMed]
  67. Angeloni, C.; Leoncini, E.; Malaguti, M.; Angelini, S.; Hrelia, P.; Hrelia, S. Role of quercetin in modulating rat cardiomyocyte gene expression profile. Am. J. Physiol. Heart Circ. Physiol. 2008, 294, H1233–H1243. [Google Scholar] [CrossRef] [PubMed]
  68. Ciregia, F.; Bugliani, M.; Ronci, M.; Giusti, L.; Boldrini, C.; Mazzoni, M.R.; Mossuto, S.; Grano, F.; Cnop, M.; Marselli, L.; et al. Palmitate-induced lipotoxicity alters acetylation of multiple proteins in clonal β cells and human pancreatic islets. Sci. Rep. 2017, 7, 13445. [Google Scholar] [CrossRef] [PubMed]
  69. Ciregia, F.; Giusti, L.; da Valle, Y.; Donadio, E.; Consensi, A.; Giacomelli, C.; Sernissi, F.; Scarpellini, P.; Maggi, F.; Lucacchini, A.; et al. A multidisciplinary approach to study a couple of monozygotic twins discordant for the chronic fatigue syndrome: A focus on potential salivary biomarkers. J. Transl. Med. 2013, 11, 243. [Google Scholar] [CrossRef] [PubMed]
  70. Ciregia, F.; Giusti, L.; Ronci, M.; Bugliani, M.; Piga, I.; Pieroni, L.; Rossi, C.; Marchetti, P.; Urbani, A.; Lucacchini, A. Glucagon-like peptide 1 protects ins-1e mitochondria against palmitate-mediated β-cell dysfunction: A proteomic study. Mol. Biosyst. 2015, 11, 1696–1707. [Google Scholar] [CrossRef] [PubMed]
Figure 1. Viability of differentiated SH-SY5Y treated with oleocanthal in the absence/presence of H2O2. (a) Cells were treated with oleocanthal (1–10 µM) for 24 h, (b) cells were treated with peroxide (0.1–1 mM), or (c) cells were treated with oleocanthal (1–10 µM) and after 24 h exposed to 700 µM H2O2 for 1 h; cell viability was measured by MTT assay. Each bar represents means ± SEM of at least four independent experiments. Data were analyzed by one-way analysis of variance (ANOVA) followed by Bonferroni’s test. * p < 0.05 with respect to control (CTRL); ° p < 0.05 with respect to H2O2.
Ijms 19 02329 g001
Figure 2. Antioxidant activity of oleocanthal against H2O2 in differentiated SH-SY5Y cells. Cells were treated with 10 μM oleocanthal and after 24 h were exposed to H2O2. Intracellular reactive oxygen species (ROS) levels were measured with the peroxide-sensitive probe DCFH-DA as reported in Materials and Methods. Data are expressed as a percentage with respect to H2O2-treated cells. Each bar represents mean ± SEM of at least four independent experiments. Data were analyzed by one-way ANOVA followed by Bonferroni’s test. * p < 0.05 with respect to CTRL; ° p < 0.05 with respect to H2O2.
Ijms 19 02329 g002
Figure 3. Effect of oleocanthal on GSH levels in differentiated SH-SY5Y cells. Cells were treated with 10 μM oleocanthal and after 24 h were exposed to peroxide. GSH levels were measured using the fluorescence probe MCB as reported in Materials and Methods. Each bar represents the mean ± SEM of four independent experiments. Data were analyzed by one-way ANOVA followed by Bonferroni’s test. * p < 0.05 with respect to CTRL; ° p < 0.05 with respect to H2O2.
Ijms 19 02329 g003
Figure 4. Representative 2D gel map of differentiated SH-SY5Y human neuroblastoma cellular protein extracts. (A) Control cells; (B) H2O2-treated cells; (C) Oleocanthal + H2O2 treated cells. Proteins were separated in a 3–10 nonlinear gradient. Sodium dodecyl sulfate polyacrylamide gel electrophoresis (SDS-PAGE) was performed at 12% of acrylamide.
Ijms 19 02329 g004
Figure 5. Protein expression profiling of oleocanthal + H2O2 vs. H2O2. Scatter plot of fold change (x axis), against log p-value (y axis) of all quantified proteins. Up- and Down-regulated proteins are colored red and green, respectively. Dotted line indicates the threshold of significance.
Ijms 19 02329 g005
Figure 6. Functional Network. Proteins differentially expressed resulting from the oleocanthal + H2O2 vs. H2O2 comparison were functionally analyzed through the use of QIAGEN’s Ingenuity Pathway Analysis. Network describes functional relationships among proteins based on known associations in the literature. Solid line: direct interaction; dotted line: indirect interaction. * This protein has been identified in many spots.
Ijms 19 02329 g006
Figure 7. Transcriptional validation of proteomic data. Differentiated SH-SY5Y were pretreated with 10 µM oleocanthal for 24 h and then exposed to 700 µM H2O2 for 1 h. Total RNA was isolated, and the mRNA level of target genes was quantified using RT-PCR normalized to 18S rRNA reference gene as reported in Materials and Methods. Triplicate reactions were performed for each experiment. Each bar represents the mean ± SEM of three independent experiments. Data were analyzed by Student’s t-test. * p < 0.05 with respect to H2O2.
Ijms 19 02329 g007
Figure 8. Effect of oleocanthal on the ubiquitin–proteasome system in the absence of H2O2. Differentiated SH-SY5Y were treated with 10 µM oleocanthal for 24 h. Total RNA was isolated, and the mRNA level of target genes was quantified using RT-PCR normalized to 18S rRNA reference gene as reported in Materials and Methods. Triplicate reactions were performed for each experiment. Each bar represents the mean ± SEM of three independent experiments. Data were analyzed by Student’s t-test. * p < 0.05 with respect to CTRL.
Ijms 19 02329 g008
Figure 9. Akt kinase activation following oleocanthal treatment in the presence of PI3K-specific inhibitor. Differentiated SH-SY5Y were exposed to 100 nM wortmannin 1 h before 10 µM oleocanthal treatment for 1 h. Proteins were separated by SDS-PAGE and immunoblotted for total and phosphorylated form of Akt as reported in Materials and Methods. Each bar represents the mean ± SEM of three independent experiments. Data were analyzed by one-way ANOVA followed by Bonferroni’s test. * p < 0.05 with respect to CTRL; § p < 0.05 with respect to oleocanthal.
Ijms 19 02329 g009
Figure 10. Akt-specific inhibitor wortmannin prevents oleocanthal-induced HSP90s. Differentiated SH-SY5Y were treated with 100 nM wortmannin 1 h before exposure to 10 µM oleocanthal for 24 h. Total RNA was isolated, and the mRNA level of target genes was quantified using RT-PCR normalized to 18S rRNA reference gene as reported in Materials and Methods. Triplicate reactions were performed for each experiment. Each bar represents the mean ± SEM of three independent experiments. Data were analyzed by one-way ANOVA followed by Bonferroni’s test. * p < 0.05 with respect to CTRL; § p < 0.05 with respect to oleocanthal; # p < 0.05 with respect to oleocanthal + wortmannin.
Ijms 19 02329 g010
Figure 11. Effect of Akt inhibitor wortmannin on H2O2-induced injury in differentiated SH-SY5Y. Cells were treated with 10 µM oleocanthal for 24 h in absence/presence of 100 nM wortmannin prior to peroxide exposure, then cell viability was assessed with MTT assay. Each bar represents the mean ± SEM of three independent experiments. Data were analyzed by one-way ANOVA followed by Bonferroni’s test. * p < 0.05 with respect to CTRL; ° p < 0.05 with respect to H2O2; § p < 0.05 with respect to oleocanthal.
Ijms 19 02329 g011
Figure 12. Downstream functions. Predicted activated functions based on up- (red) and down- (green) regulated proteins. Arrows predict a direct (orange) or indirect (grey) action on cell function. T bar predicts an inhibition on cell function. * This protein has been identified in many spots.
Ijms 19 02329 g012
Table 1. MS/MS data of protein spots differentially expressed grouped by functional class. MW, molecular weight; pI, isoelectric point; th, theoretical.
# SpotProtein NameGeneIDPeptide (n)UniqueCoverage (%)MW (th)pI (th)
Metabolism
381Guanosine 5′-monophosphate synthase (glutamine-hydrolyzing)GMPSP4991532325276,7166.42
521Pyruvate kinase PKMPKMP146183665957,9377.96
559AmidophosphoribosyltransferasePPATQ06203441057,3986.3
693Gamma-enolaseENO2P0910413134647,2694.91
856Cytosolic acyl coenzyme A thioester hydrolaseACOT7O00154331427,0416.51
876Alcohol dehydrogenase (NADP(+))AKR1A1P1455014145036,5736.32
939Malate dehydrogenase, cytoplasmicMDH1P40925773236,4266.91
950ADP-sugar pyrophosphataseNUDT5Q9UKK9662624,3284.87
1069Enoyl-CoA hydratase, mitochondrialECHS1P3008413134331,3878.34
1076NADH:ubiquinone oxidoreductase iron-sulfur protein 3, mitocondrial NDUFS3O75489883230,2426.98
1098Triosephosphate isomeraseTPI1P6017412125726,6696.45
2010Phosphoglycerate kinase 1PGK1P0055841357244,6158.3
2010Isocitrate dehydrogenasemitochondrial isoform2IDH2P4873525255345,1807.63
Protein synthesis, modification secretion folding
296Acylamino-acid-releasing enzymeAPEHP1379815152481,2255.29
708AdenosylhomocysteinaseAHCYP2352618183747,7165.92
916Small glutamine-rich tetratricopeptide repeat-containing protein alphaSGTAO43765882734,0634.79
940Ubiquitin thioesterase OTUB1OTUB1Q96FW1552331,2844.85
1230Protein DJ-1PARK7Q9949711114919,8916.32
1812Platelet-activating factor acetylhydrolase IB subunit gammaPAFAH1B3Q15102662725,7346.33
Protein degradation
498Ubiquitin carboxyl-terminal hydrolase 14USP14P5457813133552,3865.61
995Proteasome activator complex subunit 3PSME3P6128910103929,5065.69
1111Ubiquitin carboxyl-terminal hydrolase isozyme L1UCHL1P0993629298124,8245.33
Cytoskeleton, vesicle motility, transport, vesicle release
430Dihydropyrimidinase-related protein 3DPYSL3Q1419529245773,9115.94
436Dihydropyrimidinase-related protein 3DPYSL3Q1419530305873,9115.94
441Dihydropyrimidinase-related protein 3DPYSL3Q1419529245873,9115.94
1079Ran-specific GTPase-activating proteinRANBP1P43487995023,3105.19
1425Cofilin-1CFL1P23528885118,5028.22
1743F-actin-capping protein subunit βCAPZBP4775617175630,6295.69
RNA synthesis/metabolism
590ATP-dependent RNA helicase DDX39ADDX39AO0014816163549,1305.46
621Spliceosome RNA helicase DDX39BDDX39BQ1383818183948,9915.44
624Heterogeneous nuclear ribonucleoprotein HHNRNPH1P3194325135549,2295.89
836Heterogeneous nuclear ribonucleoprotein A3HNRNPA3P5199124234939,5959.1
876Heterogeneous nuclear ribonucleoprotein H3HNRNPH3P3194212125836,9266.37
915Heterogeneous nuclear ribonucleoprotein H3HNRNPH3P31942884035,2396.36
1735Heterogeneous nuclear ribonucleoprotein A1HNRNPA1P0965115116329,3869.19
Chromatin remodeling and histone
498Poly(U)-binding-splicing factor PUF60 isoforma1PUF60Q9UHX110102859,8755.19
Stress response
18126S proteasome non-ATPase regulatory subunit 1PSMD1Q9946016162710,22585.14
334Heat shock protein HSP 90-αHSP90AA1P079001261984,6604.94
335Heat shock protein HSP 90-βHSP90AB1P082381582483,2644.96
49860 kDa heat shock protein. mitochondrialHSPD1P1080931315461,0555.7
50660 kDa heat shock protein. mitochondrialHSPD1P1080954547361,0555.7
115360 kDa heat shock protein. mitochondrialHSPD1P1080944 61,0555.7
701DnaJ homolog subfamily A member 2DNAJA2O6088415153545,7466.06
995Proteasome activator complex subunit 3PSME3P6128910103929,5065.69
1087Peroxiredoxin-6PRDX6P3004121216525,0356
1090Peroxiredoxin-6PRDX6P3004120206725,0356
1122Heat shock protein β-1HSPB1P0479221217722,7835.98
1253Peroxiredoxin-2PRDX2P3211930305921,8925.66
1269Peroxiredoxin-2PRDX2P3211920205921,8925.66
1725Peroxiredoxin-4PRDX4Q13162441730,5405.86
1731Peroxiredoxin-1PRDX1Q0683021217222,1108.27
1736Peroxiredoxin-1PRDX1Q0683017177222,1108.27
1741Thioredoxin-dependent peroxide reductase. mitochondrialPRDX3P3004811114627,6937.68
1743F-actin-capping protein subunit βCAPZBP4775617175630,6295.69
Miscellaneous
498Ubiquitin carboxyl-terminal hydrolase 14USP14P5457813133552,3865.61
715Programmed cell death protein 2-likePDCD2LQ9BRP1331339,4174.71
826Guanine nucleotide-binding protein G(i) subunit α-2GNAI2P0489916135040,4515.34
843V-type proton ATPase subunit d 1ATP6V0D1P61421552040,3294.89
843NucleophosminNPM1P0674814145232,5754.64
950Annexin A5ANXA5P08758661835,9374.93
1153High mobility group protein B1HMGB1P09429442424,8945.6
1733Chloride intracellular channel protein 1CLIC1O0029916156126,9235.09
1743N(G).N(G)-dimethylarginine dimethylaminohydrolase 2DDAH2O9586513135429,6445.66
1767MICOS complex subunit MIC60IMMTQ16891414160826256.15
181328 kDa heat- and acid-stable phosphoproteinPDAP1Q13442331320,6308.84
Table 2. List of differentially expressed proteins after comparison between H2O2 vs. Control (ctrl). ID: SwissProt accession Number; OD: Normalized optical density.
# SpotIDGeneProtein Name Ratio (OD) H2O2/Ctrlp-Value
181Q99460PSMD126S proteasome non-ATPase regulatory subunit 10.760.026
335P08238HSP90AB1Heat shock protein HSP 90-beta0.670.018
381P49915GMPSGMP synthase [glutamine-hydrolyzing]0.750.014
430Q14195DPYSL3Dihydropyrimidinase-related protein 30.580.002
436Q14195DPYSL3Dihydropyrimidinase-related protein 30.740.001
441Q14195DPYSL3Dihydropyrimidinase-related protein 31.560.022
506P10809HSPD160 kDa heat shock protein. mitochondrial0.830.011
559Q06203PPATAmidophosphoribosyltransferase0.570.046
621Q13838DDX39BSpliceosome RNA helicase DDX39B0.830.022
624P31943HNRNPH1Heterogeneous nuclear ribonucleoprotein H0.810.039
701DNAJA2O60884DnaJ homolog subfamily A member 20.770.017
708P23526AHCYAdenosylhomocysteinase0.820.012
856O00154ACOT7Cytosolic acyl coenzyme A thioester hydrolase0.760.036
876P14550AKR1A1Alcohol dehydrogenase (NADP(+))0.690.043
876P31942HNRNPH3Heterogeneous nuclear ribonucleoprotein H3
915P31942HNRNPH3Heterogeneous nuclear ribonucleoprotein H30.710.026
939P40925MDH1Malate dehydrogenase. cytoplasmic0.680.026
940Q96FW1OTUB1Ubiquitin thioesterase OTUB10.730.017
950P08758ANXA5Annexin A50.780.012
950Q9UKK9NUDT5ADP-sugar pyrophosphatase
1069P30084ECHS1Enoyl-CoA hydratase. mitochondrial0.780.023
1079P43487RANBP1Ran-specific GTPase-activating protein0.800.035
1087P30041PRDX6Peroxiredoxin-65.840.007
1090P30041PRDX6Peroxiredoxin-60.530.032
1098P60174TPI1Triosephosphate isomerase0.680.004
1122P04792HSPB1Heat shock protein β-10.690.015
1179P28070PSMB4Proteasome subunit β type-40.800.036
1253P32119PRDX2Peroxiredoxin-20.174.4 × 10−7
1269P32119PRDX2Peroxiredoxin-22.273.08 × 10−5
1725Q13162PRDX4Peroxiredoxin-40.620.016
1731Q06830PRDX1Peroxiredoxin-10.334.28 × 10−6
1736Q06830PRDX1Peroxiredoxin-13.371.37 × 10−6
1741P30048PRDX3Thioredoxin-dependent peroxide reductase mitochondrial0.480.00041
1743P47756CAPZBF-actin-capping protein subunit β0.800.042
1743O95865DDAH2N(G).N(G)-dimethylarginine dimethylaminohydrolase 2
1767Q16891IMMTMICOS complex subunit MIC600.720.021
1812Q15102PAFAH1B3Platelet-activating factor acetylhydrolase IB subunit γ0.760.021
Table 3. List of differentially expressed proteins after comparison between oleocanthal (OC) + H2O2 vs. H2O2. ID: SwissProt accession. Number; OD: Normalized optical density.
# SpotIDGeneProtein NameRatio M ± SD (OD) OC + H2O2/H2O2p-Value
181Q99460PSMD126S proteasome non-ATPase regulatory subunit 11.290.034
296P13798APEHAcylamino-acid-releasing enzyme1.280.009
334P08238HSP90AB1Heat shock protein HSP 90-β1.330.026
334P07900HSP90AA1Heat shock protein HSP 90-alpha
498P54578USP14Ubiquitin carboxyl-terminal hydrolase 141.300.023
498Q9UHX1PUF60Poly(U)-binding-splicing factor PUF60 isoforma1
521P14618PKMPyruvate kinase PKM1.350.035
590O00148DDX39AATP-dependent RNA helicase DDX39A1.360.018
621Q13838DDX39BSpliceosome RNA helicase DDX39B1.290.013
715Q9BRP1PDCD2LProgrammed cell death protein 2-like0.770.013
836P51991HNRNPA3Heterogeneous nuclear ribonucleoprotein A30.640.023
843P61421ATP6V0D1V-type proton ATPase subunit d 10.640.019
843P06748NPM1Nucleophosmin
940Q96FW1OTUB1Ubiquitin thioesterase OTUB11.450.036
1109P21266GSTM3Glutathione S-transferase Mu 31.230.036
1111P09936UCHL1Ubiquitin carboxyl-terminal hydrolase isozyme L11.250.002
1153P09429HMGB1High mobility group protein B10.430.049
1179P28070PSMB4Proteasome subunit β type-41.300.024
1736Q06830PRDX1Peroxiredoxin-11.210.029
Table 4. Master regulators predicted by IPA analysis.
Master RegulatorMolecule TypePredicted Activation StateActivation z-Scorep-Value
GPR68G-protein complexInhibited−2.121.09 × 10−4
MARK2KinaseInhibited−2.332.67 × 10−4
miR-149-5pMature microRNAInhibited−2.531.36 × 10−4
ATG7EnzymeInhibited−2.657.88 × 10−6
Smad2/3-Smad4ComplexInhibited−2.833.02 × 10−4
PDE2AEnzymeActivated+2.534.07 × 10−5
ELMO1OtherActivated+2.538.06 × 10−5
DOCK5OtherActivated+2.538.14 × 10−5
FARP2OtherActivated+2.531.07 × 10−4
ARHGEF6/7GroupActivated+2.531.07 × 10−5
BAIAP2KinaseActivated+2.332.44 × 10−4
RAC1EnzymeActivated+2.332.47 × 10−4
HifComplexActivated+2.333.28 × 10−4
ADORA1G-protein complexActivated+2.334.12 × 10−4
NOX4EnzymeActivated+2.313.59 × 10−6
NFE2L2Transcription factorActivated+2.231.07 × 10−5
MYCNTranscription factorActivated+2.003.85 × 10−5
HSF1Transcription factorActivated+2.001.33 × 10−3
Table 5. List of primers for real-time PCR.
Gene5′-Forward-3′5′-Reverse-3′
GSTM3TTGAGGCTTTGGAGAAAATCTGAAAAGAGCAAAGCAAGAG
HSP90AA1ATATCACAGGTGAGACCAAGGTGACTGACACTAAAGTCTTC
HSP90AB1TCTATTACATCACTGGTGAGAGCTCTTCCCATCAAATTCCTTG
PSMB4ACGCTGATTTCCAGTATTTGCCATGAATGAATAGCTCTAGG
PSMD1CCAGTTATTGGATAACCCAGCTCCAATAGAGAGTGGTTTG
USP14AGCCCTTAGAGATTTGTTTGATCCTGTTGAAGATACTGTCC
PKM1GAGGCAGCCATGTTCCACTGCCAGACTCCGTCAGAACT
PKM2CAGAGGCTGCCATCTACCACCCAGACTTGGTGAGGACGAT
PRDX1GGGTCAATACACCTAAGAAACCTTCATCAGCCTTTAAGACC
18S rRNACAGAAGGATGTAAAGGATGGTATTTCTTCTTGGACACACC

