Sonic Hedgehog Medulloblastoma Cancer Stem Cells Mirnome and Transcriptome Highlight Novel Functional Networks

 , , , , ,
  , , ,
, , ,  ,
,  and
and
Abstract
1. Introduction
2. Results and Discussion
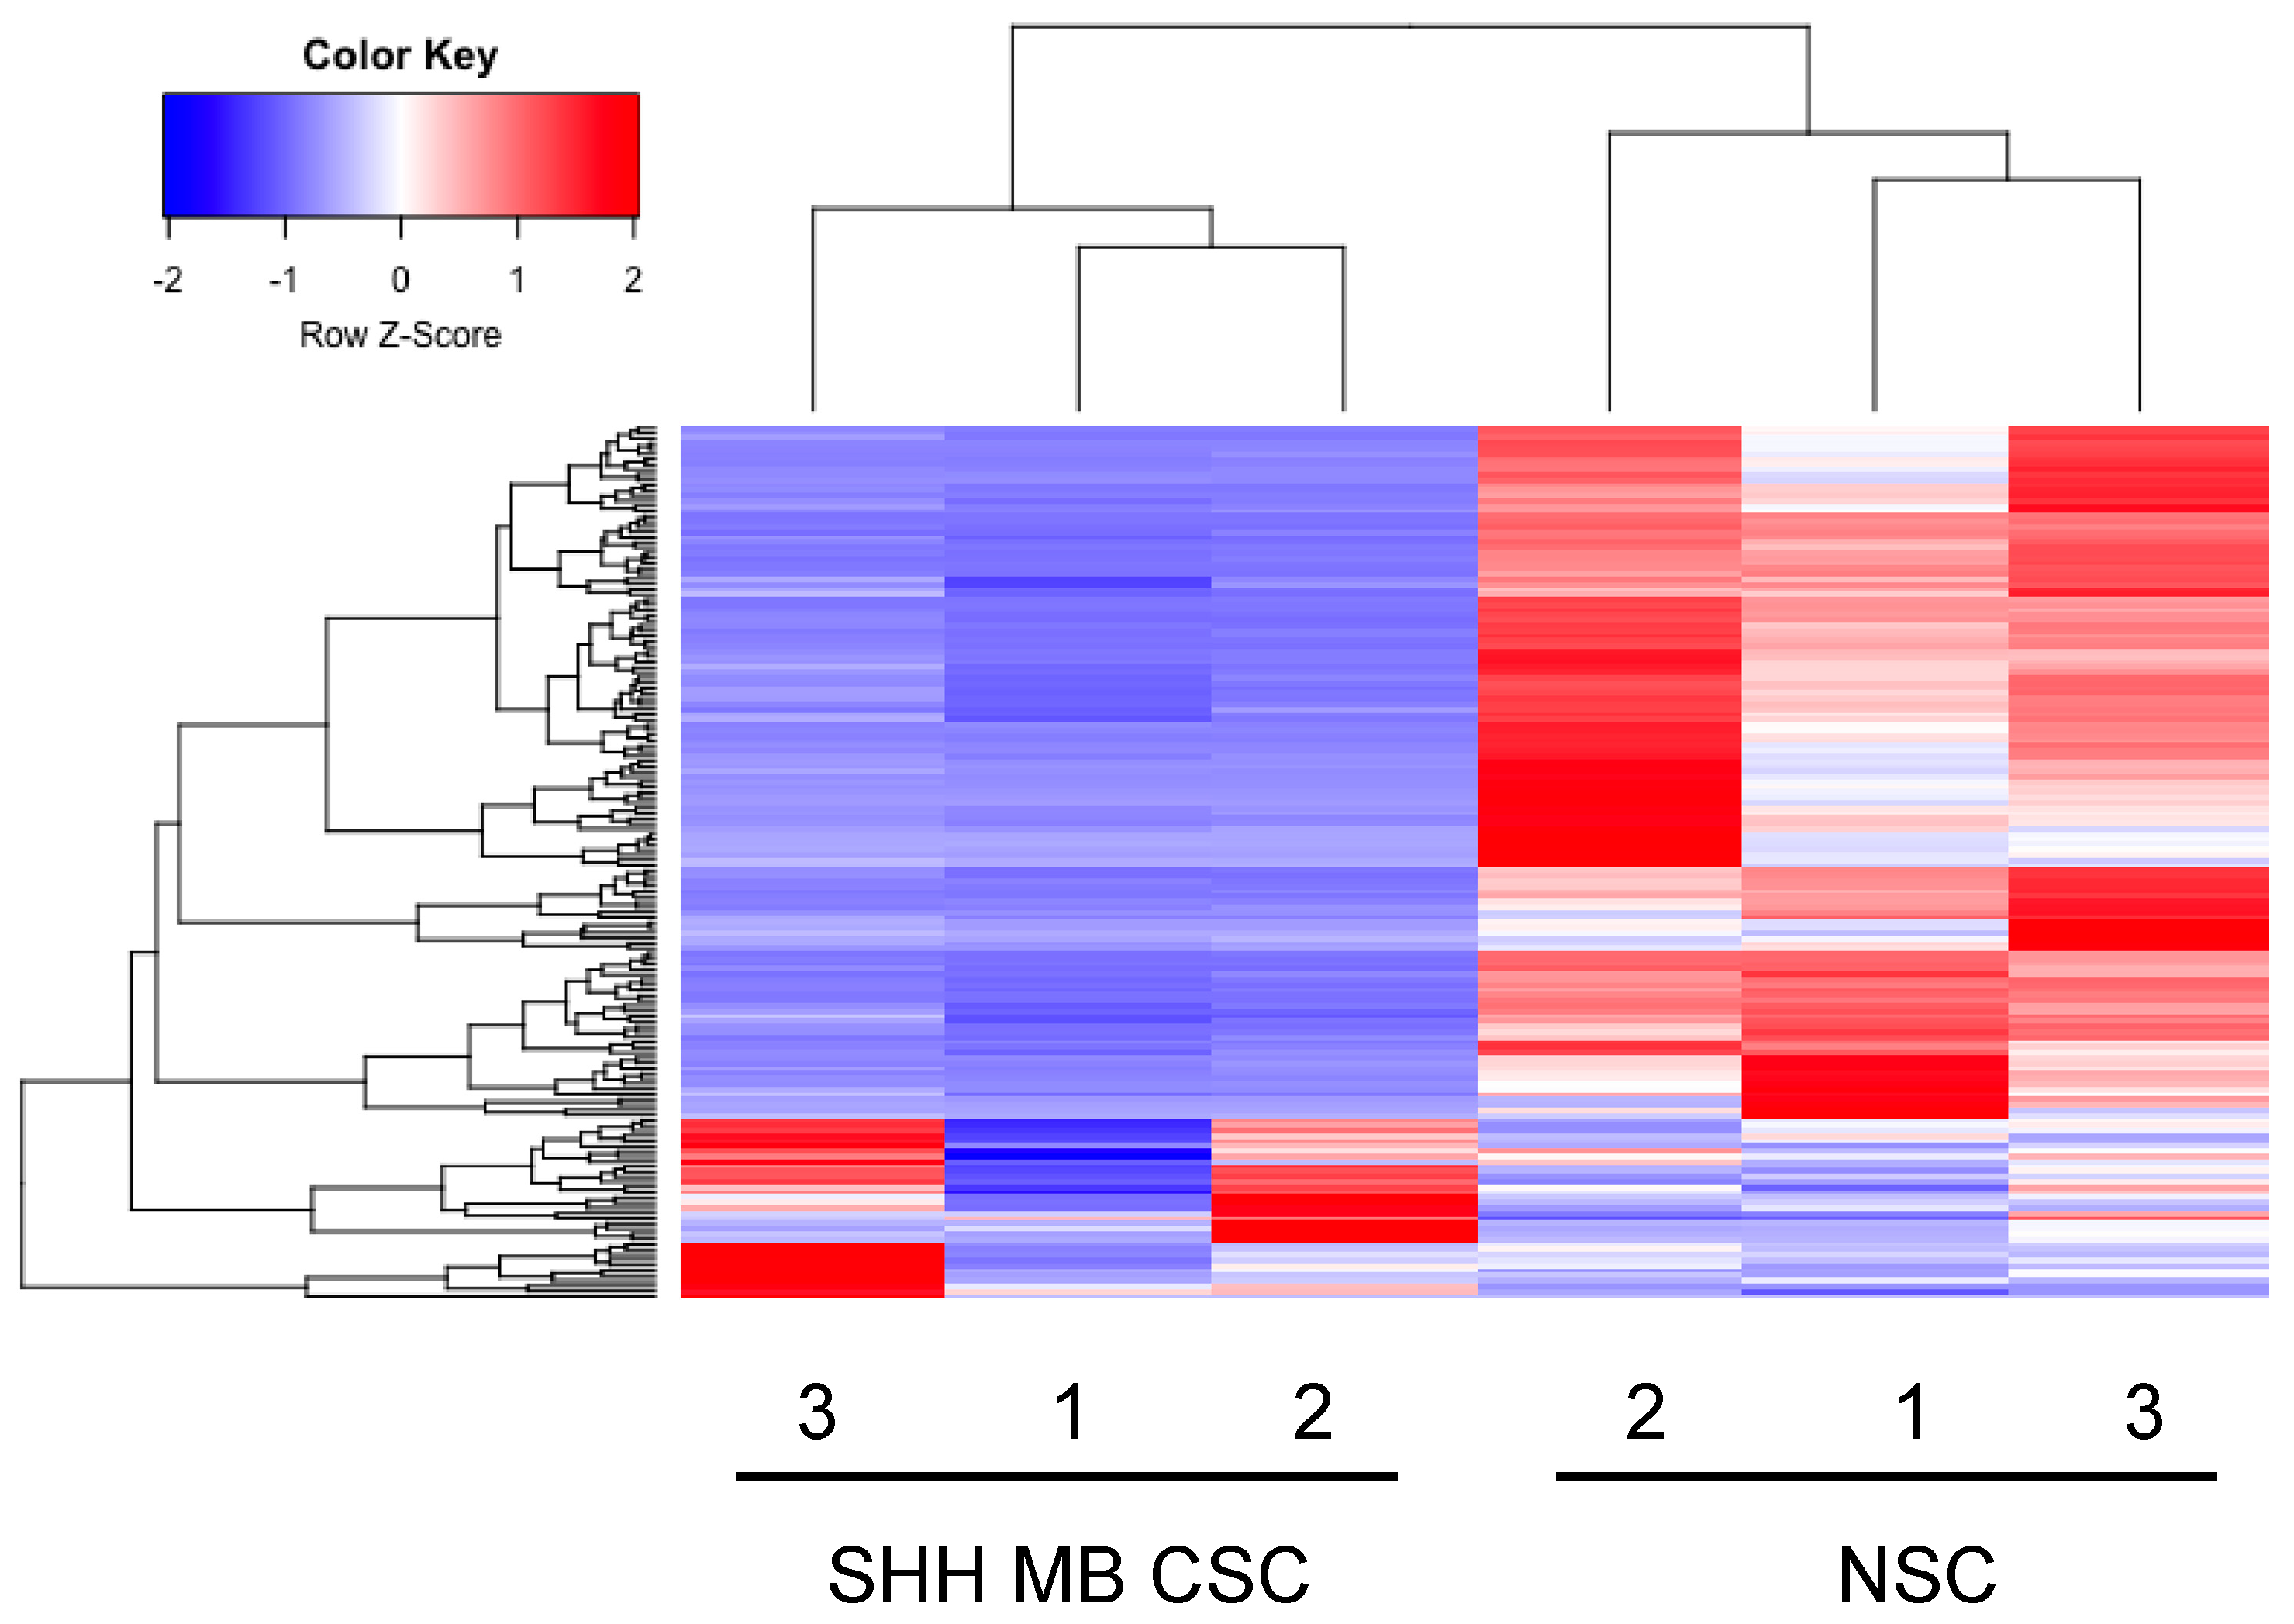
2.1. miRNA-Sequencing Determines miRNA Signatures in SHH MB CSCs
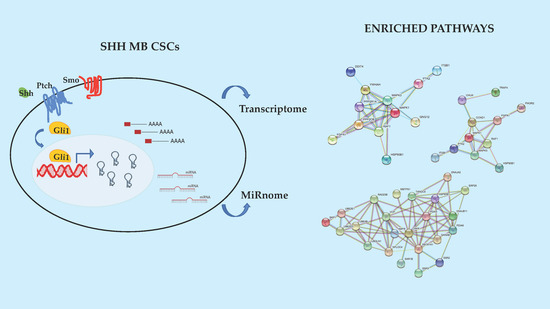
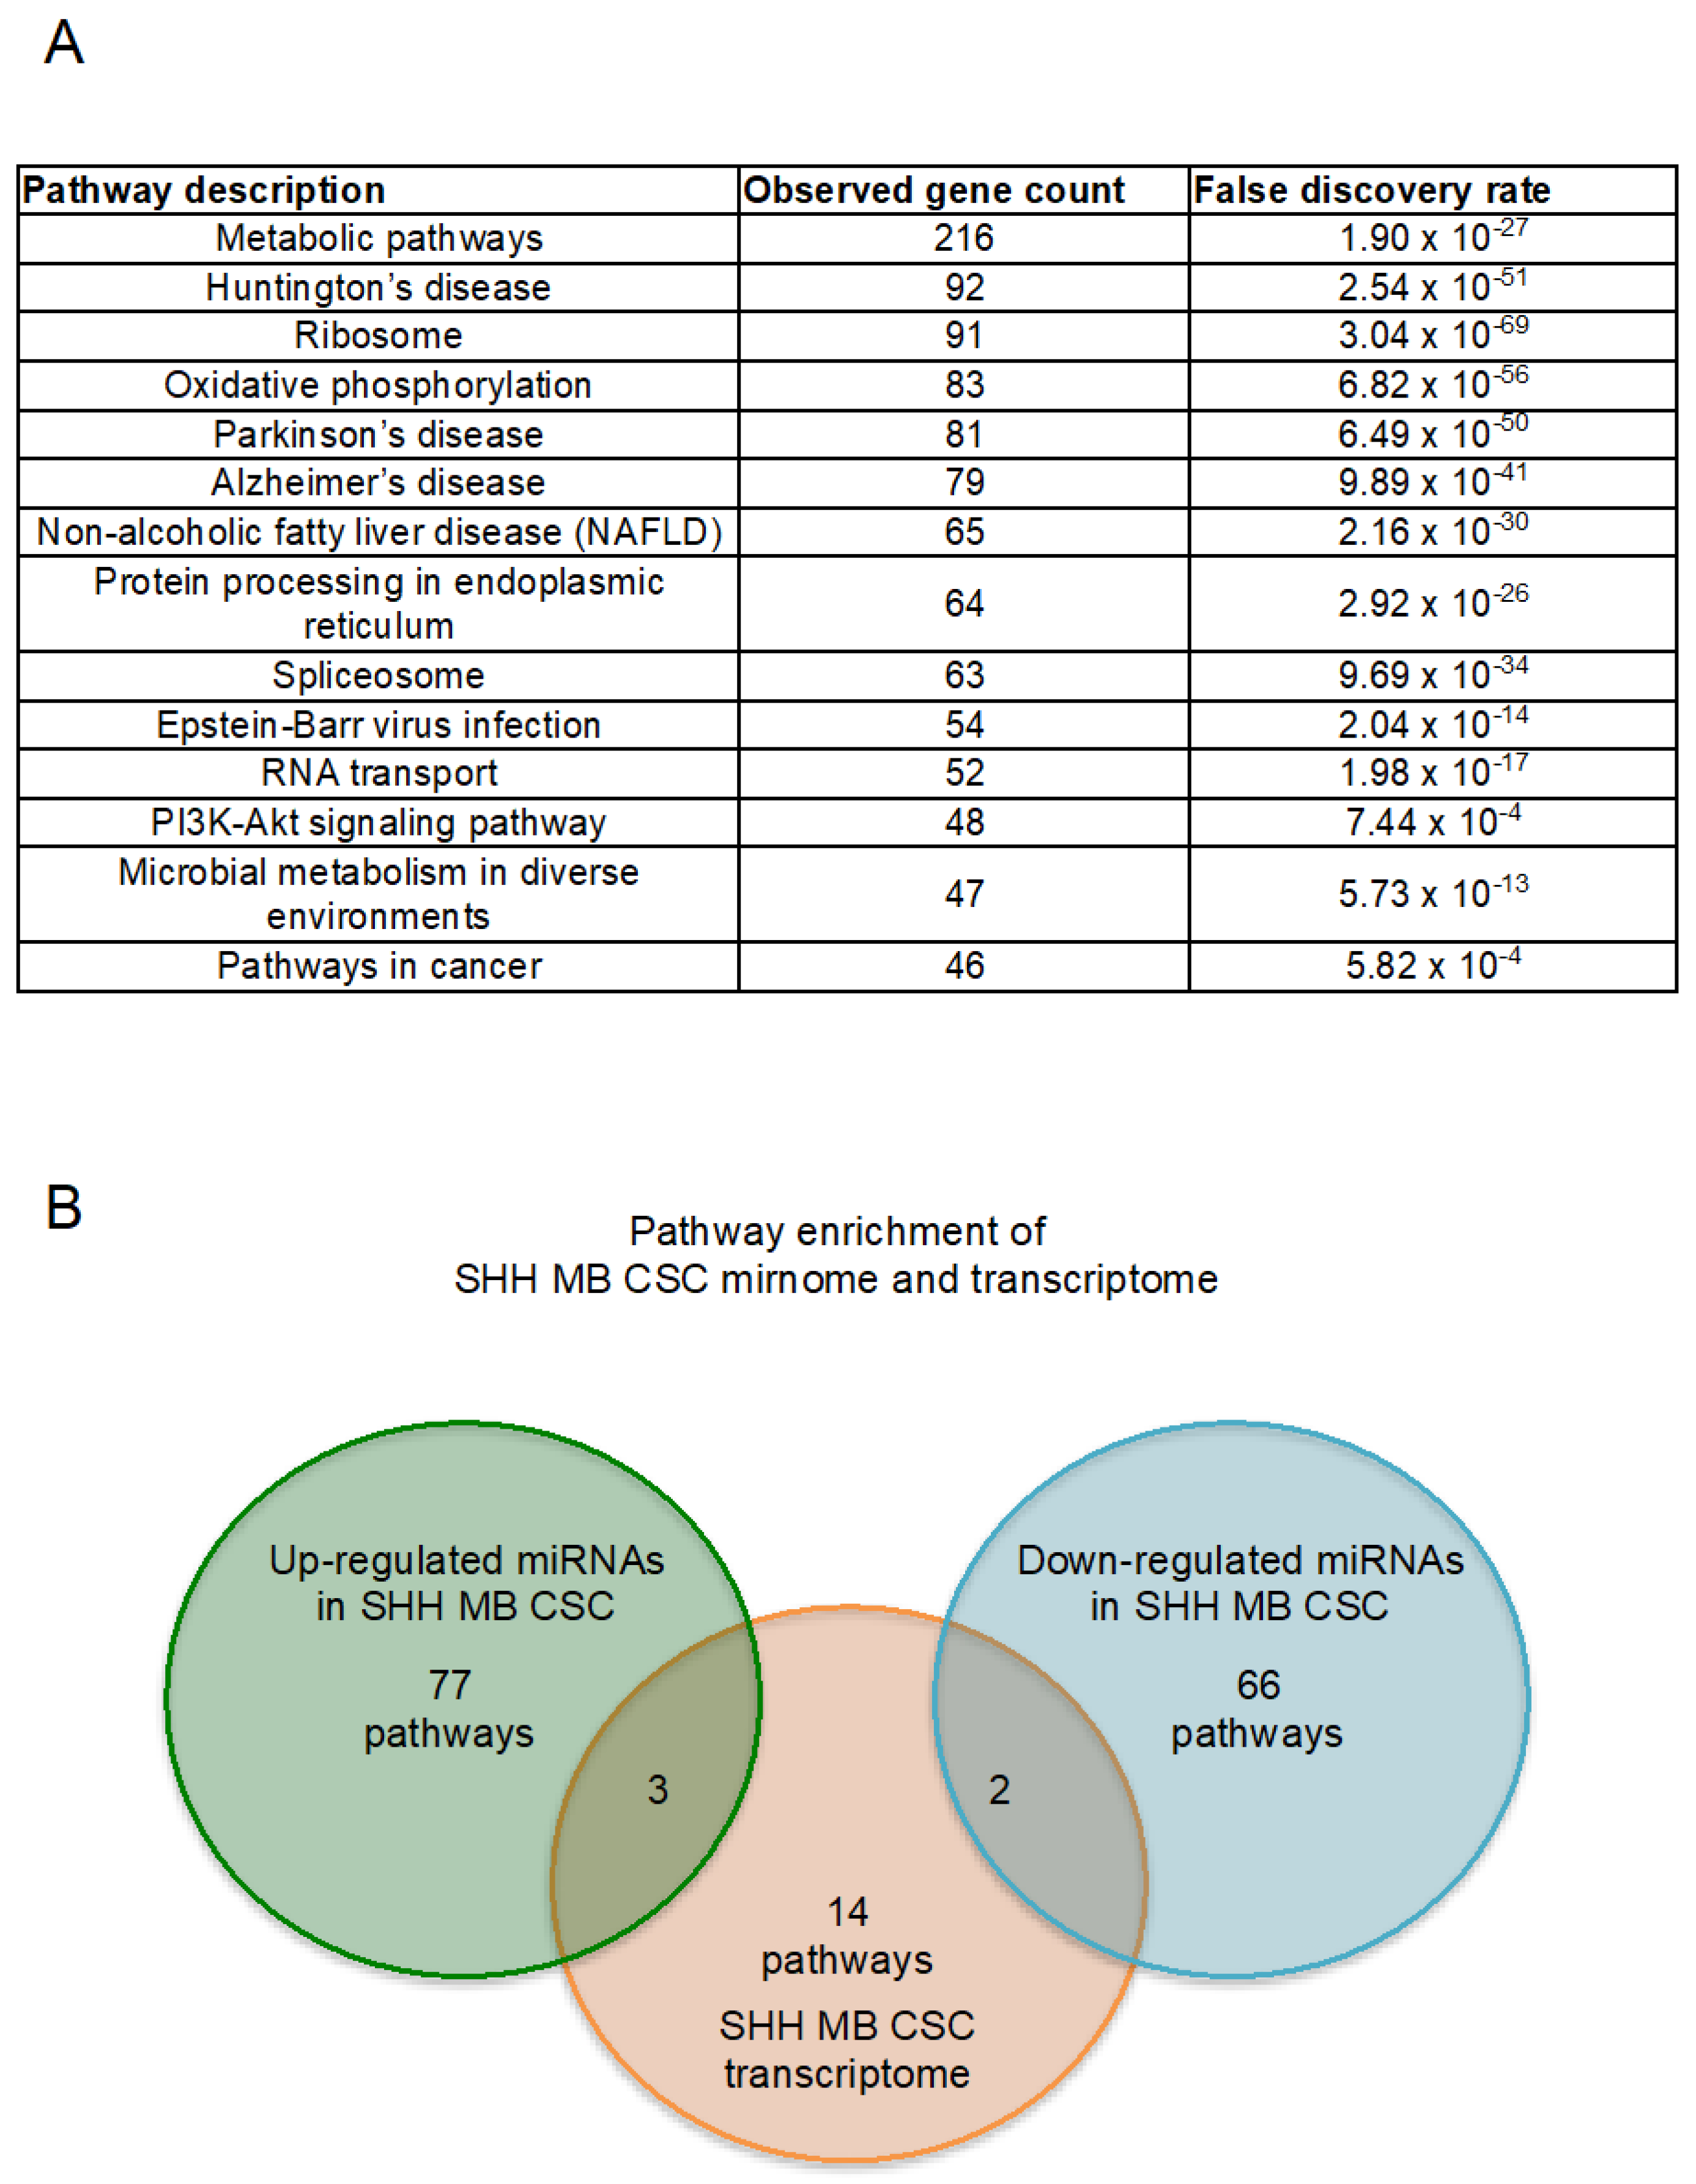
2.2. Enriched Pathway Analysis of SHH MB CSCs Transcriptome and Mirnome
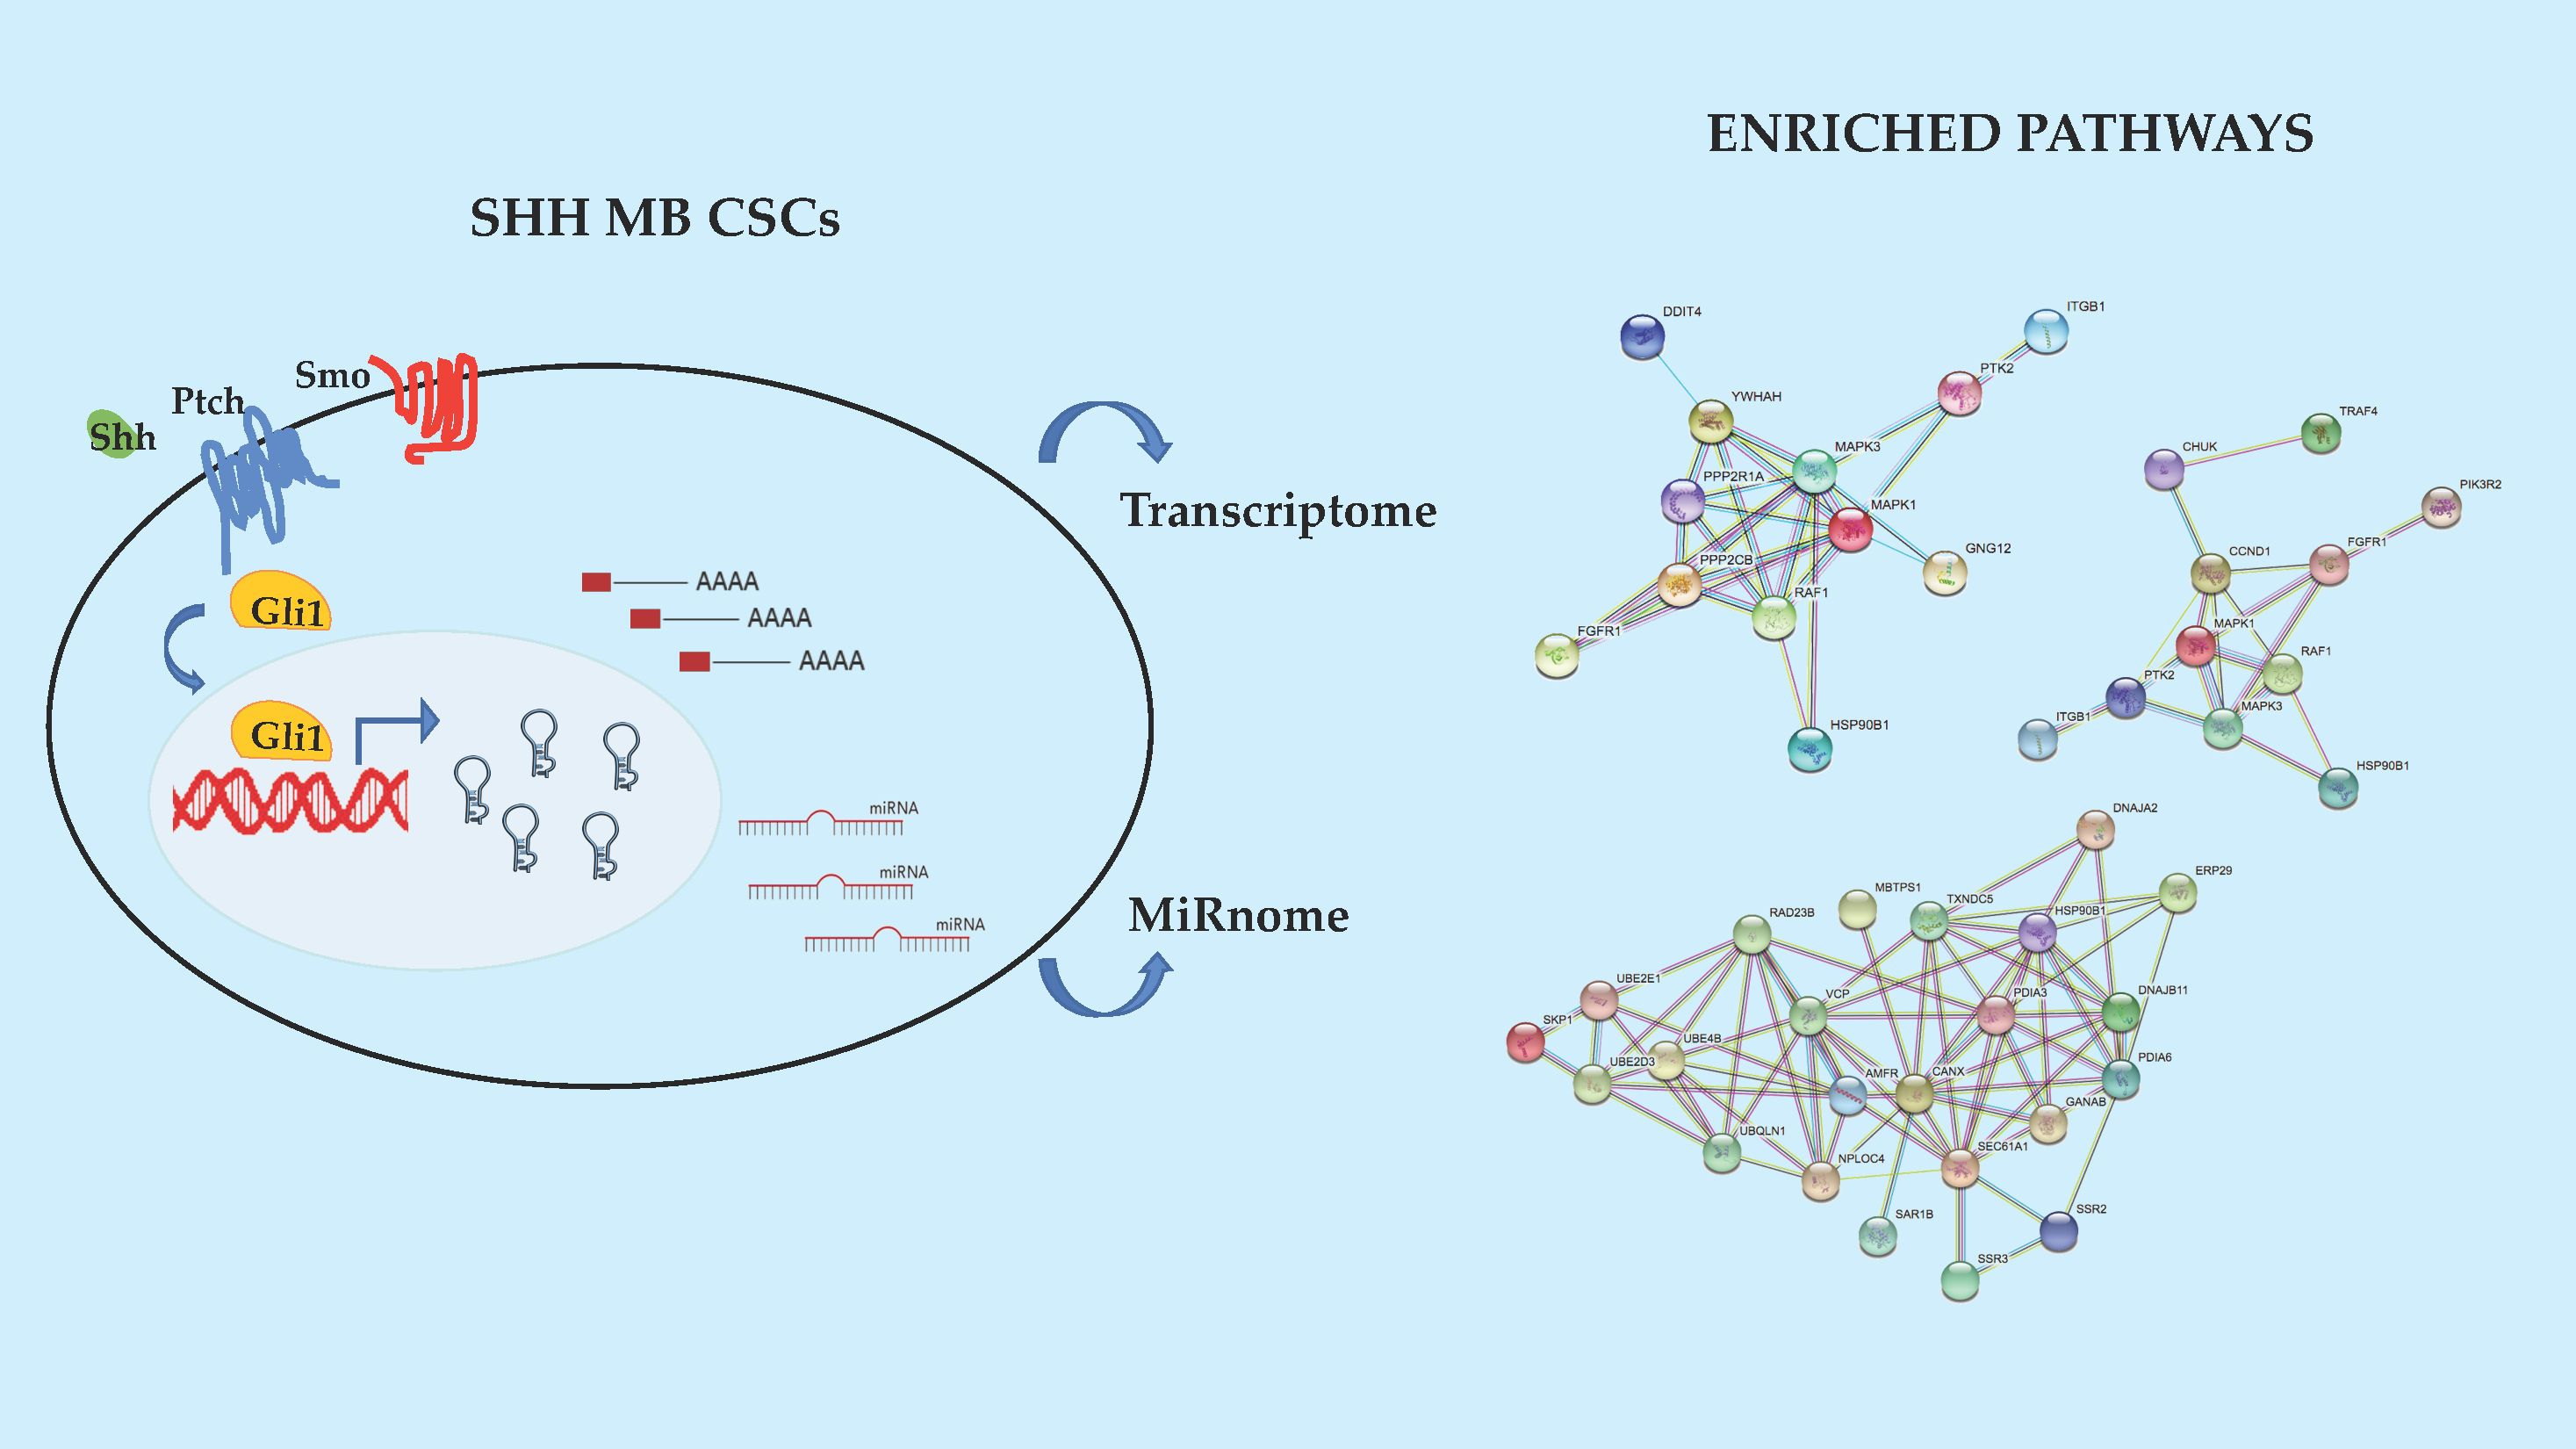
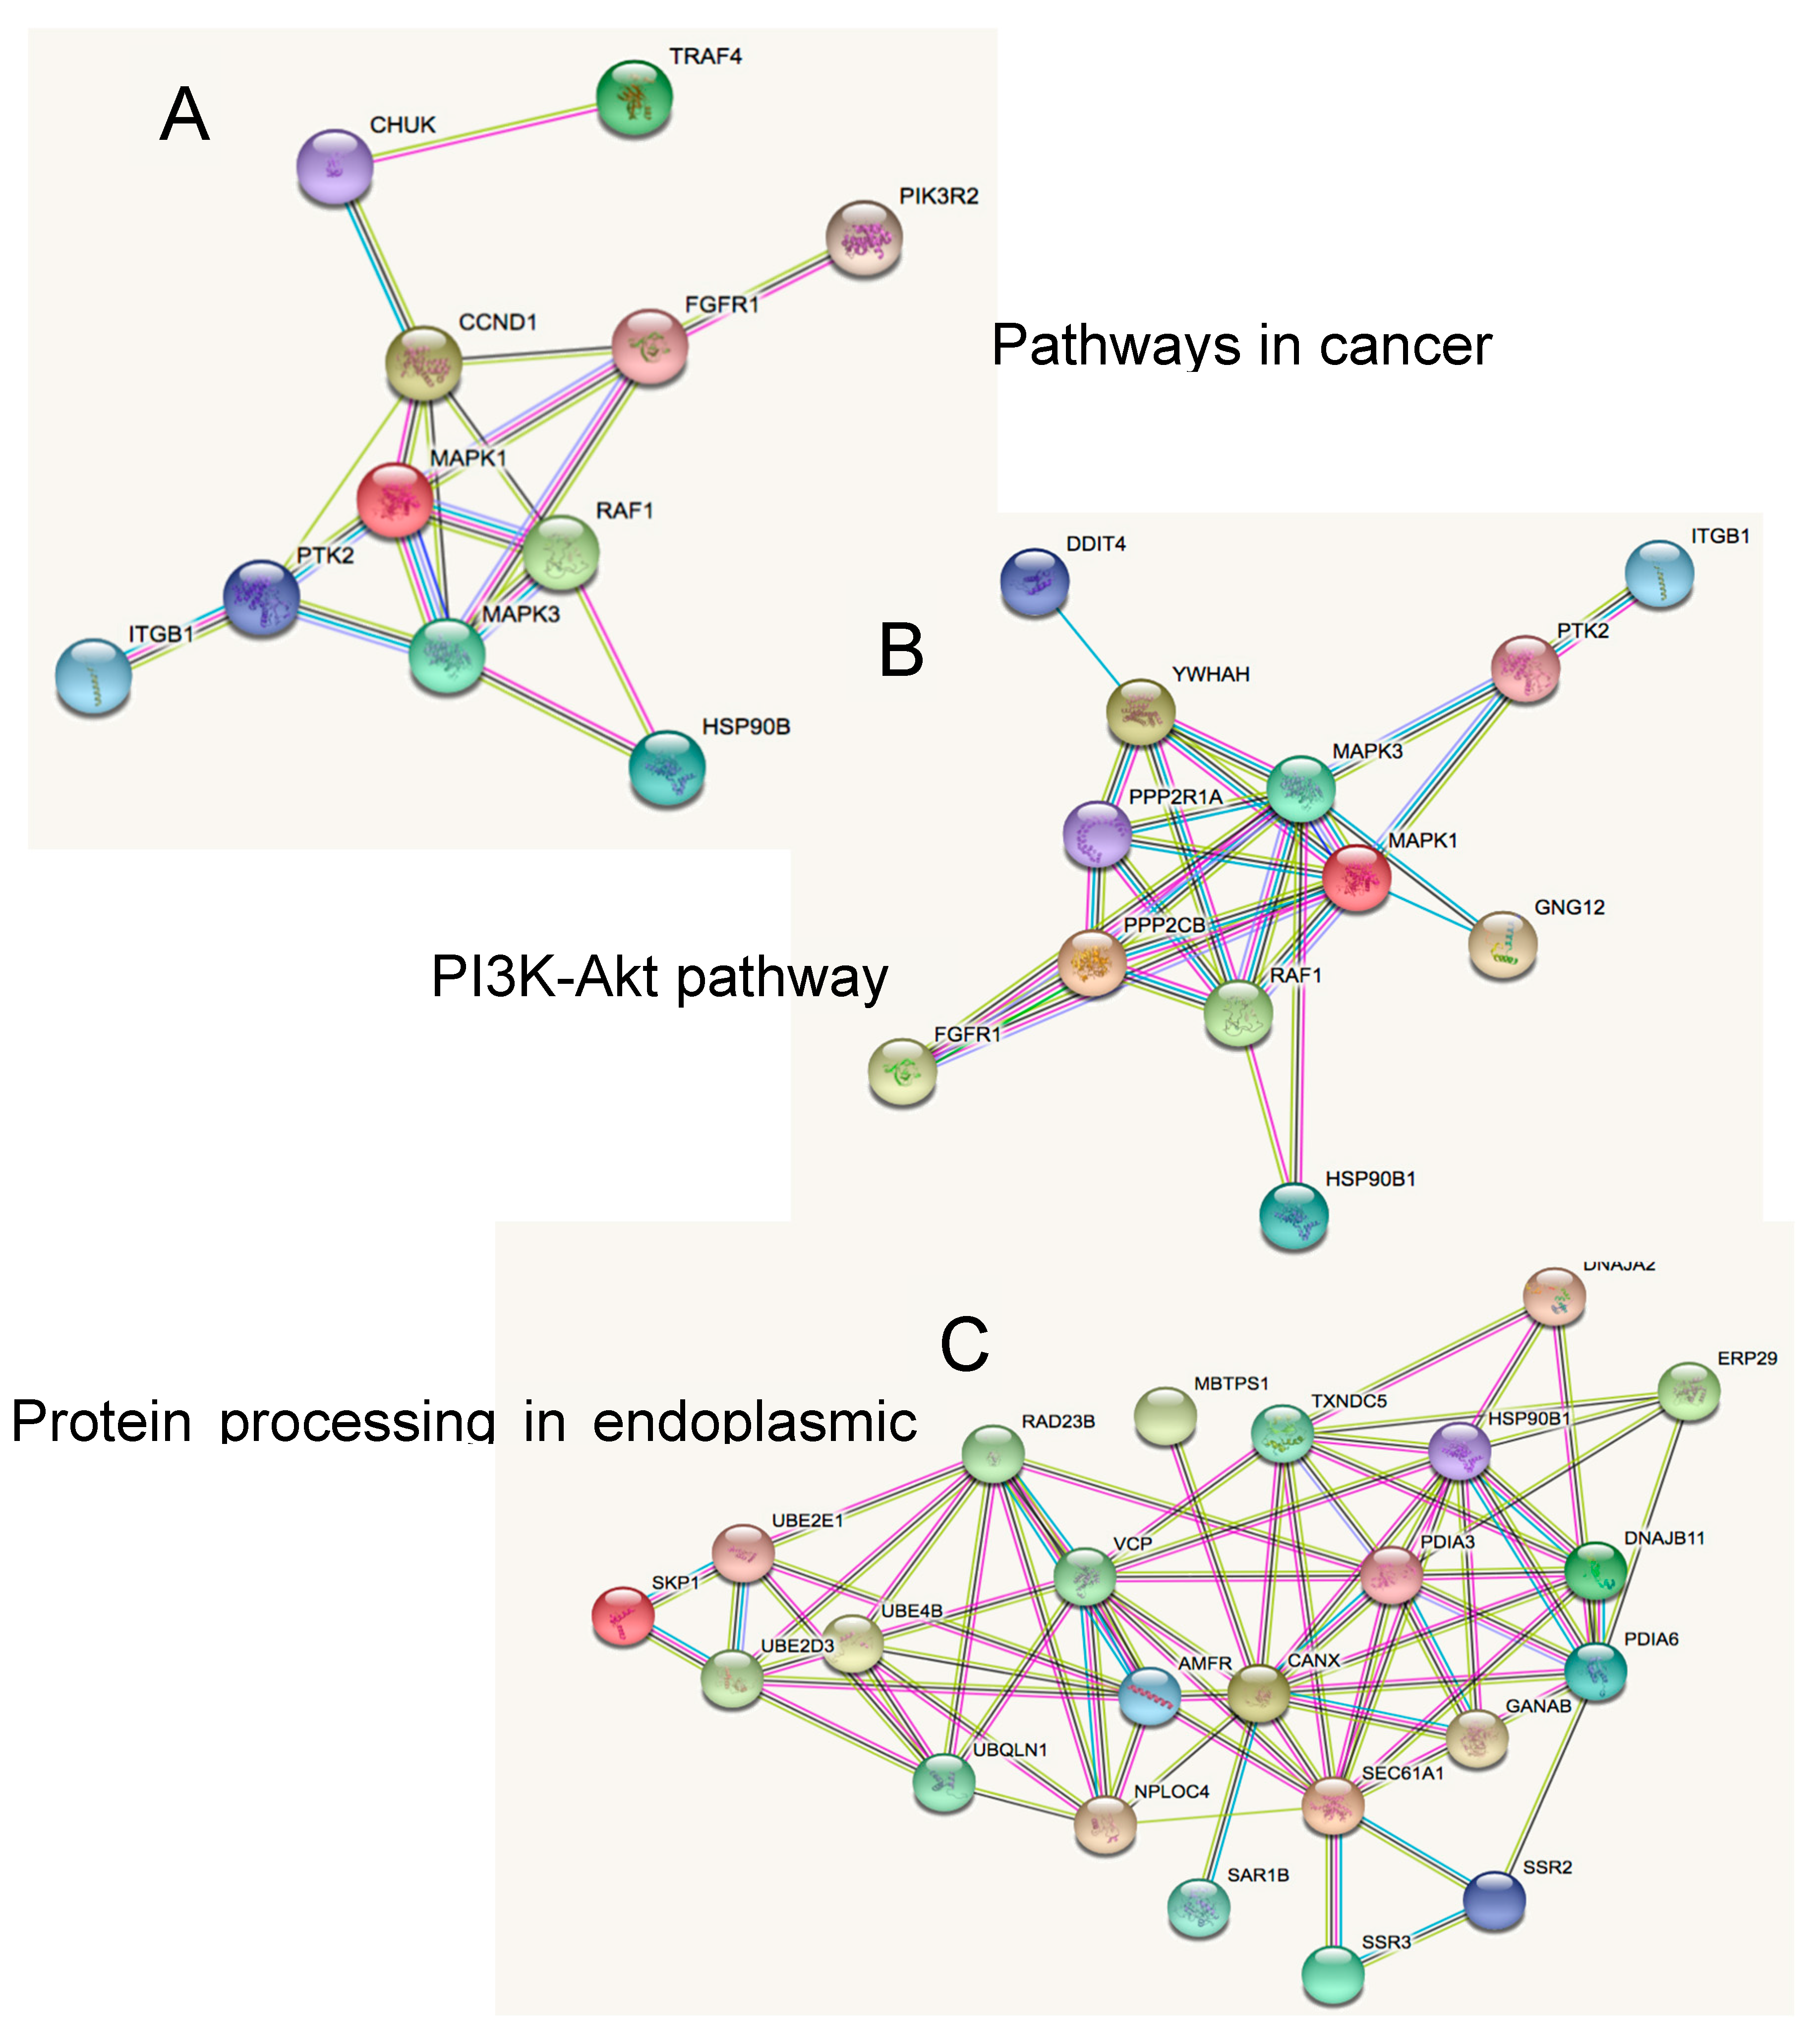
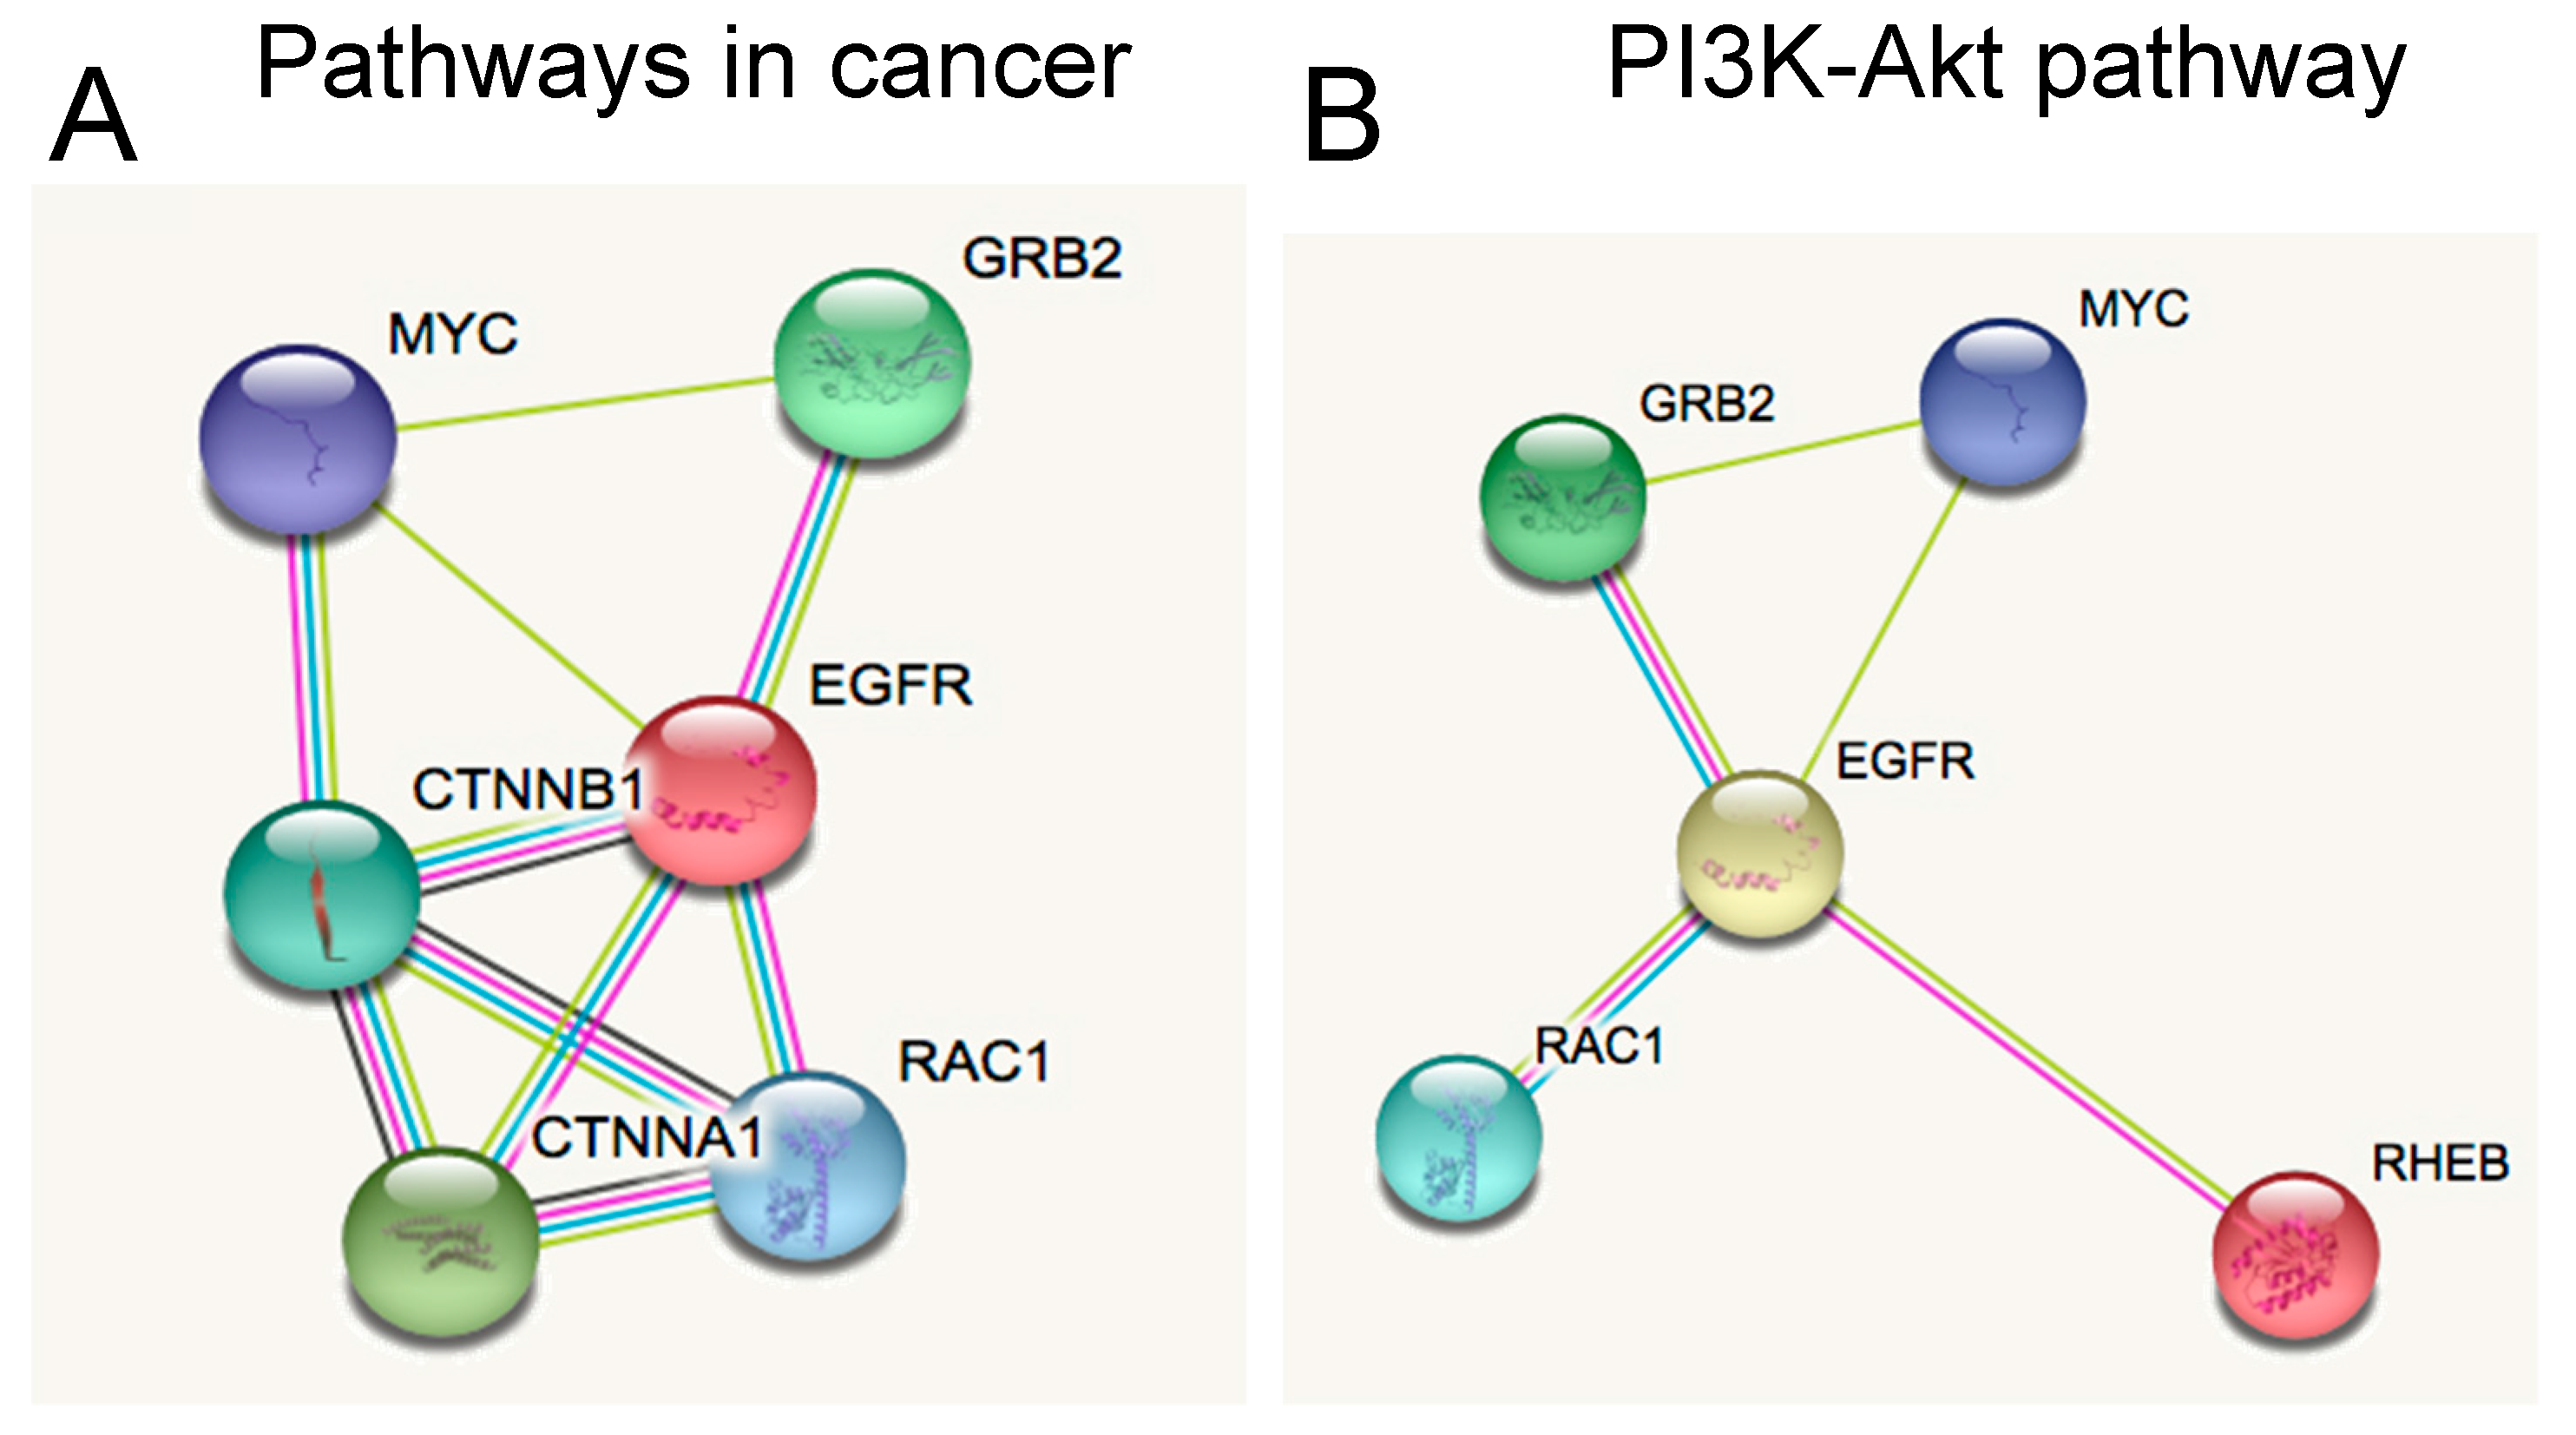
2.3. Novel Functional Networks in SHH MB CSCs
3. Materials and Methods
3.1. SHH MB CSCs and NSCs
3.2. miRNA-Sequencing
3.3. mRNA-Sequencing
3.4. RNA Extraction and Gene Expression Analysis
3.5. Pathway Enrichment Analysis
3.6. miRNA Putative Targets
3.7. Functional Networks
3.8. In Silico Analysis of SHH MB Patients’ Overall Survival
4. Conclusions
Supplementary Materials
Author Contributions
Acknowledgments
Conflicts of Interest
References
- Northcott, P.A.; Buchhalter, I.; Morrissy, A.S.; Hovestadt, V.; Weischenfeldt, J.; Ehrenberger, T.; Gröbner, S.; Segura-Wang, M.; Zichner, T.; Rudneva, V.A. The whole-genome landscape of medulloblastoma subtypes. Nature 2017, 547, 311–317. [Google Scholar] [CrossRef] [PubMed]
- Cavalli, F.M.; Remke, M.; Rampasek, L.; Peacock, J.; Shih, D.J.; Luu, B.; Garzia, L.; Torchia, J.; Nor, C.; Morrissy, A.S. Intertumoral heterogeneity within medulloblastoma subgroups. Cancer Cell 2017, 31, 737–754.e6. [Google Scholar] [CrossRef] [PubMed]
- Morrissy, A.S.; Cavalli, F.M.; Remke, M.; Ramaswamy, V.; Shih, D.J.; Holgado, B.L.; Farooq, H.; Donovan, L.K.; Garzia, L.; Agnihotri, S. Spatial heterogeneity in medulloblastoma. Nat. Genet. 2017, 49, 780. [Google Scholar] [CrossRef] [PubMed]
- Northcott, P.; Shih, D.J.; Peacock, J.; Garzia, L.; Morrissy, A.; Zichner, T.; Stütz, A.; Korshunov, A.; Reimand, J.; Schumacher, S.; Beroukhim, R. Subgroup-specific structural variation across 1000 medulloblastoma genomes. Nature 2012, 488, 49–56. [Google Scholar] [CrossRef] [PubMed]
- Ferretti, E.; Di Marcotullio, L.; Gessi, M.; Mattei, T.; Greco, A.; Po, A.; De Smaele, E.; Giangaspero, F.; Riccardi, R.; Di Rocco, C.; et al. Alternative splicing of the ErbB-4 cytoplasmic domain and its regulation by hedgehog signaling identify distinct medulloblastoma subsets. Oncogene 2006, 25, 7267–7273. [Google Scholar] [CrossRef] [PubMed]
- Louis, D.N.; Perry, A.; Reifenberger, G.; Von Deimling, A.; Figarella-Branger, D.; Cavenee, W.K.; Ohgaki, H.; Wiestler, O.D.; Kleihues, P.; Ellison, D.W. The 2016 World Health Organization classification of tumors of the central nervous system: A summary. Acta Neuropathol. 2016, 131, 803–820. [Google Scholar] [CrossRef] [PubMed]
- Rimkus, T.K.; Carpenter, R.L.; Qasem, S.; Chan, M.; Lo, H.-W. Targeting the sonic hedgehog signaling pathway: Review of smoothened and GLI inhibitors. Cancers 2016, 8, 22. [Google Scholar] [CrossRef] [PubMed]
- De Smaele, E.; Ferretti, E.; Gulino, A. Vismodegib, a small-molecule inhibitor of the hedgehog pathway for the treatment of advanced cancers. Curr. Opin. Investig. Drugs 2010, 11, 707–718. [Google Scholar] [PubMed]
- Von Hoff, D.D.; LoRusso, P.M.; Rudin, C.M.; Reddy, J.C.; Yauch, R.L.; Tibes, R.; Weiss, G.J.; Borad, M.J.; Hann, C.L.; Brahmer, J.R. Inhibition of the hedgehog pathway in advanced basal-cell carcinoma. N. Engl. J. Med. 2009, 361, 1164–1172. [Google Scholar] [CrossRef] [PubMed]
- Basset-Seguin, N.; Sharpe, H.J.; de Sauvage, F.J. Efficacy of Hedgehog pathway inhibitors in basal cell carcinoma. Mol. Cancer Ther. 2015, 14, 633–641. [Google Scholar] [CrossRef] [PubMed]
- Bendell, J.; Andre, V.; Ho, A.; Kudchadkar, R.; Migden, M.; Infante, J.; Tiu, R.V.; Pitou, C.; Tucker, T.; Brail, L. Phase I Study of LY2940680, a Smo Antagonist, in Patients with Advanced Cancer Including Treatment-Naïve and Previously Treated Basal Cell Carcinoma. Clin. Cancer Res. 2018, 24, 2082–2091. [Google Scholar] [CrossRef] [PubMed]
- Yauch, R.; Dijkgraaf, G.; Alicke, B.; Januario, T.; Ahn, C.; Holcomb, T.; Pujara, K.; Stinson, J.; Callahan, C.; Tang, T.; et al. Smoothened mutation confers resistance to a Hedgehog pathway inhibitor in medulloblastoma. Science 2009, 326, 572–574. [Google Scholar] [CrossRef] [PubMed]
- Ransohoff, K.; Sarin, K.; Tang, J. Smoothened Inhibitors in Sonic Hedgehog Subgroup Medulloblastoma. J. Clin. Oncol. 2015, 33, 2692–2694. [Google Scholar] [CrossRef] [PubMed]
- Brechbiel, J.; Miller-Moslin, K.; Adjei, A.A. Crosstalk between hedgehog and other signaling pathways as a basis for combination therapies in cancer. Cancer Treat. Rev. 2014, 40, 750–759. [Google Scholar] [CrossRef] [PubMed]
- Li, Q.-R.; Zhao, H.; Zhang, X.-S.; Lang, H.; Yu, K. Novel-smoothened inhibitors for therapeutic targeting of naïve and drug-resistant hedgehog pathway-driven cancers. Acta Pharmacol. Sin. 2018, 1. [Google Scholar] [CrossRef] [PubMed]
- Bjerkvig, R.; Tysnes, B.B.; Aboody, K.S.; Najbauer, J.; Terzis, A. The origin of the cancer stem cell: Current controversies and new insights. Nat. Rev. Cancer 2005, 5, 899. [Google Scholar] [CrossRef] [PubMed]
- Singh, S.K.; Hawkins, C.; Clarke, I.D.; Squire, J.A.; Bayani, J.; Hide, T.; Henkelman, R.M.; Cusimano, M.D.; Dirks, P.B. Identification of human brain tumour initiating cells. Nature 2004, 432, 396–401. [Google Scholar] [CrossRef] [PubMed]
- Wu, X.; Northcott, P.A.; Croul, S.; Taylor, M.D. Mouse models of medulloblastoma. Chin. J. Cancer 2011, 30, 442. [Google Scholar] [CrossRef] [PubMed]
- Goodrich, L.V.; Milenković, L.; Higgins, K.M.; Scott, M.P. Altered neural cell fates and medulloblastoma in mouse patched mutants. Science 1997, 277, 1109–1113. [Google Scholar] [CrossRef] [PubMed]
- Po, A.; Ferretti, E.; Miele, E.; De Smaele, E.; Paganelli, A.; Canettieri, G.; Coni, S.; Di Marcotullio, L.; Biffoni, M.; Massimi, L.; et al. Hedgehog controls neural stem cells through p53-independent regulation of Nanog. EMBO J. 2010, 29, 2646–2658. [Google Scholar] [CrossRef] [PubMed]
- Ronci, M.; Catanzaro, G.; Pieroni, L.; Po, A.; Besharat, Z.M.; Greco, V.; Levi Mortera, S.; Screpanti, I.; Ferretti, E.; Urbani, A. Proteomic analysis of human sonic hedgehog (SHH) medulloblastoma stem-like cells. Mol. Biosyst. 2015, 11, 1603–1611. [Google Scholar] [CrossRef] [PubMed]
- Catanzaro, G.; Besharat, Z.M.; Garg, N.; Ronci, M.; Pieroni, L.; Miele, E.; Mastronuzzi, A.; Carai, A.; Alfano, V.; Po, A.; et al. microRNAs-proteomic networks characterizing human medulloblastoma-SLCs. Stem Cells Int. 2016, 2016. [Google Scholar] [CrossRef] [PubMed]
- Miele, E.; Valente, S.; Alfano, V.; Silvano, M.; Mellini, P.; Borovika, D.; Marrocco, B.; Po, A.; Besharat, Z.M.; Catanzaro, G. The histone methyltransferase EZH2 as a druggable target in SHH medulloblastoma cancer stem cells. Oncotarget 2017, 8, 68557. [Google Scholar] [CrossRef] [PubMed]
- Gulino, A.; Ferretti, E.; De Smaele, E. Hedgehog signalling in colon cancer and stem cells. EMBO Mol. Med. 2009, 1, 300–302. [Google Scholar] [CrossRef] [PubMed]
- Po, A.; Silvano, M.; Miele, E.; Capalbo, C.; Eramo, A.; Salvat, i. V.; Todaro, M.; Besharat, Z.M.; Catanzaro, G.; Cucchi, D.; et al. Noncanonical GLI1 signalling promotes stemness features and in vivo growth in lung adenocarcinoma. Oncogene 2017, 36, 4641–4652. [Google Scholar] [CrossRef] [PubMed]
- Besharat, Z.M.; Abballe, L.; Cicconardi, F.; Bhutkar, A.; Grassi, L.; Le Pera, L.; Moretti, M.; Chinappi, M.; D’Andrea, D.; Mastronuzzi, A.; et al. Foxm1 controls a pro-stemness microRNA network in neural stem cells. Sci. Rep. 2018, 8, 3523. [Google Scholar] [CrossRef] [PubMed]
- Ferretti, E.; De Smaele, E.; Miele, E.; Laneve, P.; Po, A.; Pelloni, M.; Paganelli, A.; Di Marcotullio, L.; Caffarelli, E.; Screpanti, I.; et al. Concerted microRNA control of Hedgehog signalling in cerebellar neuronal progenitor and tumour cells. EMBO J. 2008, 27, 2616–2627. [Google Scholar] [CrossRef] [PubMed]
- Ferretti, E.; De Smaele, E.; Po, A.; Di Marcotullio, L.; Tosi, E.; Espinola, M.S.B.; Di Rocco, C.; Riccardi, R.; Giangaspero, F.; Farcomeni, A.; et al. MicroRNA profiling in human medulloblastoma. Int. J. Cancer 2009, 124, 568–577. [Google Scholar] [CrossRef] [PubMed]
- Uziel, T.; Karginov, F.V.; Xie, S.; Parker, J.S.; Wang, Y.-D.; Gajjar, A.; He, L.; Ellison, D.; Gilbertson, R.J.; Hannon, G. The miR-17∼92 cluster collaborates with the Sonic Hedgehog pathway in medulloblastoma. Proc. Natl. Acad. Sci. USA 2009, 106, 2812–2817. [Google Scholar] [CrossRef] [PubMed]
- Northcott, P.A.; Fernandez-L, A.; Hagan, J.P.; Ellison, D.W.; Grajkowska, W.; Gillespie, Y.; Grundy, R.; Van Meter, T.; Rutka, J.T.; Croce, C.M.; et al. The miR-17/92 polycistron is up-regulated in Sonic Hedgehog–driven medulloblastomas and induced by N-myc in Sonic Hedgehog–treated cerebellar neural precursors. Cancer Res. 2009, 69, 3249–3255. [Google Scholar] [CrossRef] [PubMed]
- Murphy, B.L.; Obad, S.; Bihannic, L.; Ayrault, O.; Zindy, F.; Kauppinen, S.; Roussel, M.F. Silencing of the miR-17∼ 92 cluster family inhibits medulloblastoma progression. Cancer Res. 2013, 73, 7068–7078. [Google Scholar] [CrossRef] [PubMed]
- Tech, K.; Gershon, T.R. Energy metabolism in neurodevelopment and medulloblastoma. Transl. Pediatr. 2015, 4, 12. [Google Scholar] [PubMed]
- Clarke, H.J.; Chambers, J.E.; Liniker, E.; Marciniak, S.J. Endoplasmic reticulum stress in malignancy. Cancer Cell 2014, 25, 563–573. [Google Scholar] [CrossRef] [PubMed]
- Hartmann, W.; Digon-Söntgerath, B.; Koch, A.; Waha, A.; Endl, E.; Dani, I.; Denkhaus, D.; Goodyer, C.G.; Sörensen, N.; Wiestler, O.D. Phosphatidylinositol 3′-kinase/AKT signaling is activated in medulloblastoma cell proliferation and is associated with reduced expression of PTEN. Clin. Cancer Res. 2006, 12, 3019–3027. [Google Scholar] [CrossRef] [PubMed]
- Hambardzumyan, D.; Becher, O.J.; Rosenblum, M.K.; Pandolfi, P.P.; Manova-Todorova, K.; Holland, E.C. PI3K pathway regulates survival of cancer stem cells residing in the perivascular niche following radiation in medulloblastoma in vivo. Genes Dev. 2008, 22, 436–448. [Google Scholar] [CrossRef] [PubMed]
- Mohan, A.L.; Friedman, M.D.; Ormond, D.R.; Tobias, M.; Murali, R.; Jhanwar-Uniyal, M. PI3K/mTOR signaling pathways in medulloblastoma. Anticancer Res. 2012, 32, 3141–3146. [Google Scholar] [PubMed]
- Crespo, S.; Kind, M.; Arcaro, A. The role of the PI3K/AKT/mTOR pathway in brain tumor metastasis. J. Cancer Metastasis Treat. 2016, 2, 81. [Google Scholar] [CrossRef]
- Frasson, C.; Rampazzo, E.; Accordi, B.; Beggio, G.; Pistollato, F.; Basso, G.; Persano, L. Inhibition of PI3K signalling selectively affects medulloblastoma cancer stem cells. BioMed Res. Int. 2015, 2015, 973912. [Google Scholar] [CrossRef] [PubMed]
- Buonamici, S.; Williams, J.; Morrissey, M.; Wang, A.; Guo, R.; Vattay, A.; Hsiao, K.; Yuan, J.; Green, J.; Ospina, B. Interfering with resistance to smoothened antagonists by inhibition of the PI3K pathway in medulloblastoma. Sci. Transl. Med. 2010, 2, 51ra70. [Google Scholar] [CrossRef] [PubMed]
- Thomson, D.W.; Dinger, M.E. Endogenous microRNA sponges: Evidence and controversy. Nat. Rev. Genet. 2016, 17, 272. [Google Scholar] [CrossRef] [PubMed]
- Pasquinelli, A.E. MicroRNAs and their targets: Recognition, regulation and an emerging reciprocal relationship. Nat. Rev. Genet. 2012, 13, 271. [Google Scholar] [CrossRef] [PubMed]
- MacDonald, T.J.; Brown, K.M.; LaFleur, B.; Peterson, K.; Lawlor, C.; Chen, Y.; Packer, R.J.; Cogen, P.; Stephan, D.A. Expression profiling of medulloblastoma: PDGFRA and the RAS/MAPK pathway as therapeutic targets for metastatic disease. Nat. Genet. 2001, 29, 143. [Google Scholar] [CrossRef] [PubMed]
- Zhao, X.; Ponomaryov, T.; Ornell, K.J.; Zhou, P.; Dabral, S.K.; Pak, E.; Li, W.; Atwood, S.X.; Whitson, R.J.; Chang, A.L.S. RAS/MAPK activation drives resistance to Smo inhibition, metastasis, and tumor evolution in Shh pathway–dependent tumors. Cancer Res. 2015, 75, 3623–3635. [Google Scholar] [CrossRef] [PubMed]
- Emmenegger, B.A.; Hwang, E.I.; Moore, C.; Markant, S.L.; Brun, S.N.; Dutton, J.W.; Read, T.-A.; Fogarty, M.P.; Singh, A.R.; Durden, D.L. Distinct roles for fibroblast growth factor signaling in cerebellar development and medulloblastoma. Oncogene 2013, 32, 4181. [Google Scholar] [CrossRef] [PubMed]
- Guessous, F.; Yang, Y.; Johnson, E.; Marcinkiewicz, L.; Smith, M.; Zhang, Y.; Kofman, A.; Schiff, D.; Christensen, J.; Abounader, R. Cooperation between c-Met and focal adhesion kinase family members in medulloblastoma and implications for therapy. Mol. Cancer Ther. 2012, 11, 288–297. [Google Scholar] [CrossRef] [PubMed]
- Tripolitsioti, D.; Kumar, K.S.; Neve, A.; Migliavacca, J.; Capdeville, C.; Rushing, E.J.; Ma, M.; Kijima, N.; Sharma, A.; Pruschy, M. MAP4K4 controlled integrin β1 activation and c-Met endocytosis are associated with invasive behavior of medulloblastoma cells. Oncotarget 2018, 9, 23220. [Google Scholar] [CrossRef] [PubMed]
- Hong, F.; Liu, B.; Chiosis, G.; Gewirth, D.T.; Li, Z. Alpha 7 helix region of αlpha I domain is crucial for integrin binding to ER chaperone gp96: A potential therapeutic target for cancer metastasis. J. Biol. Chem. 2013. [Google Scholar] [CrossRef] [PubMed]
- Usmani, S.Z.; Bona, R.D.; Chiosis, G.; Li, Z. The anti-myeloma activity of a novel purine scaffold HSP90 inhibitor PU-H71 is via inhibition of both HSP90A and HSP90B1. J. Hematol. Oncol. 2010, 3, 40. [Google Scholar] [CrossRef] [PubMed]
- Kool, M.; Korshunov, A.; Remke, M.; Jones, D.; Schlanstein, M.; Northcott, P.; Cho, Y.; Koster, J.; Schouten-van Meeteren, A.; van Vuurden, D.; et al. Molecular subgroups of medulloblastoma: An international meta-analysis of transcriptome, genetic aberrations, and clinical data of WNT, SHH, Group 3, and Group 4 medulloblastomas. Acta Neuropathol. 2012, 123, 473–484. [Google Scholar] [CrossRef] [PubMed]
- Northcott, P.; Jones, D.; Kool, M.; Robinson, G.; Gilbertson, R.; Cho, Y.; Pomeroy, S.; Korshunov, A.; Lichter, P.; Taylor, M.; et al. Medulloblastomics: The end of the beginning. Nat. Rev. Cancer 2012, 12, 818–834. [Google Scholar] [CrossRef] [PubMed]
- Włodarski, P.; Grajkowska, W.; Łojek, M.; Rainko, K.; Jóźwiak, J. Activation of Akt and Erk pathways in medulloblastoma. Folia Neuropathol. 2006, 44, 214–220. [Google Scholar] [PubMed]
- Polizio, A.H.; Chinchilla, P.; Chen, X.; Kim, S.; Manning, D.R.; Riobo, N.A. Heterotrimeric Gi proteins link Hedgehog signaling to activation of Rho small GTPases to promote fibroblast migration. J. Biol. Chem. 2011, 286, 19589–19596. [Google Scholar] [CrossRef] [PubMed]
- Ridgway, L.D.; Wetzel, M.D.; Marchetti, D. Heparanase modulates Shh and Wnt3a signaling in human medulloblastoma cells. Exp. Ther. Med. 2011, 2, 229–237. [Google Scholar] [CrossRef] [PubMed]
- Calin, G.A.; Ferracin, M.; Cimmino, A.; Di Leva, G.; Shimizu, M.; Wojcik, S.E.; Iorio, M.V.; Visone, R.; Sever, N.I.; Fabbri, M. A MicroRNA signature associated with prognosis and progression in chronic lymphocytic leukemia. N. Engl. J. Med. 2005, 353, 1793–1801. [Google Scholar] [CrossRef] [PubMed]
- Gajjar, A.; Bowers, D.; Karajannis, M.; Leary, S.; Witt, H.; Gottardo, N. Pediatric brain tumors: Innovative genomic information is transforming the diagnostic and clinical landscape. J. Clin. Oncol. 2015, 33, 2986. [Google Scholar] [CrossRef] [PubMed]
- Lassaletta, A. Medulloblastoma in infants: The never-ending challenge. Lancet Oncol. 2018, 19, 720–721. [Google Scholar] [CrossRef]
- Pandolfi, S.; Stecca, B. Cooperative integration between HEDGEHOG-GLI signalling and other oncogenic pathways: Implications for cancer therapy. Expert Rev. Mol. Med. 2015, 17. [Google Scholar] [CrossRef] [PubMed]
- Götschel, F.; Berg, D.; Gruber, W.; Bender, C.; Eberl, M.; Friedel, M.; Sonntag, J.; Rüngeler, E.; Hache, H.; Wierling, C. Synergism between Hedgehog-GLI and EGFR signaling in Hedgehog-responsive human medulloblastoma cells induces downregulation of canonical Hedgehog-target genes and stabilized expression of GLI1. PLoS ONE 2013, 8, e65403. [Google Scholar] [CrossRef] [PubMed]
- Parascandolo, A.; Laukkanen, M.O.; De Rosa, N.; Ugolini, C.; Cantisani, M.C.; Cirafici, A.M.; Basolo, F.; Santoro, M.; Castellone, M.D. A dual mechanism of activation of the Sonic Hedgehog pathway in anaplastic thyroid cancer: Crosstalk with RAS-BRAF-MEK pathway and ligand secretion by tumor stroma. Oncotarget 2018, 9, 4496. [Google Scholar] [CrossRef] [PubMed]
- Arnold, K.M.; Pohlig, R.T.; Sims-Mourtada, J. Co-activation of Hedgehog and Wnt signaling pathways is associated with poor outcomes in triple negative breast cancer. Oncol. Lett. 2017, 14, 5285–5292. [Google Scholar] [CrossRef] [PubMed]
- Song, L.; Li, Z.-Y.; Liu, W.-P.; Zhao, M.-R. Crosstalk between Wnt/β-catenin and Hedgehog/Gli signaling pathways in colon cancer and implications for therapy. Cancer Biol. Ther. 2015, 16, 1–7. [Google Scholar] [CrossRef] [PubMed]
- Ferretti, E.; Tosi, E.; Po, A.; Scipioni, A.; Morisi, R.; Espinola, M.; Russo, D.; Durante, C.; Schlumberger, M.; Screpanti, I.; et al. Notch signaling is involved in expression of thyrocyte differentiation markers and is down-regulated in thyroid tumors. J. Clin. Endocrinol. Metab. 2008, 93, 4080–4087. [Google Scholar] [CrossRef] [PubMed]
- Huang, D.W.; Sherman, B.T.; Lempicki, R.A. Systematic and integrative analysis of large gene lists using DAVID bioinformatics resources. Nat. Protoc. 2009, 4, 44–57. [Google Scholar] [CrossRef] [PubMed]
- Lu, T.-P.; Lee, C.-Y.; Tsai, M.-H.; Chiu, Y.-C.; Hsiao, C.K.; Lai, L.-C.; Chuang, E.Y. miRSystem: An integrated system for characterizing enriched functions and pathways of microRNA targets. PLoS ONE 2012, 7, e42390. [Google Scholar] [CrossRef] [PubMed]
- Szklarczyk, D.; Franceschini, A.; Wyder, S.; Forslund, K.; Heller, D.; Huerta-Cepas, J.; Simonovic, M.; Roth, A.; Santos, A.; Tsafou, K.P. STRING v10: Protein–protein interaction networks, integrated over the tree of life. Nucl. Acids Res. 2014, 43, D447–D452. [Google Scholar] [CrossRef] [PubMed]
- R2 R2: Genomics Analysis and Visualization Platform. Available online: http://r2.amc.nl.


| miRNA | Log2 (Fold-Change) | adj. p-Value |
|---|---|---|
| mmu-miR-466i-5p | 5.49 | 3.90 × 10⁻³ |
| mmu-miR-615-3p | 4.51 | 4.43 × 10⁻² |
| mmu-miR-871-3p | 3.87 | 2.54 × 10⁻⁴ |
| mmu-miR-708-3p | 3.30 | 2.69 × 10⁻² |
| mmu-miR-135a-5p | 2.90 | 4.10 × 10⁻² |
| mmu-miR-212-3p | 2.83 | 4.19 × 10⁻² |
| mmu-miR-193a-5p | 2.79 | 2.25 × 10⁻² |
| mmu-miR-330-5p | 2.72 | 3.73 × 10⁻² |
| mmu-miR-212-5p | 2.62 | 3.73 × 10⁻² |
| mmu-miR-193a-3p | 2.50 | 8.88 × 10⁻⁷ |
| mmu-miR-132-3p | 2.49 | 4.43 × 10⁻² |
| mmu-miR-466h-3p | 2.38 | 4.92 × 10⁻² |
| mmu-miR-150-5p | 2.17 | 2.16 × 10⁻² |
| mmu-miR-139-5p | 2.14 | 4.18 × 10⁻² |
| mmu-miR-195a-5p | 2.11 | 5.53 × 10⁻⁴ |
| mmu-miR-145a-5p | 2.05 | 4.43 × 10⁻² |
| mmu-miR-146a-5p | 2.03 | 3.26 × 10⁻³ |
| mmu-miR-92a-1-5p | 1.94 | 5.98 × 10⁻³ |
| mmu-miR-23b-3p | 1.84 | 3.43 × 10⁻² |
| mmu-miR-365-2-5p | 1.84 | 3.20 × 10⁻² |
| miRNA | log2 (Fold-Change) | adj. p-Value |
|---|---|---|
| mmu-miR-8102 | −11.57 | 2.85 × 10⁻²⁶ |
| mmu-miR-28c | −10.88 | 5.04 × 10⁻³¹ |
| mmu-miR-486-3p | −9.67 | 1.56 × 10⁻²⁰ |
| mmu-miR-34a-5p | −8.66 | 3.04 × 10−44 |
| mmu-miR-3084-5p | −8.48 | 3.90 × 10⁻²⁰ |
| mmu-miR-3080-3p | −7.77 | 1.87 × 10⁻⁹ |
| mmu-miR-6922-5p | −7.44 | 2.27 × 10⁻¹² |
| mmu-miR-5122 | −7.16 | 6.19 × 10⁻⁹ |
| mmu-miR-31-5p | −7.02 | 1.68 × 10⁻¹⁰ |
| mmu-miR-219c-5p | −6.93 | 1.00 × 10⁻¹⁷ |
| mmu-miR-6944-5p | −6.91 | 1.11 × 10⁻⁸ |
| mmu-miR-106a-5p | −6.79 | 9.35 × 10⁻⁹ |
| mmu-let-7k | −6.78 | 9.79 × 10⁻¹² |
| mmu-miR-3074-5p | −6.40 | 2.11 × 10⁻¹² |
| mmu-miR-7036b-5p | −6.37 | 1.98 × 10⁻⁸ |
| mmu-miR-7081-3p | −6.29 | 6.37 × 10⁻¹⁴ |
| mmu-miR-6936-3p | −6.07 | 1.11 × 10⁻⁸ |
| mmu-miR-7066-5p | −6.03 | 2.92 × 10⁻⁶ |
| mmu-miR-378b | −6.01 | 1.37 × 10⁻¹⁰ |
| mmu-miR-5099 | −5.99 | 9.79 × 10⁻¹² |
| #Pathway ID | Pathway Description | Observed Gene Count | False Discovery Rate |
|---|---|---|---|
| 1100 | Metabolic pathways | 216 | 1.90 × 10⁻²⁷ |
| 5016 | Huntington’s disease | 92 | 2.54 × 10−51 |
| 3010 | Ribosome | 91 | 3.04 × 10−69 |
| 190 | Oxidative phosphorylation | 83 | 6.82 × 10−56 |
| 5012 | Parkinson’s disease | 81 | 6.49 × 10−50 |
| 5010 | Alzheimer’s disease | 79 | 9.89 × 10−41 |
| 4932 | Non-alcoholic fatty liver disease (NAFLD) | 65 | 2.16 × 10⁻³⁰ |
| 4141 | Protein processing in endoplasmic reticulum | 64 | 2.92 × 10⁻²⁶ |
| 3040 | Spliceosome | 63 | 9.69 × 10⁻³⁴ |
| 5169 | Epstein–Barr virus infection | 54 | 2.04 × 10⁻¹⁴ |
| 3013 | RNA transport | 52 | 1.98 × 10⁻¹⁷ |
| 4151 | PI3K-Akt signaling pathway | 48 | 7.44 × 10⁻⁴ |
| 1120 | Microbial metabolism in diverse environments | 47 | 5.73 × 10⁻¹³ |
| 5200 | Pathways in cancer | 46 | 5.82 × 10⁻⁴ |
| 1200 | Carbon metabolism | 44 | 2.69 × 10⁻¹⁹ |
| 4110 | Cell cycle | 44 | 6.66 × 10⁻¹⁷ |
| 4120 | Ubiquitin mediated proteolysis | 40 | 4.50 × 10⁻¹² |
| 5203 | Viral carcinogenesis | 40 | 6.48 × 10⁻⁷ |
| 4810 | Regulation of actin cytoskeleton | 40 | 5.49 × 10⁻⁶ |
| 5205 | Proteoglycans in cancer | 40 | 1.07 × 10⁻⁵ |
| KEGG Pathway | p-Value | #Genes | #miRNAs |
|---|---|---|---|
| Pathways in cancer | 4.18 × 10⁻⁸ | 152 | 31 |
| PI3K-Akt signaling pathway | 1.28 × 10⁻⁵ | 130 | 30 |
| MAPK signaling pathway | 5.32 × 10⁻⁶ | 100 | 31 |
| Focal adhesion | 1.59 × 10⁻⁶ | 91 | 29 |
| Proteoglycans in cancer | 4.18 × 10⁻⁸ | 90 | 28 |
| cAMP signaling pathway | 3.92 × 10⁻⁶ | 86 | 29 |
| Regulation of actin cytoskeleton | 5.54 × 10⁻⁵ | 84 | 30 |
| Hippo signaling pathway | 3.92 × 10⁻⁶ | 68 | 28 |
| Transcriptional misregulation in cancer | 4.80 × 10⁻⁵ | 67 | 27 |
| Axon guidance | 2.75 × 10⁻⁷ | 66 | 26 |
| Protein processing in endoplasmic reticulum | 1.26 × 10⁻⁴ | 66 | 27 |
| FoxO signaling pathway | 3.92 × 10⁻⁶ | 63 | 26 |
| Wnt signaling pathway | 3.92 × 10⁻⁶ | 63 | 27 |
| Signaling pathways regulating pluripotency of stem cells | 8.71 × 10⁻⁷ | 62 | 30 |
| Thyroid hormone signaling pathway | 4.53 × 10⁻⁷ | 53 | 27 |
| Choline metabolism in cancer | 8.79 × 10⁻⁵ | 48 | 28 |
| Prostate cancer | 6.35 × 10⁻⁶ | 45 | 27 |
| ErbB signaling pathway | 9.09 × 10⁻⁶ | 45 | 27 |
| Phosphatidylinositol signaling system | 2.15 × 10⁻⁶ | 38 | 23 |
| Renal cell carcinoma | 4.70 × 10⁻⁶ | 35 | 27 |
| KEGG Pathway | p-Value | #Genes | #miRNAs |
|---|---|---|---|
| Pathways in cancer | 8.24 × 10⁻⁷ | 209 | 72 |
| PI3K-Akt signaling pathway | 3.39 × 10⁻⁵ | 182 | 70 |
| MAPK signaling pathway | 1.41 × 10⁻⁶ | 141 | 65 |
| Endocytosis | 8.24 × 10⁻⁷ | 123 | 60 |
| Regulation of actin cytoskeleton | 5.28 × 10⁻⁶ | 123 | 62 |
| Focal adhesion | 1.45 × 10⁻⁵ | 117 | 62 |
| Rap1 signaling pathway | 2.80 × 10⁻⁵ | 116 | 65 |
| Proteoglycans in cancer | 8.24 × 10⁻⁷ | 114 | 68 |
| cAMP signaling pathway | 4.14 × 10⁻⁴ | 106 | 69 |
| Hippo signaling pathway | 7.77 × 10⁻⁸ | 89 | 56 |
| Axon guidance | 5.69 × 10⁻⁸ | 83 | 54 |
| FoxO signaling pathway | 6.17 × 10⁻⁶ | 82 | 56 |
| Thyroid hormone signaling pathway | 7.84 × 10⁻⁸ | 67 | 50 |
| TGF-beta signaling pathway | 4.67 × 10⁻⁴ | 50 | 48 |
| ECM-receptor interaction | 4.12 × 10⁻¹¹ | 48 | 45 |
| Adherens junction | 3.60 × 10⁻⁸ | 48 | 48 |
| GABAergic synapse | 4.93 × 10⁻⁸ | 48 | 47 |
| Arrhythmogenic right ventricular cardiomyopathy (ARVC) | 3.29 × 10⁻⁷ | 46 | 45 |
| Amphetamine addiction | 3.32 × 10⁻⁵ | 41 | 47 |
| Long-term depression | 6.80 × 10⁻⁶ | 39 | 49 |
| Infant and Pediatric SHH MB Patients (Infant: 0–3 Years n = 50, Pediatric: 4–10 Years n = 45; 10–17 Years n = 26; Total n = 121), df = 1, chi, chi Squared Test. | |||||
| Gene | Affymetrix Probe | Bonferroni Adjusted p-Values | chi | Raw p-Value | Worse Overall Survival with |
| CHUK | 7935707 | 2.50 × 10⁻² | 13.54 | 2.30 × 10⁻⁴ | Low expression |
| CTNNB1 | 8079021 | 1.90 × 10⁻⁵ | 27.27 | 1.80 × 10⁻⁷ | Low expression |
| DDIT4 | 7928308 | 2.00 × 10⁻² | 13.93 | 1.90 × 10⁻⁴ | Low expression |
| RHEB | 8143957 | 2.00 × 10⁻³ | 18.31 | 1.90 × 10⁻⁵ | High expression |
| UBQLN1 | 8161988 | 1.90 × 10⁻² | 14.05 | 1.80 × 10⁻⁴ | High expression |
| Infant SHH MB Patients (Infant: 0–3 Years n = 50), df = 1 | |||||
| Gene | Affymetrix Probe | Bonferroni-Adjusted p-Values | chi | Raw p-Value | Worse Overall Survival with |
| MBTPS1 | 8003089 | 4.90 × 10⁻² | 10.20 | 1.40 × 10⁻³ | High expression |
| RAF1 | 8085374 | 4.70 × 10⁻² | 10.27 | 1.40 × 10⁻³ | High expression |
| SAR1B | 8114193 | 3.30 × 10⁻⁴ | 19.64 | 9.40 × 10⁻⁶ | Low expression |
| TXNDC5 | 8123802 | 1.80 × 10⁻² | 12.10 | 5.00 × 10⁻⁴ | High expression |
| UBE4B | 7897527 | 6.20 × 10⁻³ | 14.05 | 1.80 × 10⁻⁴ | Low expression |
| VCP | 8160914 | 4.20 × 10⁻² | 10.47 | 1.20 × 10⁻³ | High expression |
| Pediatric SHH MB Patients (Pediatric: 4–10 Years n = 45; 10–17 Years n = 26, Total n = 71), df = 1, chi, chi Squared Test. | |||||
| Gene | Affymetrix Probe | Bonferroni-Adjusted p-Values | chi | Raw p-Value | Worse Overall Survival with |
| CHUK | 7935707 | 3.20 × 10⁻² | 11.87 | 5.70 × 10⁻⁴ | Low expression |
| CTNNB1 | 8079021 | 1.40 × 10⁻⁶ | 31.02 | 2.50 × 10⁻⁸ | Low expression |
| PPP2R1A | 8030881 | 2.40 × 10⁻² | 12.39 | 4.30 × 10⁻⁴ | High expression |
| RAD23B | 8157125 | 2.40 × 10⁻⁴ | 21.17 | 4.20 × 10⁻⁶ | High expression |
| RHEB | 8143957 | 3.10 × 10⁻² | 11.93 | 5.50 × 10⁻⁴ | High expression |
| UBQLN1 | 8161988 | 4.70 × 10⁻⁵ | 24.27 | 8.40 × 10⁻⁷ | High expression |
| Adult SHH MB Patients (Adult: >18 years, n = 49), df = 1, chi, chi Squared Test. | |||||
| Gene | Affymetrix Probe | Bonferroni-Adjusted p-Values | chi | Raw p-Value | Worse Overall Survival with |
| EGFR | 8132860 | 4.20 × 10⁻² | 10.45 | 1.20 × 10⁻³ | Low expression |
| MAPK3 | 8000811 | 3.90 × 10⁻² | 10.59 | 1.10 × 10⁻³ | High expression |
| SHHα MB Pediatric Patients (n = 41), df = 1, chi, chi Squared Test. | |||||
| Gene | Affymetrix Probe | Bonferroni-Adjusted p-Values | chi | Raw p-Value | Worse Overall Survival with |
| CTNNB1 | 8079021 | 8.90 × 10⁻³ | 12.82 | 3.40 × 10⁻⁴ | Low expression |
| PDIA3 | 7983274 | 2.50 × 10⁻² | 10.93 | 9.40 × 10⁻⁴ | Low expression |
| RAD23B | 8157125 | 7.30 × 10⁻⁵ | 21.95 | 2.80 × 10⁻⁶ | High expression |
| RAF1 | 8085374 | 1.70 × 10⁻² | 11.60 | 6.60 × 10⁻⁴ | Low expression |
| RHEB | 8143957 | 4.10 × 10⁻² | 9.97 | 1.60 × 10⁻³ | High expression |
| UBQLN1 | 8161988 | 3.80 × 10⁻⁵ | 23.18 | 1.50 × 10⁻⁶ | High expression |
| YWHAH | 8072577 | 1.50 × 10⁻² | 11.88 | 5.70 × 10⁻⁴ | High expression |
| SHHβ MB Infant Patients (n = 21), df = 1, chi, chi Squared Test. | |||||
| Gene | Affymetrix Probe | Bonferroni-Adjusted p-Values | chi | Raw p-Value | Worse Overall Survival with |
| UBE4B | 7897527 | 4.60 × 10⁻² | 7.11 | 7.70 × 10⁻³ | Low expression |
| SHHγ MB Infant Patients (n = 25) | |||||
| Gene | Affymetrix Probe | Bonferroni-Adjusted p-Values | chi | Raw p-Value | Worse Overall Survival with |
| SHHδ MB Adult Patients (n = 41), df = 1, chi, chi Squared Test. | |||||
| Gene | Affymetrix Probe | Bonferroni-Adjustedp-Values | chi | Raw p-Value | Worse Overall Survival with |
| CHUK | 7935707 | 1.20 × 10⁻² | 12.20 | 4.80 × 10⁻⁴ | Low expression |
| DNAJB11 | 8084634 | 6.00 × 10⁻³ | 13.57 | 2.30 × 10⁻⁴ | Low expression |
| Infant and Pediatric MB Patients (SHH n = 146, WNT n = 51, Group 3 n = 131, Group 4 n = 300) | ||||||
| Gene | Affymetrix Probe | Expression | Group 3 vs. SHH p-Value | Group 4 vs. SHH p-Value | WNT vs. SHH p-Value | Worse Overall Survival with |
| CHUK | 7935707 | Lowest in SHH | 5.70 × 10⁻¹⁵ | 5.00 × 10⁻¹³ | 2.30 × 10⁻⁴ | Low expression |
| CTNNB1 | 8079021 | Highest in SHH | 1.70 × 10⁻²⁴ | 1.60 × 10−36 | 1.50 × 10⁻⁹ | Low expression |
| DDIT4 | 7928308 | Highest in SHH | 1.10 × 10⁻⁶ | 3.90 × 10−44 | 7.80 × 10⁻⁶ | Low expression |
| RHEB | 8143957 | Highest in Group 4 | 0.87 | 1.00 × 10⁻² | 9.90 × 10⁻⁴ | High expression |
| UBQLN1 | 8161988 | Highest in Group 3 and Group 4 | 3.40 × 10⁻⁶ | 2.00 × 10⁻¹⁶ | 0.15 | High expression |
| Infant MB patients (SHH n = 62, WNT n = 1, Group 3 n = 24, Group 4 n = 11) | ||||||
| Gene | Affymetrix Probe | Expression | Group 3 vs. SHH p-Value | Group 4 vs. SHH p-Value | WNT vs. SHH p-Value | Worse Overall Survival with |
| MBTPS1 | 8003089 | Lowest in SHH | 9.10 × 10⁻⁴ | 1.60 × 10⁻⁴ | - | High expression |
| RAF1 | 8085374 | - | 0.21 | 0.34 | - | High expression |
| SAR1B | 8114193 | Lowest in SHH | 2.20 × 10⁻⁹ | 1.10 × 10⁻⁴ | - | Low expression |
| TXNDC5 | 8123802 | - | 0.01 | 0.31 | - | High expression |
| UBE4B | 7897527 | Highest in Group 3 and Group 4 | 0.27 | 1.80 × 10⁻³ | - | Low expression |
| VCP | 8160914 | - | 0.32 | 0.07 | - | High expression |
| Pediatric MB patients (SHH n = 84, WNT n = 50, Group 3 n = 107, Group 4 n = 289) | ||||||
| Gene | Affymetrix Probe | Expression | Group 3 vs. SHH p-Value | Group 4 vs. SHH p-Value | WNT vs. SHH p-Value | Worse Overall Survival with |
| CHUK | 7935707 | Lowest in SHH | 5.80 × 10⁻¹⁵ | 1.20 × 10⁻¹⁴ | 3.00 × 10⁻⁶ | Low expression |
| CTNNB1 | 8079021 | Highest in SHH | 3.50 × 10⁻¹⁴ | 5.90 × 10⁻²⁰ | 8.10 × 10⁻⁶ | Low expression |
| PPP2R1A | 8030881 | - | 0.09 | 0.02 | 0.49 | High expression |
| RAD23B | 8157125 | Lowest in SHH | 4.20 × 10⁻¹³ | 9.10 × 10⁻¹⁷ | 1.80 × 10⁻⁷ | High expression |
| RHEB | 8143957 | Lowest in WNT | 0.87 | 5.30 × 10⁻¹² | 2.10 × 10⁻⁴ | High expression |
| UBQLN1 | 8161988 | Lowest in SHH | 1.40 × 10⁻⁸ | 9.10 × 10⁻²³ | 5.20 × 10⁻³ | High expression |
| Adult MB patients (SHH n = 69, WNT n = 13, Group 3 n = 5, Group 4 n = 14) | ||||||
| Gene | Affymetrix Probe | Expression | Group 3 vs. SHH p-Value | Group 4 vs. SHH p-Value | WNT vs. SHH p-Value | Worse Overall Survival with |
| EGFR | 8132860 | Highest in SHH | 1.20 × 10⁻³ | 2.60 × 10⁻⁴ | 5.00 × 10⁻⁴ | Low expression |
| MAPK3 | 8000811 | Lowest in WNT and Group 3 | 7.10 × 10⁻³ | 0.6 | 0.03 | High expression |
© 2018 by the authors. Licensee MDPI, Basel, Switzerland. This article is an open access article distributed under the terms and conditions of the Creative Commons Attribution (CC BY) license (http://creativecommons.org/licenses/by/4.0/).
Share and Cite
Po, A.; Abballe, L.; Sabato, C.; Gianno, F.; Chiacchiarini, M.; Catanzaro, G.; De Smaele, E.; Giangaspero, F.; Ferretti, E.; Miele, E.; et al. Sonic Hedgehog Medulloblastoma Cancer Stem Cells Mirnome and Transcriptome Highlight Novel Functional Networks. Int. J. Mol. Sci. 2018, 19, 2326. https://doi.org/10.3390/ijms19082326
Po A, Abballe L, Sabato C, Gianno F, Chiacchiarini M, Catanzaro G, De Smaele E, Giangaspero F, Ferretti E, Miele E, et al. Sonic Hedgehog Medulloblastoma Cancer Stem Cells Mirnome and Transcriptome Highlight Novel Functional Networks. International Journal of Molecular Sciences. 2018; 19(8):2326. https://doi.org/10.3390/ijms19082326
Chicago/Turabian StylePo, Agnese, Luana Abballe, Claudia Sabato, Francesca Gianno, Martina Chiacchiarini, Giuseppina Catanzaro, Enrico De Smaele, Felice Giangaspero, Elisabetta Ferretti, Evelina Miele, and et al. 2018. "Sonic Hedgehog Medulloblastoma Cancer Stem Cells Mirnome and Transcriptome Highlight Novel Functional Networks" International Journal of Molecular Sciences 19, no. 8: 2326. https://doi.org/10.3390/ijms19082326
APA StylePo, A., Abballe, L., Sabato, C., Gianno, F., Chiacchiarini, M., Catanzaro, G., De Smaele, E., Giangaspero, F., Ferretti, E., Miele, E., & Besharat, Z. M. (2018). Sonic Hedgehog Medulloblastoma Cancer Stem Cells Mirnome and Transcriptome Highlight Novel Functional Networks. International Journal of Molecular Sciences, 19(8), 2326. https://doi.org/10.3390/ijms19082326