Abstract
To assess the interrelation between the change of metabolites and the change of fruit color, we performed a combined metabolome and transcriptome analysis of the flesh in two different Actinidia arguta cultivars: “HB” (“Hongbaoshixing”) and “YF” (“Yongfengyihao”) at two different fruit developmental stages: 70d (days after full bloom) and 100d (days after full bloom). Metabolite and transcript profiling was obtained by ultra-performance liquid chromatography quadrupole time-of-flight tandem mass spectrometer and high-throughput RNA sequencing, respectively. The identification and quantification results of metabolites showed that a total of 28,837 metabolites had been obtained, of which 13,715 were annotated. In comparison of HB100 vs. HB70, 41 metabolites were identified as being flavonoids, 7 of which, with significant difference, were identified as bracteatin, luteolin, dihydromyricetin, cyanidin, pelargonidin, delphinidin and (−)-epigallocatechin. Association analysis between metabolome and transcriptome revealed that there were two metabolic pathways presenting significant differences during fruit development, one of which was flavonoid biosynthesis, in which 14 structural genes were selected to conduct expression analysis, as well as 5 transcription factor genes obtained by transcriptome analysis. RT-qPCR results and cluster analysis revealed that AaF3H, AaLDOX, AaUFGT, AaMYB, AabHLH, and AaHB2 showed the best possibility of being candidate genes. A regulatory network of flavonoid biosynthesis was established to illustrate differentially expressed candidate genes involved in accumulation of metabolites with significant differences, inducing red coloring during fruit development. Such a regulatory network linking genes and flavonoids revealed a system involved in the pigmentation of all-red-fleshed and all-green-fleshed A. arguta, suggesting this conjunct analysis approach is not only useful in understanding the relationship between genotype and phenotype, but is also a powerful tool for providing more valuable information for breeding.
1. Introduction
Kiwifruit (Actinidiaceae, genus Actinidia), a kind of perennial and deciduous plant, is one of the fruit trees that have been domesticated and cultivated successfully in the last century, and in recent years has been grown commercially worldwide [1,2]. As a fruit tree originating from China, the genus Actinidia comprises a total of 76 species and about 125 known taxa worldwide [3], but among these, only two species—Actinidia chinensis and A. deliciosa—have been cultivated commercially [4].
Flesh color is an important quality characteristic and is also an important index for evaluation of fruit quality in Actinida. The two species mentioned above, A. chinensis and A. deliciosa, have dominated the international market because of their large fruit, high vitamin C content, unique flavor, and long storage period properties [5]. In addition, these two species are often used as experimental materials for the study of flesh coloring, which mainly concentrate on green- and yellow-fleshed coloring, corresponding to chlorophyll metabolism and carotenoid metabolism, respectively. In recent years, because of their rich functional components (phenols and flavonoids), red-fleshed kiwifruit has attracted more and more attention from consumers and researchers.
Flavonoids, secondary metabolites found in plants, contribute to plant environmental adaptation [6], fruit development [7,8], and even human health [9]. These compounds accumulate in various tissues at different developmental stages [10], and they are also the direct factors that cause red color in Actinida flesh [11,12,13]. Flavonoid biosynthesis controlled by a diverse array of exogenous and endogenous factors is the most studied secondary metabolic pathway in plants, including Actinidia. Most structural gene-coding enzymes have been studied in Actinida [11,14,15,16,17,18], as well as transcription factors [13,19]. However, most of the reports on red-fleshed Actinidia coloring are mainly concentrated on Actinidia chinensis, and rarely examine Actinidia arguta, which is a kind of all-red-fleshed mini-type Actinidia.
The post-genomic era is densely populated with databases reporting the results of “-omics” studies, which provide insights into genome-wide approaches on the basis of comprehensive analysis of transcriptome, proteome, and metabolome, in addition to the traditional molecular biological, biochemical and reverse-genetic approaches [20,21,22]. Accordingly, metabolomics is the attempt to identify and quantify all endogenous small molecule metabolites in an organism or biofluid sample [23]. Furthermore, metabolomics analysis can be regarded as a technical means of association analysis together with other data to analyze the gene function involved in the metabolic pathway of interest and can also provide supporting information for gene mining. In recent years, combined high-throughput methods have been used to study color development. Combined metabolome and transcriptome analyses in fruits have clarified the relationship between the contents of various secondary metabolites and the corresponding differentially expressed genes, broadening the global view of plant color regulation [24,25,26].
To investigate the metabolite changing rule associated with color change during Actinidia development, two different cultivars—“Hongbaoshixing” (“HB”) and “Yongfengyihao” (“YF”)—were selected to perform metabolome and transcriptome analysis. All metabolites that could be detected by instrument were identified and then used for differential analysis. Finally, 41 metabolites related to flavonoid biosynthesis were obtained, 7 of which presented significant difference in the comparison between HB100 and HB70. Through combined metobolome and transcriptome analysis, 2 pathways—flavonoid biosynthesis and galactose metabolism—were significantly different in terms of change during fruit development. In flavonoid biosyntheis, 8 differentially expressed structural genes were obtained. In addition, 7 transcription factor genes related to flavonoid biosynthesis were obtained by transcriptome analysis. RT-qPCR results and cluster analysis revealed the genes AaF3H, AaLDOX, AaUFGT, AaMYB, AabHLH and AaHB2 could be determined as candidate genes on which to conduct further study. Through integrated analysis of identified metabolites with significant difference and related genes involved in flavonoid biosynthesis, the association between metabolites and genes was explained so as to provide valuable information for revealing the red coloring of A. arguta.
2. Results
2.1. Metabolite Identification
In order to explore the change of metabolites during A. arguta fruit development (Figure 1), a metabolome program was carried out. Only the m/z and chromatographic retention time were collected for each detected feature. Therefore, the quality control for features obtained by XCMS software was conducted by the overall MS signal intensity controlled by TIC (total ion chromatogram) (Figure S1), evaluation of width for m/z peak, and assessment of width for retention time peak for each feature (Figure S2).
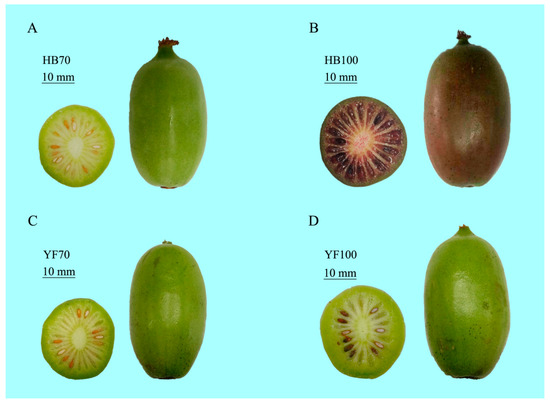
Figure 1.
The phenotype of Actinidia arguta cv. “HB” and “YF” at two different sampling stages 70 DAFB and 100 DAFB, respectively. (A) Green fruit “HB” at 70 DAFB, HB70; (B) Red fruit “HB” at 100 DAFB, HB100; (C) Green fruit “YF” at 70 DAFB, YF70; (D) Green fruit “YF” at 100 DAFB, YF100.
The original wiff format data was converted to the mzXML format using MSConvert software [27], followed by alignment and extraction of the peak and calculation of the peak area. The final statistics showed that 18,598 and 10,239 metabolites were obtained by the POS (positive) and NEG (negative) models, respectively, 9016 and 4699 of which were annotated (Table 1).

Table 1.
Statistics of identified metabolites.
The metabolites identified above were assigned to the KEGG and PLANTCYC databases. All 8070 and 4321 metabolites were classified into 18 KEGG second-grade pathways, 3580 and 2461 of which were classified into “metabolism” in the POS and NEG models, respectively. For the “metabolism” term, the top priority was “Global and overview maps”, followed by “biosynthesis of other secondary metabolites”, ”metabolism of terpenoids and polyketides”, “amino acid metabolism”, “metabolism of cofactors and vitamins” and “carbohydrate metabolism” (Figure 2). 480 and 340 metabolites were assigned to “biosynthesis of other secondary metabolites” in the POS and NEG models, respectively. Of these, 73 and 67 metabolites were involved in “flavonoid biosynthesis” and “anthocyanin biosynthesis” in the POS and NEG models, respectively (Figure 3).
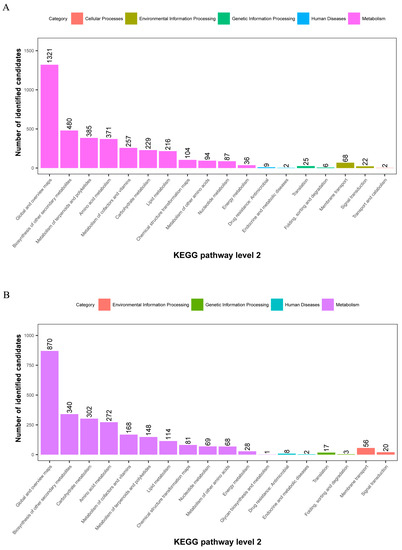
Figure 2.
KEGG pathway classification: metabolites detected and annotated. (A) POS model; (B) NEG model. The x-axis represents level-2 terms of the KEGG pathway and the y-axis represents the number of metabolites identified.
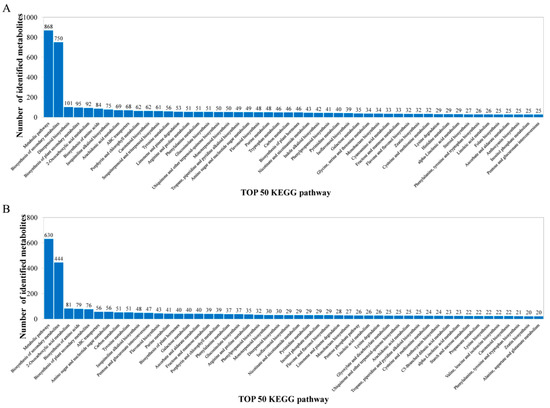
Figure 3.
Identified metabolites classified into the top 50 KEGG pathways. (A) POS model; (B) NEG model. The x-axis represents the top 50 KEGG pathways and the y-axis represents number of identified metabolites involved in this pathway.
All 1267 and 360 metabolites obtained from level-two identification were assigned to the HMDB database, 550 and 250 of which were matched and classified into 11 HMDB super classes in POS and NEG, respectively. Of these, 305 metabolites were included in the “organic acids and derivatives” term, which presented the majority of all classes in the POS model. Meanwhile, “organic acids and derivatives”, which contained 59 metabolites, was the first class, followed by “organooxygen compounds” and “lipids and lipid-like molecules” in the NEG model (Figure 4).
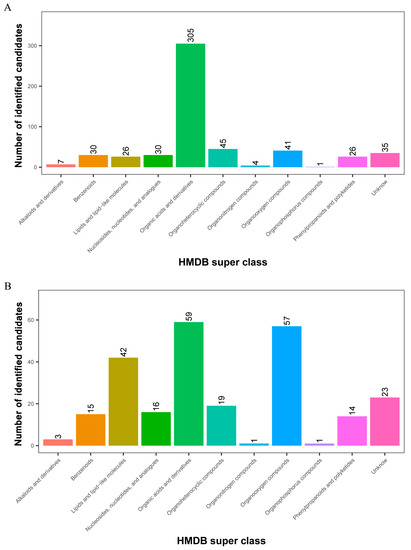
Figure 4.
Identified metabolites from level-two identification were classified into 11 HMDB super classes. (A) POS model; (B) NEG model. The x-axis represents HMDB super classes, and the y-axis represents the number of identified metabolites.
2.2. Identified Metabolites Involved in Flavonoid Biosynthesis
In order to obtain quantitative information on the metabolites, 14,132 and 8400 high-quality metabolites obtained from the 18,598 and 10,239 of all metabolites were used for differential analysis (Table 2). According to the quantitative results of the identified metabolites, the differential metabolites between different group comparisons were analyzed based on fold-change and p-value. In the comparison between HB100 and HB70, a total of 2421 and 1838 metabolites presented as being up-regulated and down-regulated, respectively (Table 3). In addition, a total of 41 metabolites were identified as being flavonoids among the high-quality metabolites, 7 of which were with significant difference, and were identified as bracteatin, luteolin, dihydromyricetin, cyanidin, pelargonidin, delphinidin and (−)-epigallocatechin (Table S1 and Table 4).
Table 2.
Statistics for quantitative metabolites.
Table 3.
Statistics for differential metabolites between different group comparisons.
Table 4.
7 metabolites with significant difference in the comparison between HB100 and HB70.
2.3. Analysis of Transcription Factors
A total of 2614 transcription factor genes were identified through transcriptome data analysis and could be grouped into 80 transcription factor families (Table S2), the majority of which were “AP2-EREBP”, “MYB” and “C2H2”, followed by “C3H“, ”Orphans“, “NAC”, “bHLH”, “WRKY” and “HB”. Of these 2614 transcription factor genes, 7 were annotated as being associated with flavonoid biosynthesis. The “c88340_g1”, “c105731_g1 (AaMYBC1)” and “c18002_g1 (named AaMYB)”, “c102250_g1” and “c86342_g1 (named AabHLH)”, and “c127253_g1 (named AaHB1)” and “c129627_g1 (named AaHB2)” belonged to “MYB”, ”bHLH“ and “HB” families, respectively (Figure 5).
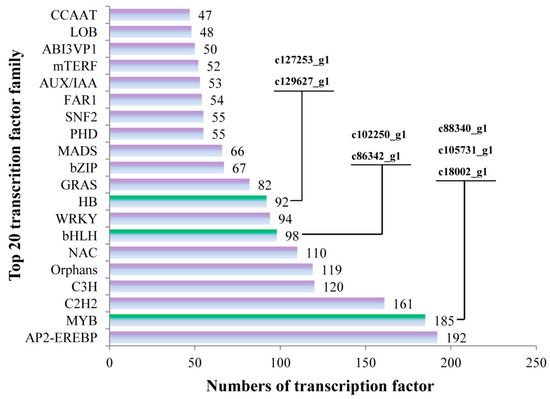
Figure 5.
The numbers of transcription factors involved in the top 20 transcription factor families. The x-axis represents the numbers of transcription factors and the y-axis represents the top 20 transcription factor families.
2.4. Comprehensive Analysis of Metabolome and Transcriptome
In order to investigate the association between metabolites and genes involved in the same biological process (KEGG Pathway), the comprehensive analysis of metabolome and transcriptome was performed using Pearson’s Correlation Coefficient [28,29]. The results showed that 646, 156 and 484 differentially expressed genes participated in 13, 18 and 12 pathways among three groups HB100 vs. HB70, HB100 vs. YF10 and YF100 vs. YF70, respectively (Table S3). The 2 pathways, “flavonoid biosynthesis” and “galactose metabolism”, were a common presence among the three group comparisons. In flavonoid biosynthesis, a total of 8 candidate DEGs were found (Figure 6).
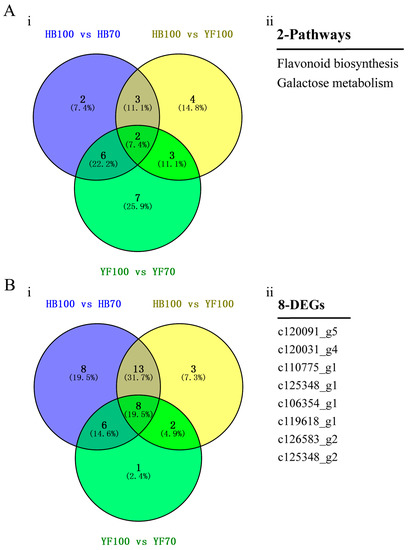
Figure 6.
Identification of candidate DEGs. (A) Venn Diagram of pathways. (i) indicates Venn Diagram result between three groups, HB100 vs. HB70, HB100 vs. YF100, and YF100 vs. YF70. (ii) indicates the two specific pathways; (B) Venn Diagram of DEGs involved in flavonoid biosynthesis. (i) indicates Venn Diagram result between three groups, HB100 vs. HB70, HB100 vs. YF100, and YF100 vs. YF70. (ii) indicates specific 8 DEGs.
2.5. RT-qPCR, Cluster and Phylogenetic Analysis
A total of 14 structural genes comprising the 8 DEGs found above and 6 other structural genes involved in flavonoid biosynthesis were determined to conduct RT-qPCR, as well as 5 regulatory genes AaMYBC1, AaMYB, AabHLH, AaHB1 and AaHB2 (Figure 7). The expression patterns of these three structural genes AaF3H, AaLDOX and AaUFGT were similar to the two regulatory genes AaMYB and AaHB2. The expression levels of AaF3H, AaLDOX and AaUFGT in “HB100” was significantly higher than those in “HB70” and “YF100” (Figure 7A). A similar rule of expression was detected for AaMYB and AaHB2. The expression levels of AaMYB and AaHB2 in “HB100” were higher than those found in “HB70” and “YF100” (Figure 7B). Cluster analysis results showed that the genes AaF3H, AaLDOX, AaUFGT, AaMYB, AabHLH and AaHB2 were clustered into the same class (Figure 8), suggesting that the expression patterns of these genes were similar to each other. Because MYB is the biggest and most important transcription factor family involved in flavonoids, AaMYB was used for BLAST in order to search for other MYB sequences in other species. A phylogenetic tree was constructed with the BLAST results. The results showed that AaMYB and CsMYB5a (MYB5a of Camellia sinensis) were clustered into one class (Figure 9).
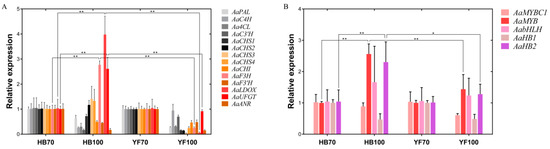
Figure 7.
Expression profiles of structural and regulatory genes involved in flavonoid biosynthesis in the flesh of “HB” and “YF”. (A) 14 structural genes; (B) 5 regulatory genes. The x-axis represents two different development stages of “HB” and “YF”, and the y-axis represents relative expression. Data were analyzed using the t-test. * p < 0.05, ** p < 0.01.
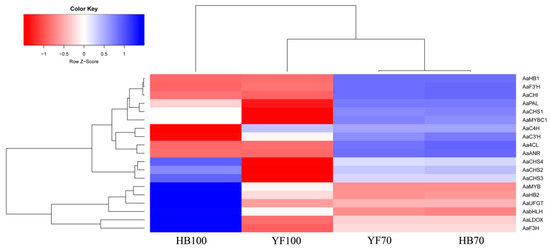
Figure 8.
Cluster analysis for structural and regulatory genes. Blue boxes indicate high expression levels and red boxed indicate low expression levels.
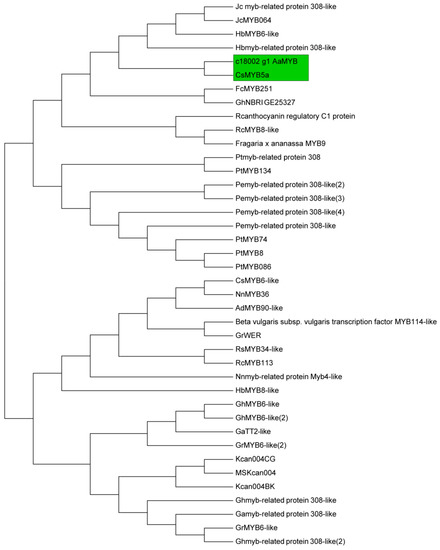
Figure 9.
Phylogenetic analysis of 40 MYB transcription factor genes in different species. The green frame indicates that the two genes AaMYB and CsMYB5a are clustered together.
2.6. Regulatory Network of Flavonoid Biosynthesis
In order to better understand the relationship between metabolites and genes in flavonoid biosynthesis, all results of metabolites and genes were combined to establish a network, aiming to show the relationship between gene expression and metabolite accumulation more intuitively (Figure 10). Among the 14 structural genes, AaF3H, AaLDOX and AaUFGT were highly expressed in HB100 vs. HB70 in comparison with the other 11 structural genes. The 7 metabolites with significant differences in HB100 vs. HB70 of flavonoid biosynthesis were: bracteatin, luteolin, dihydromyricetin, cyanidin, pelargonidin, delphinidin and (−)-epigallocatechin. It is generally known that transcription factor plays a role by binding the promoter of structural genes. Therefore, we speculate the hypothesis that the three transcription factors AaMYB, AabHLH, and AaHB2 activate expression of AaF3H, AaLDOX and AaUFGT by binding the promoter of these three structural genes, inducing the accumulation of the 7 metabolites described above in flavonoid biosynthesis. Specifically, AaMYB, AabHLH, AaHB2, AaF3H, AaLDOX and AaUFGT were the candidate genes obtained from this study and could be used for further study, revealing the red mechanism of A. arguta.
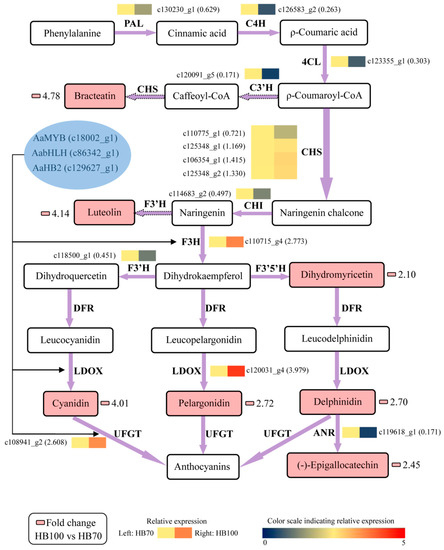
Figure 10.
Regulatory network of flavonoid biosynthesis in two development stages “HB100” and “HB70”. HB100: “HB” kiwifruit at 100 DAFB; HB70: ”HB” kiwifruit at 70 DAFB. Color scale from dark blue to bright red represents relative expression levels 0–5. Small pink cells represent fold change of metabolites between HB100 and HB70. The solid frame arrow represents only one step of process, and the dotted frame arrow represents more than one step of process. PAL, phenylalanine ammonia-lyase; C4H, trans-cinnamate 4-hydroxylase; 4CL, 4-coumarate: CoA ligase; C3’H, coumaroylquinate 3’-monooxygenase; CHS, chalcone synthase; CHI, chalcone isomerase; F3H, flavanone 3-hydroxylase; F3’H, flavonoid 3’-hydroxylase; LDOX, leucoanthocyanidin dioxygenase; UFGT, UDP glucose-flavonoid 3-O-glcosyl-transferase; ANR, anthocyanidin reductase.
3. Discussion
3.1. Metabolites Were Obtained by Metabolome Analysis
Plant metabolomics, a new field in the post-genome era [30], presents the rule of change of metabolites in various tissues. Metabolites are the final products of cell biological regulation process, and their level can be regarded as the response of plant development to genetic and environmental changes [31]. Therefore, metabolomic analysis can be used to investigate the relationship between biological processes and phenotypes; furthermore, some intuitive changes can also be observed at the metabolic level [32]. Up until now, several reports have examined the metabolic responses of different species to flavonoid biosynthesis, such as Fagopyrum esculentum [33], Camellia sinensis [34], and Ficus carica L. [35]. This research suggests that metabolome analysis plays a crucial role in explaining the molecular responses to flavonoid biosynthesis. In this study, through fruit metabolome analysis on two different A. arguta cultivars “HB” and “YF” at two developmental stages, a total of 28,837 metabolites were obtained, of which 13,715 had been annotated (Table 1). In addition, 22,532 high-quality metabolites were identified and selected for differential analysis (Table 2). The focus of our research was on flesh coloring, so the HB100 vs. HB70 comparison was selected as the object for further analysis. In the comparison HB100 vs. HB70, 41 metabolites were identified as being flavonoids, 7 of which, with significant difference, were identified as bracteatin, luteolin, dihydromyricetin, cyanidin, pelargonidin, delphinidin and (−)-epigallocatechin (Table S1). Such a result provides us with the insight that the difference between these 7 metabolites leads to the difference between red and green coloring in A. arguta flesh.
3.2. Transcription Factors Involved in Flavonoid Biosynthesis
Transcription factors are absolutely necessary for regulation of gene expression [36]. Normally, transcription factor proteins play a role through the combination of their own DNA-binding domain and the cis-acting element of their target genes [37,38]. In plants, transcription factors could participate in various biological process, including developmental regulation, defense elicitation, and stress responses [39,40,41,42,43]. Numerous studies have shown that flavonoid biosynthesis is regulated by the MBW complex, comprising MYB, bHLH, WD40 [44,45,46]. Therefore, finding transcription factors related to flavonoid biosynthesis is essential for investigating fruit coloring. In this study, 5 transcription factor genes were obtained by transcriptome analysis and used for expression analysis. The results showed that AaMYB, AabHLH and AaHB2 were highly expressed at HB100, indicating that these three transcription factors might play a key role in fruit coloring in A. arguta. Phylogenetic analysis revealed that AaMYB was highly homologous to CsMYB5a, rather than the other MYB in A. chinensis, in which AcMYB75 [47], AcMYB110 [48] and AcMYBF110 [13] were the key MYB transcription factors controlling fruit coloring, indicating that the MYB transcription factor that plays a key role in regulating flavonoid biosynthesis might be different in different Actinidia species.
3.3. Candidate Genes are Involved in Regulating Fruit Coloring
Genes, including structural and regulatory genes, involved in flavonoid biosynthesis and regulation have been found, studied and reported in many plants, including Actinidia [11,13,15,16,17,18,19]. However, most genes have been obtained and identified using traditional study technology. Since transcriptome analysis has come to be regarded as a crucial way to study the expression level, structure and function of genes in order to revealing phenotypic traits, combined analysis of transcriptome and metabolome has increasingly become a popular and practical tool for the mining of new genes involved in various metabolic pathways [49]. In this study, metabolome data, coupled with transcriptome profiling, was carried out in a combined analysis for the discovery of genes involved in flavonoid biosynthesis, thus searching for useful information to illustrate phenomenon of red coloring in A. arguta fruit. 19 genes, comprising 14 structural genes and 5 transcription factor genes, were obtained and used to analyze expression level; additionally, cluster analysis was conducted and the construction of phylogenetic tree was also performed. The results showed that structural genes including AaF3H, AaLDOX and AaUFGT and transcription factor genes including AaMYB, AabHLH and AaHB2 were highly expressed at HB100, when the flesh color significantly presented red (Figure 7). In addition, the cluster analysis results suggested that AaF3H, AaLDOX, AaUFGT, AaMYB, AabHLH and AaHB2 were clustered into one class, indicating that their expression patterns were similar to each other (Figure 8). Based on these results, a regulatory network of flavonoid biosynthesis was established to show the role of genes involved in pathways more intuitively (Figure 10). Thus, such a model of action was derived: the three transcription factors AaMYB, AabHLH and AaHB2 interact with promotors of the three structural genes aF3H, AaLDOX, and AaUFGT to control the expression, inducing the accumulation of metabolites and the appearance of the red phenotype of A. arguta fruit.
This method—combined metabolome and transcriptome—is an effective analytical method for explaining the relationship between key genes and metabolites involved in biosynthesis pathways. Using this method, we determined the candidate genes and metabolites involved in the flavonoid biosynthesis pathway, providing valuable information and a useful reference for explaining the phenomenon of red coloring of A. arguta fruit. Nevertheless, the specific mechanism still needs further research, and remains to be explored.
4. Materials and Methods
4.1. Fruit Materials
Two different types of kiwifruit (Actinidia arguta), “Hongbaoshixing” (“HB”, a kind of all-red-fleshed A. arguta cultivar) and “Yongfengyihao” (“YF”, a kind of all-green-fleshed A. arguta cultivar), were selected as experimental materials. Two different sampling stages of fruit development, defined in days after full bloom (DAFB), were 70 DAFB (70d, green fruit) and 100 DAFB (100d, the color-break stage, at which point they start to turn red). ‘YF’ fruit selected as a control case were green throughout the whole development process and were also sampled at 70d to 100d (Figure 1). Both of them are tetraploids with similar genetic backgrounds. The fruit samples at the two developmental stages described above were harvested from the National Kiwifruit Germplasm Garden of Zhengzhou Fruit Research Institute, CAAS, Henan province, China. Three biological replicates were collected per sample, each with 30 fruits randomly collected from 6 kiwifruit trees, every two of which were set as a biological replication; thus, all data were obtained based on three independent biological replicates. All flesh samples of the fresh fruits were dissected using a blade, frozen immediately in liquid nitrogen, and then stored at −80 °C until further use.
4.2. Metabolite Extraction and Parameter Setting
The collected samples were thawed on ice, and metabolites were extracted with 50% methanol buffer (50% solution of methanol in distilled water). Briefly, 20 μL of sample was extracted with 120 μL of precooled 50% methanol, vortexed for 1 min, and incubated at room temperature for 10 min; the extraction mixture was then stored overnight at −20 °C. After centrifugation at 4000× g for 20 min, the supernatants were transferred into new 96-well plates. Three independent repetitions were executed for the extraction and subsequent analysis process.
All chromatographic separations were performed using an ultra-performance liquid chromatography (UPLC) system (SCIEX, Cheshire, UK). An ACQUITY UPLC BEH Amide column (100 mm × 2.1 mm, 1.7 µm, Waters, UK) was used for the reversed phase separation. The column oven was maintained at 35 °C. The flow rate was 0.4 mL/min and the mobile phase consisted of solvent A (25 mM ammonium acetate + 25 mM NH4H2O) and solvent B (IPA:CAN = 9:1 + 0.1% formic acid). Gradient elution conditions were set as follows: 0~0.5 min, 95% B; 0.5~9.5 min, 95% to 65% B; 9.5~10.5 min, 65~40% B; 10.5~12 min, 40% B; 12~12.2 min, 40~95% B; 12.2~15 min, 95% B. The injection volume for each sample was 4 µL.
A high-resolution tandem mass spectrometer TripleTOF5600plus (SCIEX, Cheshire, UK) was used to detect metabolites eluted form the column. The Q-TOF was operated in both positive and negative ion modes. XCMS software 3.2.0 (UC, Berkeley, CA, USA) was used to control the chromatograph and mass spectrometer.
4.3. Identification and Quantification of Metabolite
MSConvert was used to transform LC-MS raw data into the mzXML format, which was then processed by the XCMS, CAMERA and metaX toolbox, implemented in the R software [50,51,52]. The combined retention time (RT) and m/z data were used to identify each ion.
In order to explain the physical and chemical properties and biological functions of metabolites, the online PLANTCYC (http://www.plantcyc.org/), KEGG (http://www.kegg.jp/) and in-house (http://spldatabase.saskatoonlibrary.ca/), HMDB (http://www.hmdb.ca/) databases were used to perform level-one and level-two identification and annotation. Screening and quantitative analysis for differential metabolites were conducted using metaX software (http://metax.genomics.cn/).
4.4. RNA Sequencing
RNA isolation, purification and monitoring, and cDNA library construction and sequencing were performed as previously described [53]. Briefly, RNA purity, concentration and integrity were checked, measured and assessed using the NanoPhotometer® spectrophotometer (IMPLEN, Westlake Village, CA, USA), Qubit® RNA Assay Kit in Qubit® 2.0 Flurometer (Life Technologies, Carlsbad, CA, USA) and RNA Nano 6000 Assay Kit of the Agilent Bioanalyzer 2100 system (Agilent Technologies, Santa Clara, CA, USA), respectively. Sequencing libraries were generated using NEBNext® Ultra™ RNA Library Prep Kit for Illumina® (NEB, Ipswich, MA, USA) following manufacturer’s recommendations and were sequenced on an Illumina Hiseq platform. According to the manufacturer’s instructions, NEBNext® Ultra™ RNA Library Prep Kit for Illumina® (NEB, Ipswich, MA, USA) was used to generate sequencing libraries, which were then sequenced on an Illumina Hiseq platform.
4.5. Analysis of Transcription Factors and DEGs (Differentially Expressed Genes)
Transcription factors were predicted using iTAK software [54]. The identification and classification of transcription factors were conducted by previously described methods [55,56]. On the basic of model of negative binomial distribution, DESeq R package (1. 10. 1) was used to perform differential expression analysis by providing statistical routines used to determine differential expression by means of the digital data of gene expression. The false discovery rate was deliberately controlled by the adjusted P values, which were adjusted by Benjamini and Hochberg’s approach. The differentially expressed genes were defined as whose adjusted p-value < 0.05 found by DESeq.
4.6. RT-qPCR (Real-Time Quantitative PCR)
Total RNA was extracted using a modified CTAB (cetyltrimethyl ammonium bromide) method [16]. The testing of RNA quality and determination of RNA concentration were performed by 1.0% agarose gel electrophoresis and micro ultraviolet spectrophotometry (Thermo NanoDrop 2000, Thermo Fisher Scientific, Waltham, MA, USA), respectively. Approximately 1µg of total RNA was determined for cDNA synthesis using RevertAid™ First Strand cDNA synthesis kit (Thermo Fisher Scientific, Waltham, MA, USA). The LightCycler® 480 real-time PCR system with a 96-well plate was used to conduct an amplified reaction consisting of 95 °C for 5 min, followed by 45 cycles of 10 s at 95 °C, 20 s at 60 °C, and 20 s at 72 °C in a volume of 10 μL. At the end of each experiment, a melt-curve analysis was carried out using the default parameters (5 s at 95 °C and 1 min at 65 °C). The Actinidia β-actin was used for normalization [57]. All analyses were repeated three times using biological replicates. Primer sequences are listed in Table S4.
4.7. Statistical Analysis
The relative expressions were calculated using the 2−ΔΔCt method [35], and GraphPad Prism 5 (GraphPad Software Inc., San Diego, CA, USA) was used for chart preparation. The R-3.4.2 and MEGA6 were used to conduct the heatmap and cluster analysis. IBM SPSS Statistics 20 was used to test significant differences.
Supplementary Materials
Supplementary materials can be found at http://www.mdpi.com/1422-0067/19/5/1471/s1.
Author Contributions
Y.L. designed the experiments, carried out the research, analyzed the data, wrote and revised the manuscript. M.L., Y.Z., L.S. and W.C. gave important suggestions and assisted in data analysis. J.F. and X.Q. designed the study and revised the manuscript. All authors participated in this study and approved the final version of the manuscript.
Acknowledgments
This work was supported by the National Natural Science Foundation of China (Grant No. 31401825) and Special Funds for Science and Technology Innovation Project of Chinese Academy of Agricultural Sciences (CAAS-ASTIP-2017-ZFRI).
Conflicts of Interest
The authors declare no conflict of interest.
References
- Huang, H.W.; Ferguson, A.R. Actinidia in China: Natural diversity, phylogeographical evolution, interspecific gene flow and kiwifruit cultivar improvement. Acta Hortic. 2007, 753, 31–40. [Google Scholar] [CrossRef]
- Zhang, Q.; Liu, C.Y.; Liu, Y.F.; Vanburen, R.; Yao, X.H.; Zhong, C.H.; Huang, H.W. High-density interspecific genetic maps of kiwifruit and the identification of sex-specific markers. DNA Res. 2015, 22, 367–375. [Google Scholar] [CrossRef] [PubMed]
- Guroo, I.; Wani, S.A.; Wani, S.M.; Ahmad, M.; Mir, S.A.; Masoodi, S.A. A Review of Production and Processing of Kiwifruit. J. Food Process. Technol. 2017, 8, 699. [Google Scholar] [CrossRef]
- Zhang, L.; Li, Z.Z.; Wang, Y.C.; Jiang, Z.W.; Wang, S.M.; Huang, H.W. Vitamin C, flower color and ploidy variation of hybrids from a ploidy-unbalanced Actinidia interspecific cross and SSR characterization. Euphytica 2010, 175, 133–143. [Google Scholar] [CrossRef]
- Chen, Y.A.; Yang, H.; Liu, Y.F. GAP Production Technology in Kiwifruit; Northwest A&F University Press: Yangling, China, 2013. [Google Scholar]
- Kovinich, N.; Kayanja, G.; Chanoca, A.; Riedl, K.; Otegui, M.S.; Grotewold, E. Not all anthocyanins are born equal: Distinct patterns induced by stress in Arabidopsis. Planta 2014, 240, 671–687. [Google Scholar] [CrossRef] [PubMed]
- Petroni, K.; Tonelli, C. Recent advances on the regulation of anthocyanin synthesis in reproductive organs. Plant Sci. 2011, 181, 219–229. [Google Scholar] [CrossRef] [PubMed]
- Jaakola, L. New insights into the regulation of anthocyanin biosynthesis in fruits. Trends Plant Sci. 2013, 18, 477–483. [Google Scholar] [CrossRef] [PubMed]
- Alipour, B.; Rashidkhani, B.; Edalati, S. Dietary flavonoid intake, total antioxidant capacity and lipid oxidative damage: A cross-sectional study of Iranian women. Nutrition 2016, 32, 566–572. [Google Scholar] [CrossRef] [PubMed]
- Hichri, I.; Barrieu, F.; Bogs, J.; Kappel, C.; Delrot, S.; Lauvergeat, V. Recent advances in the transcriptional regulation of the flavonoid biosynthetic pathway. J. Exp. Bot. 2011, 62, 2465. [Google Scholar] [CrossRef] [PubMed]
- Li, W.B.; Liu, Y.F.; Zeng, S.H.; Xiao, G.; Wang, G.; Wang, Y.; Peng, M.; Huang, H.W. Gene expression profiling of development and anthocyanin accumulation in kiwifruit (Actinidia chinensis) based on transcriptome sequencing. PLoS ONE 2015, 10, e0136439. [Google Scholar] [CrossRef]
- Man, Y.P.; Wang, Y.C.; Li, Z.Z.; Jiang, Z.W.; Yang, H.L.; Gong, J.J.; He, S.S.; Wu, S.Q.; Yang, Z.Q.; Zheng, J.; et al. High-temperature inhibition of biosynthesis and transportation of anthocyanins results in the poor red coloration in red-fleshed Actinidia chinensis. Physiol. Plant. 2015, 153, 565–583. [Google Scholar] [CrossRef] [PubMed]
- Liu, Y.F.; Zhou, B.; Qi, Y.W.; Chen, X.; Liu, C.H.; Liu, Z.D. Expression differences of pigment structural genes and transcription factors explain flesh coloration in three contrasting kiwifruit cultivars. Front. Plant Sci. 2017, 8, 1507. [Google Scholar] [CrossRef] [PubMed]
- Li, J.Q.; Li, X.W.; Soejarto, D.D. Actinidiaceae (Flora of China). Acta Phytotax. 2007, 45, 633–660. [Google Scholar] [CrossRef]
- Yang, H.L.; Wang, Y.C.; Jiang, Z.W.; Huang, H.W. Construction of cDNA library of ‘Hongyang’ kiwifruit and analysis of F3H expression. Hereditas 2009, 31, 1265–1272. [Google Scholar] [CrossRef] [PubMed]
- Yang, J.; Jiang, Z.W.; Wang, Y.C. Cloning and expression of dihydroflavonol 4-reductase in Actinidia chinensis var. rufopulpa. J. Wuhan Bot. Res. 2010, 28, 673–681. [Google Scholar] [CrossRef]
- Montefiori, M.; Espley, R.V.; Stevenson, D.; Cooney, J.; Datson, P.M.; Saiz, A.; Atkinson, R.G.; Hellens, R.P.; Allan, A.C. Identification and characterisation of F3GT1 and F3GGT1, two glycosyltransferases responsible for anthocyanin biosynthesis in red-fleshed kiwifruit (Actinidia chinensis). Plant J. 2011, 65, 106–118. [Google Scholar] [CrossRef] [PubMed]
- Zhang, L.; Man, Y.P.; Jiang, Z.W.; Wang, Y.C. Cloning and expression of anthocyanin pathway genes, AcCHS and AcLDOX, in Actinidia chinensis. Acta Hortic. Sin. 2012, 39, 2124–2132. [Google Scholar]
- Fraser, L.G.; Seal, A.G.; Montefiori, M.; McGhie, T.K.; Tsang, G.K.; Datson, P.M.; Hilario, E.; Marsh, H.E.; Dunn, J.K.; Hellens, R.P.; et al. An R2R3 MYB transcription factor determines red petal colour in an Actinidia (kiwifruit) hybrid population. BMC Genom. 2013, 14, 28. [Google Scholar] [CrossRef] [PubMed]
- Fridman, E.; Pichersky, E. Metabolomics, genomics, proteomics, and the identification of enzymes and their substrates and products. Curr. Opin. Plant Biol. 2005, 8, 242–248. [Google Scholar] [CrossRef] [PubMed]
- Moreno-Risueno, M.A.; Busch, W.; Benfey, P.N. Omics meet networks—Using systems approaches to infer regulatory networks in plants. Curr. Opin. Plant Biol. 2010, 13, 126–131. [Google Scholar] [CrossRef] [PubMed]
- Saito, K.; Matsuda, F. Metabolomics for Functional Genomics, Systems Biology, and Biotechnology. Annu. Rev. Plant Biol. 2010, 61, 463–489. [Google Scholar] [CrossRef] [PubMed]
- Kaiser, K.A. Metabolic Profiling of Primary and Secondary Biosynthetic Pathways in Angiosperms: Comparative Metabonomics and Applications of Hyphenated LC-NMR and LC-MS; University of California: Riverside, CA, USA, 2012. [Google Scholar]
- Lou, Q.; Liu, Y.; Qi, Y.; Jiao, S.; Tian, F.; Jiang, L.; Wang, Y. Transcriptome sequencing and metabolite analysis reveals the role of delphinidin metabolism in flower colour in grape hyacinth. J. Exp. Bot. 2014, 65, 3157–3164. [Google Scholar] [CrossRef] [PubMed]
- Matus, J.T. Transcriptomic and metabolomic networks in the grape berry illustrate that it takes more than flavonoids to fight against ultraviolet radiation. Front. Plant Sci. 2016, 7, 1337. [Google Scholar] [CrossRef] [PubMed]
- Wang, Z.R.; Cui, Y.Y.; Vainstein, A.; Chen, S.W.; Ma, H.Q. Regulation of Fig (Ficus carica L.) Fruit Color: Metabolomic and Transcriptomic Analyses of the Flavonoid Biosynthetic Pathway. Front. Plant Sci. 2017, 8, 1990. [Google Scholar] [CrossRef] [PubMed]
- Race, A.M.; Styles, I.B.; Bunch, J. Inclusive sharing of mass spectrometry imaging data requires a converter for all. J. Proteom. 2012, 75, 5111–5112. [Google Scholar] [CrossRef] [PubMed]
- Hsu, H.H.; Araki, M.; Mochizuki, M.; Hori, Y.; Murata, M.; Kahar, P.; Yoshida, T.; Hasunuma, T.; Konda, A. A Systematic Approach to Time-series Metabolite Profiling and RNA-seq Analysis of Chinese Hamster Ovary Cell Culture. Sci. Rep. 2017, 7, 43518. [Google Scholar] [CrossRef] [PubMed]
- Ma, D.M.; Wang, Z.; Wang, L.; Alejos-Gonzales, F.; Sun, M.A.; Xie, D.Y. A Genome-Wide Scenario of Terpene Pathways in Self-pollinated Artemisia annua. Mol. Plant 2015, 8, 1580–1598. [Google Scholar] [CrossRef] [PubMed]
- Hall, R.; Beale, M.; Fiehn, O.; Hardy, N.; Sumner, L.; Bino, R. Plant metabolomics: The missing link in functional genomics strategies. Plant Cell 2002, 14, 1437–1440. [Google Scholar] [CrossRef] [PubMed]
- Fiehn, O. Metabolomics—The link between genotypes and phenotypes. Plant Mol. Biol. 2002, 48, 155–171. [Google Scholar] [CrossRef] [PubMed]
- Yang, D.S.; Zhang, J.; Li, M.X.; Shi, L.X. Metabolomics Analysis Reveals the Salt-Tolerant Mechanism in Glycine soja. J. Plant Growth Regul. 2017, 36, 460–471. [Google Scholar] [CrossRef]
- Kim, Y.B.; Park, S.Y.; Thwe, A.A.; Seo, J.M.; Suzuki, T.; Kim, S.J.; Kim, J.K.; Park, S.U. Metabolomic analysis and differential expression of anthocyanin biosynthetic genes in white- and red-flowered buckwheat cultivars (Fagopyrum esculentum). J. Agric. Food Chem. 2013, 61, 10525–10533. [Google Scholar] [CrossRef] [PubMed]
- Zhang, Q.F.; Liu, M.Y.; Ruan, J.Y. Metabolomics analysis reveals the metabolic and functional roles of flavonoids in light-sensitive tea leaves. BMC Plant Biol. 2017, 17, 64. [Google Scholar] [CrossRef] [PubMed]
- Vandesompele, J.; de Preter, K.; Pattyn, F.; Poppe, B.; van Roy, N.; de Paepe, A.; Speleman, F. Accurate normalization of real-time quantitative RT-PCR data by geometric averaging of multiple internal control genes. Genome Biol. 2002, 3, RESEARCH0034.1. [Google Scholar] [CrossRef] [PubMed]
- Salih, H.; Gong, W.; He, S.; Sun, G.; Sun, J.; Du, X. Genome-wide characterization and expression analysis of MYB transcription factors in Gossypium hirsutum. BMC Genet. 2016, 17, 129. [Google Scholar] [CrossRef] [PubMed]
- Boeva, V. Analysis of genomic sequence motifs for deciphering transcription factor binding and transcriptional regulation in eukaryotic cells. Front. Genet. 2016, 7, 24. [Google Scholar] [CrossRef] [PubMed]
- Orenstein, Y.; Shamir, R. Modeling protein–DNA binding via highthroughput in vitro technologies. Brief. Funct. Genom. 2016. [Google Scholar] [CrossRef][Green Version]
- Levine, M.; Davidson, E.H. Gene regulatory networks for development. Proc. Natl. Acad. Sci. USA 2005, 102, 4936–4942. [Google Scholar] [CrossRef] [PubMed]
- Shiu, S.H.; Shih, M.C.; Li, W.H. Transcription factor families have much higher expansion rates in plants than in animals. Plant Physiol. 2005, 139, 18–26. [Google Scholar] [CrossRef] [PubMed]
- Wang, H.; Wang, H.; Shao, H.; Tang, X. Recent advances in utilizing transcription factors to improve plant abiotic stress tolerance by transgenic technology. Front. Plant Sci. 2016, 7, 67. [Google Scholar] [CrossRef] [PubMed]
- Wong, D.C.; Schlechter, R.; Vannozzi, A.; Höll, J.; Hmmam, I.; Bogs, J.; Tornielli, G.B.; Castellarin, S.D.; Matus, J.T. A systems-oriented analysis of the grapevine R2R3-MYB transcription factor family uncovers new insights into the regulation of stilbene accumulation. DNA Res. 2016, 23, 451–466. [Google Scholar] [CrossRef] [PubMed]
- Zhang, X.; Dong, J.; Liu, H.; Wang, J.; Qi, Y.; Liang, Z. Transcriptome sequencing in response to salicylic acid in Salvia miltiorrhiza. PLoS ONE 2016, 11, e0147849. [Google Scholar] [CrossRef] [PubMed]
- Schaart, J.G.; Dubos, C.; Romero De La Fuente, I.; van Houwelingen, A.M.; de Vos, R.C.; Jonker, H.H.; Xu, W.; Routaboul, J.M.; Lepiniec, L.; Bovy, A.G. Identification and characterization of MYB-bHLH-WD40 regulatory complexes controlling proanthocyanidin biosynthesis in strawberry (Fragaria × ananassa) fruits. New Phytol. 2013, 197, 454–467. [Google Scholar] [CrossRef] [PubMed]
- Xu, W.; Dubos, C.; Lepiniec, L. Transcriptional control of flavonoid biosynthesis by MYB-bHLH-WDR complexes. Trends Plant Sci. 2015, 20, 176–185. [Google Scholar] [CrossRef] [PubMed]
- Xu, W.; Grain, D.; Bobet, S.; Le Gourrierec, J.; Thevenin, J.; Kelemen, Z.; Lepiniec, L.; Dubos, C. Complexity and robustness of the flavonoid transcriptional regulatory network revealed by comprehensive analyses of MYB-bHLH-WDR complexes and their targets in Arabidopsis seed. New Phytol. 2014, 202, 132–144. [Google Scholar] [CrossRef] [PubMed]
- Li, W.; Ding, Z.; Ruan, M.; Yu, X.; Peng, M.; Liu, Y. Kiwifruit R2R3-MYB transcription factors and contribution of the novel AcMYB75 to red kiwifruit anthocyanin biosynthesis. Sci. Rep. 2017, 7, 16861. [Google Scholar] [CrossRef] [PubMed]
- Montefiori, M.; Brendolise, C.; Dare, A.P.; Lin-Wang, K.; Davies, K.M.; Hellens, R.P.; Allan, A.C. In the Solanaceae, a hierarchy of bHLHs confer distinct target specificity to the anthocyanin regulatory complex. J. Exp. Bot. 2015, 66, 1427–1436. [Google Scholar] [CrossRef] [PubMed]
- Singh, A.; Desgagnépenix, I. Transcriptome and metabolome profiling of Narcissus pseudonarcissus ‘King Alfred’ reveal components of Amaryllidaceae alkaloid metabolism. Sci. Rep. 2017, 7, 17356. [Google Scholar] [CrossRef] [PubMed]
- Smith, C.A.; Want, E.J.; O’Maille, G.; Abagyan, R.; Siuzdak, G. XCMS: Processing mass spectrometry data for metabolite profiling using nonlinear peak alignment, matching, and identification. Anal. Chem. 2006, 78, 779–787. [Google Scholar] [CrossRef] [PubMed]
- Kuhl, C.; Tautenhahn, R.; Böttcher, C.; Larson, T.R.; Neumann, S. CAMERA: An integrated strategy for compound spectra extraction and annotation of liquid chromatography/mass spectrometry data sets. Anal. Chem. 2012, 84, 283–289. [Google Scholar] [CrossRef] [PubMed]
- Wen, B.; Mei, Z.; Zeng, C.; Liu, S. metaX: A flexible and comprehensive software for processing metabolomics data. BMC Bioinform. 2017, 18, 183. [Google Scholar] [CrossRef] [PubMed]
- Li, Y.K.; Fang, J.B.; Qi, X.J.; Lin, M.M.; Zhong, Y.P.; Sun, L.M. A key structural gene, AaLDOX, is involved in anthocyanin biosynthesis in all red-fleshed kiwifruit (Actinidia arguta) based on transcriptome analysis. Gene 2018, 648, 31–41. [Google Scholar] [CrossRef] [PubMed]
- Zheng, Y.; Jiao, C.; Sun, H.; Rosli, H.G.; Pombo, M.A.; Zhang, P.; Banf, M.; Dai, X.; Martin, G.B.; Giovannoni, J.J.; et al. iTAK: A program for genome-wide prediction and classification of plant transcription factors, transcriptional regulators, and protein kinases. Mol. Plant 2016, 9, 1667–1670. [Google Scholar] [CrossRef] [PubMed]
- Pérez-Rodríguez, P.; Riaño-Pachón, D.M.; Corrêa, L.G.; Rensing, S.A.; Kersten, B.; Mueller-Roeber, B. PlnTFDB: Updated content and new features of the plant transcription factor database. Nucleic Acids Res. 2010, 38, D822–D827. [Google Scholar] [CrossRef] [PubMed]
- Jin, J.; Zhang, H.; Kong, L.; Gao, G.; Luo, J. PlantTFDB 3.0: A portal for the functional and evolutionary study of plant transcription factors. Nucleic Acids Res. 2014, 42, D1182–D1187. [Google Scholar] [CrossRef] [PubMed]
- Ampomah-Dwamena, C.; McGhie, T.; Reginald, W.; Montefiori, M.; Hellens, R.P.; Allan, A.C. The kiwifruit lycopene beta-cyclase plays a significant role in carotenoid accumulation in fruit. J. Exp. Bot. 2009, 60, 3765–3779. [Google Scholar] [CrossRef] [PubMed]
© 2018 by the authors. Licensee MDPI, Basel, Switzerland. This article is an open access article distributed under the terms and conditions of the Creative Commons Attribution (CC BY) license (http://creativecommons.org/licenses/by/4.0/).