RrGT2, A Key Gene Associated with Anthocyanin Biosynthesis in Rosa rugosa, Was Identified Via Virus-Induced Gene Silencing and Overexpression

Abstract

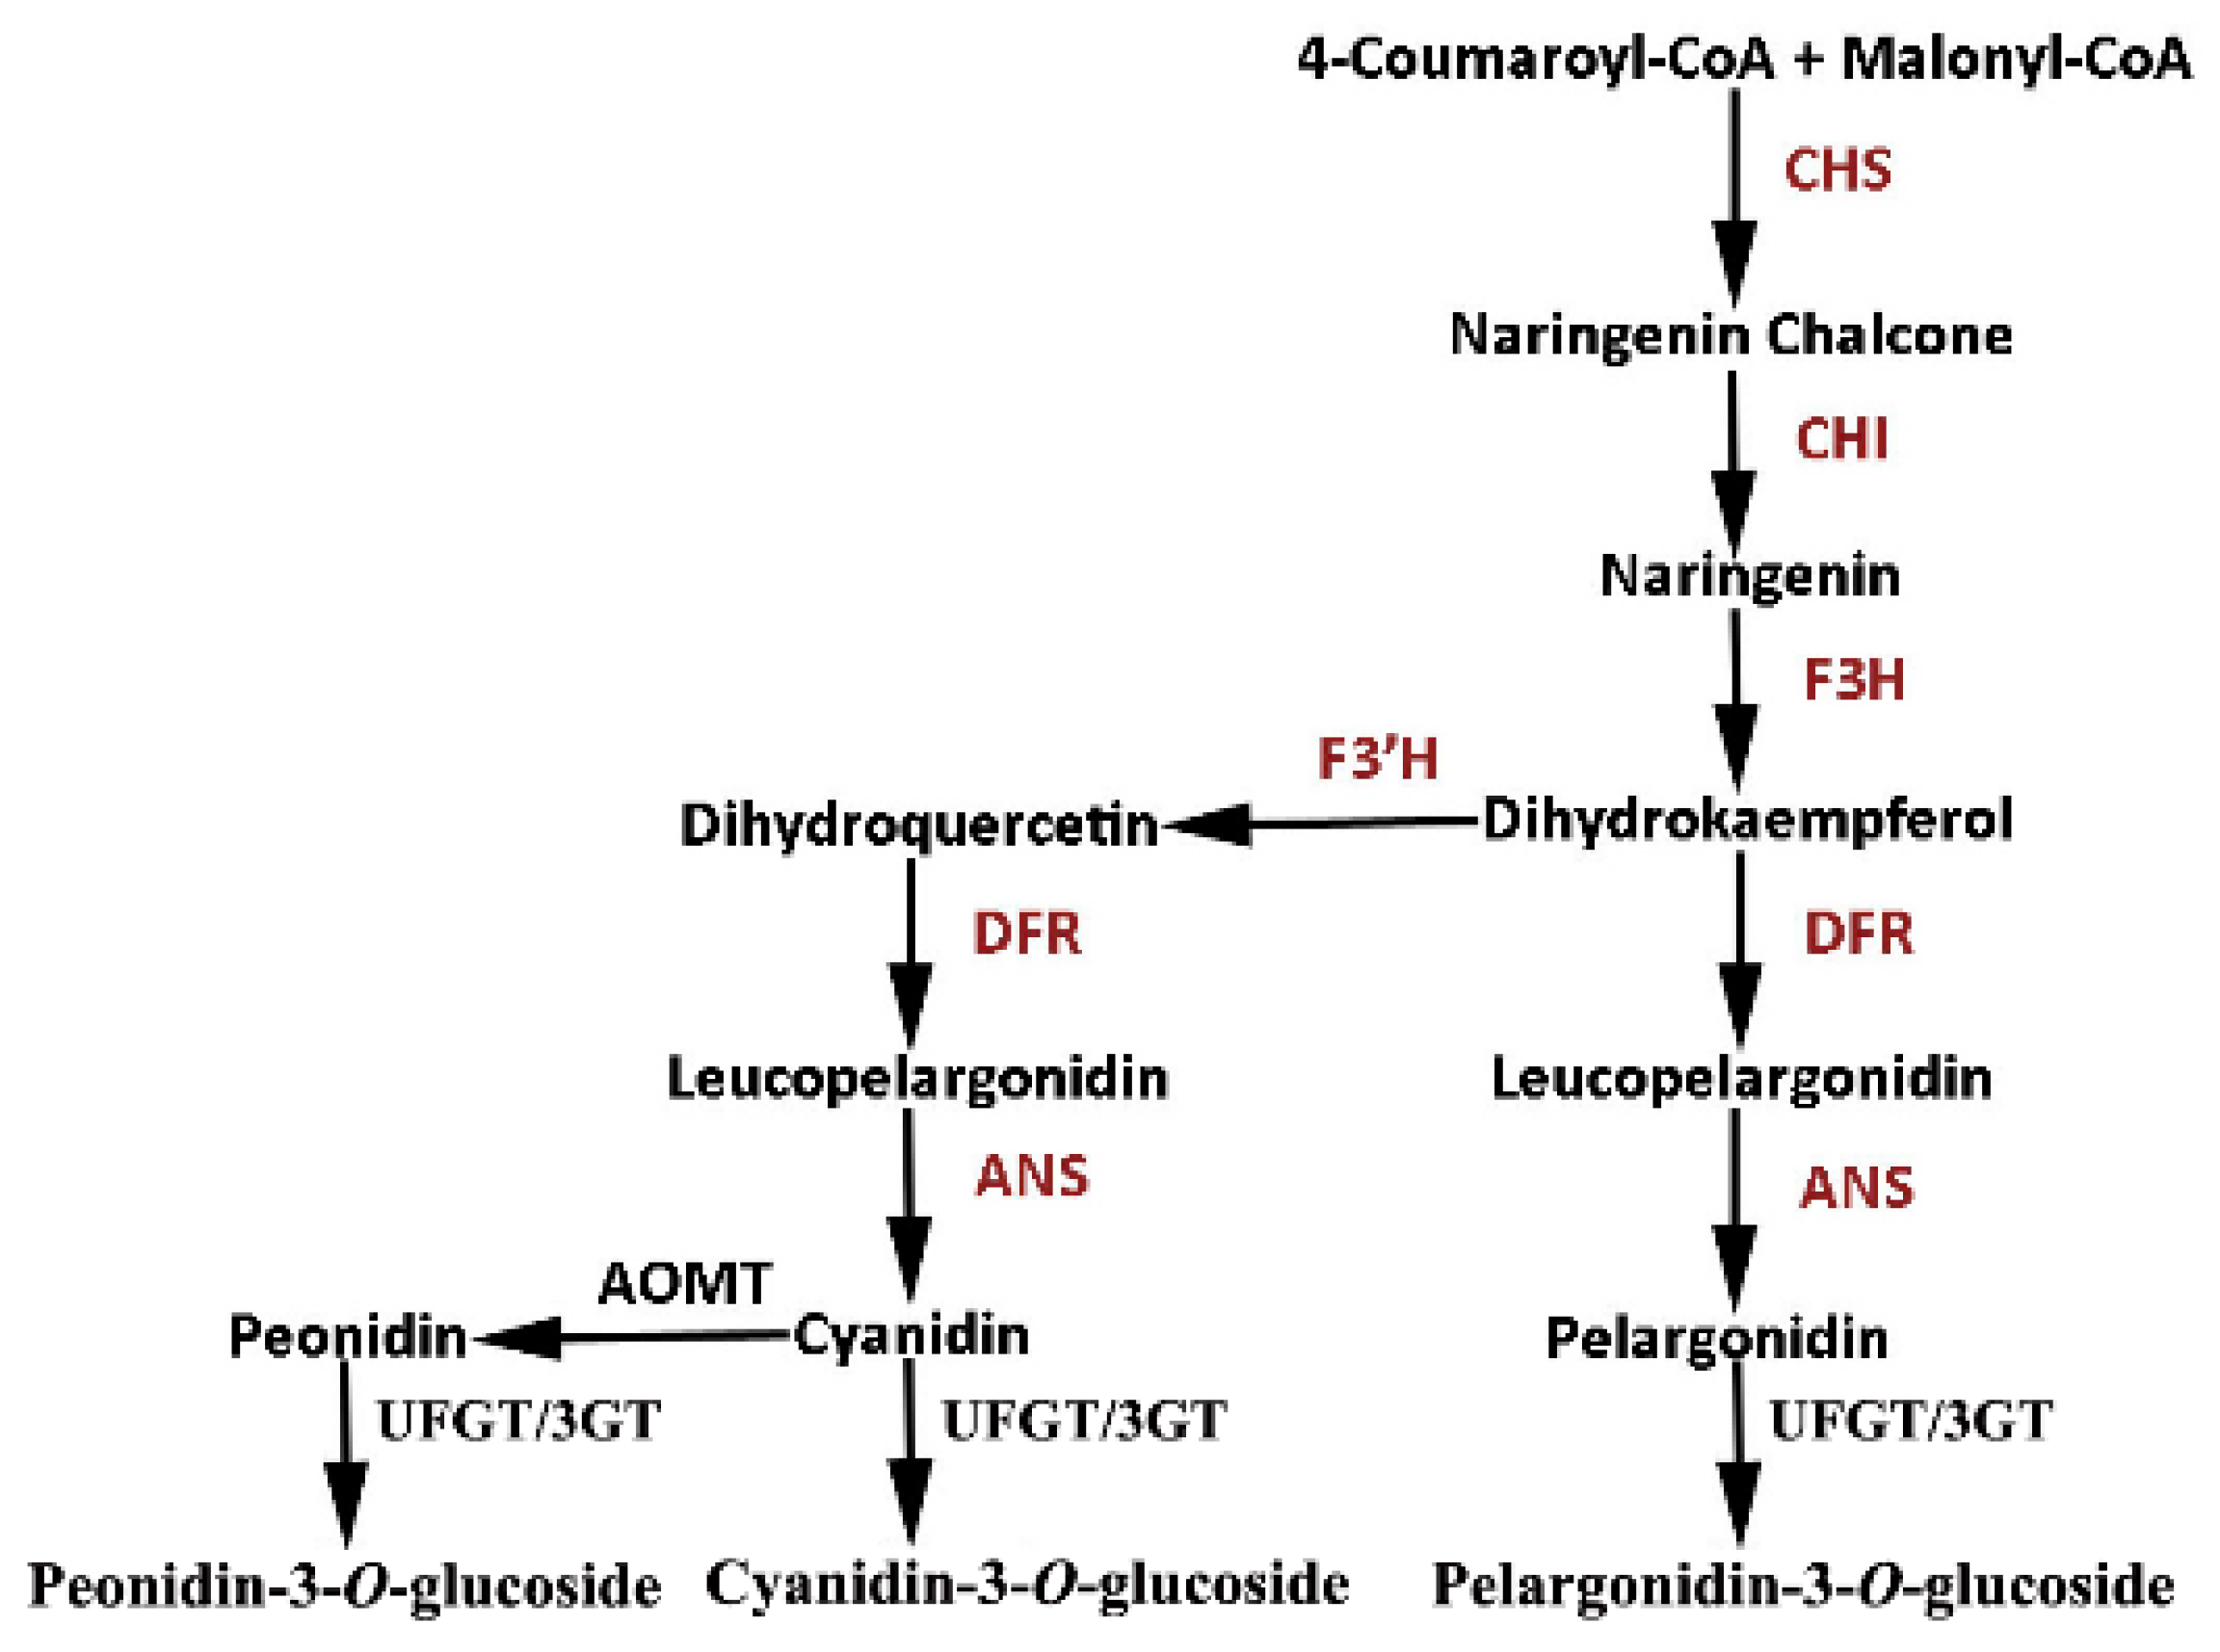
1. Introduction
2. Results
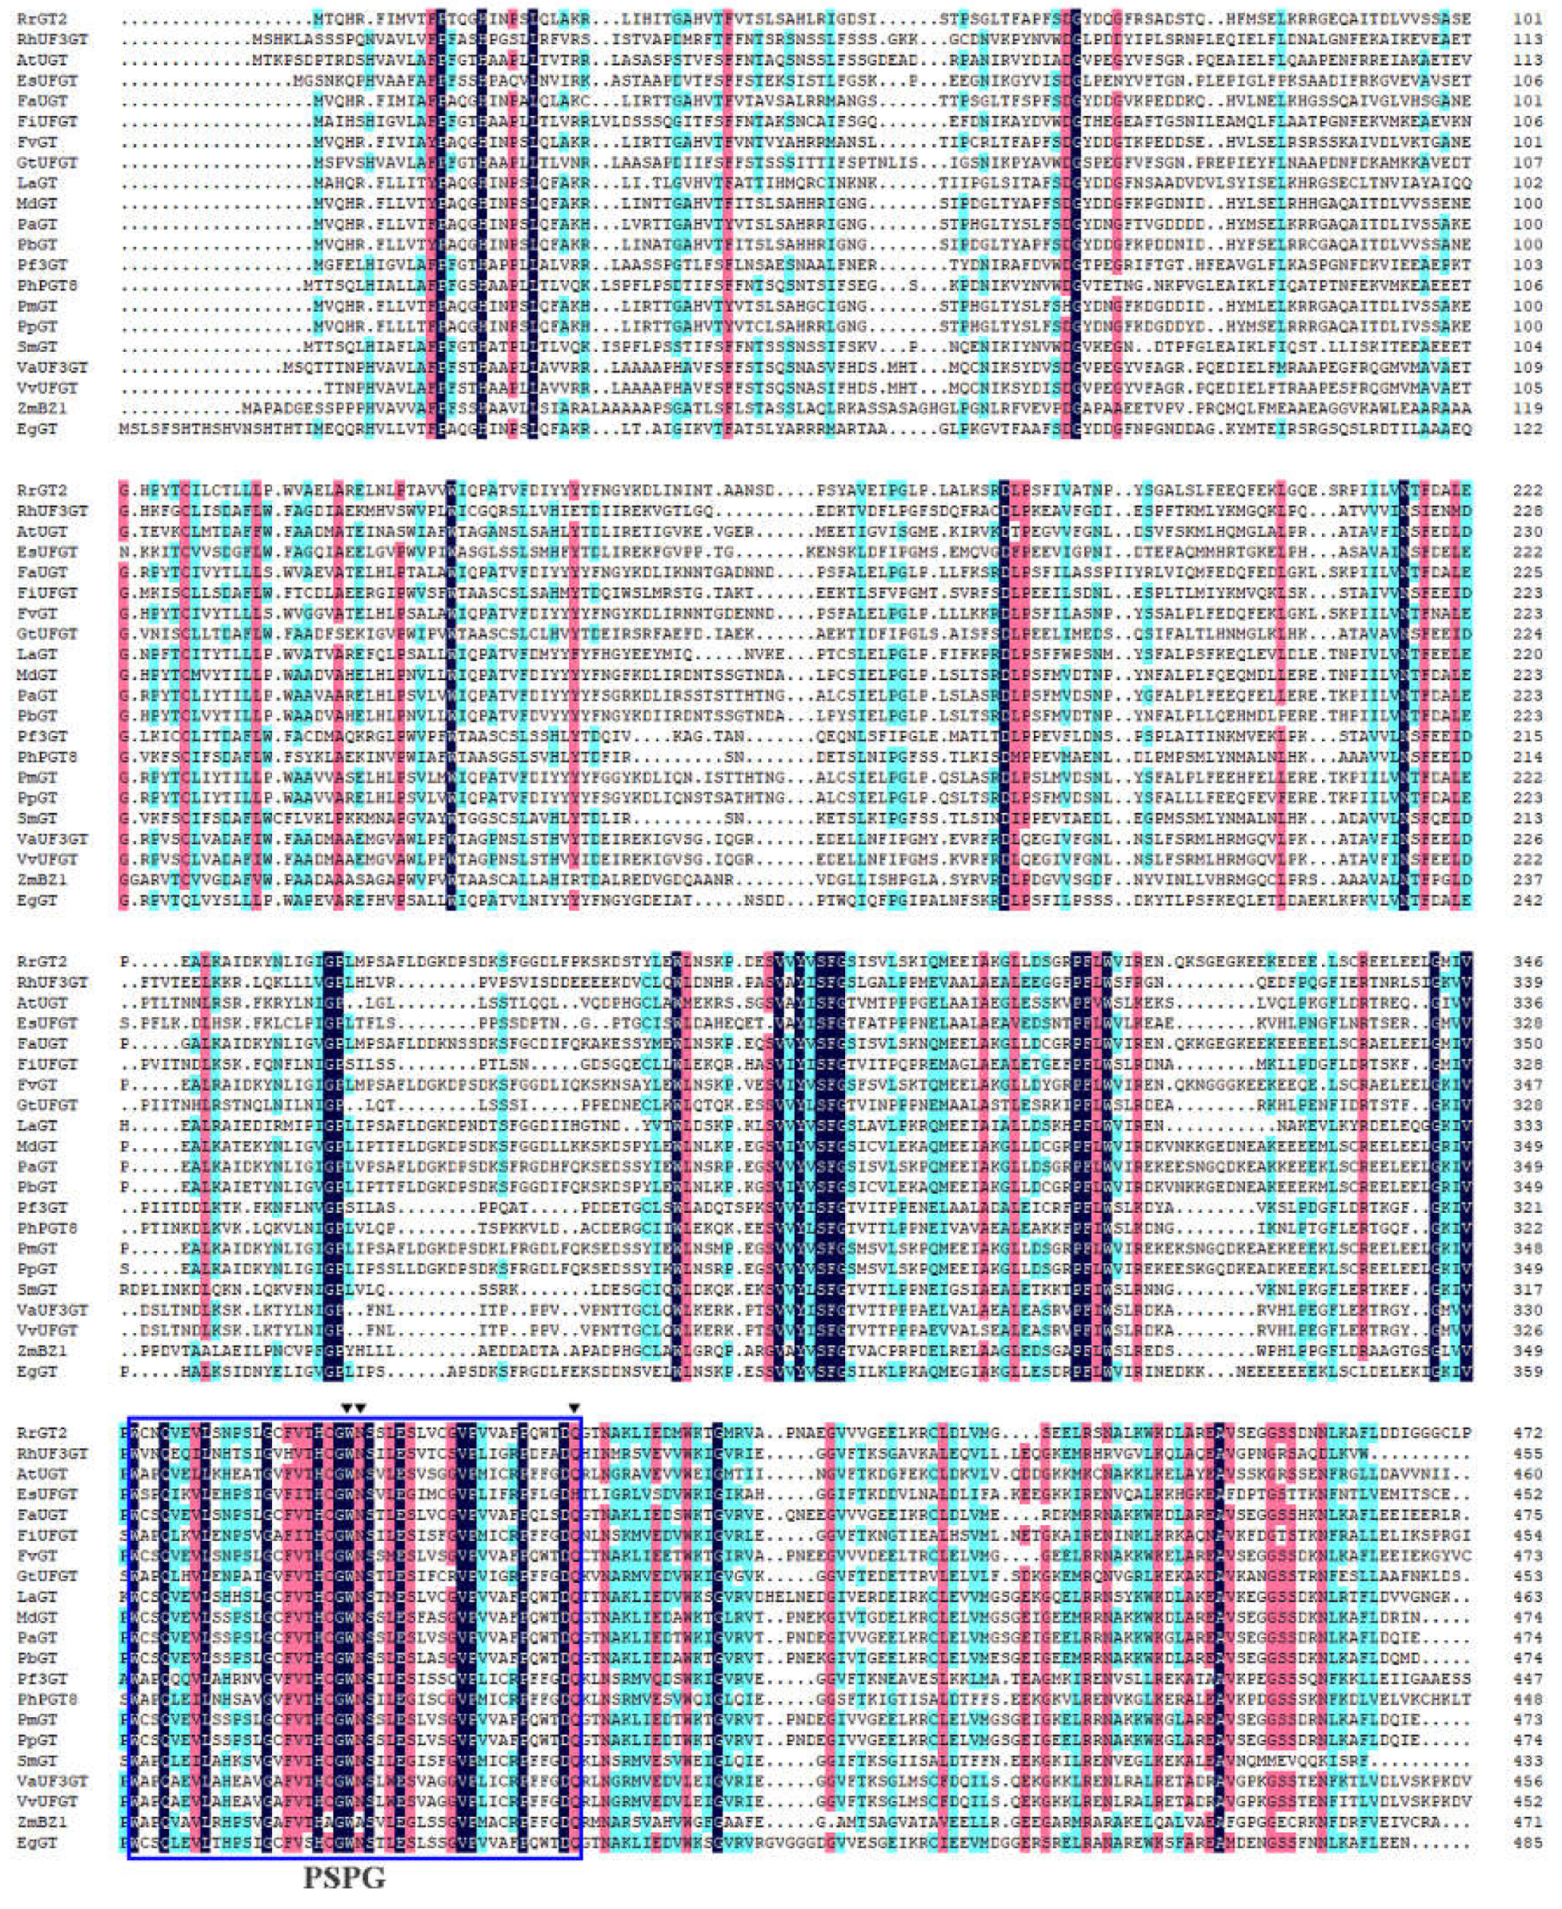
2.1. Cloning of RrGT2 and Sequence Analysis
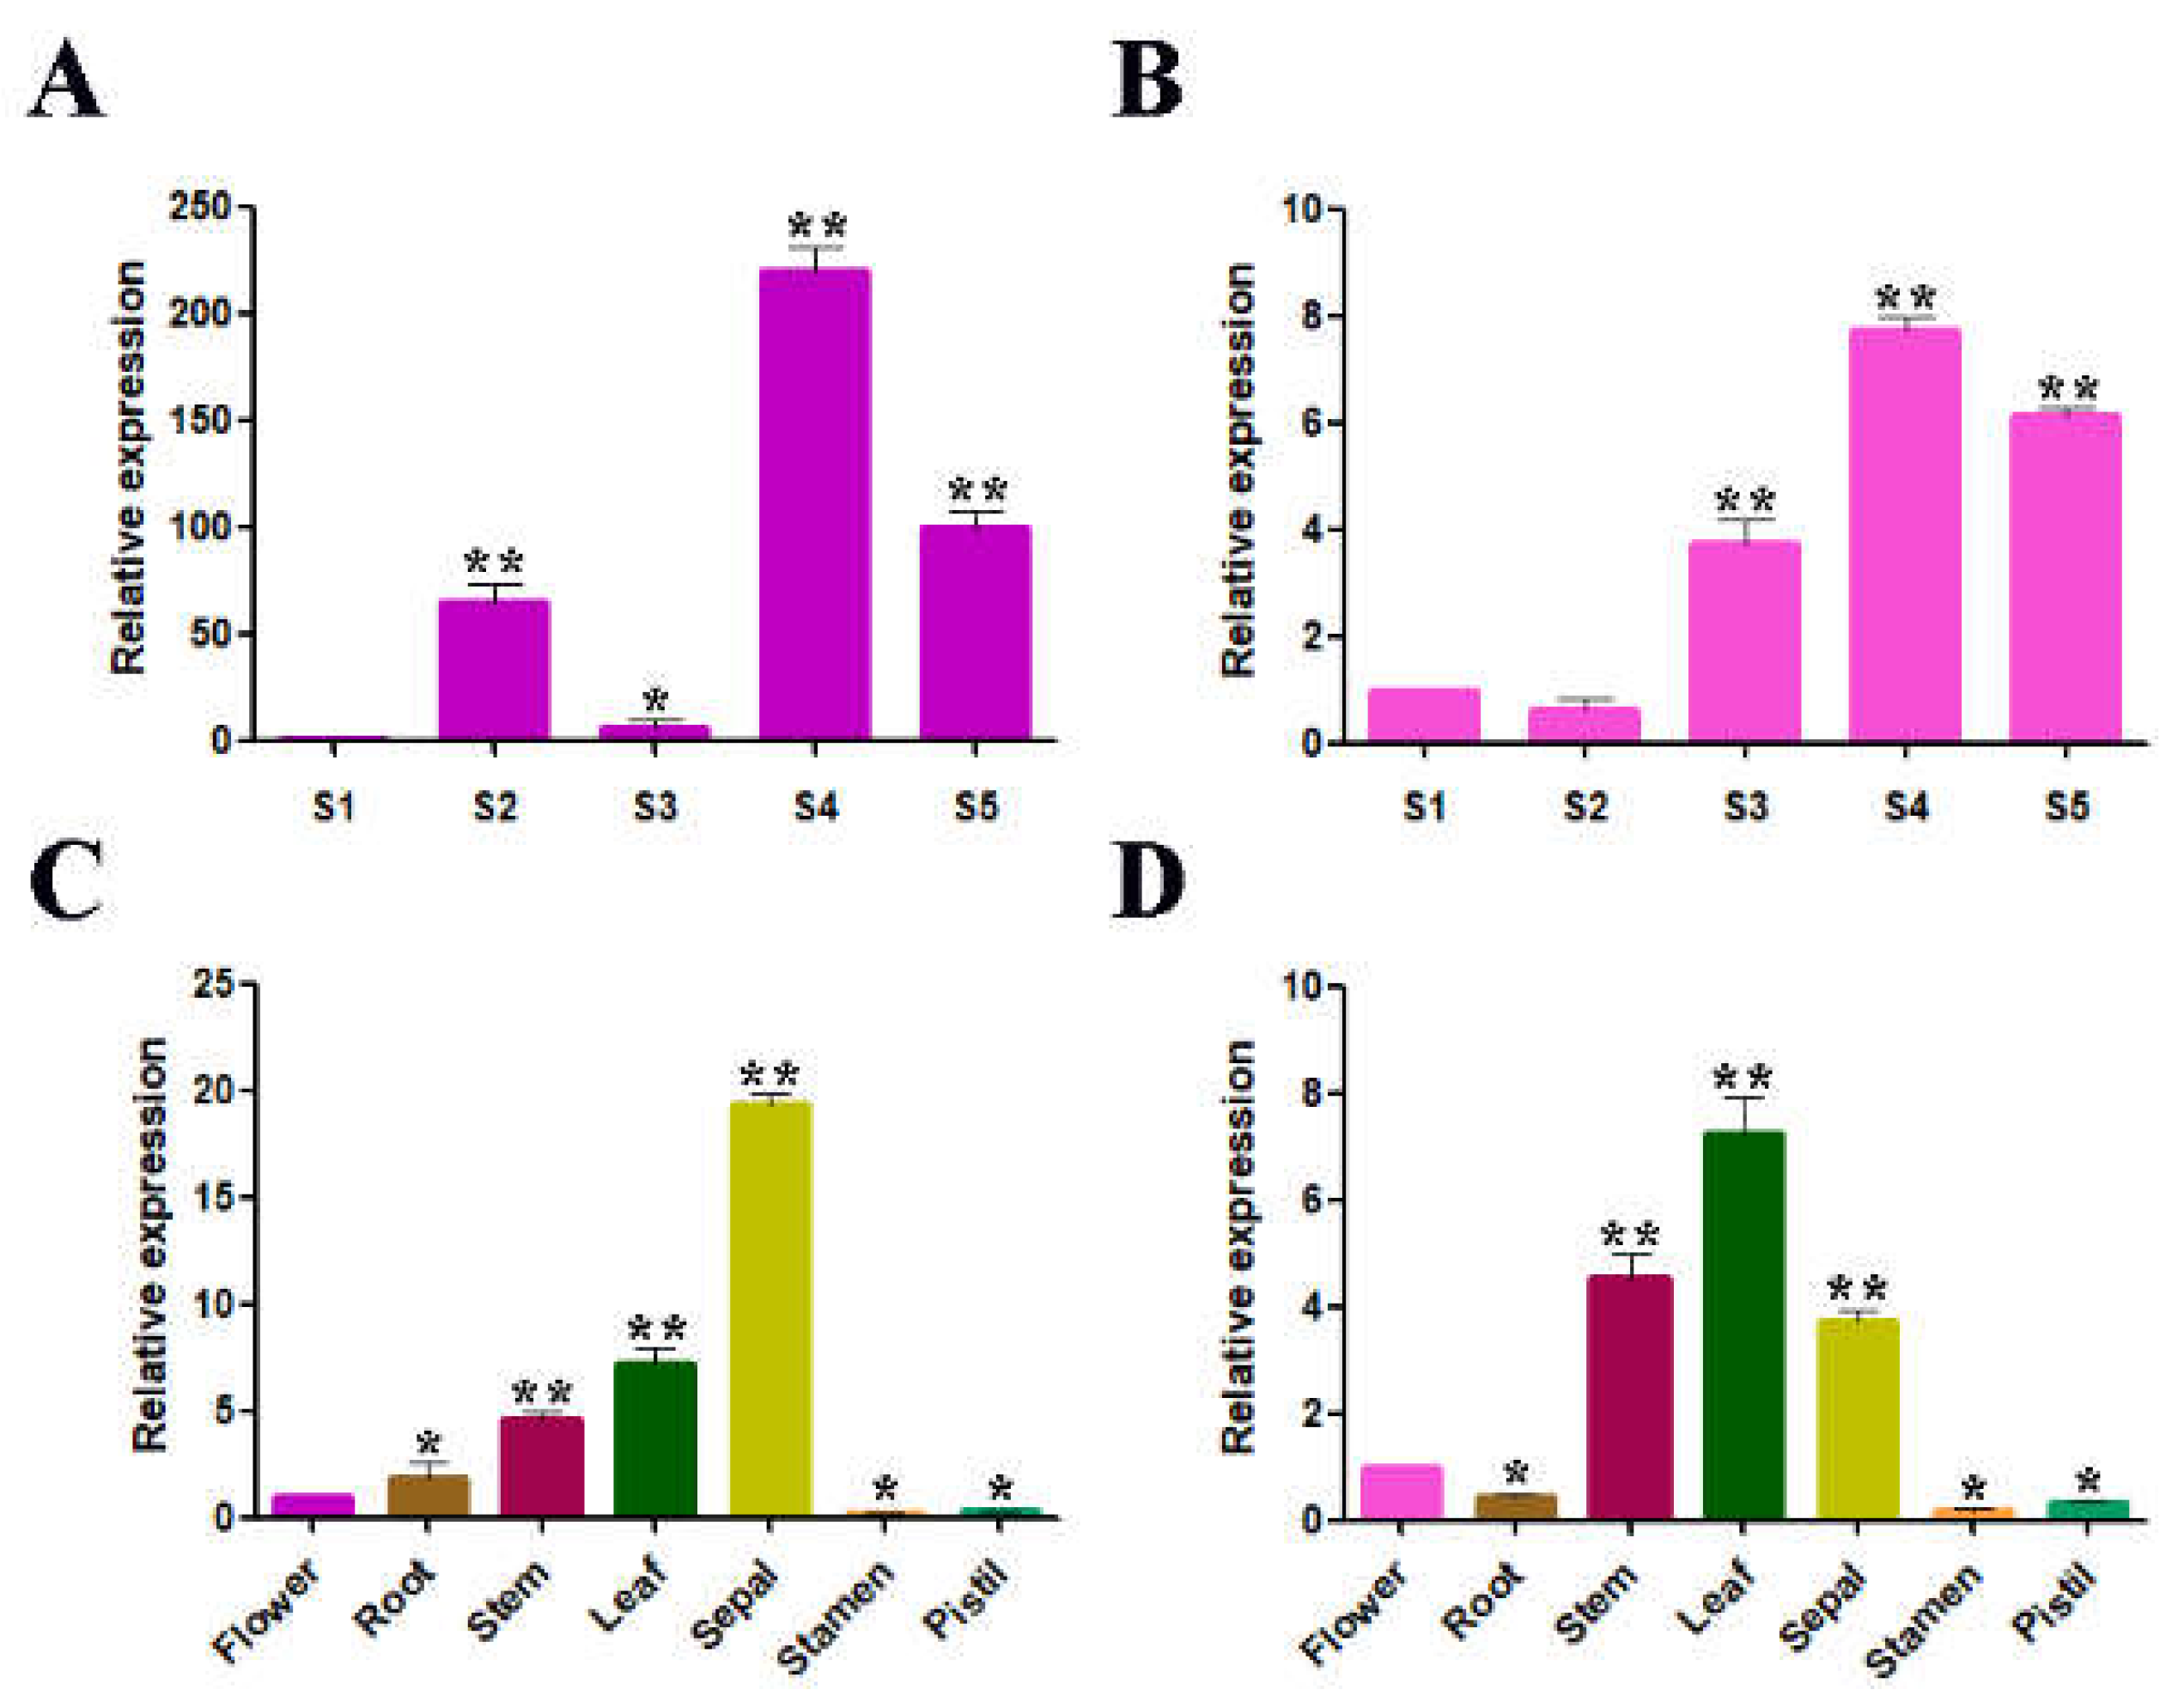
2.2. Temporal and Spatial Expression Patterns of RrGT2 in Rosa
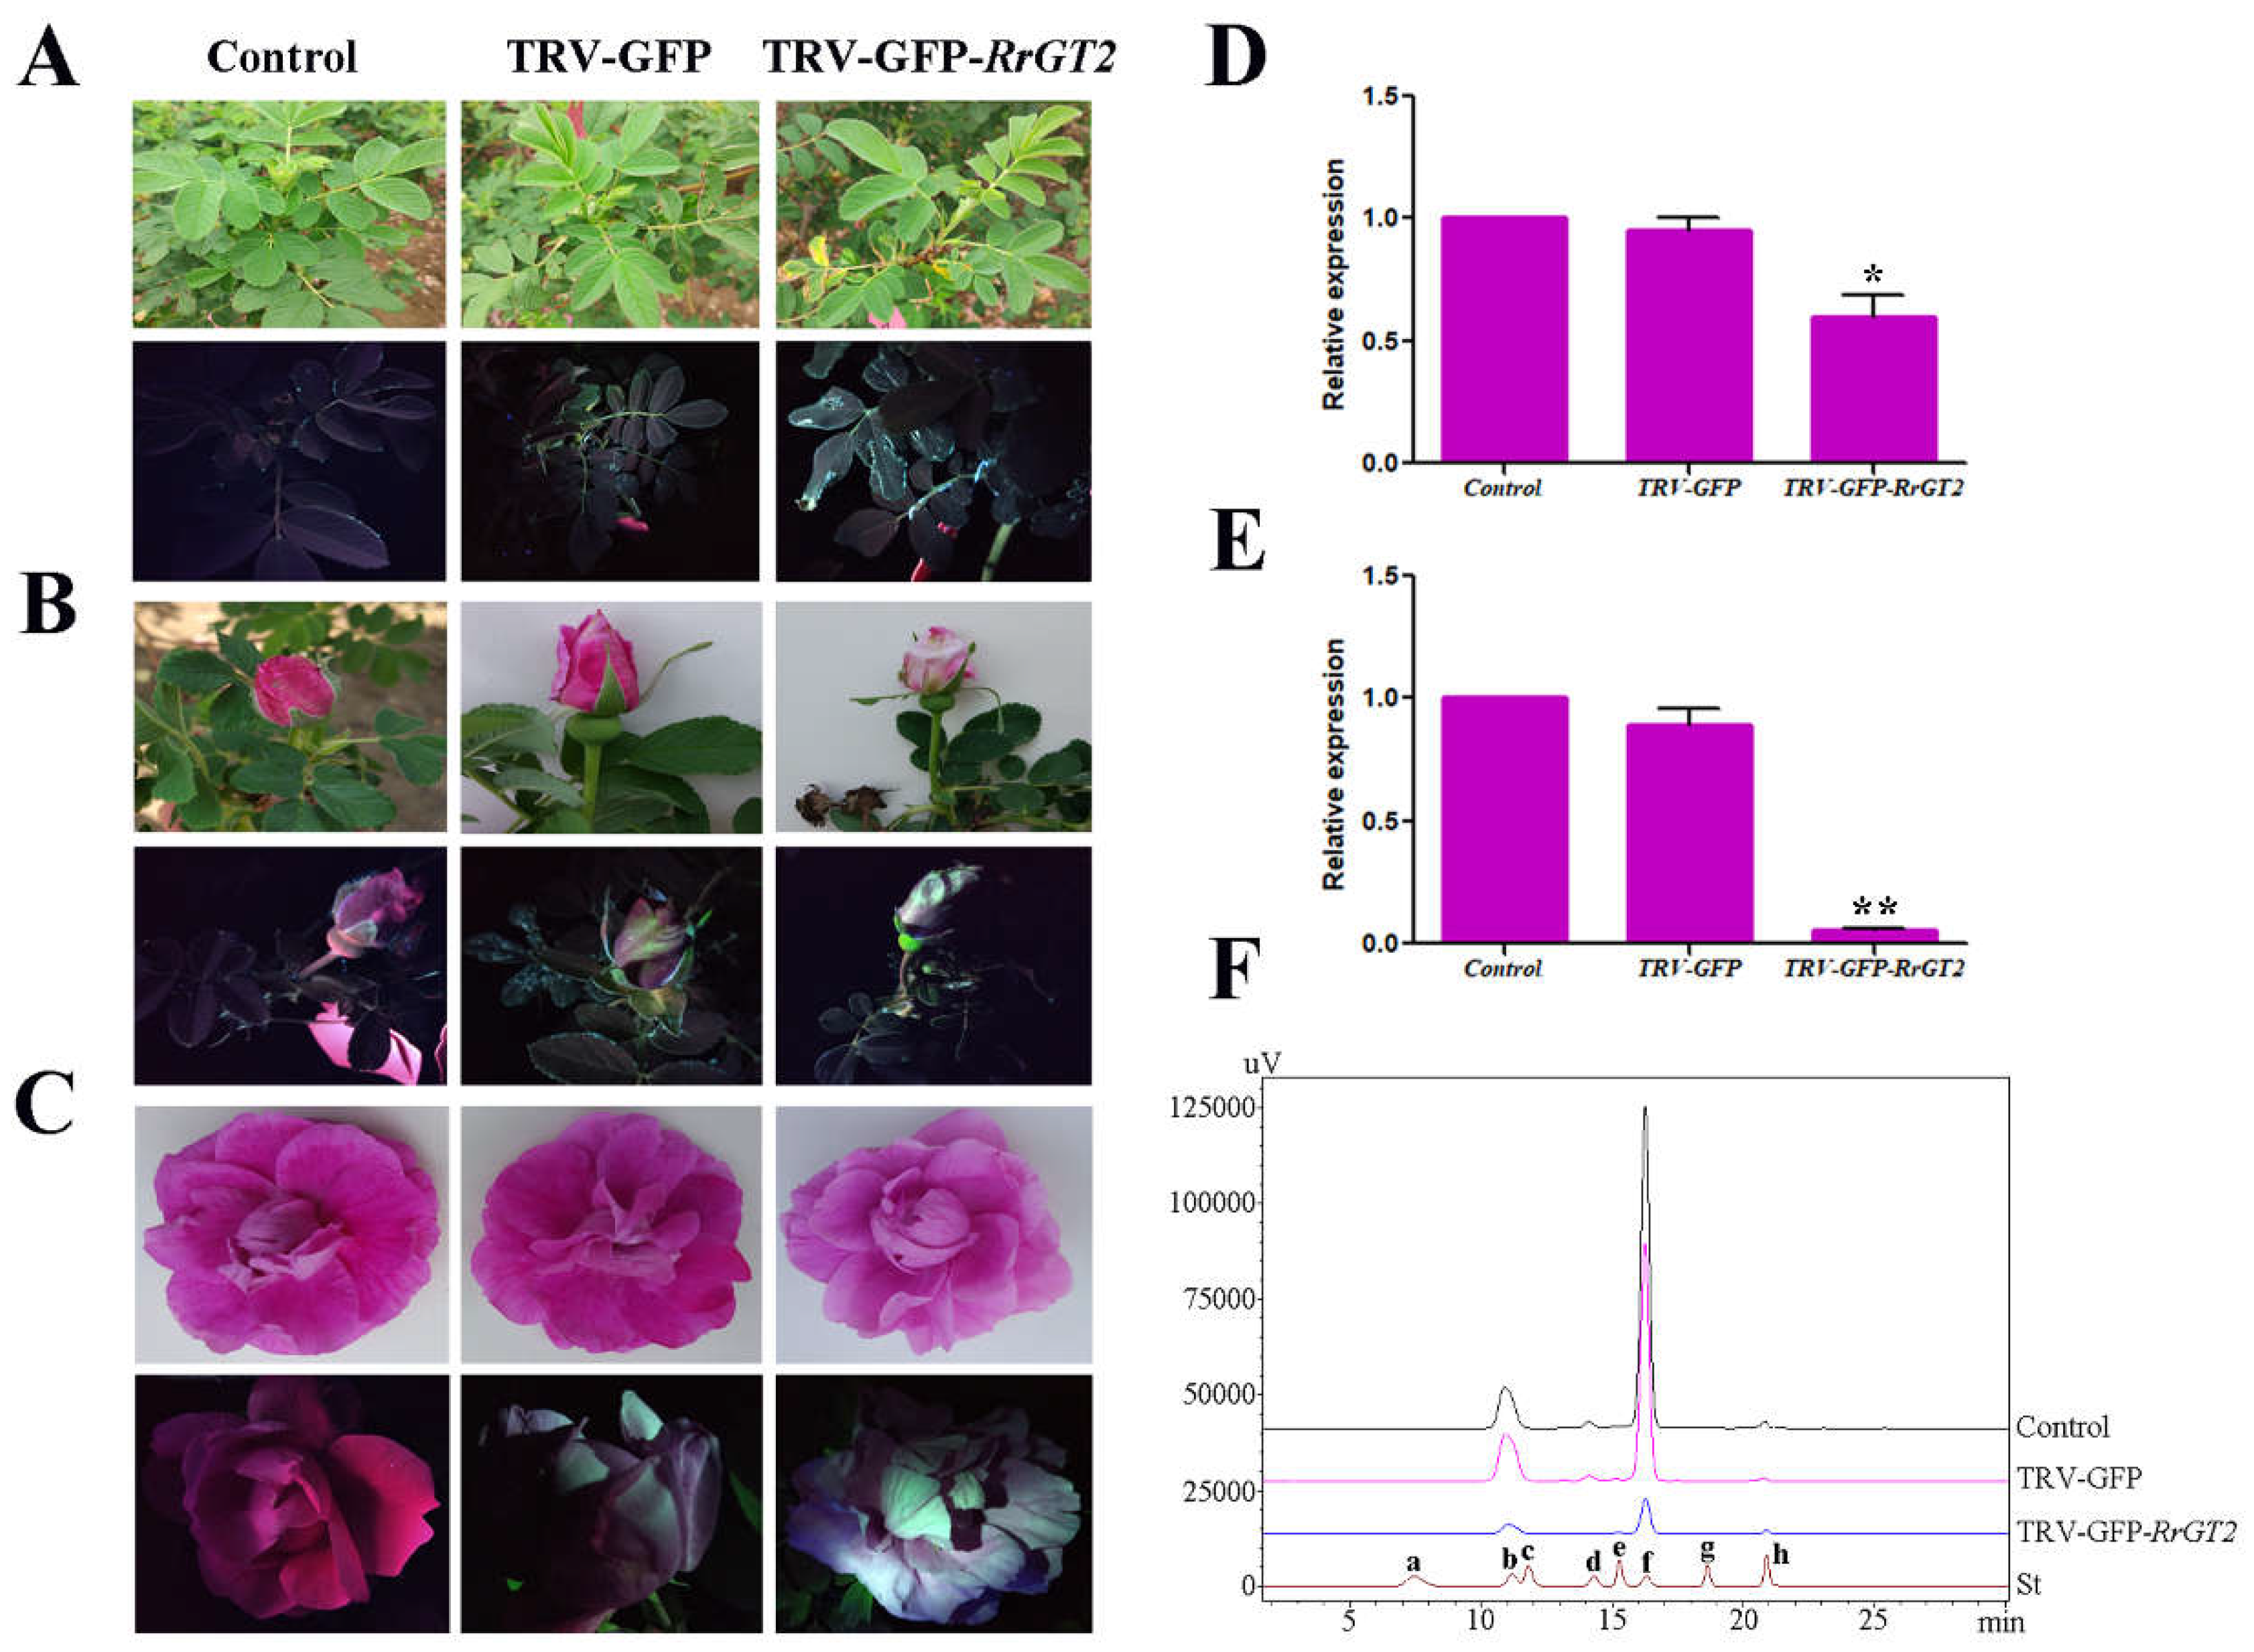
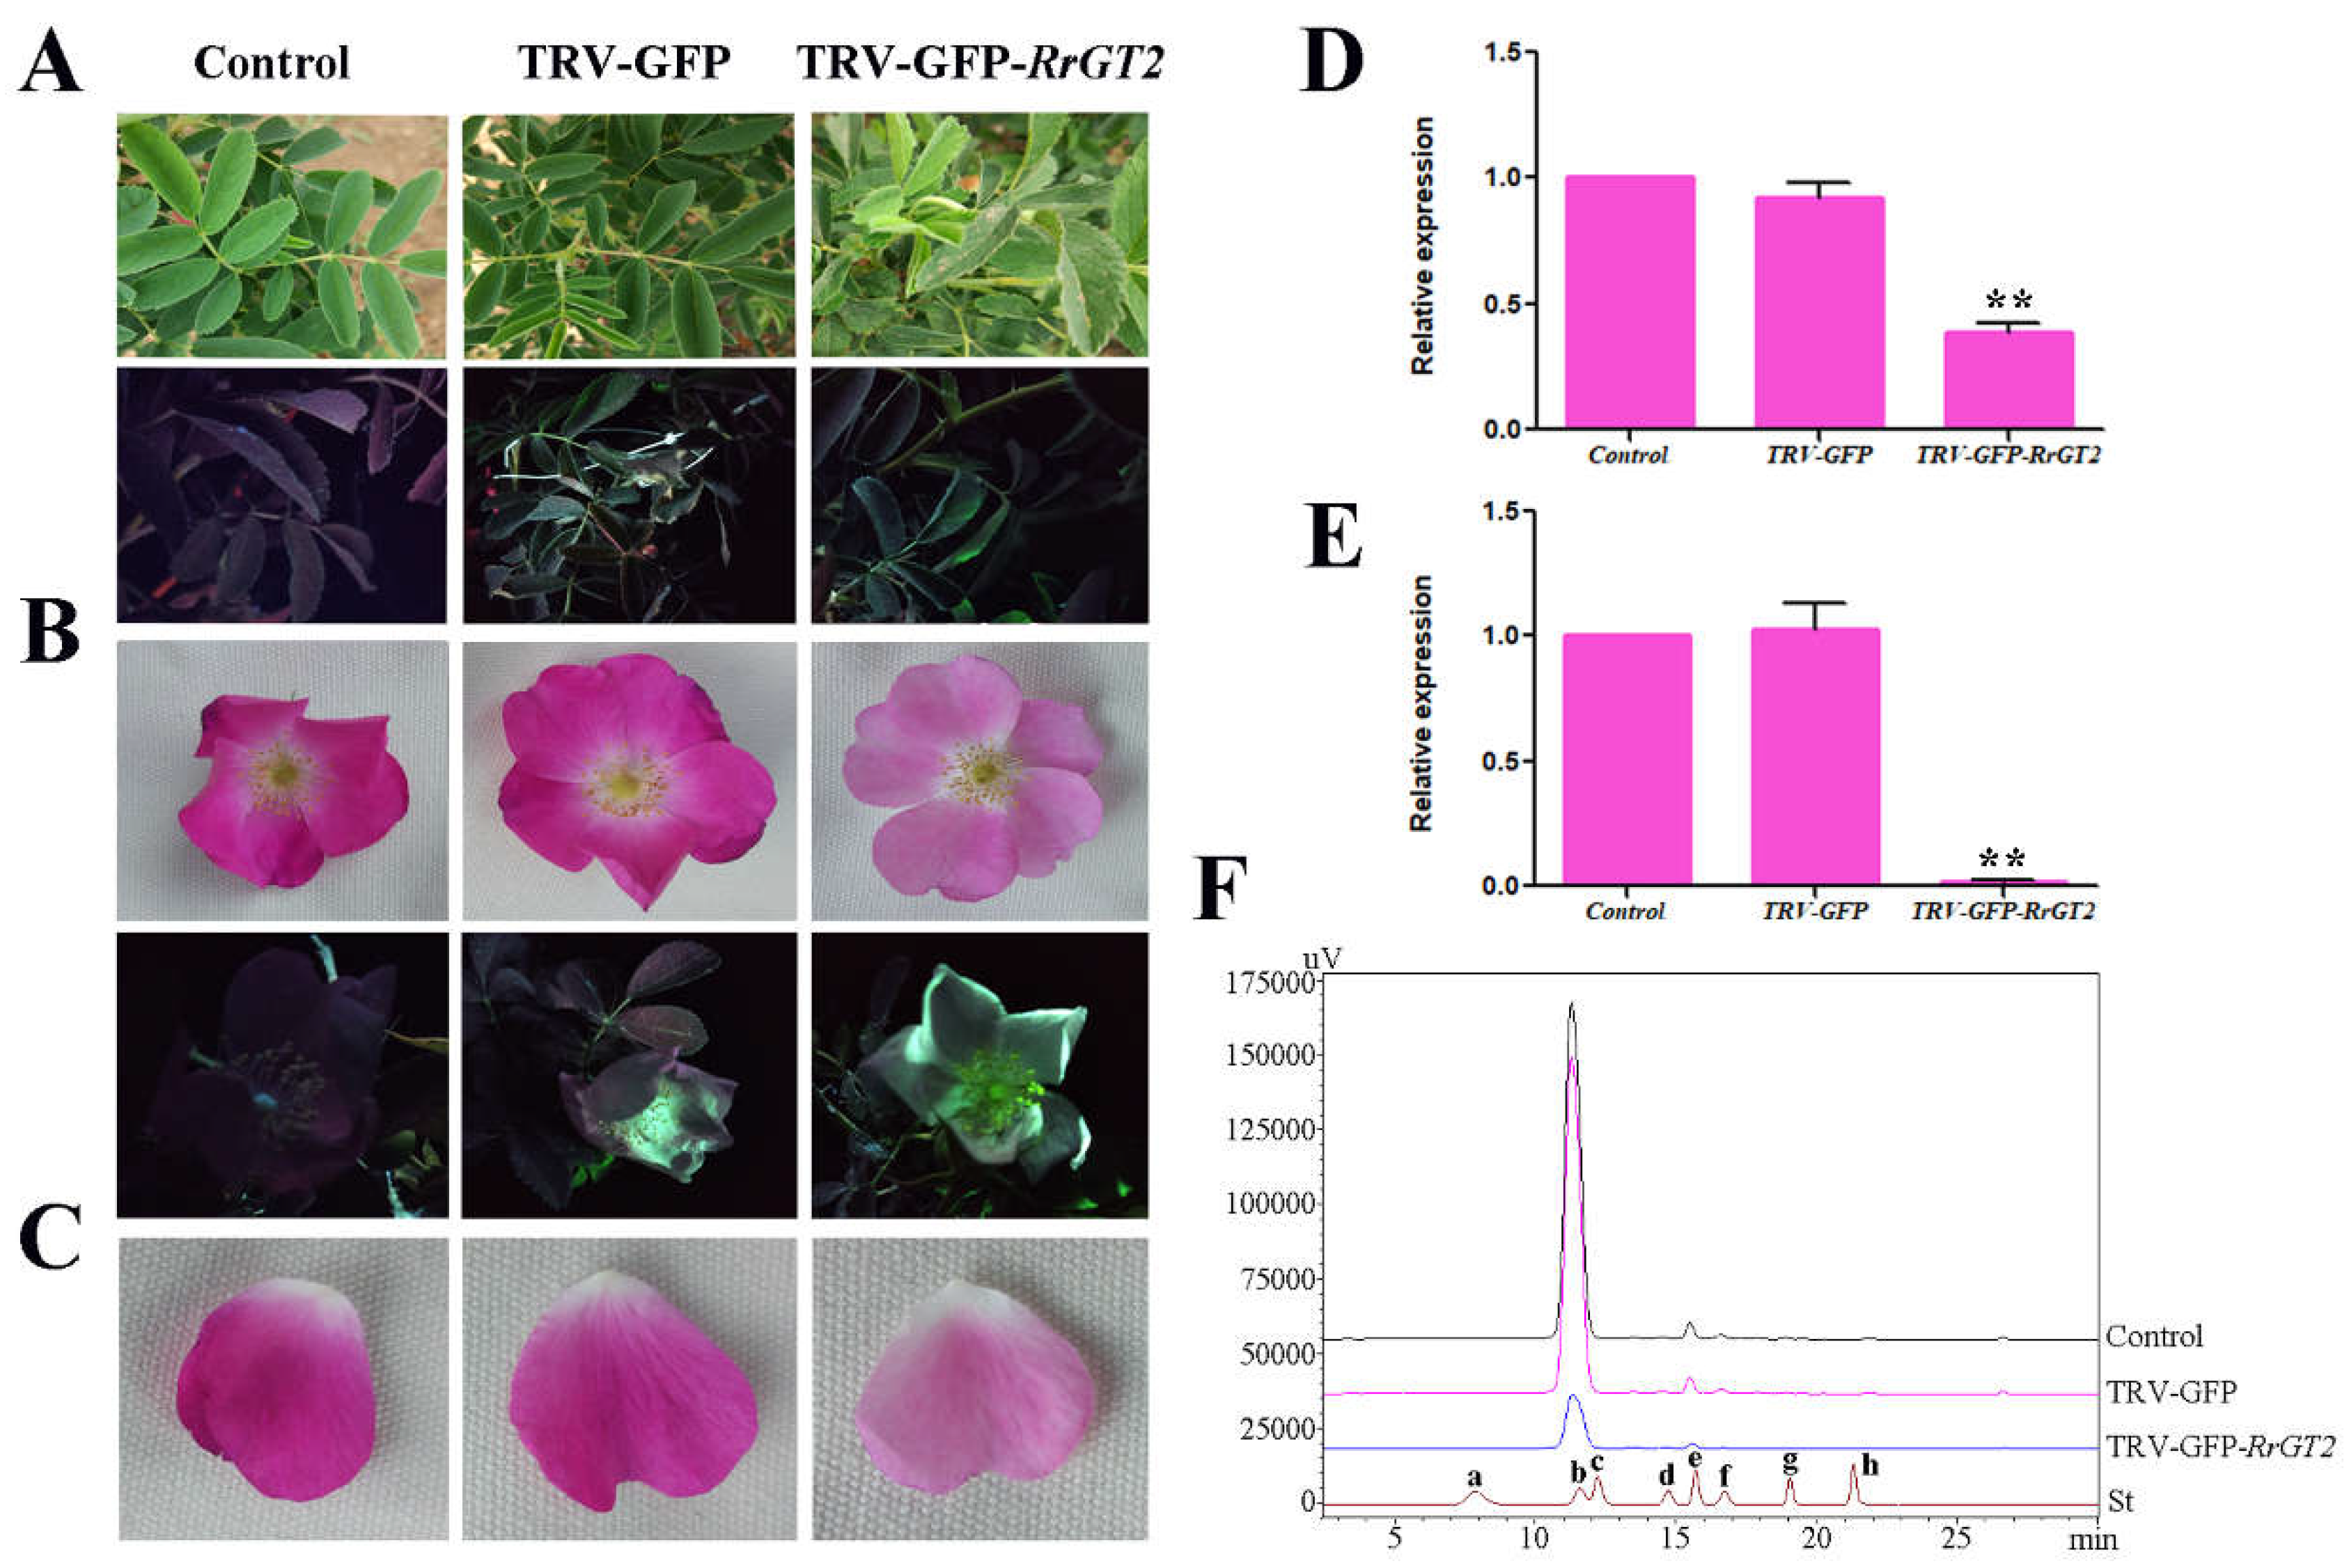
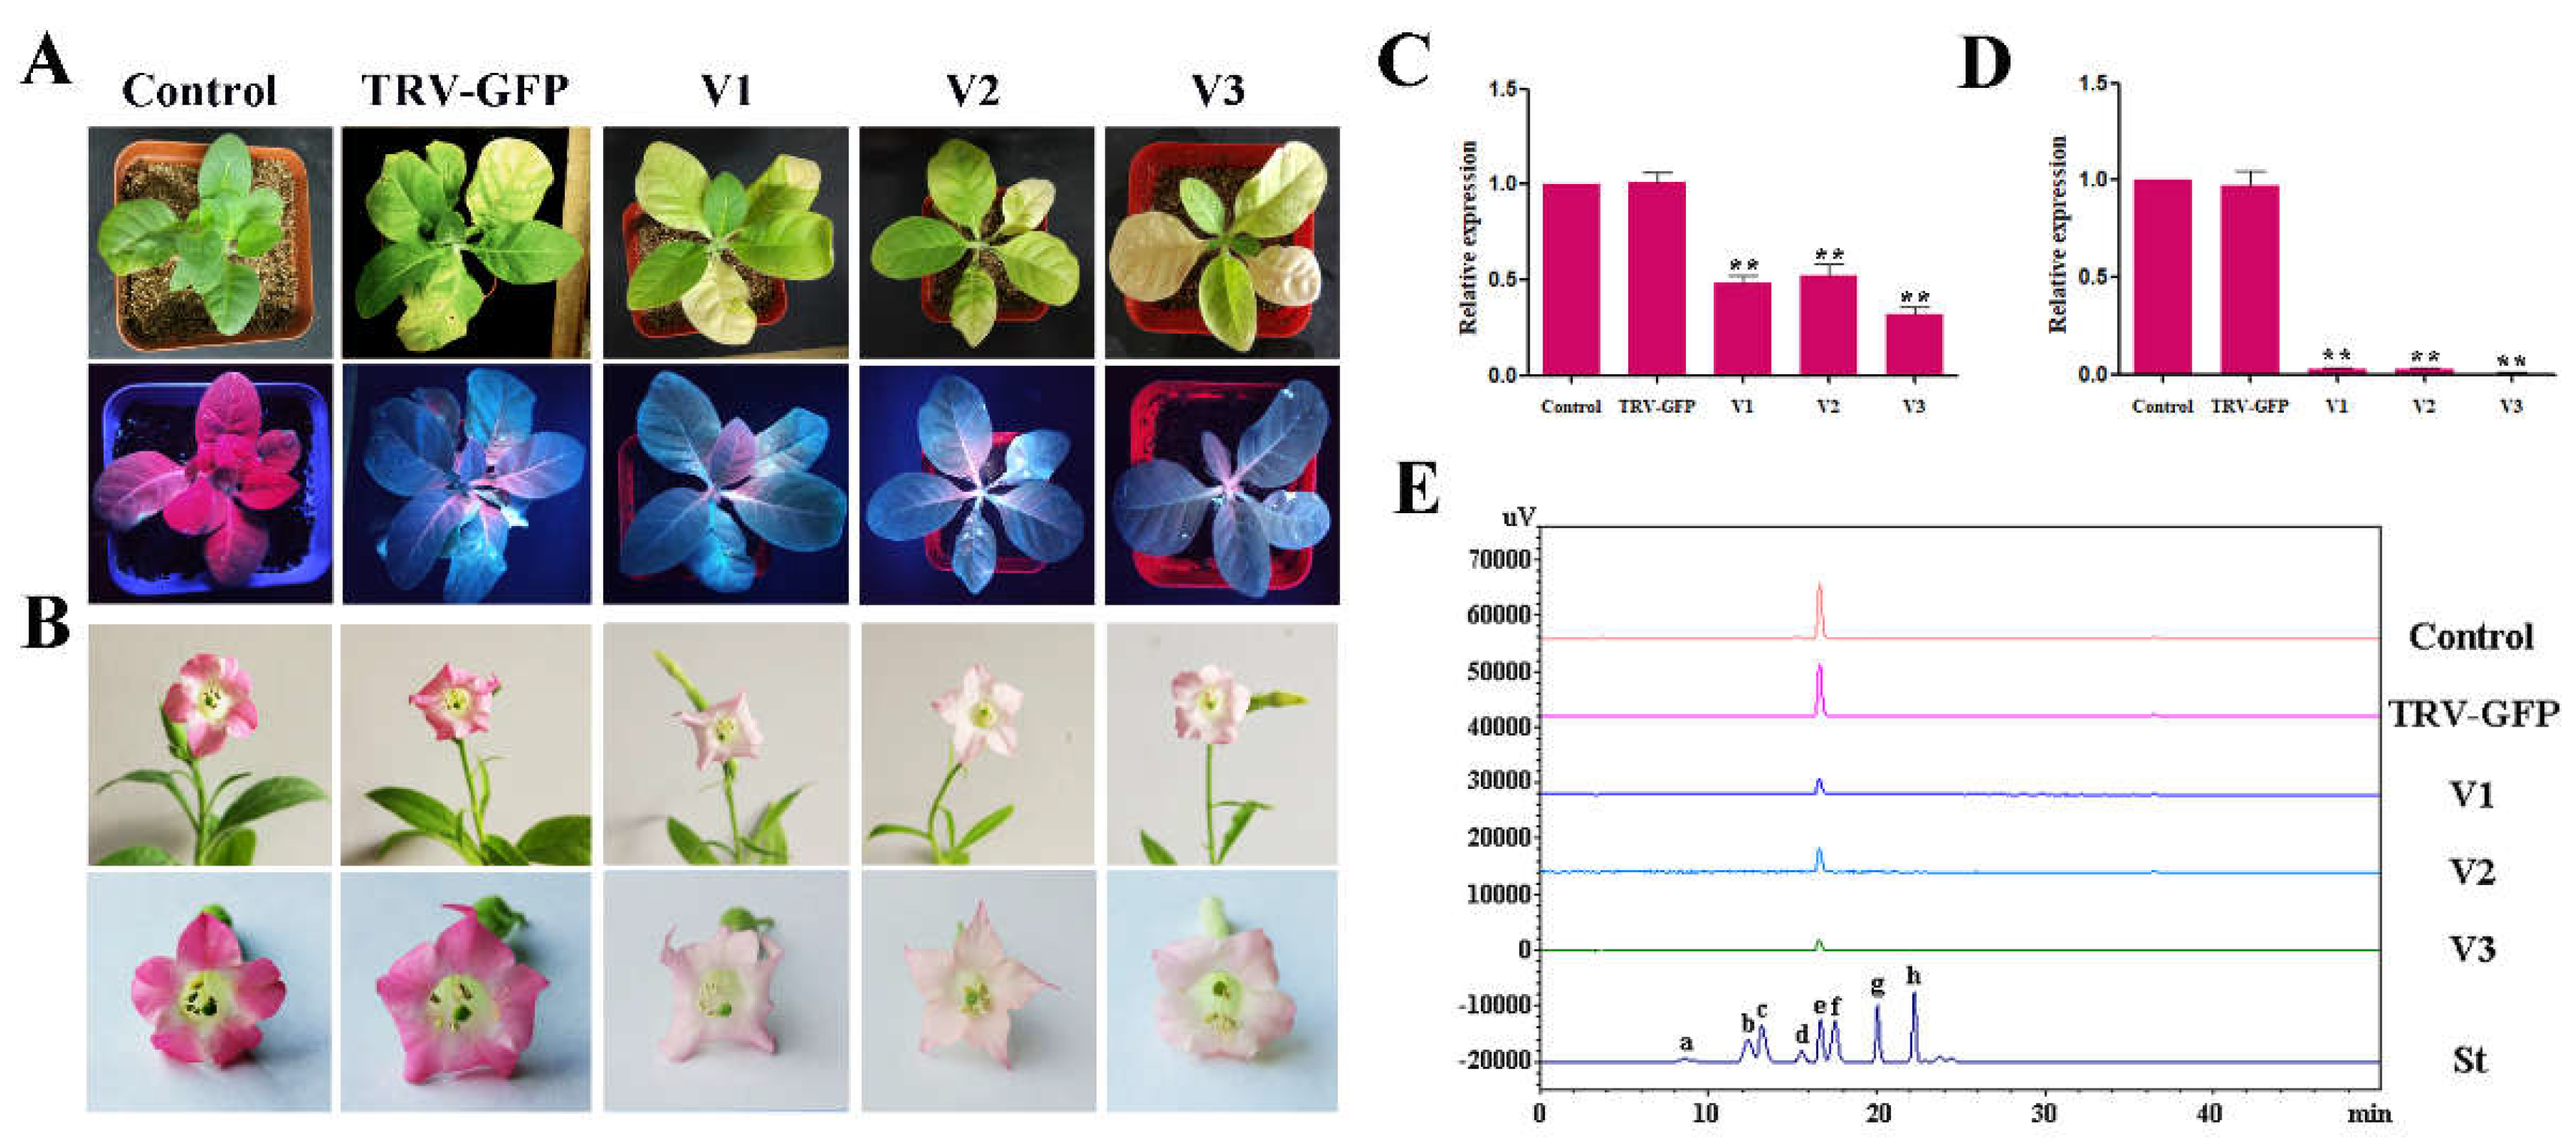
2.3. VIGS of RrGT2 Reduced the Transcript Abundance of the Endogenous RrGT2 Gene
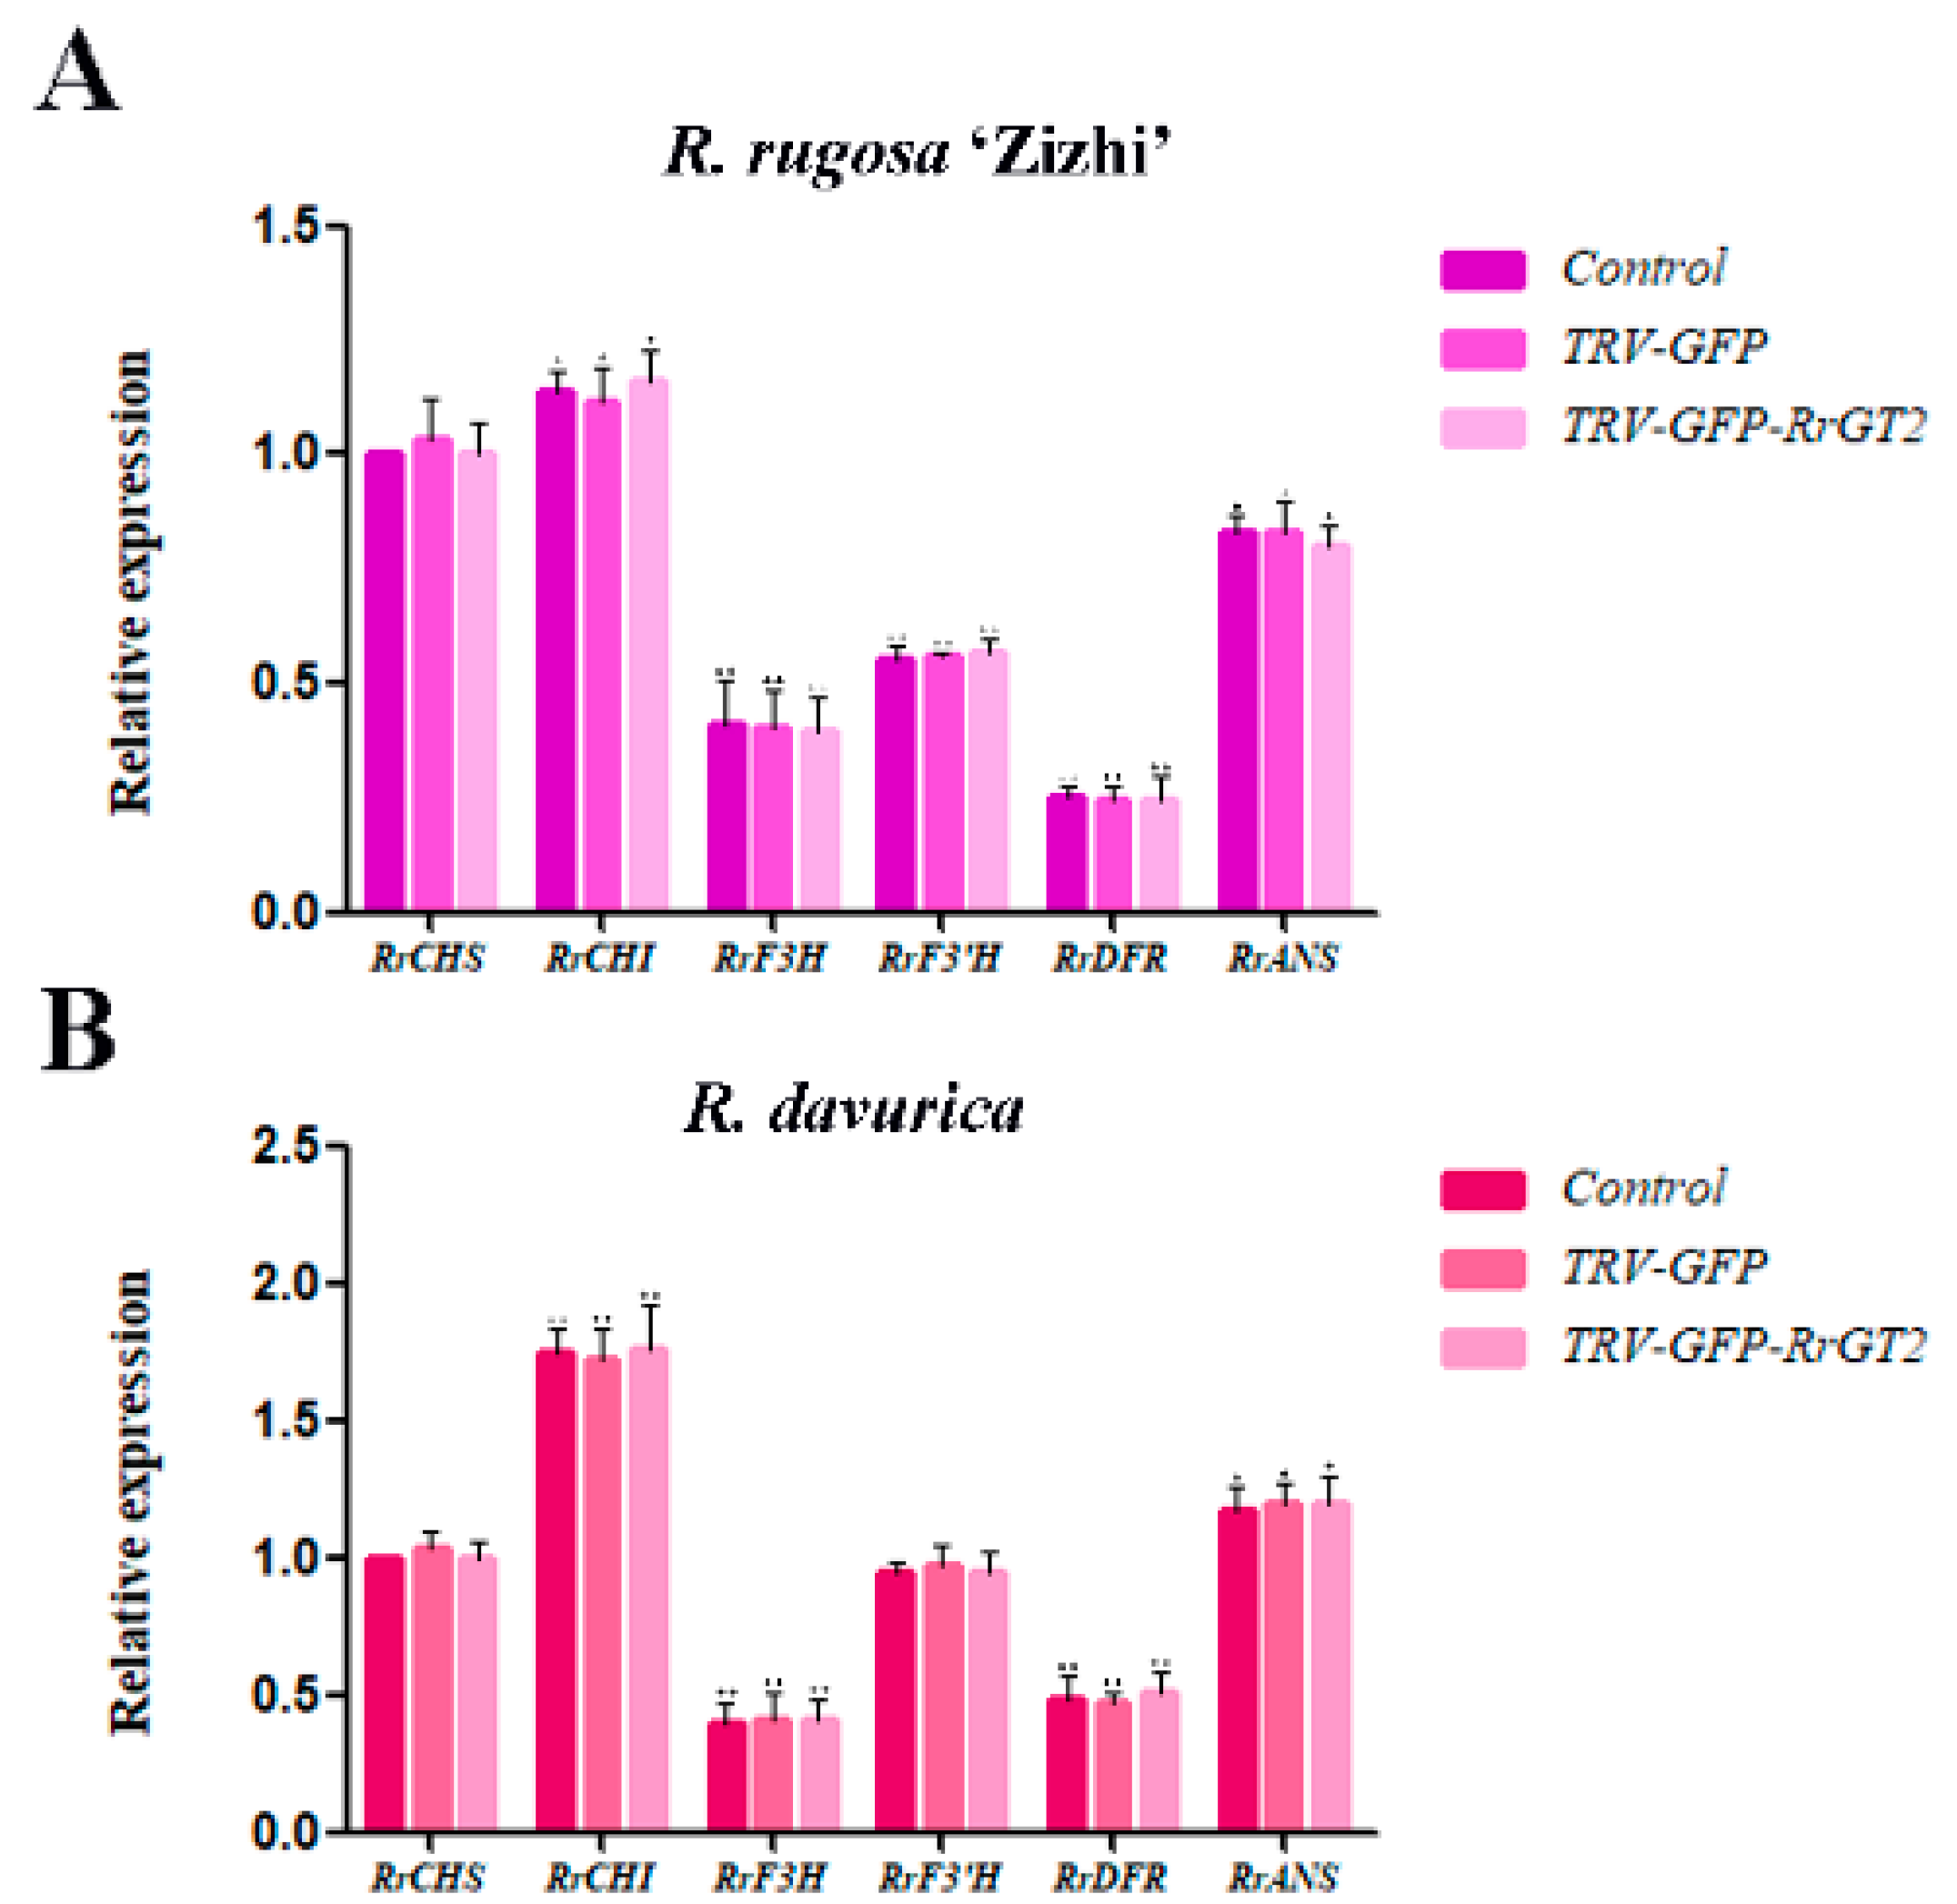
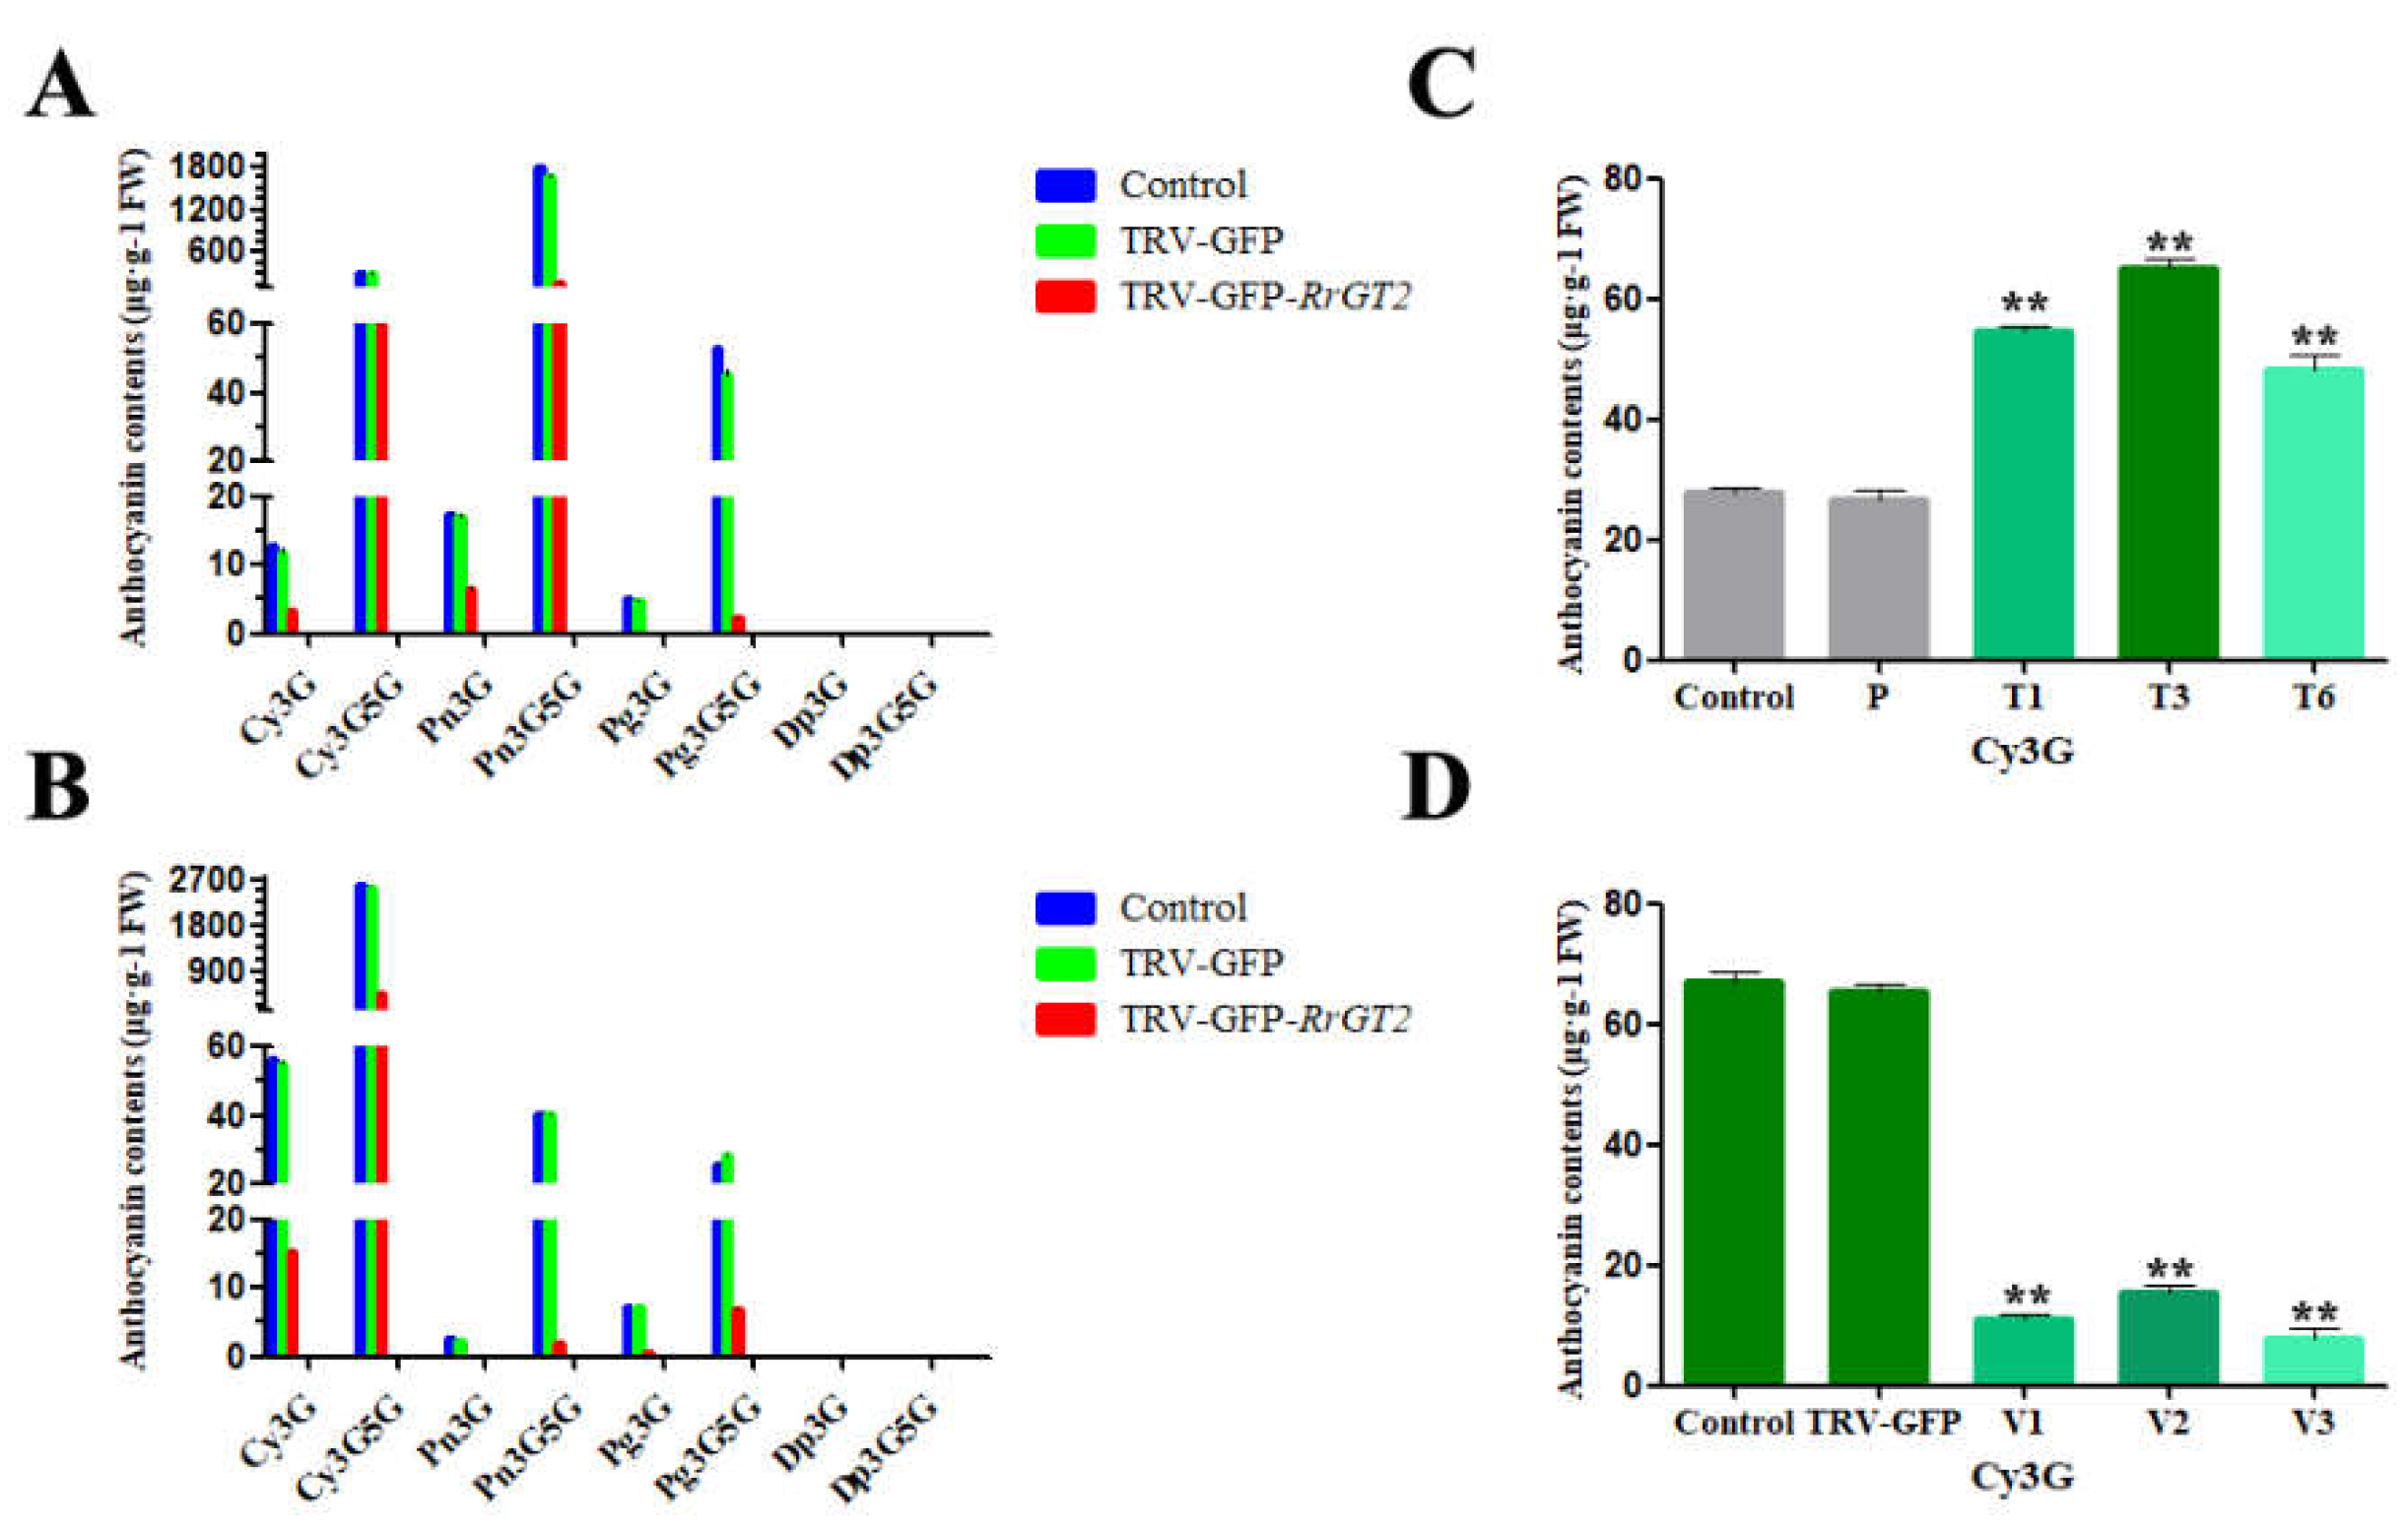
2.4. Reduced Anthocyanin Accumulation in Rosa Petals Was Related to the VIGS of RrGT2
2.5. HPLC Analysis of Rosa
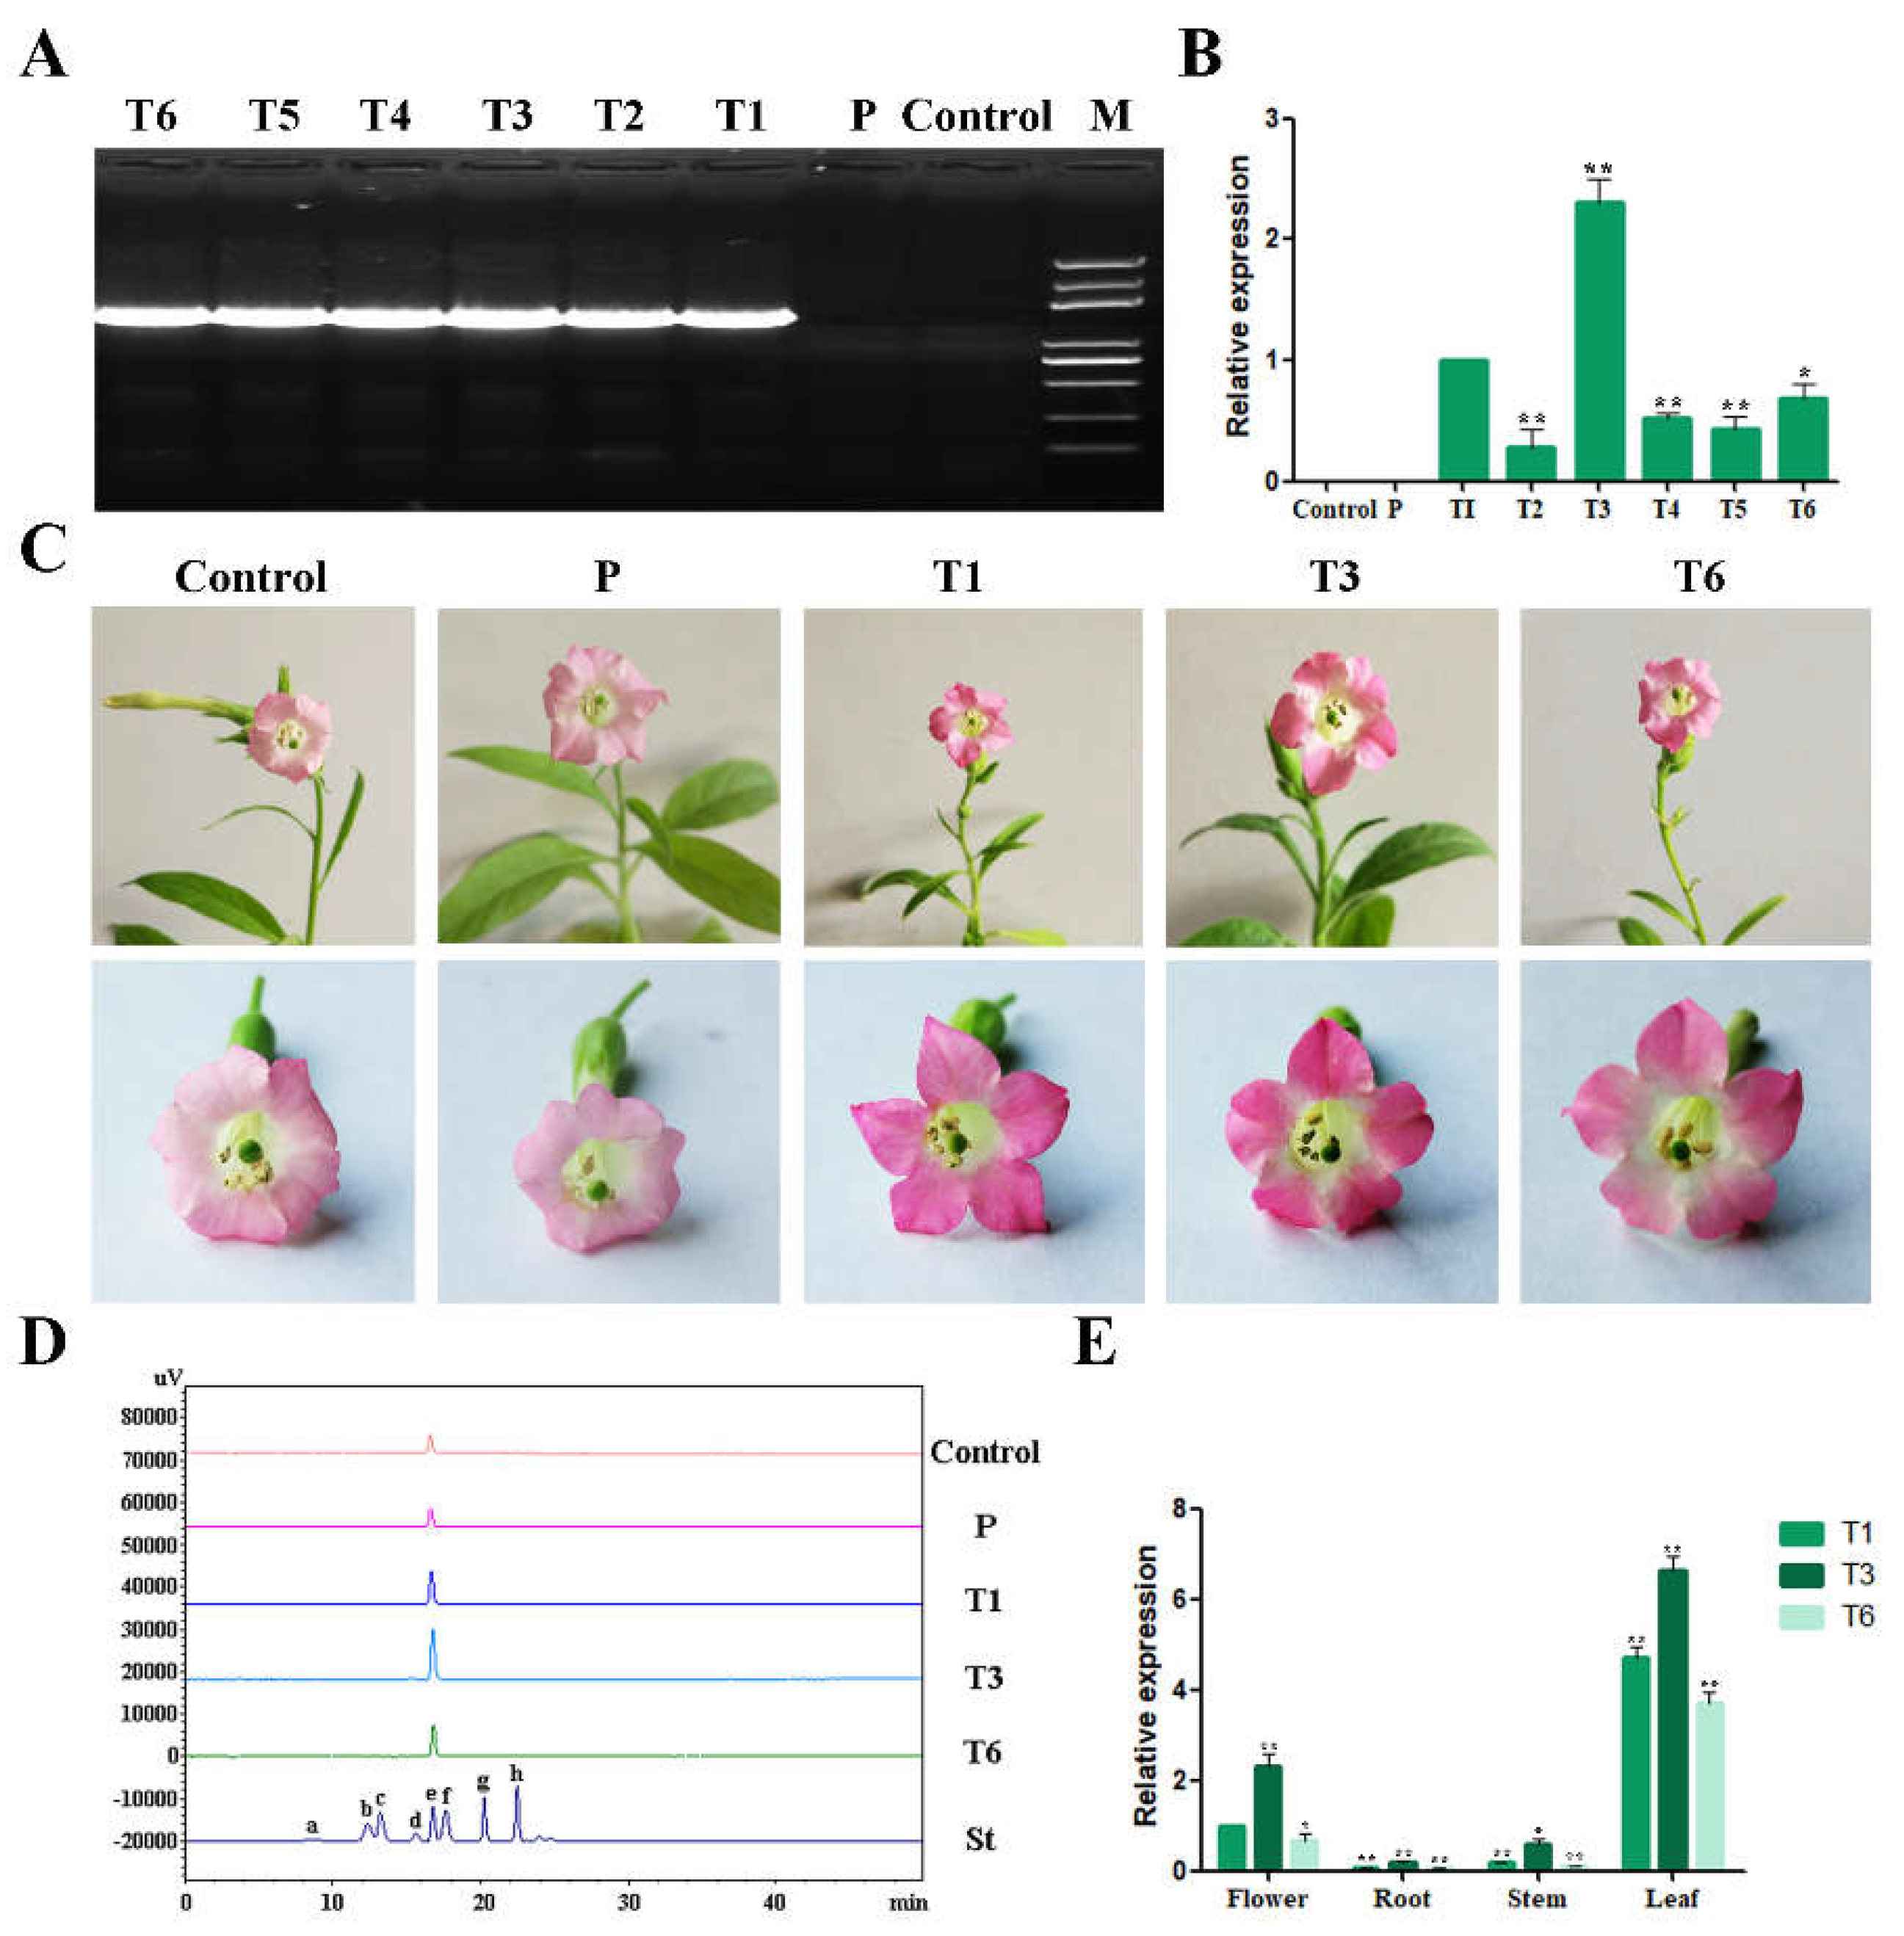
2.6. Overexpression of RrGT2 Increased the Anthocyanin Accumulation in Tobacco
2.7. Expression Patterns of RrGT2 in Transgenic Tobacco
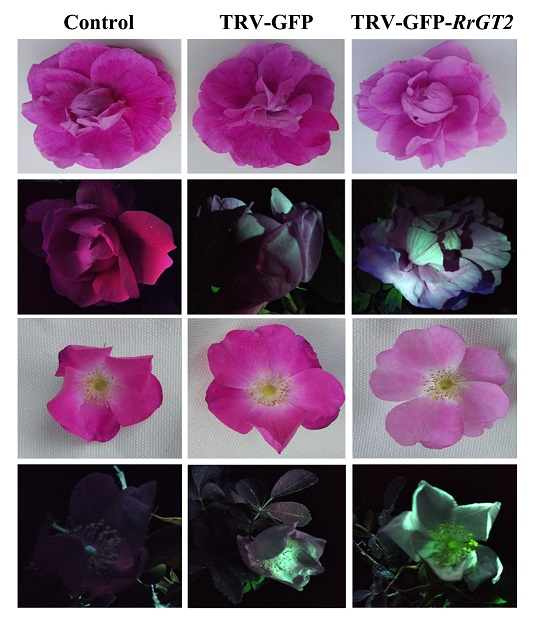
2.8. VIGS of RrGT2 Reduced the Anthocyanin Accumulation in Transgenic Tobacco
3. Discussion
4. Materials and Methods
4.1. Plant Materials
4.2. Extraction of Total RNA and Synthesis of First-Strand cDNA
4.3. Cloning of the Full-Length CDS of RrGT2
4.4. Tobacco Stable Transformation
4.5. VIGS in Rosa
4.6. VIGS in Transgenic Tobacco
4.7. GFP Imaging
4.8. qRT-PCR Detection
4.9. Total Anthocyanin Extraction and HPLC Analysis
4.10. Statistical Analyses
5. Conclusions
Supplementary Materials
Author Contributions
Funding
Acknowledgments
Conflicts of Interest
Abbreviations
| cDNA | complementary DNA |
| RACE | rapid amplification of cDNA ends |
| CDS | coding DNA sequence |
| PSPG | plant secondary product glycosyltransferases |
| PCR | polymerase chain reaction |
| qRT-PCR | quantitative real-time polymerase chain reaction |
| VIGS | virus-induced gene silencing |
| TRV | tobacco rattle virus |
| GFP | green fluorescent protein |
| TRV-GFP | a modified TRV virus with GFP gene inserted into TRV virus |
| HPLC | high-performance liquid chromatography |
References
- Feng, L.G.; Shao, D.W.; Sheng, L.X.; Zhao, L.Y.; Yu, X.Y. Study on investigation and morphological variation of wild Rosa rugosa in China. J. Shandong Agric. Univ. (Nat. Sci. Ed.) 2009, 40, 484–488. [Google Scholar]
- Yang, M.; Zhao, L.Y. Research and classification on the germplasm resources of the Pingyin Rosa rugosa in Shandong province. Landsc. Archit. J. Chin. 2003, 7, 61–63. [Google Scholar]
- Yu, S.C.; Feng, Z.; Zhao, L.Y. Research on quantitative taxonomy of cultivars in Pingyin rose. Acta Hortic. Sin. 2005, 32, 327–330. [Google Scholar]
- Feng, L.G.; Sheng, L.X.; Tao, J.; Zhao, L.Y.; Shao, D.W. Comparative studies on aroma components and contents of wild Rosa rugosa in China. J. Yangzhou Univ. (Agric. Life Sci. Ed.) 2009, 30, 90–94. [Google Scholar]
- Chen, Z.J.; Zang, F.S.; Dai, Y.Q.; Yuan, X.Y.; Li, S.; Wu, Y.M.; Ni, Y.Y. Nutrient components analysis of rose fruit. Food Res. Dev. 2012, 33, 194–198. [Google Scholar]
- Wang, Y. Natural hybridization and speciation. Biodivers. Sci. 2017, 25, 565–576. [Google Scholar] [CrossRef]
- Henderson, I.R.; Salt, D.E. Natural genetic variation and hybridization in plants. J. Clin. Exp. Dent. 2017, 9, e1212–e1217. [Google Scholar] [CrossRef] [PubMed]
- Chen, S.M.; Zhu, X.R.; Chen, F.D.; Luo, H.L.; Lv, G.S.; Fang, W.M.; Zhang, Z. Expression characteristics of anthocyanin structural genes in different flower color chrysanthemum cultivars. J. Northwest Plants 2010, 30, 453–458. [Google Scholar]
- Grotewold, E. The genetics and biochemistry of floral pigments. Annu. Rev. Plant Biol. 2006, 57, 761–780. [Google Scholar] [CrossRef] [PubMed]
- Koes, R.; Verweij, W.; Quattrocchio, F. Flavonoids: A colorful model for the regulation and evolution of biochemical pathways. Trends Plant Sci. 2005, 10, 236–242. [Google Scholar] [CrossRef] [PubMed]
- Quattrocchio, F.; Wing, J.; van der Woude, K.; Souer, E.; de Vetten, N.; Mol, J.; Koes, R. Molecular analysis of the anthocyanin 2 gene of petunia and its role in the evolution of flower color. Plant Cell 1999, 11, 1433–1444. [Google Scholar] [CrossRef] [PubMed]
- Paz-Ares, J.; Ghosal, D.; Wienand, U.; Peterson, P.; Saedler, H. The regulatory c1 locus of Zea mays encodes a protein with homology to myb proto-oncogene products and with structural similarities to transcriptional activators. EMBO J. 1987, 6, 3553–3558. [Google Scholar] [CrossRef] [PubMed]
- Winkelshirley, B. Flavonoid Biosynthesis. A Colorful Model for Genetics, Biochemistry, Cell Biology and Biotechnology. Plant Physiol. 2001, 126, 485–493. [Google Scholar] [CrossRef]
- Lu, Y.F.; Zhang, M.L.; Meng, X.N.; Wan, H.H.; Zhang, J.; Tian, J.; Hao, S.X.; Jin, K.N.; Yao, Y.C. Photoperiod and shading regulate coloration and anthocyanin accumulation in the leaves of Malus crabapples. Plant Cell Tissue Organ Cult. 2015, 121, 619–632. [Google Scholar] [CrossRef]
- Holton, T.A.; Cornish, E.C. Genetics and biochemistry of anthocyanin biosynthesis. Plant Cell 1995, 7, 1071. [Google Scholar] [CrossRef] [PubMed]
- Kim, S.H.; Lee, J.R.; Hong, S.T.; Yoo, Y.K.; An, G.; Kim, S.R. Molecular cloning and analysis of anthocyanin biosynthesis genes preferentially expressed in apple skin. Plant Sci. 2003, 165, 403–413. [Google Scholar] [CrossRef]
- Charles, B.; Imin, N.; Djordjevic, M.A. Flavonoids: New roles for old molecules. J. Integr. Plant Biol. 2010, 52, 98–111. [Google Scholar]
- Martens, S.; Preuß, A.; Matern, U. Multifunctional flavonoid dioxygenases: Flavonol and anthocyanin biosynthesis in Arabidopsis thaliana L. Phytochemistry 2010, 71, 1040–1049. [Google Scholar] [CrossRef] [PubMed]
- Zhang, Q.; Hao, R.J.; Xu, Z.D.; Yang, W.R.; Wang, J.; Cheng, T.R.; Pan, H.T.; Zhang, Q.X. Isolation and functional characterization of a R2R3-MYB regulator of Prunus mume anthocyanin biosynthetic pathway. Plant Cell Tissue Organ Cult. 2017, 131, 417–429. [Google Scholar] [CrossRef]
- Ge, C.L.; Huang, C.H.; Xu, X.B. Research on anthocyanins biosynthesis in fruit. Acta Hortic. Sin. 2012, 39, 1655–1664. [Google Scholar]
- Vogt, T.; Jones, P. Glycosyltransferases in plant natural product synthesis: Characterization of a supergene family. Trends Plant Sci. 2000, 5, 380–386. [Google Scholar] [CrossRef]
- Lim, E.K.; Bowles, D.J. A class of plant glycosyltransferases involved in cellular homeostasis. EMBO J. 2004, 23, 2915–2922. [Google Scholar] [CrossRef] [PubMed]
- Brazier-Hicks, M.; Edwards, R. Functional importance of the family 1 glucosyltransferase UGT72B1 in the metabolism of xenobiotics in Arabidopsis thaliana. Plant J. 2005, 42, 556–566. [Google Scholar] [CrossRef] [PubMed]
- Fedoroff, N.V.; Furtek, D.B.; Nelson, O.E. Cloning of the bronze locus in maize by a simple and generalizable procedure using the transposable controlling element Activator (Ac). Proc. Natl. Acad. Sci. USA 1984, 81, 3825–3829. [Google Scholar] [CrossRef] [PubMed]
- Kobayashi, S.; Ishimaru, M.; Ding, C.K.; Yakushiji, H.; Goto, N. Comparison of UDP-glucose: Flavonoid 3-O-glucosyltransferase (UFGT) gene sequences between white grapes (Vitis vinifera) and theirsports with red skin. J. Plant Sci. 2001, 160, 543–550. [Google Scholar] [CrossRef]
- Li, X.G.; Yu, Z.Y. Research progress of anthocyanin. J. North. Hortic. 2003, 4, 6–8. [Google Scholar]
- Afifi, M.; El-Kereamy, A.; Legrand, V.; Chervin, C.; Monje, M.-C.; Nepveu, F.; Roustan, J.-P. Control of anthocyanin biosynthesis pathway gene expression by eutypine, atoxin from Eutypa lata in grape cell tiussue cultures. J. Plant Physiol. 2003, 160, 971–975. [Google Scholar] [CrossRef] [PubMed]
- Boss, P.K.; Davies, C.; Robinson, S.P. Anthocyanin composition and anthocyanin pathway gene expression in grapewine sports differing in berry skin colour. Aust. J. Grape Wine Res. 1996, 2, 163–170. [Google Scholar] [CrossRef]
- Nakatsuka, T.; Nishihara, M.; Mishiba, K.; Yamamura, S. Two different mutations are involved in the formation of white-flowered gentian plants. J. Plant Sci. 2005, 169, 949–958. [Google Scholar] [CrossRef]
- Ju, Z.G. Activities of chalcone and UDP Gal: Flavonoid-3-O-glycosyhransferase in relation to anthocyanin synthesis in apple. J. Sci. Hortic. 1995, 63, 175–185. [Google Scholar] [CrossRef]
- Sui, X.M.; Wang, Y.; Zhao, M.Y.; Han, X.; Zhao, L.Y.; Xu, Z.D. Cloning and Expression Analysis of RrGT2 Gene Related to Anthocyanin Biosynthesis in Rosa rugosa. Am. J. Plant Sci. 2018, 9, 2008–2019. [Google Scholar] [CrossRef]
- Qi, Y. Cloning and Expression Analysis of Anthocyanin Biosynthesis Related Gene in Rosa rugosa. Master’s Thesis, Shandong Agricultural University, Tai’an, China, 2016. [Google Scholar]
- Aharoni, A.; De Vos, C.R.; Wein, M.; Sun, Z.; Greco, R.; Kroon, A.; Mol, J.N.; O’Connell, A.P. The strawberry FaMYB1 transcription factor suppresses anthocyanin and flavonol accumulation in transgenic tobacco. Plant J. 2001, 28, 319–332. [Google Scholar] [CrossRef] [PubMed]
- Deluc, L.; Barrieu, F.; Marchive, C.; Lauvergeat, V.; Decendit, A.; Richard, T.; Carde, J.P.; Mérillon, J.M.; Hamdi, S. Characterization of a grapevine R2R3-MYB transcription factor that regulates the phenylpropanoid pathway. Plant Physiol. 2006, 140, 499–511. [Google Scholar] [CrossRef] [PubMed]
- Nakatsuka, T.; Sato, K.; Takahashi, H.; Yamamura, S.; Nishihara, M. Cloning and characterization of the UDP-glucose: Anthocyanin 5-O-glucosyltransferase gene from blue-flowered gentian. J. Exp. Bot. 2008, 59, 1241–1252. [Google Scholar] [CrossRef] [PubMed]
- Wang, C.X.; Yang, M.Z.; Pan, N.S.; Chen, Z.L. Resistance to potato virus X infection in transgenic tobacco plants with coat protein gene of virus. J. Integr. Plant Biol. 1993, 35, 819–824. [Google Scholar]
- Zhang, X.Y.; Xue, Q.Z. Introduction of soybean glycinin gene into rice (Oryza sativa L.) with Agrobacterium-mediated transformation. J. Zhejiang Agric. Univ. (Agric. Life Sci.) 2001, 27, 495–499. [Google Scholar]
- Kubo, A.; Arai, Y.; Nagashima, S.; Yoshikawa, T. Alteration of sugar donor specificities of plant glycosyltransferases by a single point mutation. J. Arch. Biochem. Biophys. 2004, 429, 198–203. [Google Scholar] [CrossRef] [PubMed]
- Broothaerts, W.; Mitchell, H.J.; Weir, B.; Kaines, S.; Smith, L.M.; Yang, W.; Mayer, J.; Roa-Rodríguez, C.; Jefferson, R. Genetransfer to plants by diverse species of bacteria. J. Nat. 2005, 433, 629–633. [Google Scholar] [CrossRef] [PubMed]
- Herrera-Estrella, L.; Simpson, J.; Martinez-Trujillo, M. Transgenic plants: An historical perspective. J. Methods Mol. Biol. 2005, 286, 3–32. [Google Scholar]
- Wang, X.Q. Structure, mechanism and engineering of plant natural product glycosyltransferases. J. FEBS Lett. 2009, 583, 3303–3309. [Google Scholar] [CrossRef] [PubMed]
- Yonekura-Sakakibara, K.; Hanada, K. An evolutionary view of functional diversity in family 1 glycosyltransferases. J. Plant J. 2011, 66, 182–193. [Google Scholar] [CrossRef] [PubMed]
- Shao, H.; He, X.; Achnine, L.; Blount, J.W.; Dixon, R.A.; Wang, X. Crystal structures of a multifunctional triterpene/flavonoid glycosyltransferase from Medicago truncatula. J. Plant Cell 2005, 17, 3141–3154. [Google Scholar] [CrossRef] [PubMed]
- Li, L.; Modolo, L.V.; Escamilla-Trevino, L.L.; Achnine, L.; Dixon, R.A.; Wang, X. Crystal structure of Medicago truncatula UGT85H2-insights into the trusctural basis of a multifunctional (iso) flavonoid glycosyltransferase. J. Mol. Biol. 2007, 370, 951–963. [Google Scholar] [CrossRef] [PubMed]
- Modolo, L.V.; Li, L.N.; Pan, H.Y.; Blount, J.W.; Dixon, R.A.; Wang, X.Q. Crystal structures of glycosyltransferase UGT/8G1 reveal the molecular basis for glycosylation and deglycosylation of (iso) flavonoids. J. Mol. Biol. 2009, 392, 1292–1302. [Google Scholar] [CrossRef] [PubMed]
- Cheng, J.; Wei, G.; Zhou, H.; Gu, C.; Vimolmangkang, S.; Liao, L.; Han, Y. Unraveling the mechanism underlying the glycosylation and methylation of anthocyanins in peach. Plant Physiol. 2014, 166, 1044–1058. [Google Scholar] [CrossRef] [PubMed]
- Sun, D.; Nandety, R.S.; Zhang, Y.; Reid, M.S.; Niu, L.; Jiang, C.Z. A petunia ethylene-responsive element binding factor, PhERF2, plays an important role in antiviral RNA silencing. J. Exp. Bot. 2016, 67, 3353–3365. [Google Scholar] [CrossRef] [PubMed]
- Spitzer, B.; Zvi, M.M.B.; Ovadis, M.; Marhevka, E.; Barkai, O.; Edelbaum, O.; Marton, I.; Masci, T.; Alon, M.; Morin, S.; et al. Reverse Genetics of floral scent: Application of Tobacco rattle virus-based gene silencing in Petunia. Plant Physiol. 2007, 145, 1241–1250. [Google Scholar] [CrossRef] [PubMed]
- Dong, Y.Y.; Burch-Smith, T.M.; Liu, Y.L.; Mamillapalli, P.; Dinesh-Kumar, S.P. A Ligation-independent cloning Tobacco rattle virus vector for high-throughput virus-induced gene silencing identifies roles for NbMADS4-1 and -2 in floral development. Plant Physiol. 2007, 145, 1161–1170. [Google Scholar] [CrossRef] [PubMed]
- Deng, X.B.; Elomaa, P.; Nguyen, C.X.; Hytönen, T.; Valkonen, J.P.T.; Teeri, T.H. Virus-induced gene silencing for Asteraceae-a reverse genetics approach for functional genomics in Gerbera hybrida. Plant Biotechnol. J. 2012, 10, 970–978. [Google Scholar] [CrossRef] [PubMed]
- Zhang, L.; Xu, Z.D.; Tang, T.F.; Zhang, H.; Zhao, L.Y. Analysis of anthocyanin related compounds and metabolic pathways in the flowering process of Rosa rugosa ‘Zizhi’. Sci. Agric. Sin. 2015, 48, 235–236. [Google Scholar]
- Brugliera, F.; Holton, T.A.; Stevenson, T.W.; Farcy, E.; Lu, C.Y.; Cornish, E.C. Isolation and characterization of a cDNA clone corresponding to the Rt locus of Petunia hybrida. Plant J. 1994, 5, 81–92. [Google Scholar] [CrossRef] [PubMed]
- Kroon, J.; Souer, E.; de Graaff, A.; Xue, Y.; Mol, J.; Koes, R. Cloning and structural analysis of the anthocyanin pigmentation locus Rt of Petunia hybrida: Characterization of insertion sequences in two mutant alleles. Plant J. 1994, 5, 69–80. [Google Scholar] [CrossRef] [PubMed]
- Szerszen, J.B.; Szczyglowski, K.; Bandurski, R.S. A gene from Zea mays involved in conjugation of growth hormone indole-3-acetic acid. Science 1994, 265, 1699–1701. [Google Scholar] [CrossRef] [PubMed]
- Martin, R.C.; Mok, M.C.; Mok, D.W.S. Isolation of a cytokinin gene, ZOG1, encoding zeatin O-glucosyltransferase from Phaseolus lunatus. Proc. Natl. Acad. Sci. USA 1999, 96, 284–289. [Google Scholar] [CrossRef] [PubMed]
- Martin, R.C.; Mok, M.C.; Habben, J.E.; Mok, D.W.S. A maize cytokinin gene encoding an O-glucosyltransferase specific to cis-zeatin. Proc. Natl. Acad. Sci. USA 2001, 98, 5922–5926. [Google Scholar] [CrossRef] [PubMed]
- Horsch, R.; Fry, J.E.; Hoffmann, N.L.; Eichholtz, D.Z.; Rogers, S.G.; Fraley, R.T. A simple and general method for transferring genes into plants. Science 1985, 227, 1229–1232. [Google Scholar]
- Bachan, S.; Dinesh-Kumar, S.P. Tobacco rattle virus (TRV) based virus-induced gene silencing. Antivir. Resist. Plants 2012, 894, 83–92. [Google Scholar]
- Burch-Smith, T.M.; Schiff, M.; Liu, Y.; Dinesh-Kumar, S.P. Efficient virus-induced gene silencing in Arabidopsis. Plant Physiol. 2006, 142, 21–27. [Google Scholar] [CrossRef] [PubMed]
- Chen, J.C.; Jiang, C.Z.; Gookin, T.E.; Hunter, D.A.; Clark, D.G.; Reid, M.S. Chalcone synthase as a reporter in virus-induced gene silencing studies of flower senescence. Plant Mol. Biol. 2004, 55, 521–530. [Google Scholar] [CrossRef] [PubMed]
- Jiang, C.Z.; Chen, J.C.; Reid, M. Virus-induced gene silencing in ornamental plants. Methods Mol. Biol. 2011, 744, 81–96. [Google Scholar] [PubMed]
- Liu, Y.; Schiff, M.; Dinesh-Kumar, S.P. Virus-induced gene silencing in tomato. Plant J. 2002, 31, 777–786. [Google Scholar] [CrossRef] [PubMed]
- Quadrana, L.; Rodriguez, M.C.; López, M.; Bermúdez, L.; Nunes-Nesi, A.; Fernie, A.R.; Descalzo, A.; Asis, R.; Rossi, M.; Asurmendi, S.; et al. Coupling virus-induced gene silencing to exogenous green fluorescence protein expression provides a highly efficient system for functional genomics in Arabidopsis and across all stages of tomato fruit development. Plant Physiol. 2011, 156, 1278–1291. [Google Scholar] [CrossRef] [PubMed]
- Schmittgen, T.D.; Livak, K.J. Analyzing real-time PCR data by the comparative C (T) method. Nat. Protoc. 2008, 3, 1101. [Google Scholar] [CrossRef] [PubMed]
- Yang, Q.; Yuan, T.; Sun, X.B. Preliminary studies on the changes of flower color during the flowering period in two tree peony cultivars. Acta Hortic. Sin. 2015, 42, 930–938. [Google Scholar]
- Xie, D.Y.; Sharma, S.B.; Wright, E.; Wang, Z.Y.; Dixon, R.A. Metabolic engineering of proanthocyanidins through co-expression of anthocyanidin reductase and the PAP1 MYB transcription factor. Plant J. 2006, 45, 895–907. [Google Scholar] [CrossRef] [PubMed]


© 2018 by the authors. Licensee MDPI, Basel, Switzerland. This article is an open access article distributed under the terms and conditions of the Creative Commons Attribution (CC BY) license (http://creativecommons.org/licenses/by/4.0/).
Share and Cite
Sui, X.; Zhao, M.; Xu, Z.; Zhao, L.; Han, X. RrGT2, A Key Gene Associated with Anthocyanin Biosynthesis in Rosa rugosa, Was Identified Via Virus-Induced Gene Silencing and Overexpression. Int. J. Mol. Sci. 2018, 19, 4057. https://doi.org/10.3390/ijms19124057
Sui X, Zhao M, Xu Z, Zhao L, Han X. RrGT2, A Key Gene Associated with Anthocyanin Biosynthesis in Rosa rugosa, Was Identified Via Virus-Induced Gene Silencing and Overexpression. International Journal of Molecular Sciences. 2018; 19(12):4057. https://doi.org/10.3390/ijms19124057
Chicago/Turabian StyleSui, Xiaoming, Mingyuan Zhao, Zongda Xu, Lanyong Zhao, and Xu Han. 2018. "RrGT2, A Key Gene Associated with Anthocyanin Biosynthesis in Rosa rugosa, Was Identified Via Virus-Induced Gene Silencing and Overexpression" International Journal of Molecular Sciences 19, no. 12: 4057. https://doi.org/10.3390/ijms19124057
APA StyleSui, X., Zhao, M., Xu, Z., Zhao, L., & Han, X. (2018). RrGT2, A Key Gene Associated with Anthocyanin Biosynthesis in Rosa rugosa, Was Identified Via Virus-Induced Gene Silencing and Overexpression. International Journal of Molecular Sciences, 19(12), 4057. https://doi.org/10.3390/ijms19124057