LeNRT1.1 Improves Nitrate Uptake in Grafted Tomato Plants under High Nitrogen Demand


Abstract
1. Introduction
2. Results
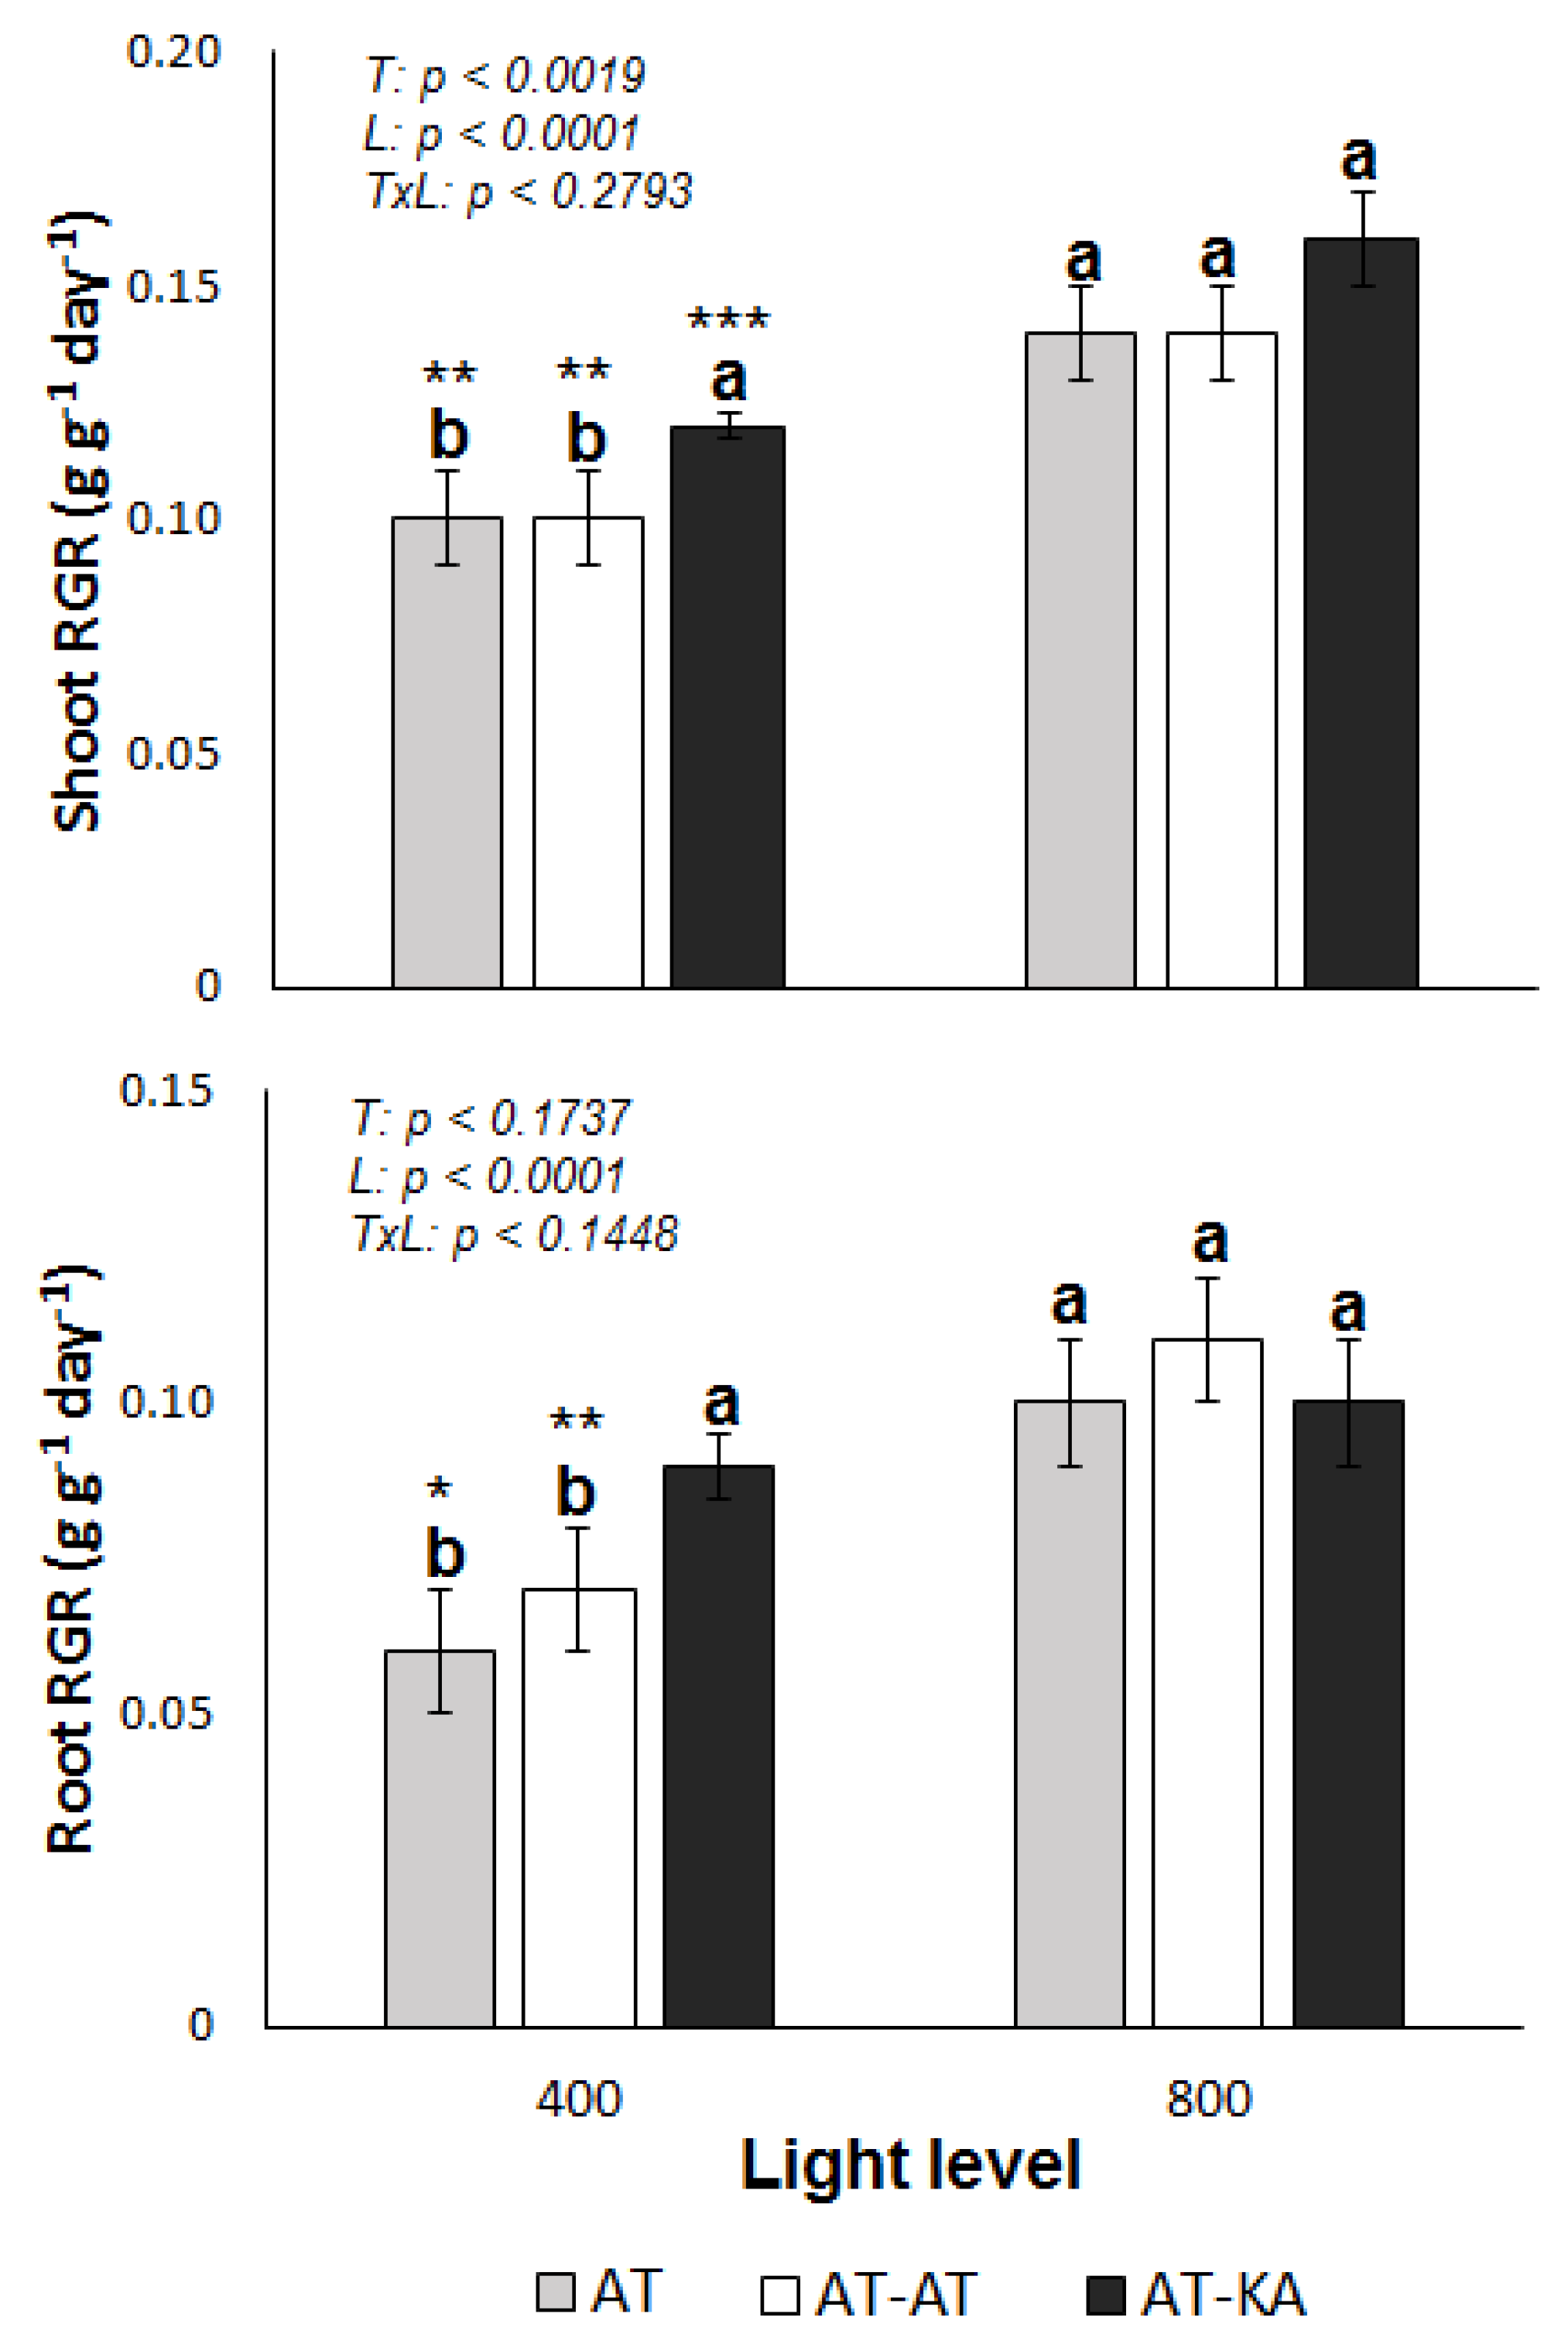
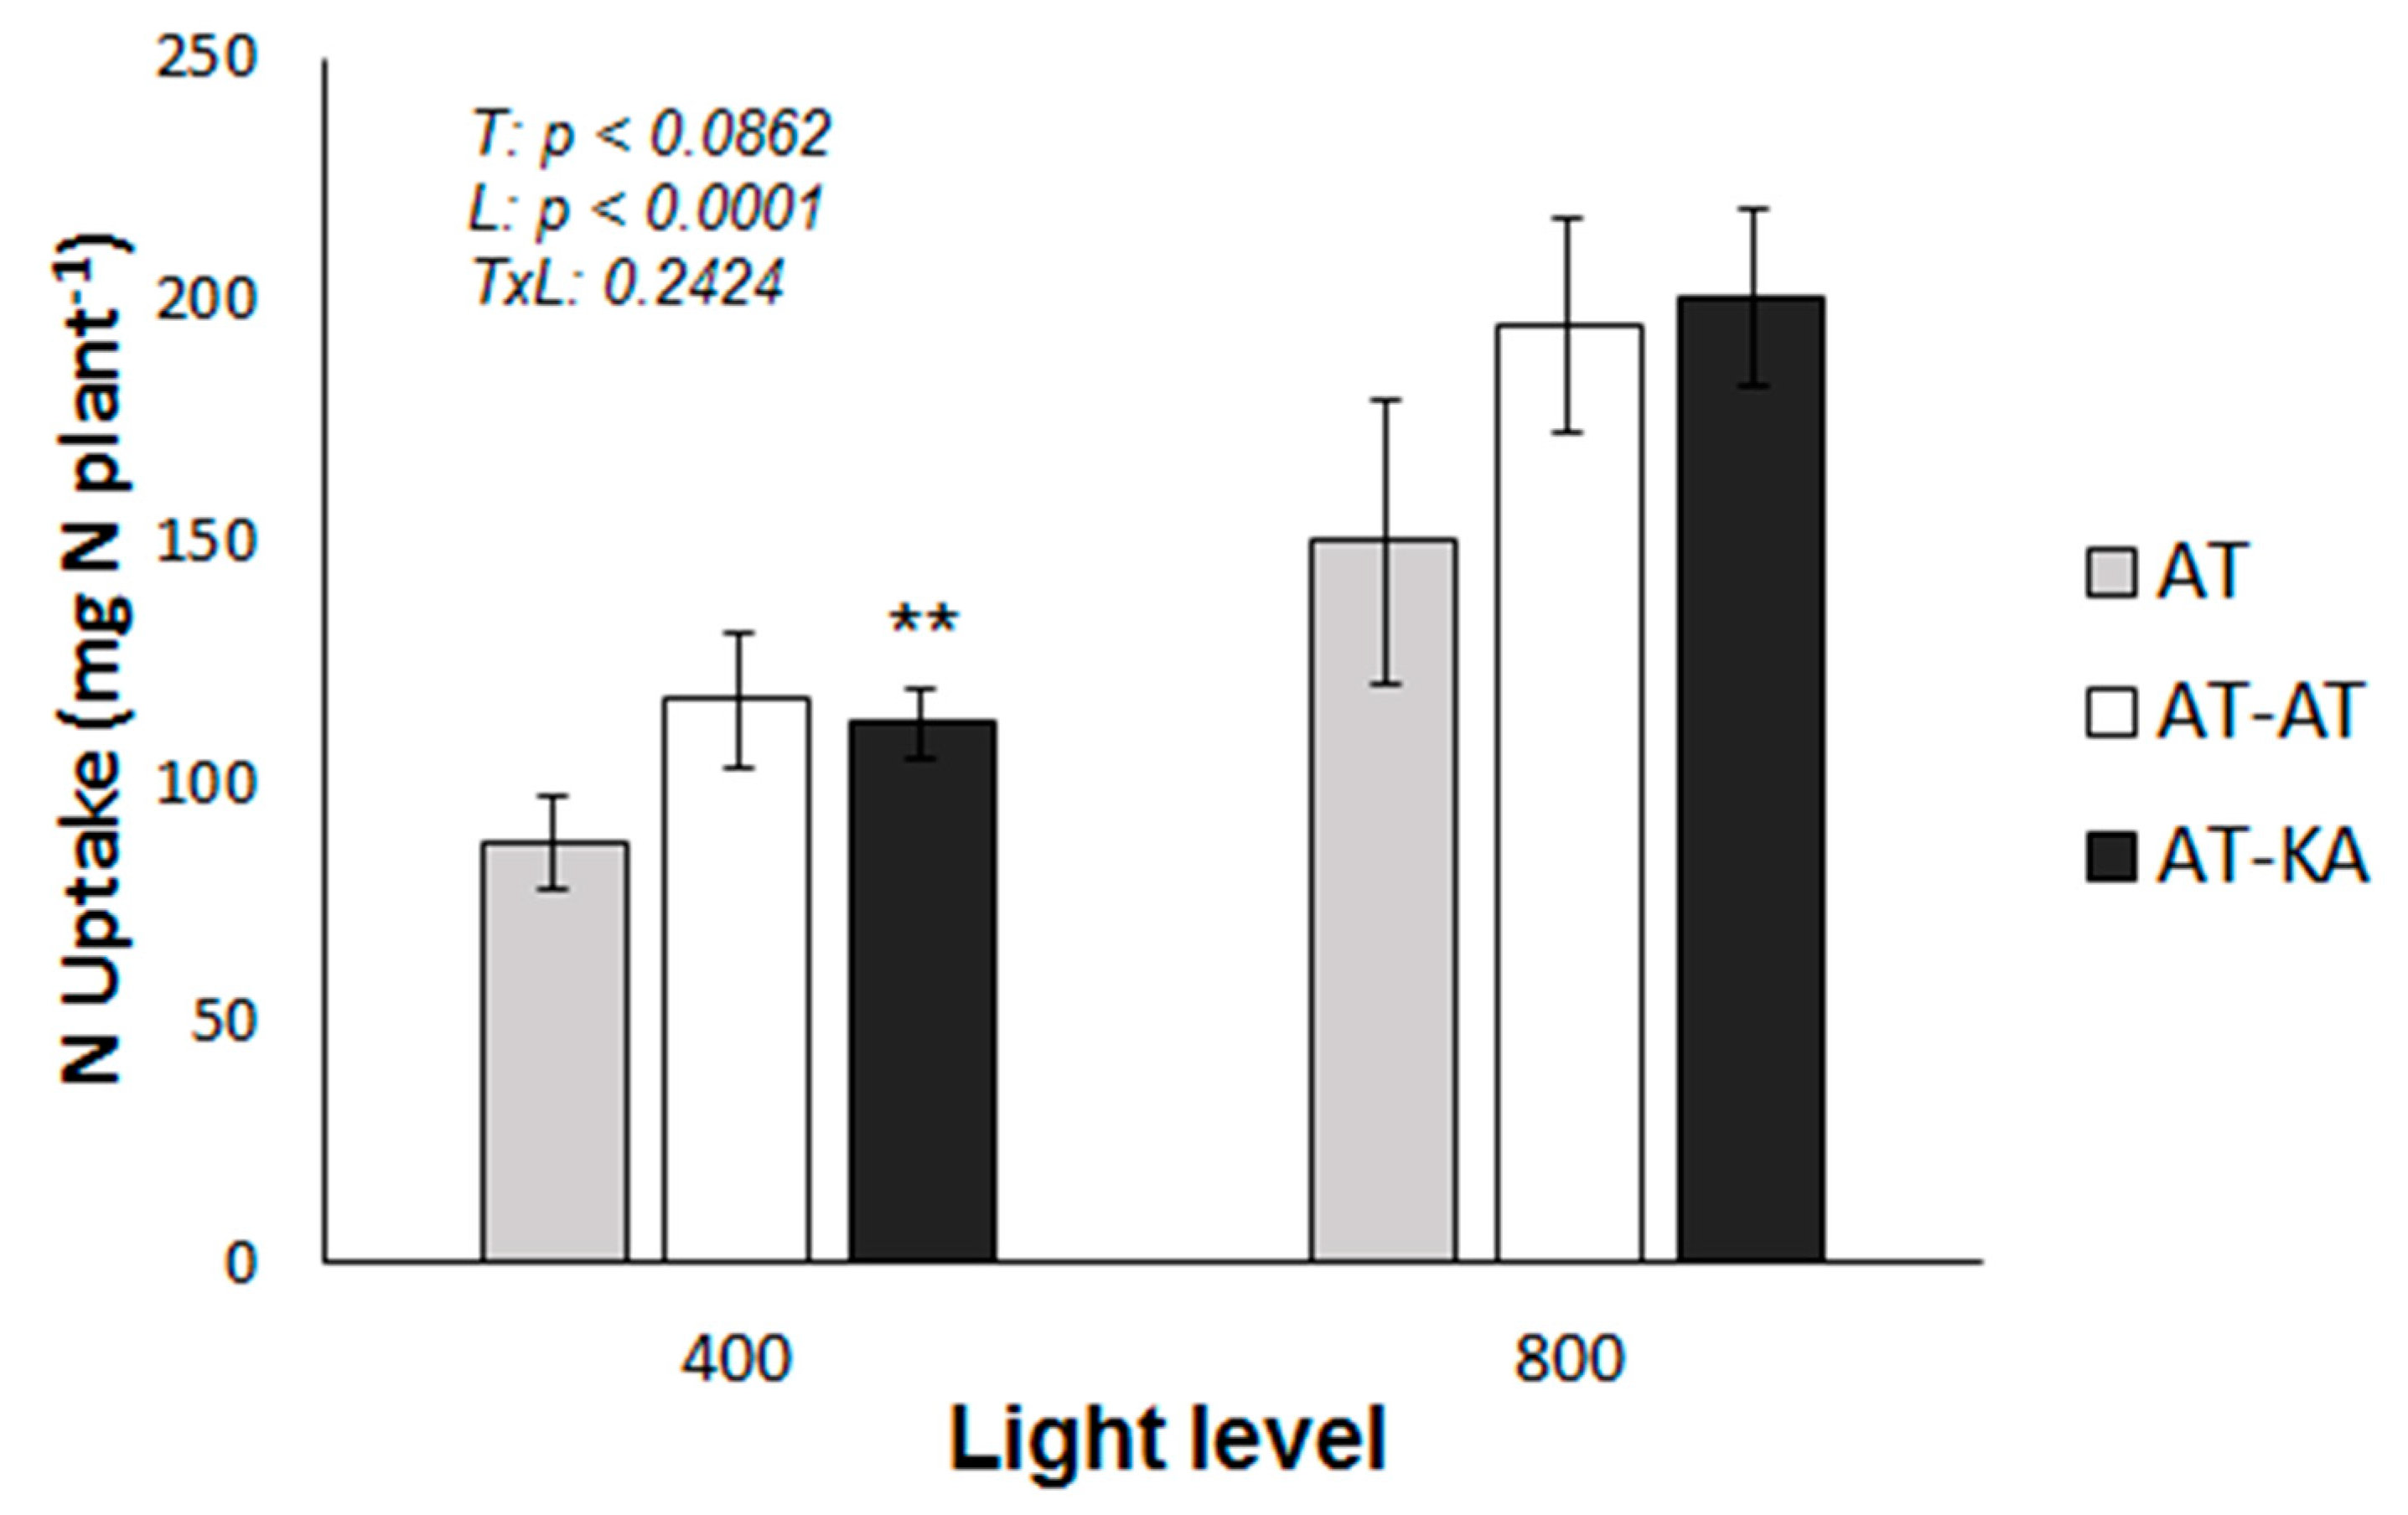
2.1. RGR and Plant N Uptake
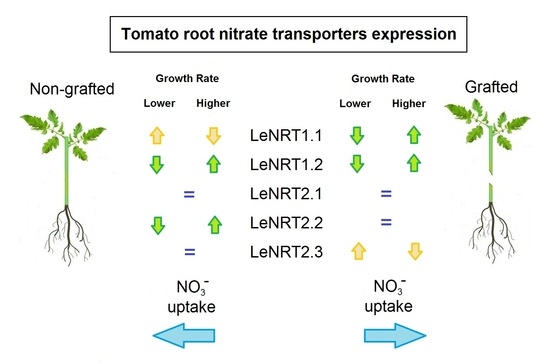
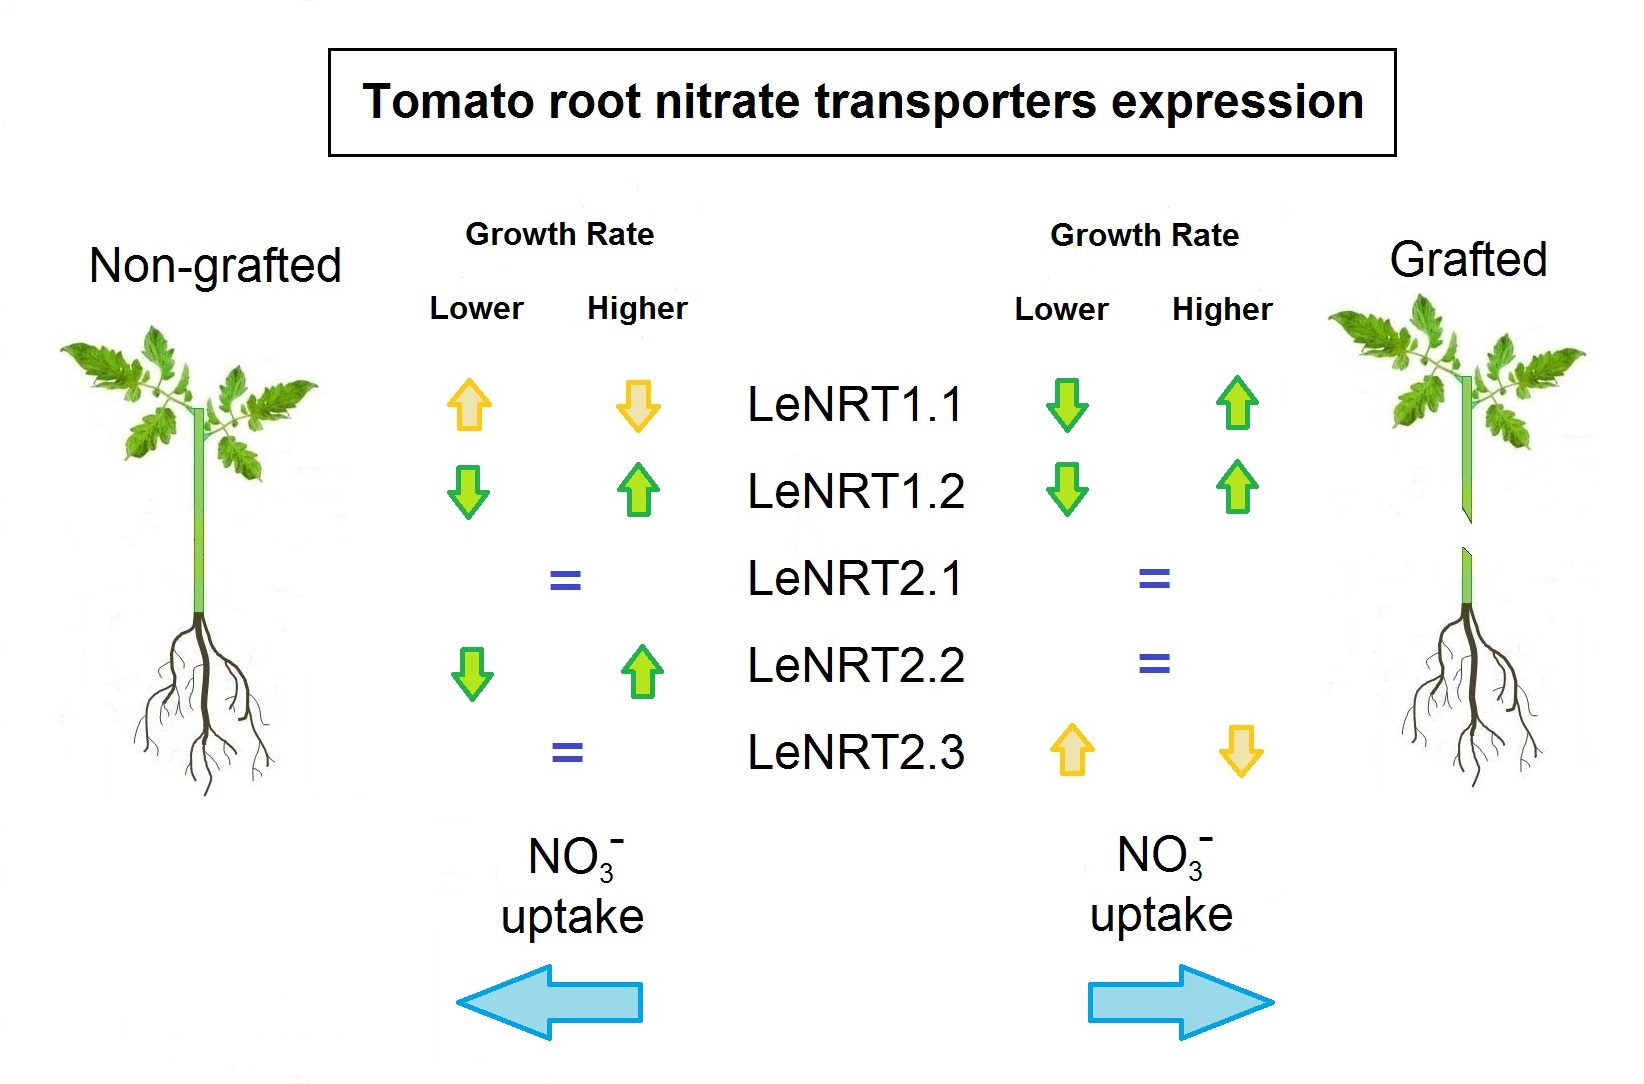
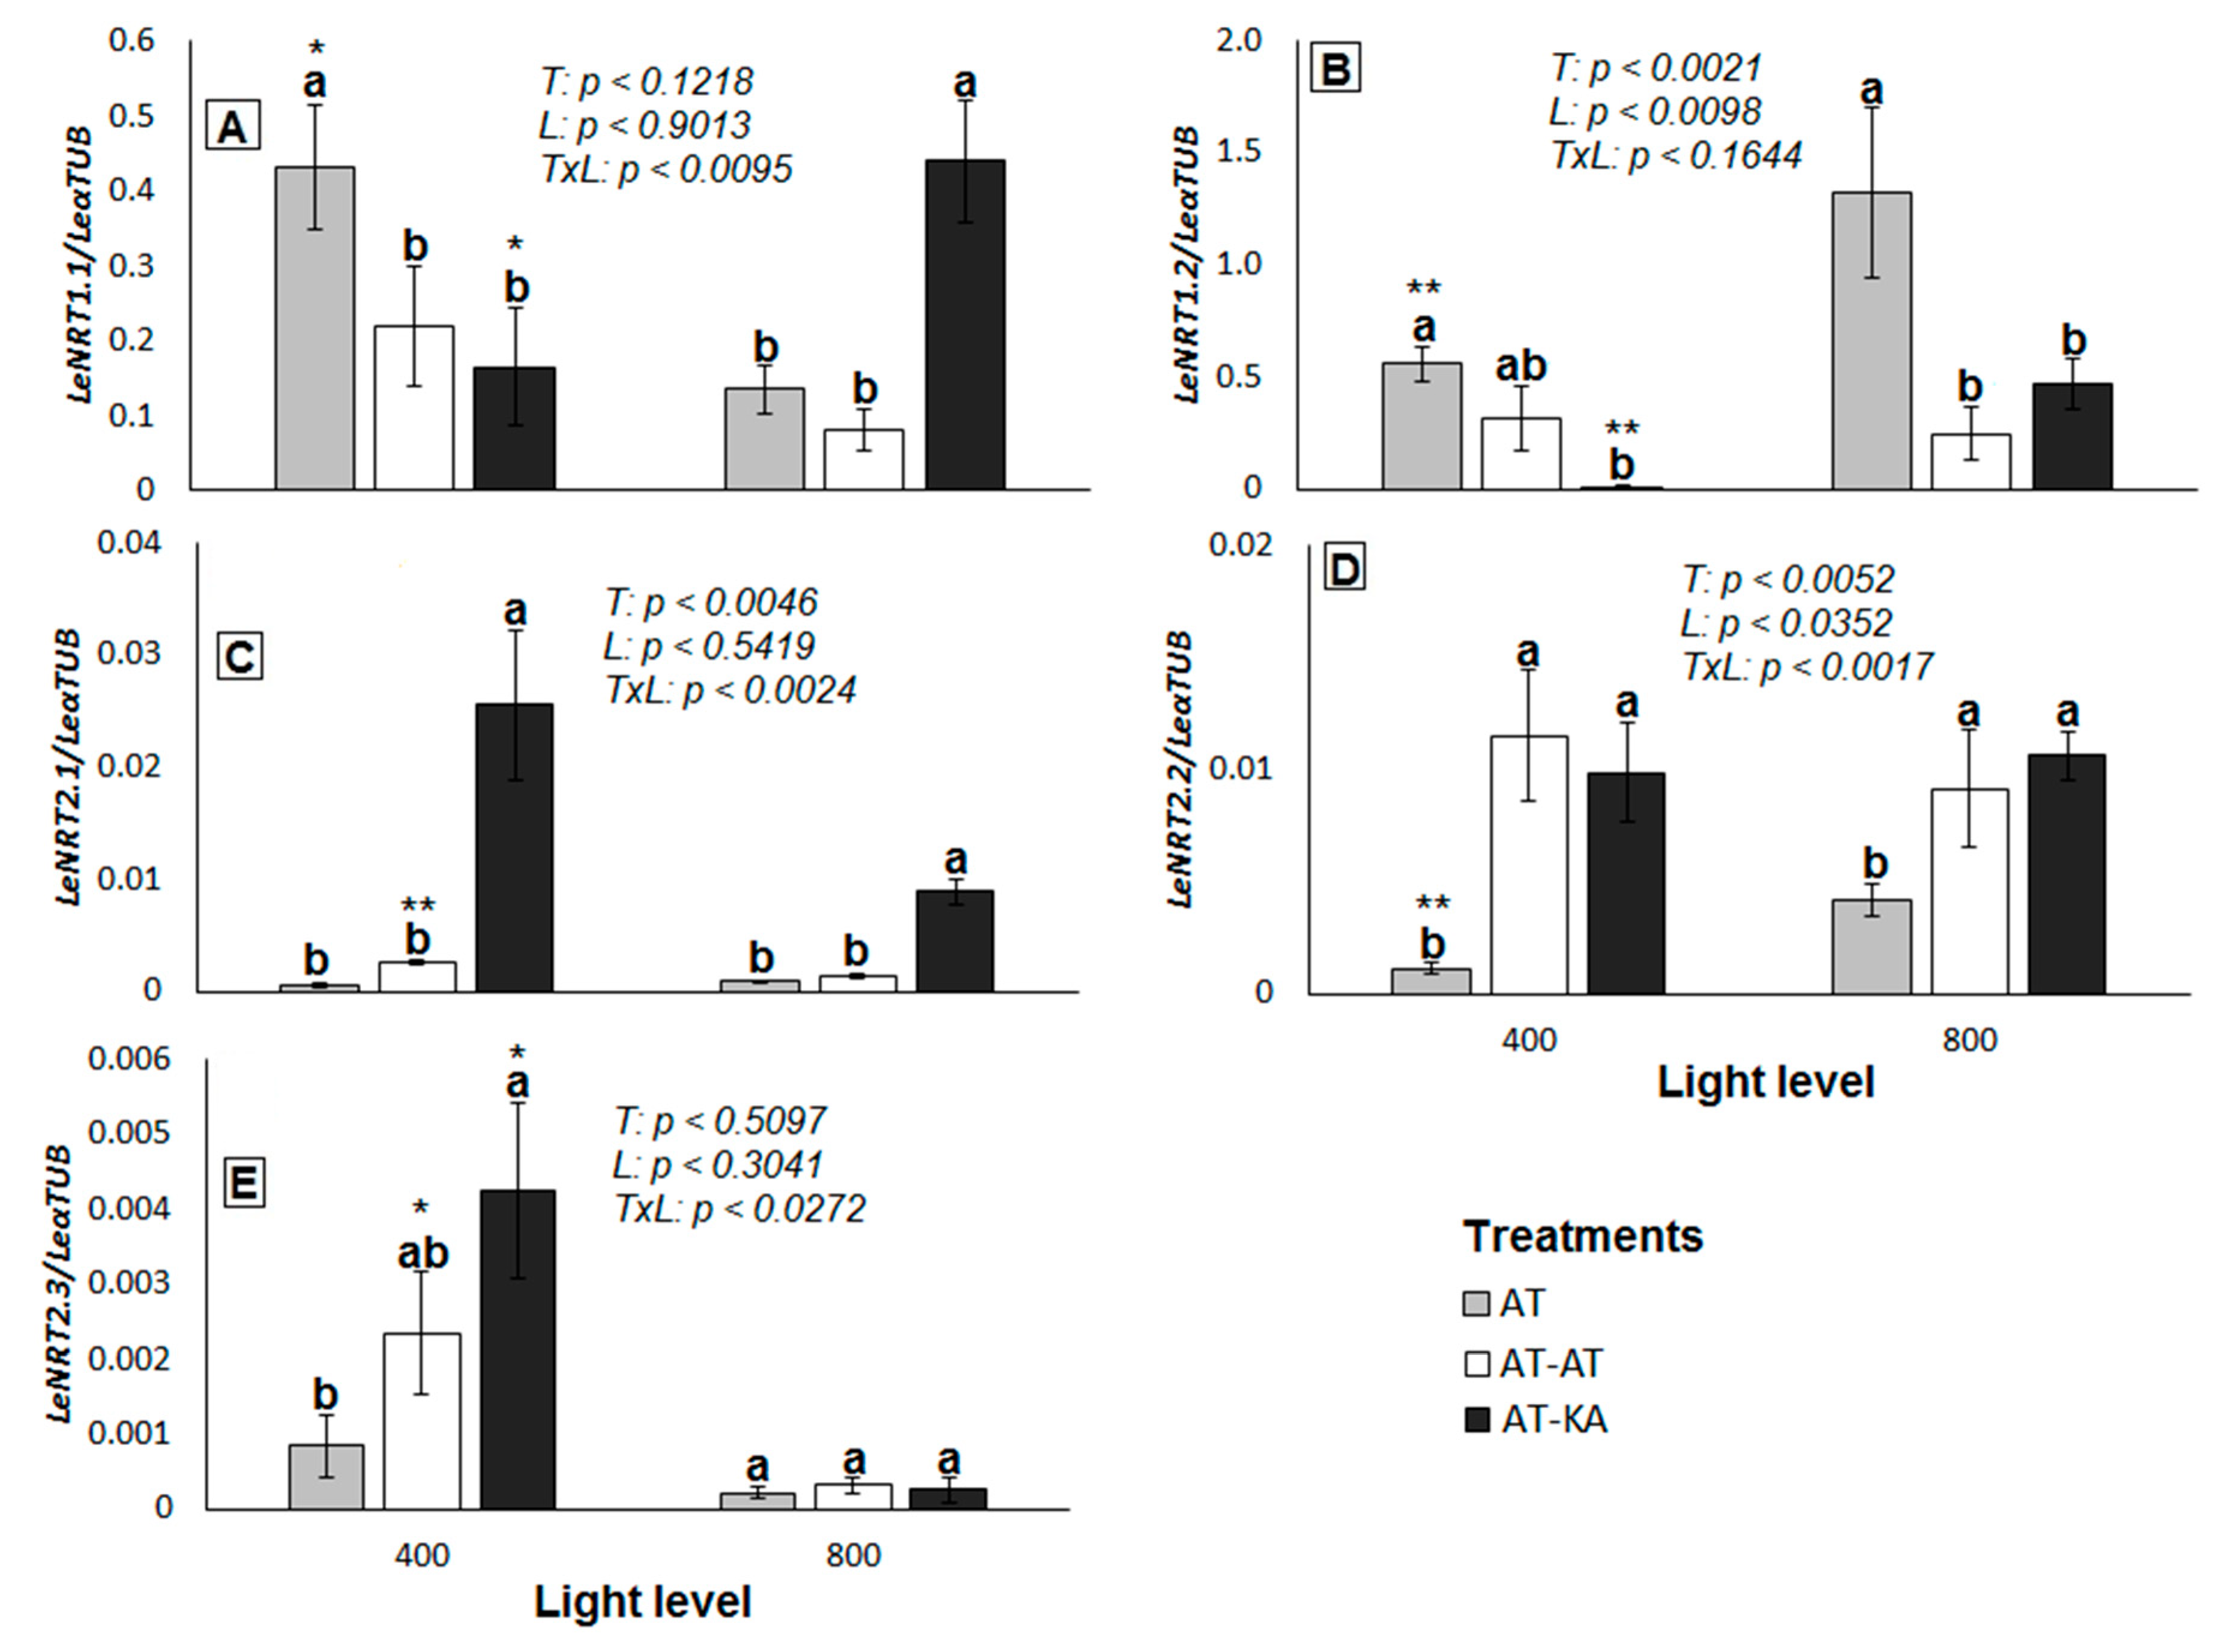
2.2. NO3− Transporters Expression
2.3. NO3− Uptake Kinetic Parameters
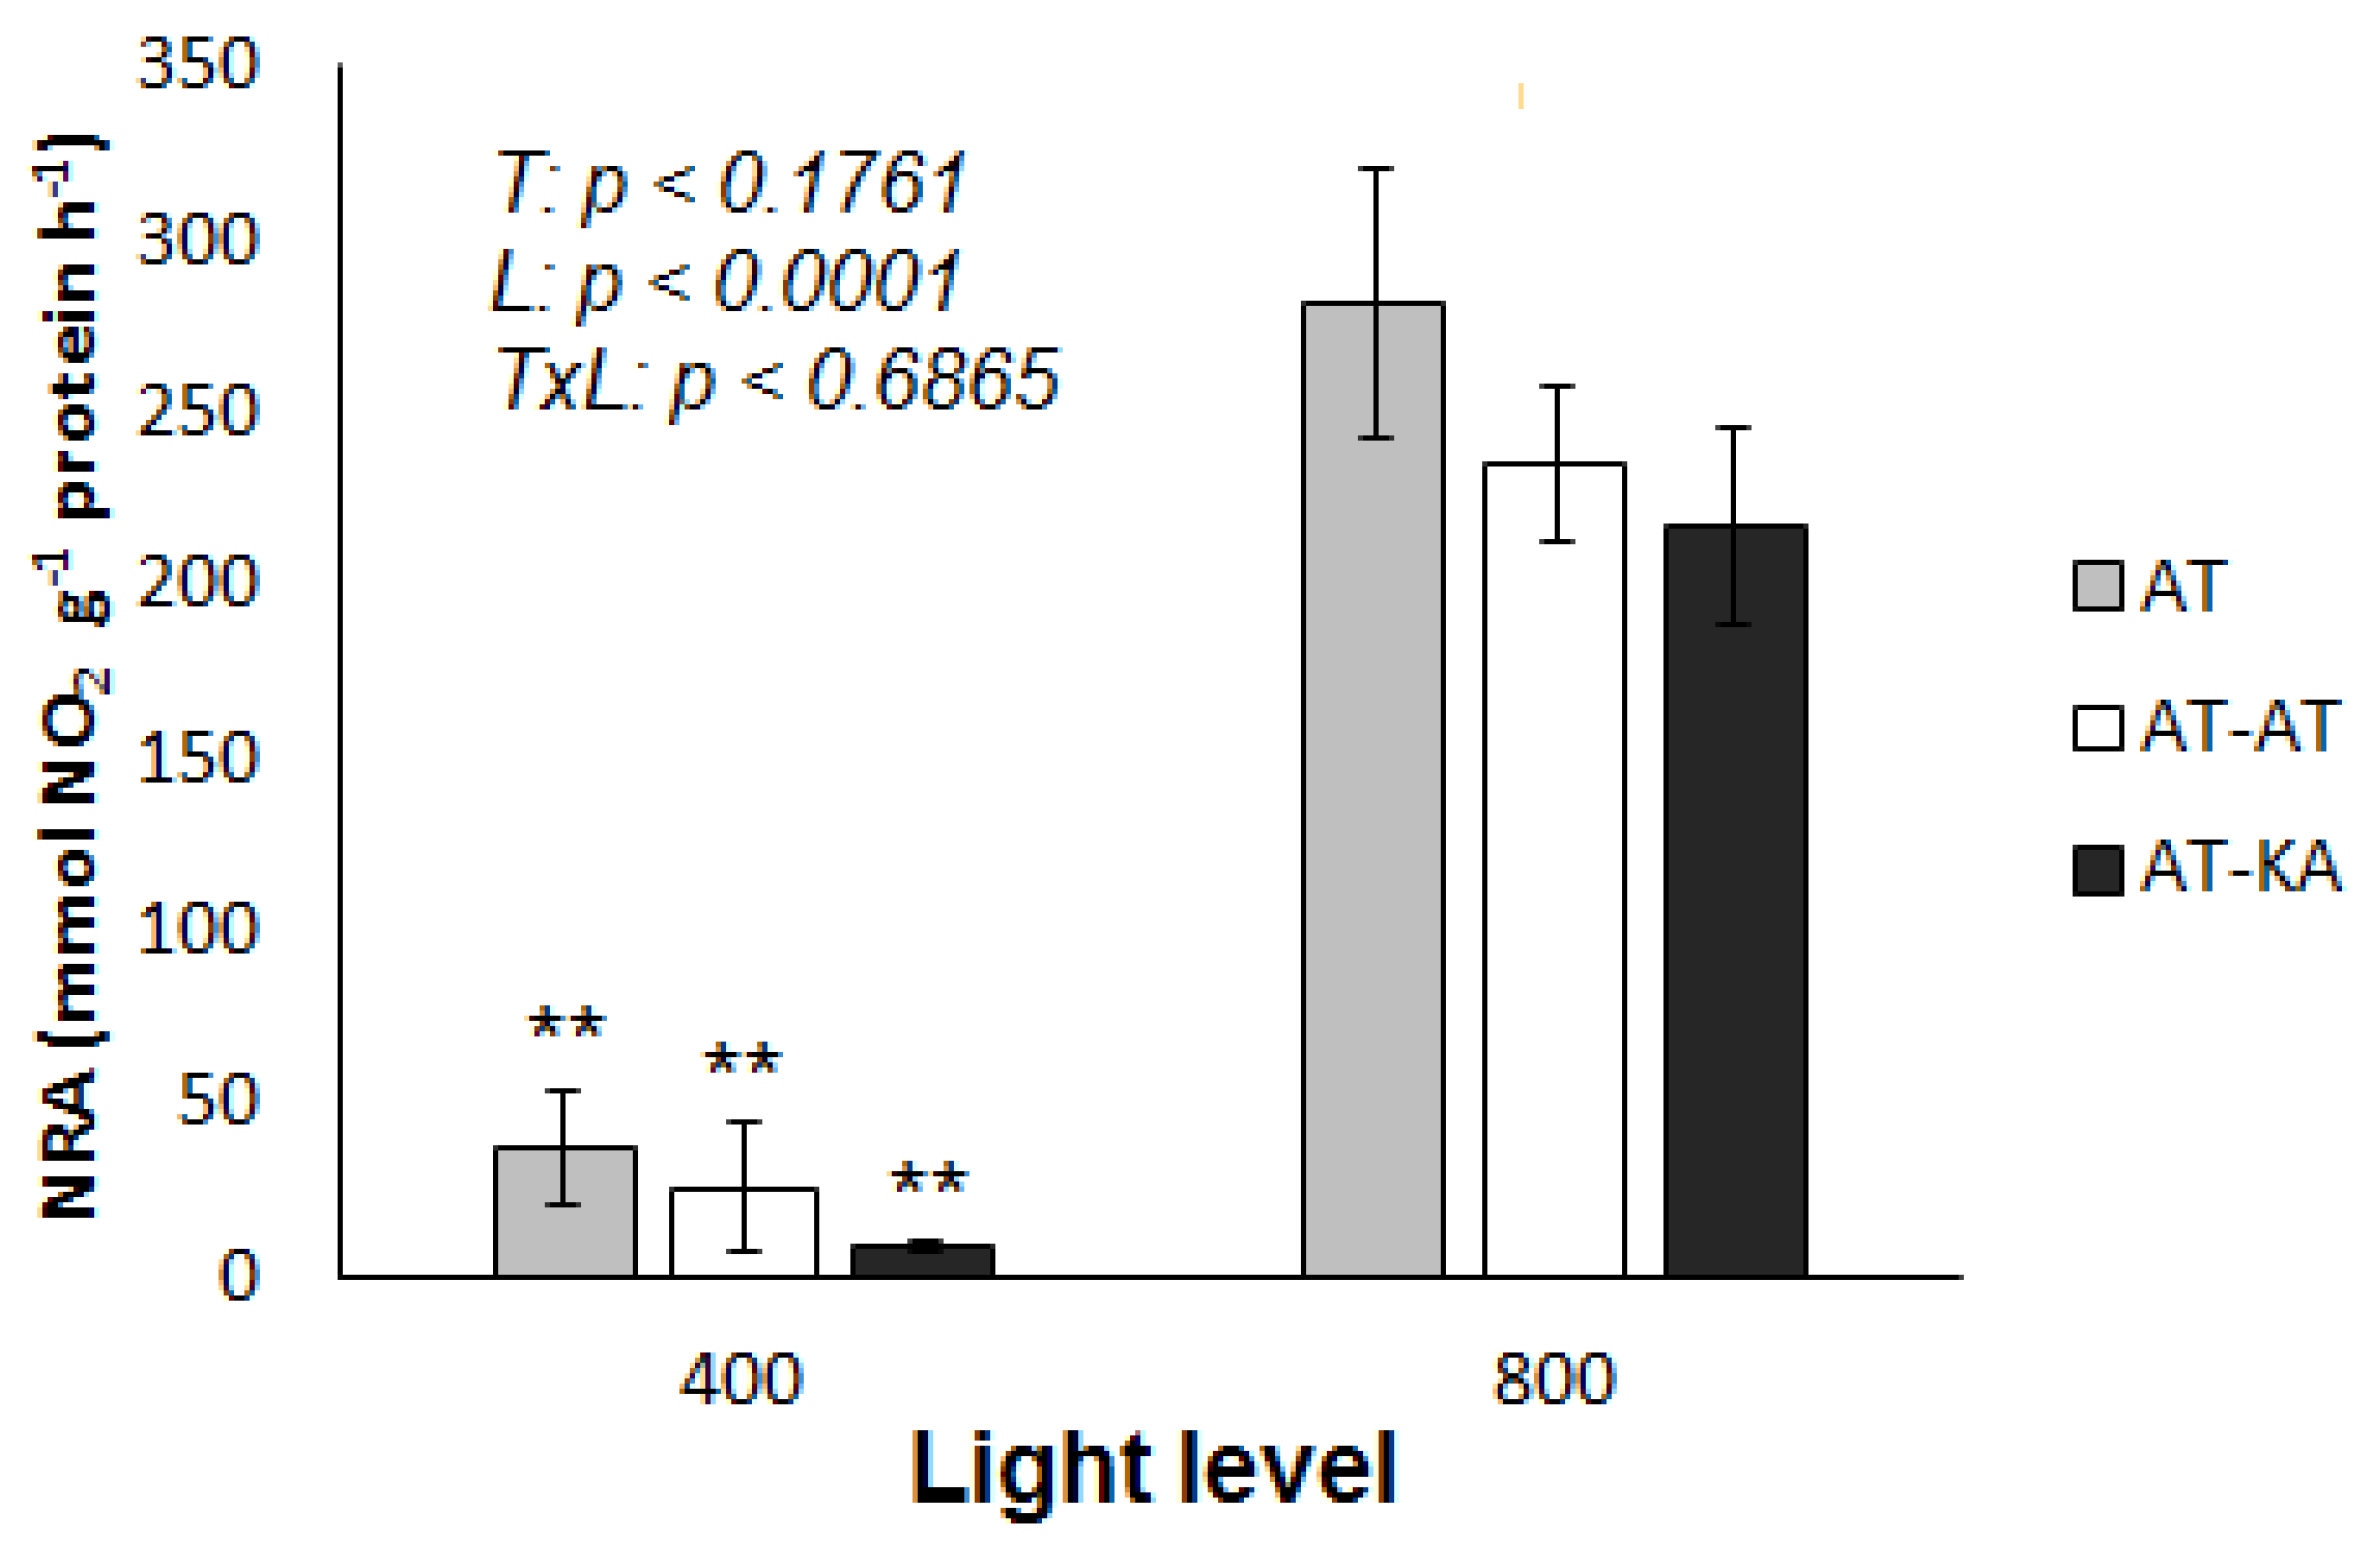
2.4. Nitrate Reductase Activity
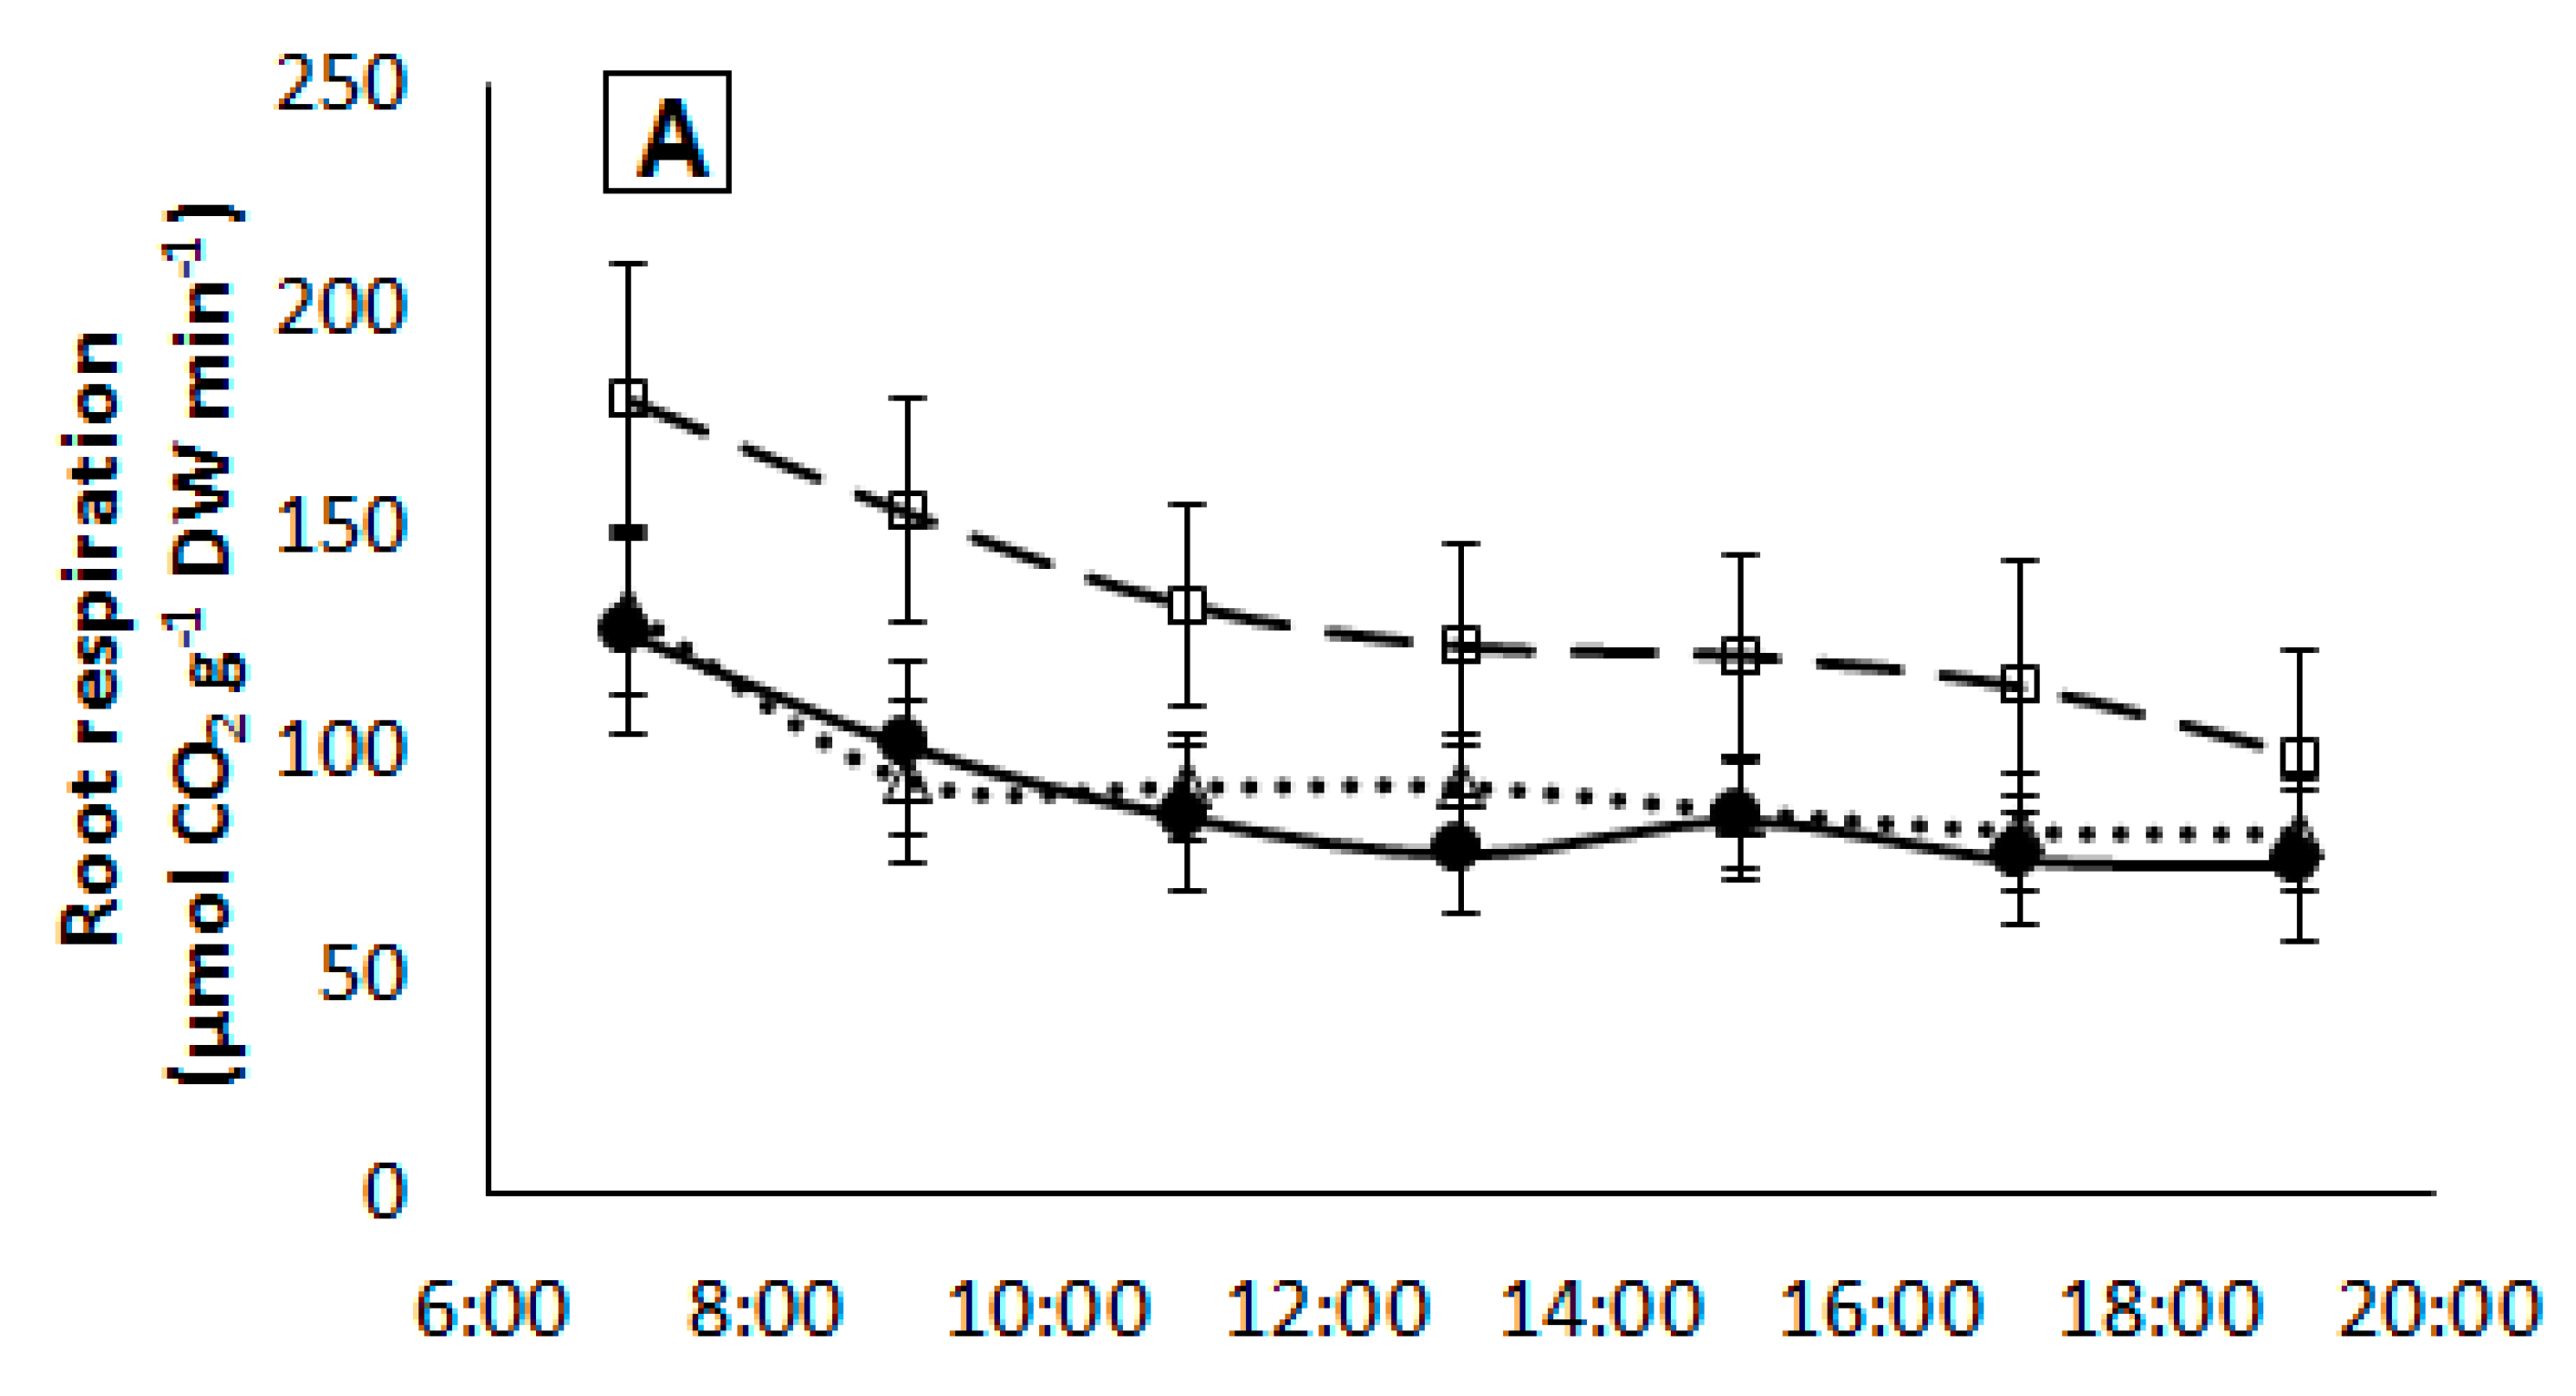
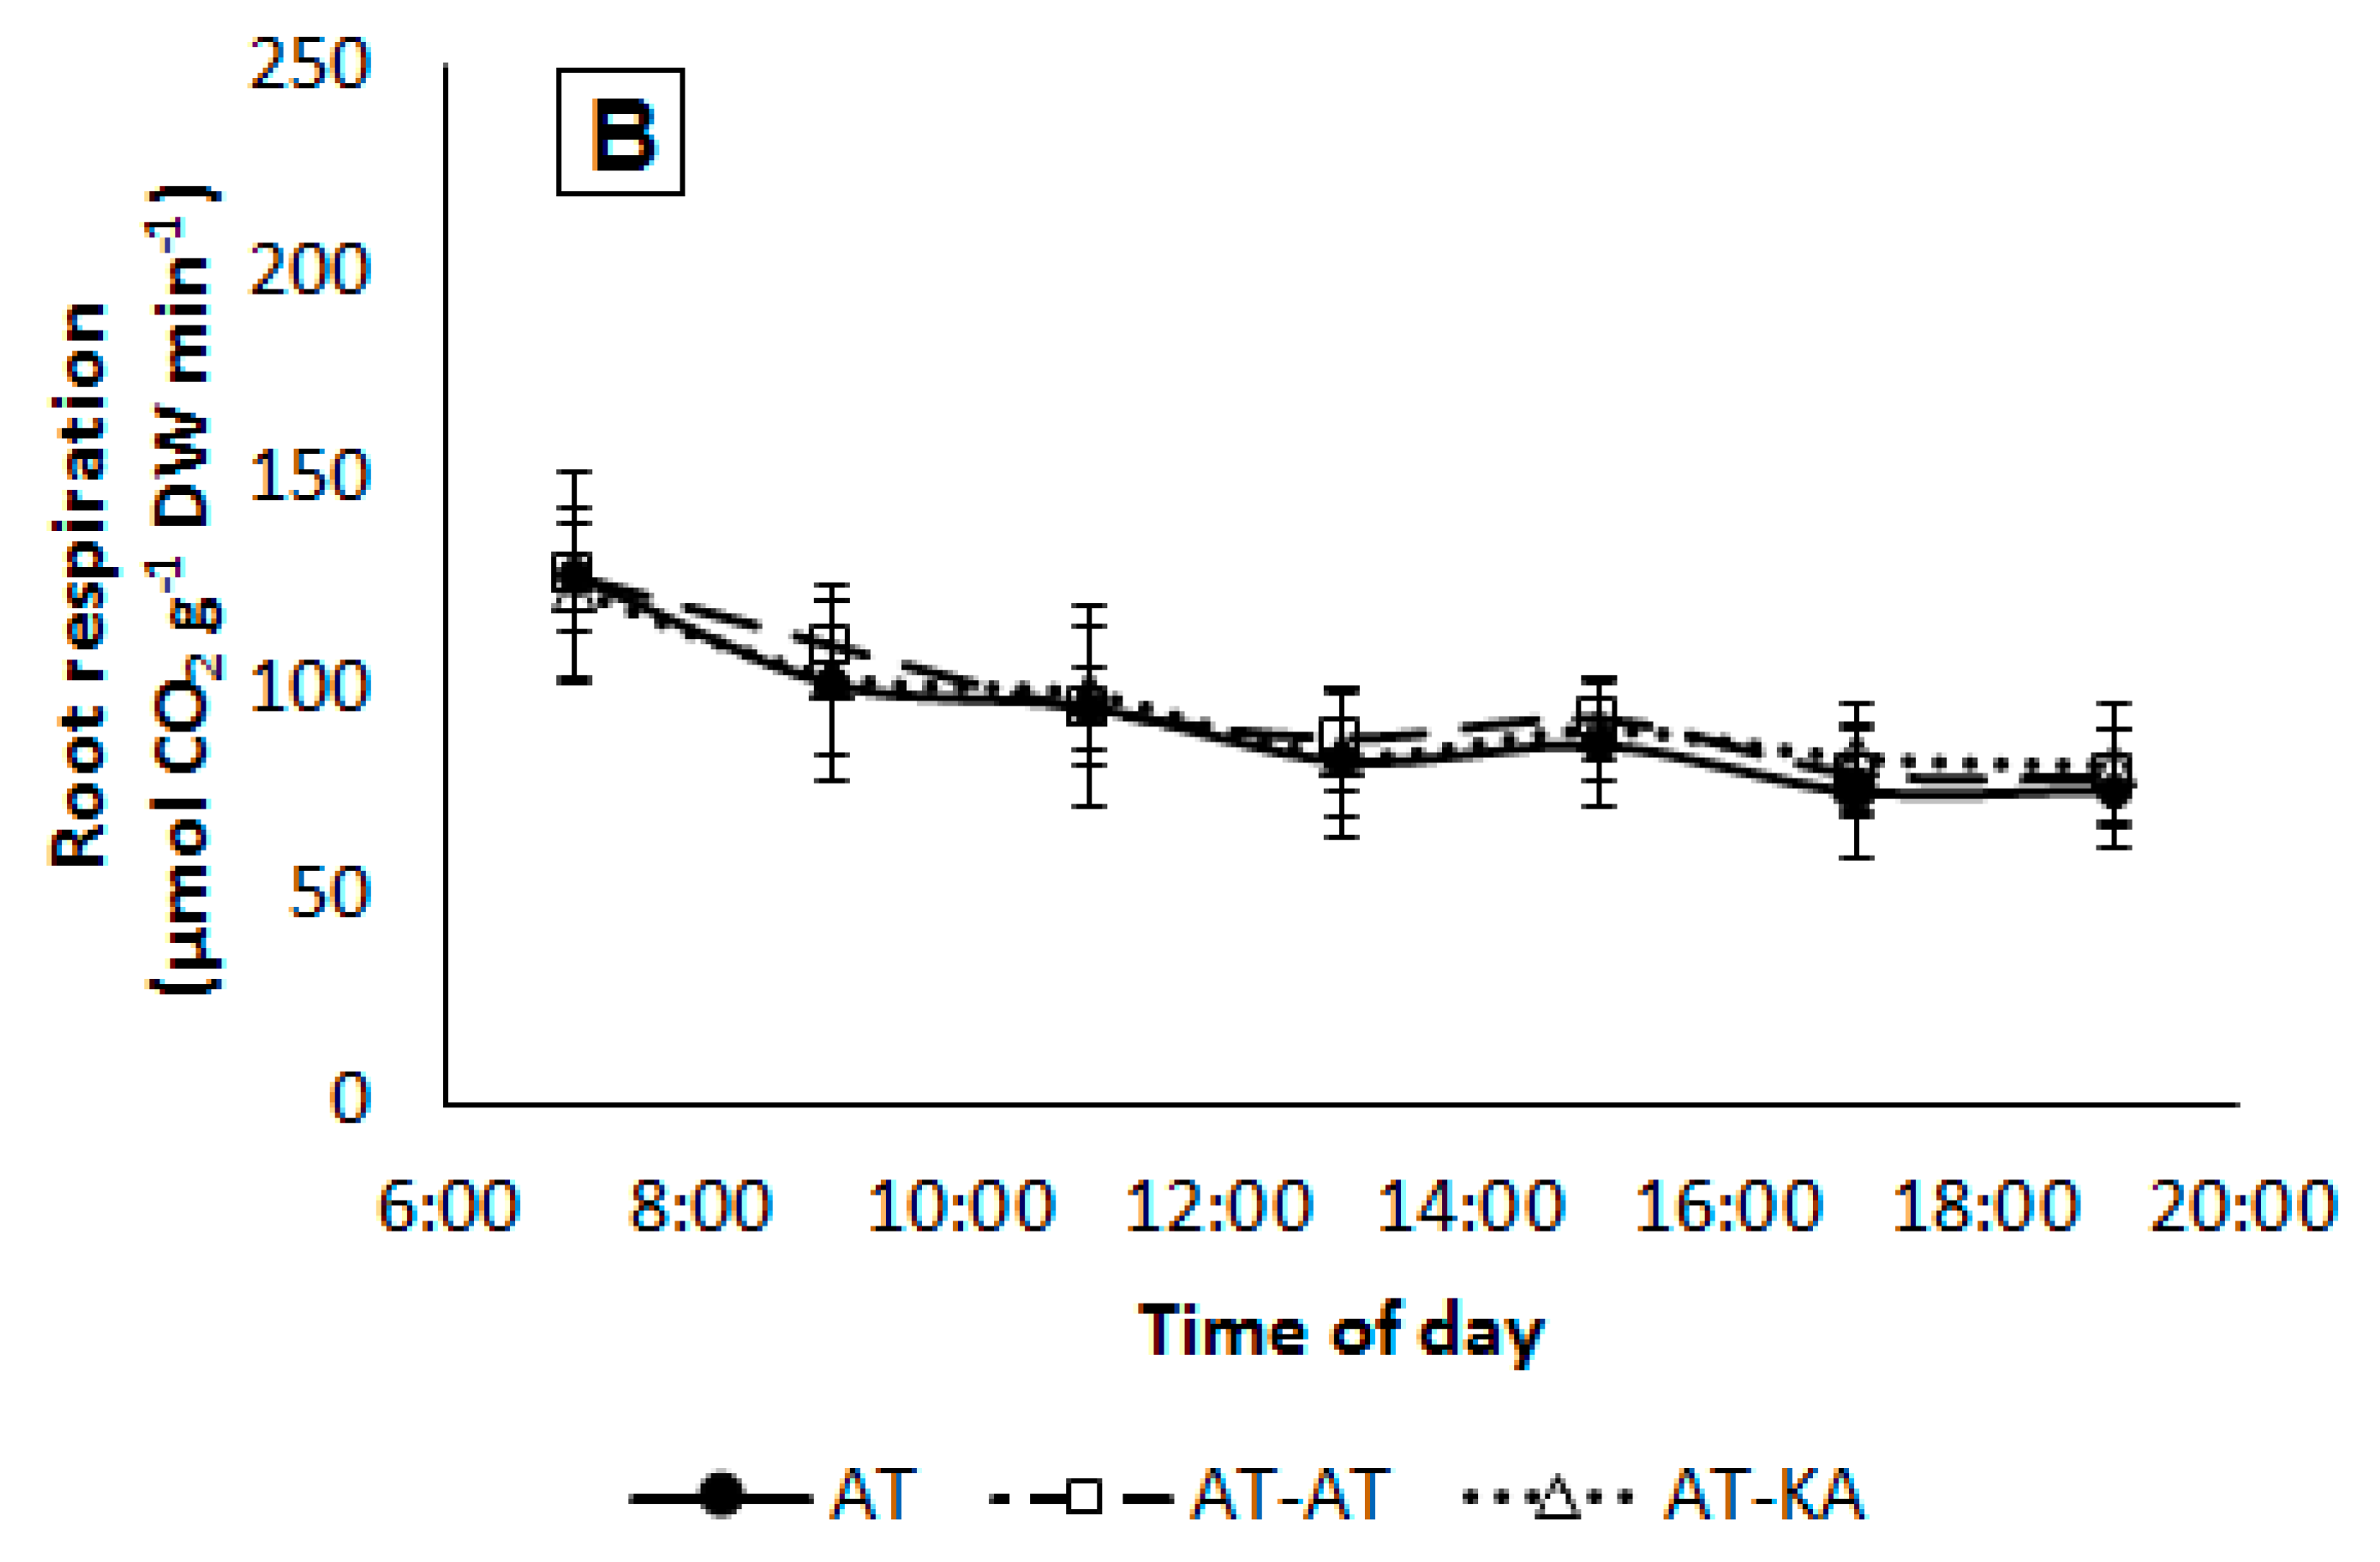
2.5. Root Respiration
3. Discussion
4. Materials and Methods
4.1. Plant Material and Growth Conditions
4.2. Growth Measurements and N Accumulation
4.3. Gene Expression
4.4. Enzyme Activity
4.5. NO3− Uptake Kinetic Parameters
4.6. Root Respiration
4.7. Statistical Analysis
5. Conclusions
Author Contributions
Funding
Acknowledgments
Conflicts of Interest
References
- Singh, H.; Kumar, P.; Chaudhari, S.; Edelstein, M. Tomato grafting: A global perspective. HortScience 2017, 52, 1328–1336. [Google Scholar] [CrossRef]
- Lee, J.; Kubota, C.; Tsao, S.J.; Bie, Z.; Hoyos Echevarria, P.; Morra, L.; Oda, M. Current status of vegetable grafting: Diffusion, grafting techniques, automation. Sci. Hortic. 2010, 127, 93–105. [Google Scholar] [CrossRef]
- Djidonou, D.; Zhao, X.; Simonne, E.H.; Koch, K.E.; Erickson, J.E. Yield, water-, and nitrogen-use efficiency in field-grown, grafted tomatoes. HortScience 2013, 48, 485–492. [Google Scholar]
- Magalhaes, J.S.; Wilcox, G.E. Tomato growth and nutrient uptake patterns as influenced by nitrogen form and light intensity. J. Plant Nutr. 1983, 6, 941–956. [Google Scholar] [CrossRef]
- Errebhi, M.; Wilcox, G.E. Tomato growth and nutrient uptake pattern as influenced by nitrogen form ratio. J. Plant Nutr. 1990, 18, 1031–1043. [Google Scholar] [CrossRef]
- Fu, Y.; Yi, H.; Bao, J.; Gong, J. LeNRT2.3 functions in nitrate acquisition and long-distance transport in tomato. FEBS Lett. 2015, 589, 1072–1079. [Google Scholar] [CrossRef]
- Ono, F.; Frommer, W.B.; Von Wiren, N. Coordinated diurnal regulation of low- and high-affinity nitrate transporters in tomato. Plant Biol. 2000, 2, 17–23. [Google Scholar] [CrossRef]
- Le Deunff, E.; Tournier, P.; Malagoli, P. The thermodynamic flow-force interpretation of root nutrient uptake kinetics: A powerful formalism for agronomic and phytoplanktonic models. Front. Physiol. 2016, 7, 243. [Google Scholar] [CrossRef]
- Von Wiren, N.; Gazzarrini, S.; Frommer, W.B. Regulation of mineral nitrogen uptake in plants. Plant Soil 1997, 196, 191–199. [Google Scholar] [CrossRef]
- Gent, L.; Forde, B.G. How do plants sense their nitrogen status? J. Exp. Bot. 2017, 68, 2531–2539. [Google Scholar] [CrossRef]
- Le Bot, J.; Jeannequin, B.; Fabre, R. Growth and nitrogen status of soilless tomato plants following nitrate withdrawal from the nutrient solution. Ann. Bot. 2001, 88, 361–370. [Google Scholar] [CrossRef]
- Imsande, J.; Touraine, B. N demand and the regulation of nitrate uptake. Plant Physiol. 1994, 105, 3–7. [Google Scholar] [CrossRef] [PubMed]
- Migoka, M.; Warzybok, A.; Klobus, G. The genomic organization and transcriptional pattern of genes encoding nitrate transporters 1 (NRT1) in cucumber. Plant Soil 2013, 364, 245–260. [Google Scholar] [CrossRef]
- Liu, L.; Fan, T.; Shi, D.; Li, C.; He, M.; Chen, Y.; Zhang, L.; Yang, C.; Cheng, X.; Chen, X.; et al. Coding-sequence identification and transcriptional profiling of nine AMTs and four NRTs from tobacco revealed their differential regulation by developmental stages, nitrogen nutrition, and photoperiod. Front. Plant Sci. 2018, 9, 210. [Google Scholar] [CrossRef] [PubMed]
- Sun, J.; Zheng, N. Molecular mechanism underlying the plant NRT1.1 dual-affinity nitrate transporter. Front. Physiol. 2015, 6, 386. [Google Scholar] [CrossRef] [PubMed]
- Rashid, M.; Bera, S.; Medvinsky, A.B.; Sun, G.; Li, B.; Chakraborty, A. Adaptive regulation of nitrate transceptor NRT1.1 in fluctuating soil nitrate conditions. iScience 2018, 2, 41–50. [Google Scholar] [CrossRef]
- Hildebrandt, U.; Schmelzer, E.; Bothe, H. Expression of nitrate transporter genes in tomato colonized by an arbuscular mycorrhizal fungus. Physiol. Plantarum 2002, 115, 125–136. [Google Scholar] [CrossRef]
- Fan, X.; Naz, M.; Fan, X.; Xuan, W.; Miller, A.J.; Xu, G. Plant nitrate transporters: From gene function to application. J. Exp. Bot. 2017, 68, 2463–2475. [Google Scholar] [CrossRef]
- Wang, Y.; Garvin, D.F.; Kochian, L.V. Nitrate-induced genes in tomato roots. Array analysis reveals novel genes that may play a role in nitrogen nutrition. Plant Physiol. 2001, 127, 345–359. [Google Scholar] [CrossRef]
- Little, D.Y.; Rao, H.; Oliva, S.; Daniel-Vedele, F.; Krapp, A.; Malamy, J.E. The putative high-affinity nitrate transporter NRT2.1 represses lateral root initiation in response to nutritional cues. Proc. Natl. Acad. Sci. USA 2005, 102, 13693–13698. [Google Scholar] [CrossRef]
- Tsay, Y.; Chiu, C.; Tsai, C.; Ho, C.; Hsu, P. Nitrate transporters and peptide transporters. FEBS Lett. 2007, 581, 2290–2300. [Google Scholar] [CrossRef] [PubMed]
- Krouk, G.; Crawford, N.M.; Coruzzi, G.M.; Tsay, Y. Nitrate signaling: Adaptation to fluctuating environemnts. Curr. Opin. Plant Biol. 2010, 13, 265–272. [Google Scholar] [CrossRef] [PubMed]
- Krouk, G.; Tranchina, D.; Lejay, L.; Cruikshank, A.A.; Shasha, D.; Coruzzi, G.M.; Gutierrez, R.A. A systems approach uncovers restrictions for signal interactions regulating genome-wide responses to nutritional cues in Arabidopsis. PLOS Comput. Biol. 2009, 5, E1000326. [Google Scholar] [CrossRef] [PubMed]
- Alvarez, J.M.; Riveras, E.; Vidal, E.A.; Gras, D.E.; Contreras-Lopez, O.; Tamayo, K.P.; Aceituno, F.; Gomez, I.; Ruffel, S.; Lejay, L.; et al. Systems approach identifies TGA1 and TGA4 transcription factors as important regulatory components of the nitrate response of Arabidopsis thaliana roots. Plant J. 2014, 80, 1–13. [Google Scholar] [CrossRef] [PubMed]
- Smart, D.R.; Bloom, A.J. Kinetics of ammonium and nitrate uptake among wild and cultivated tomatoes. Oecologia 1988, 76, 336–340. [Google Scholar] [CrossRef] [PubMed]
- Cardenas-Navarro, R.; Adamowicz, S.; Gojon, A.; Robin, P. Modelling nitrate influx in young tomato (Lycopersicon esculebtum Mill.) plants. J. Exp. Bot. 1999, 50, 625–635. [Google Scholar] [CrossRef]
- Klock, K.A.; Taber, H.G.; Graves, W.R. Root respiration and phosphorus nutrition of tomato plants grown at a 36°C root-zone temperature. J. Am. Soc. Hortic. Sci. 1997, 122, 175–178. [Google Scholar]
- Shi, K.; Hu, W.; Dong, D.; Zhou, Y.; Yu, J. Low O2 supply is involved in the poor growth in root-restricted plants of tomato (Lycopersicon esculentum Mill.). Environ. Exp. Bot. 2007, 61, 181–189. [Google Scholar] [CrossRef]
- Horchani, F.; Khayati, H.; Raymond, P.; Brouquisse, R.; Aschi-Smiti, S. Contrasted effects of prolonged root hypoxia on tomato root and fruit (Solanum lycopersicum) metabolism. J. Agron. Crop Sci. 2009, 195, 313–318. [Google Scholar] [CrossRef]
- Toro, G.; Pinto, M.; Pimentel, P. Root respiratory components of Prunus spp. Rootstocks under low oxygen: Regulation of growth, maintenance, and ion uptake respiration. Sci. Hortic. 2018, 239, 259–268. [Google Scholar] [CrossRef]
- Taiz, L.; Zeiger, E. Plant Physiology, 4th ed.; Sinauer Associates, Inc.: Sunderland, MA, USA, 2006; pp. 289–311. ISBN 0-87893-856-7. [Google Scholar]
- Garnet, T.; Conn, V.; Kaiser, B.N. Root based approaches to improving nitrogen use efficiency in plants. Plant Cell Environ. 2009, 32, 1272–1283. [Google Scholar] [CrossRef] [PubMed]
- Loussaert, D.; Clapp, J.; Mongar, N.; O’Neill, D.P.; Shen, B. Nitrate assimilation limits nitrogen use efficiency (NUE) in maize (Zea mays L.). Agronomy 2018, 8, 110. [Google Scholar] [CrossRef]
- Azher, M.; Wang, L.; Jiao, Y.; Chen, C.; Zhao, L.; Mei, M.; Yu, Y.; Bie, Z.; Huang, Y. Pumpkin rootstock improves nitrogen use efficiency of watermelon scion by enhancing nutrient uptake, cytokinin content, and expression of nitrate reductase genes. Plant Growth Regul. 2017, 82, 233–246. [Google Scholar]
- Yao, J.; Shi, W.M.; Xu, W.F. Effects of salt stress on expression of nitrate transporter and assimilation-related genes in tomato roots. Russ. J. Plant Physiol. 2008, 55, 232–240. [Google Scholar] [CrossRef]
- Kaiser, J.; Lewis, O. Nitrate reductase and glutamine synthetase activity in leaves and roots of nitrate-fed Helianthus annuus L. Plant Soil 1984, 77, 127–130. [Google Scholar] [CrossRef]
- Reguera, M.; Peleg, Z.; Abdel-Tawab, Y.M.; Tumimbang, E.B.; Delatorre, C.A.; Blumwald, E. Stress-induced cytokinin synthesis increases drought tolerance through the coordinated regulation of carbon and nitrogen assimilation in rice. Plant Physiol. 2013, 163, 1609–1622. [Google Scholar] [CrossRef] [PubMed]
- R Development Core Team. R: A Language and Environment for Statistical Computing; R Foundation for Statistics Computing: Vienna, Austria, 2008. [Google Scholar]
- Di Rienzo, J.A.; Casanoves, F.; Balzarini, M.G.; Gonzalez, L.; Tablada, M.; Robledo, C.W. InfoStat Version 2014 Grupo InfoStat; Universidad Nacional de Cordoba: Cordoba, Argentina, 2014. [Google Scholar]


| Treatment | Tissue N Content (mg g−1 DW) | |||
|---|---|---|---|---|
| 400 µmol m−2 s−1 | 800 µmol m−2 s−1 | |||
| Shoot | Root | Shoot | Root | |
| AT | 59.3 ± 0.7 a | 45.1 ± 3.1 a | 59.0 ± 1.1 a | 38.7 ± 3.6 a |
| AT-AT | 57.0 ± 0.1 b | 42.5 ± 2.1 a | 58.6 ± 0.9 a | 45.4 ± 1.4 a |
| AT-KA | 55.4 ± 0.3 b | 38.4 ± 1.6 a | 57.6 ± 1.0 a | 48.3 ± 0.7 a |
| Treatment | Vmax (mmol g−1 DW h−1) | Km (mM) | ||
|---|---|---|---|---|
| 400 | 800 | 400 | 800 | |
| AT | 5.56 ± 1.05 | 7.53 ± 1.36 | 0.16 ± 0.02 | 0.04 ± 0.02 |
| AT-AT | 6.37 ± 1.33 | 7.20 ± 1.65 | 0.35 ± 0.10 | 0.02 ± 0.01 |
| AT-KA | 3.34 ± 1.72 | 7.21 ± 0.50 | 0.17 ± 0.08 | 0.06 ± 0.04 |
| Gene | Primer |
|---|---|
| LeNRT1.1 | Forward: TACTATTCAAGCTATGGGTGTTACG |
| Reverse: ATTTGTCCTCTTTCTTTTTTGTCCG | |
| LeNRT1.2 | Forward: TTTTAGGTGTTGAAGCTGTGGAGAG |
| Reverse: GCGATGTATAGGACCATGAGTTGTT | |
| LeNRT2.1 | Forward: TTCCTGTTACATTTTGTCATTTCCC |
| Reverse: CAGATTCAAGACTATCCATTCCTCA | |
| LeNRT2.2 | Forward: TCAAGGGAACGGAAGAACATTATTA |
| Reverse: GCTCATTGAACTAAAGATTGACGAT | |
| LeNRT2.3 | Forward: AATGCATGGTGTTACTGGTAGAGAG |
| Reverse: CTAATAATAGGGACTAAAGGGGCTG |
© 2018 by the authors. Licensee MDPI, Basel, Switzerland. This article is an open access article distributed under the terms and conditions of the Creative Commons Attribution (CC BY) license (http://creativecommons.org/licenses/by/4.0/).
Share and Cite
Albornoz, F.; Gebauer, M.; Ponce, C.; Cabeza, R.A. LeNRT1.1 Improves Nitrate Uptake in Grafted Tomato Plants under High Nitrogen Demand. Int. J. Mol. Sci. 2018, 19, 3921. https://doi.org/10.3390/ijms19123921
Albornoz F, Gebauer M, Ponce C, Cabeza RA. LeNRT1.1 Improves Nitrate Uptake in Grafted Tomato Plants under High Nitrogen Demand. International Journal of Molecular Sciences. 2018; 19(12):3921. https://doi.org/10.3390/ijms19123921
Chicago/Turabian StyleAlbornoz, Francisco, Marlene Gebauer, Carlos Ponce, and Ricardo A. Cabeza. 2018. "LeNRT1.1 Improves Nitrate Uptake in Grafted Tomato Plants under High Nitrogen Demand" International Journal of Molecular Sciences 19, no. 12: 3921. https://doi.org/10.3390/ijms19123921
APA StyleAlbornoz, F., Gebauer, M., Ponce, C., & Cabeza, R. A. (2018). LeNRT1.1 Improves Nitrate Uptake in Grafted Tomato Plants under High Nitrogen Demand. International Journal of Molecular Sciences, 19(12), 3921. https://doi.org/10.3390/ijms19123921