Article

Transcriptomic Analysis of Betula halophila in Response to Salt Stress

1
State Key Laboratory of Tree Genetics and Breeding, Key Laboratory of Tree Breeding and Cultivation of State Forestry Administration, The Research Institute of Forestry, Chinese Academy of Forestry, Beijing 100091, China
2
CSIRO Agriculture and Food, Canberra, ACT 2601, Australia
*
Author to whom correspondence should be addressed.
Int. J. Mol. Sci. 2018, 19(11), 3412; https://doi.org/10.3390/ijms19113412
Submission received: 9 October 2018 / Revised: 24 October 2018 / Accepted: 25 October 2018 / Published: 31 October 2018
(This article belongs to the Special Issue Plant Genomics)

Abstract

:
Soil salinization is a matter of concern worldwide. It can eventually lead to the desertification of land and severely damage local agricultural production and the ecological environment. Betula halophila is a tree with high salt tolerance, so it is of importance to understand and discover the salt responsive genes of B. halophila for breeding salinity resistant varieties of trees. However, there is no report on the transcriptome in response to salt stress in B. halophila. Using Illumina sequencing platform, approximately 460 M raw reads were generated and assembled into 117,091 unigenes. Among these unigenes, 64,551 unigenes (55.12%) were annotated with gene descriptions, while the other 44.88% were unknown. 168 up-regulated genes and 351 down-regulated genes were identified, respectively. These Differentially Expressed Genes (DEGs) involved in multiple pathways including the Salt Overly Sensitive (SOS) pathway, ion transport and uptake, antioxidant enzyme, ABA signal pathway and so on. The gene ontology (GO) enrichments suggested that the DEGs were mainly involved in a plant-type cell wall organization biological process, cell wall cellular component, and structural constituent of cell wall molecular function. Kyoto Encyclopedia of Genes and Genomes (KEGG) pathway enrichment showed that the top-four enriched pathways were ‘Fatty acid elongation’, ‘Ribosome’, ‘Sphingolipid metabolism’ and ‘Flavonoid biosynthesis’. The expression patterns of sixteen DEGs were analyzed by qRT-PCR to verify the RNA-seq data. Among them, the transcription factor AT-Hook Motif Nuclear Localized gene and dehydrins might play an important role in response to salt stress in B. halophila. Our results provide an important gene resource to breed salt tolerant plants and useful information for further elucidation of the molecular mechanism of salt tolerance in B. halophila.

1. Introduction

Soil salinization is worldwide problem that can alter the soil osmotic potential to the point where it inhibits the uptake of water by plants, severely impacting agricultural production and the ecological environment. It has been reported that more than 6% of the world’s land is affected by salt [1,2,3], and increased salinization may lead to the loss of 30% arable land in the next 25 years. It has been reported that more than 6% of the world’s land is affected by salt [1,2,3], and increased salinization may lead to the loss of 30% arable land in the next 25 years and up to 50% by 2050 [1,2,3]. Therefore, soil salinization is a serious threat to the growth and development of plants. At present, it is particularly urgent to search for salinity resistant varieties of plants and screen for salt tolerant gene alleles or transform them genetically to enable plants to grow and reproduce with increasing salinity stress [4]. Moreover, understanding the mechanism of salt tolerance in plants can provide valuable information for effective engineering strategies.
In plants, the salt resistance mechanism is very complicated and involves a complex of processes at the molecular, cellular, metabolic, physiological, and whole-plant levels. Once the plant is under salt stress, multiple signal transduction pathways are activated to cope with salt stress [2,4,5,6]. In recent years, although extensive studies among ion uptake and transport, osmotic regulation, hormone metabolism, antioxidant metabolism, and stress signaling have made significant progress [4,5,6,7,8,9,10,11], the molecular mechanisms involved in salt tolerance remain to be elucidated. In addition, next-generation high-throughput sequencing based RNA-seq analysis has been widely used to uncover expression patterns under abiotic stress, and it provides a comprehensive means of identifying and studying the differential expression genes [12,13,14,15].
Betula halophila is a haloduric species in China, belonging to the family Betulaceae. It was first discovered in a swamp with extremely high salinity in Xinjiang province [16] in 1956 by Professor Renchang Qin. B. halophila is a critically endangered plant, which has high salt tolerance, and high ecological and economic value in promoting the afforestation of saline soil in arid and semi-arid areas16. Thus B. halophila is a potent source of salt tolerant genes. However, to the best of our knowledge, there is no published information on genes associated with salt tolerance in B. halophila. Understanding the molecular mechanisms of salt tolerance are potentially important for breeding salt tolerant varieties. With the aim of identifying the genes in response to increasing salt concentration and potentially the molecular mechanisms of salt tolerance in B. halophila, we constructed transcriptome libraries from the leaves of control B. halophila plants and plants subjected to salt treatment. The aims were to detect salt responsive genes from B. halophila and explore their roles in response to salt stress. Our results provide insight into the molecular mechanisms of salt tolerance in B. halophila. A better understanding of these tolerance mechanisms can be used to breed crops with improved yield performance under salinity stress.

2. Results

2.1. Transcriptome Sequencing and Assembly

In order to explore the salt tolerant genes of B. halophila, six cDNA libraries were constructed from leaves of eight-months-old control plants (untreated) and plants treated with 200 mM of NaCl for 24 h, and sequenced using the Illumina deep sequencing platform. A total of 68,348,352, 75,684,144, 70,510,750, 86,101,536, 77,402,824, and 84,837,142 raw reads were generated by Illumina sequencing, respectively, after adapter sequence and low quality sequences had been removed, a total of 66,834,236, 73,359,338, 69,082,978, 84,155,542, 75,577,004, and 82,931,756 clean reads were obtained, and the Q20 percentage (proportion of nucleotides with a quality value larger than 20) for each data was 96.5%, 96.48%, 96.25%, 96.54%, 96.49%, and 96.45%, respectively. The GC (%) ratio for each library was 46.88%, 47.4%, 47.29%, 47.28%, 47.33% and 47.29% (Table 1). Transcriptome assembly was accomplished based on the left.fq and right.fq using Trinity with the min_kmer_cov set to 2 by default and all other parameters set to default [17]. As a result, a total of 117,091 unigenes with lengths ranging from 201 bp to 15,762 bp were obtained. The size distribution of the unigenes is shown in Figure 1. The size distribution showed that the unigenes ranged from 200 bp to 1 kbp was the majority (Figure 1). The average length, median length, and N50 of the assembled unigenes were 956 bp, 631 bp and 1408 bp, separately. The total length of 117,091 unigenes was 110 Mb, which suggests that most of the sequencing data had been successfully assembled into relatively long unigenes.

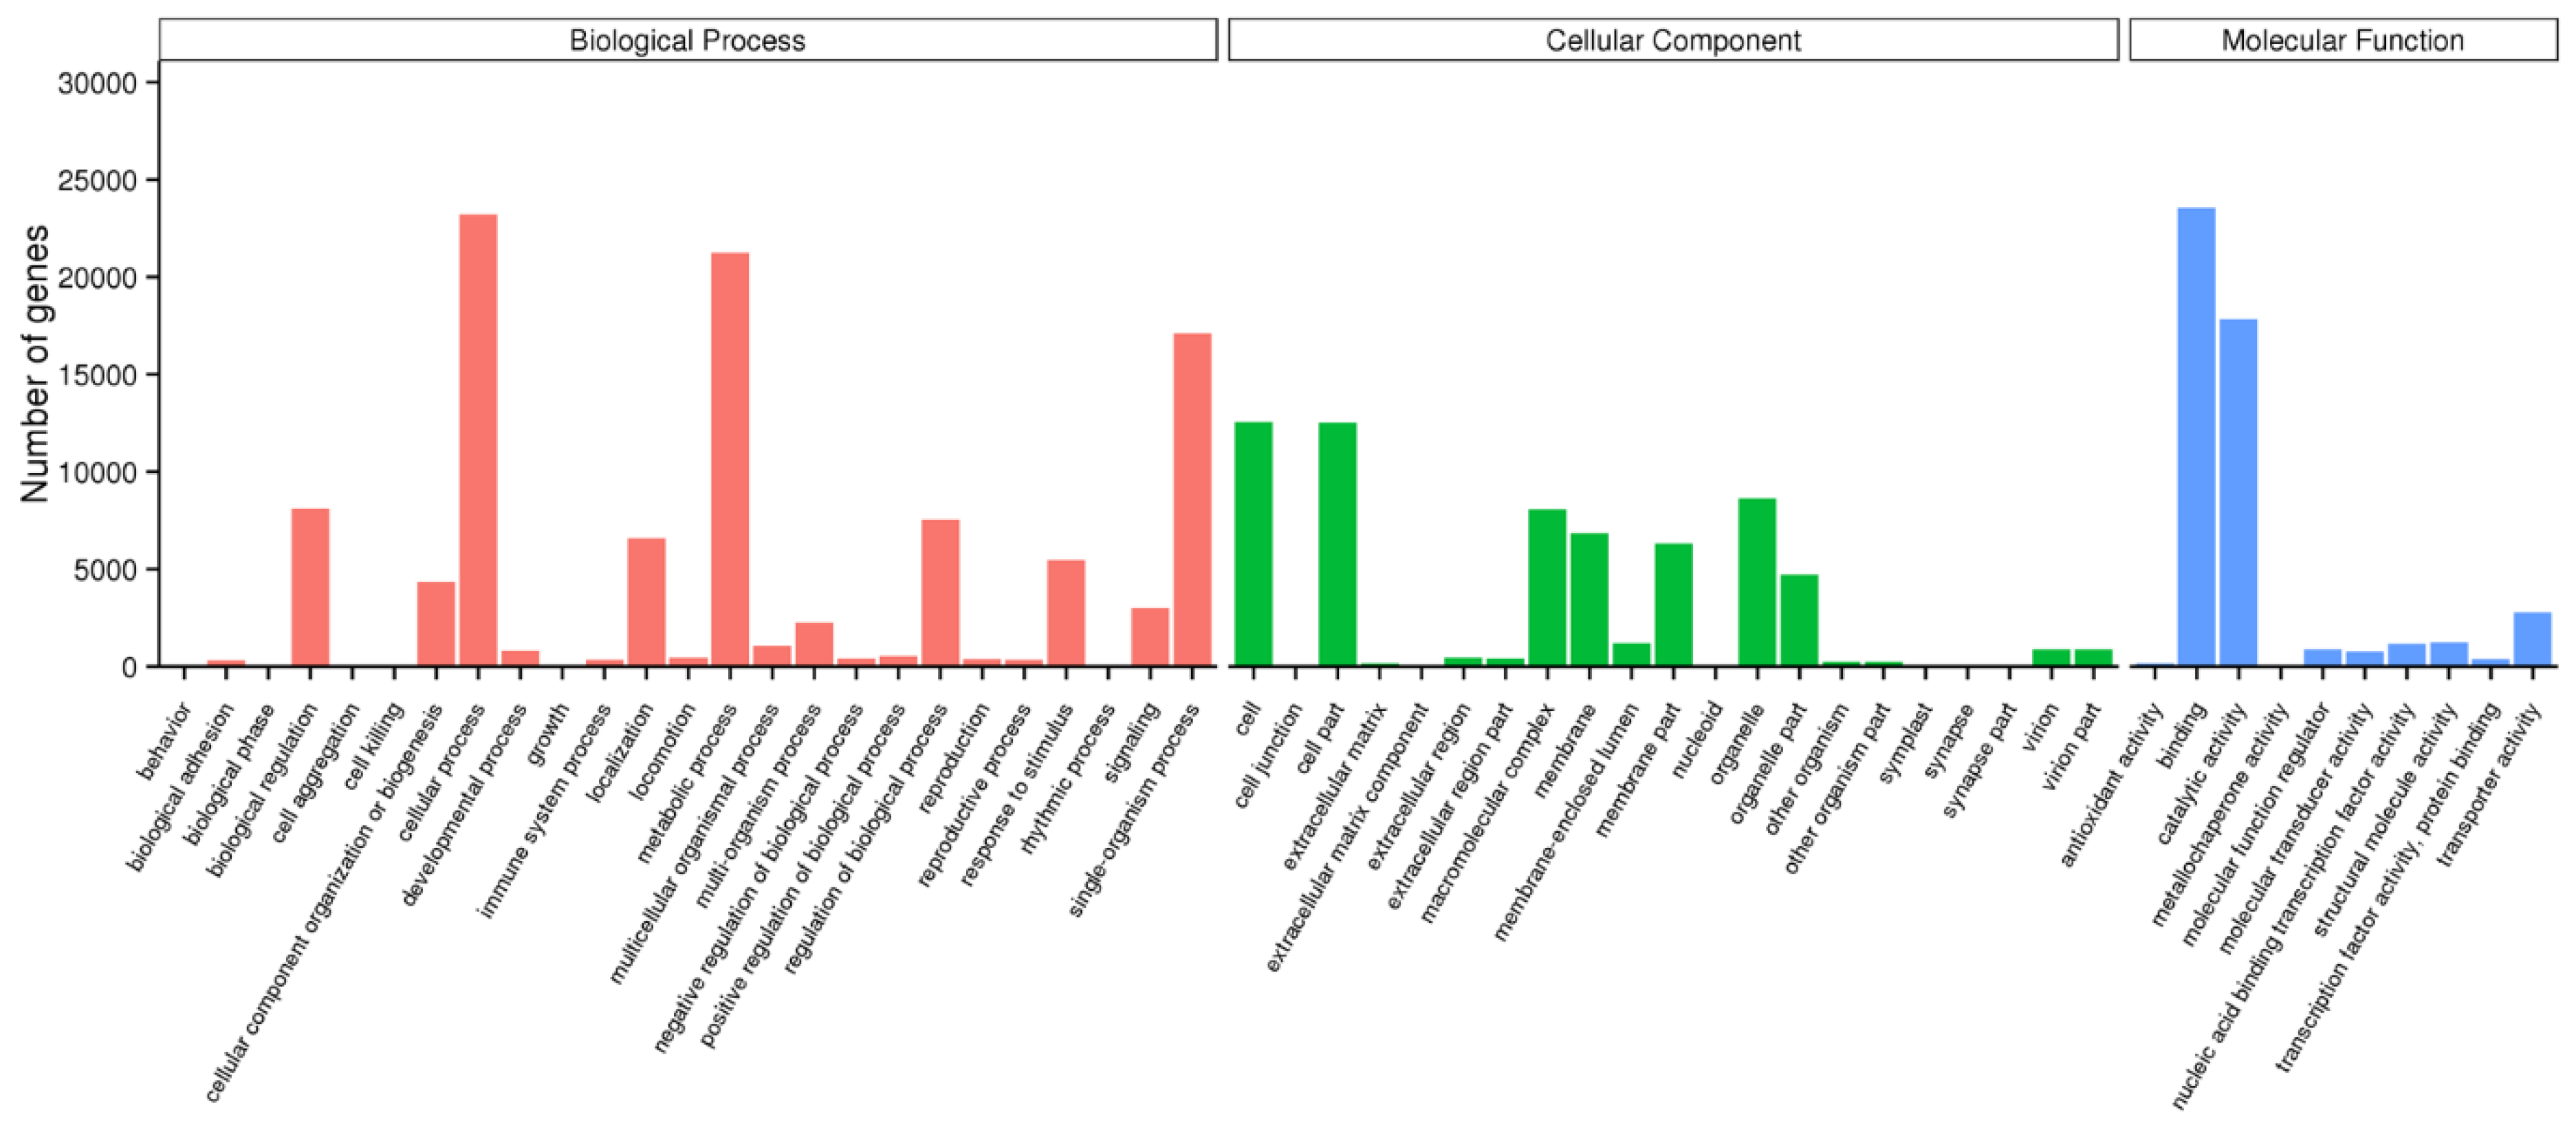
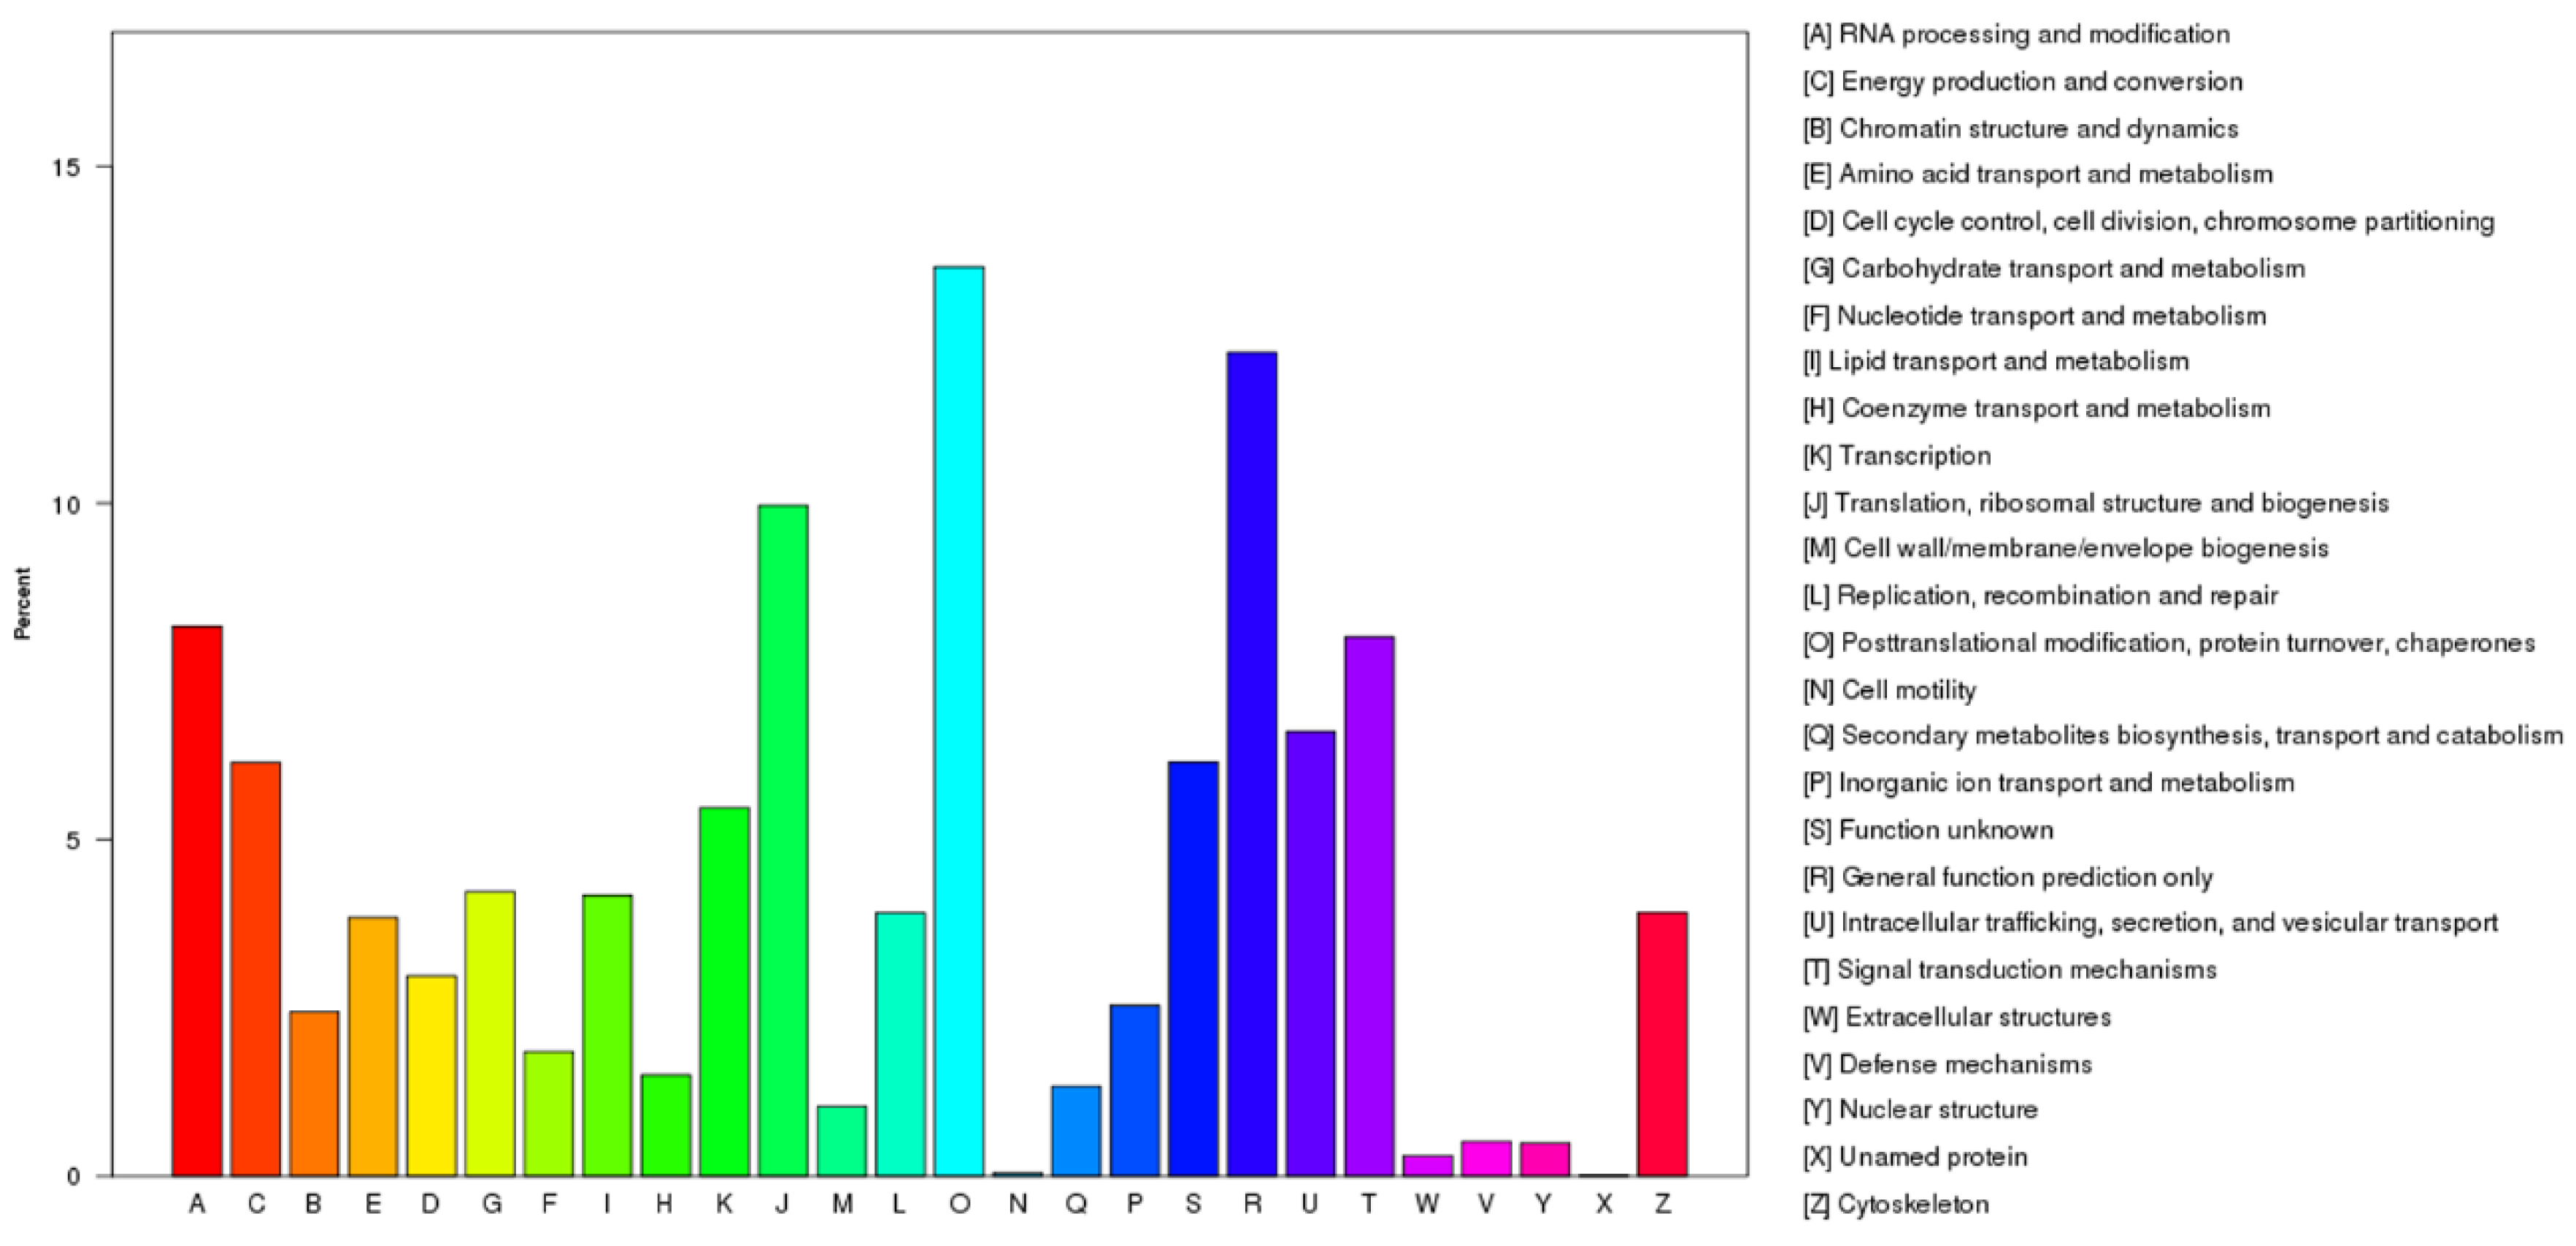
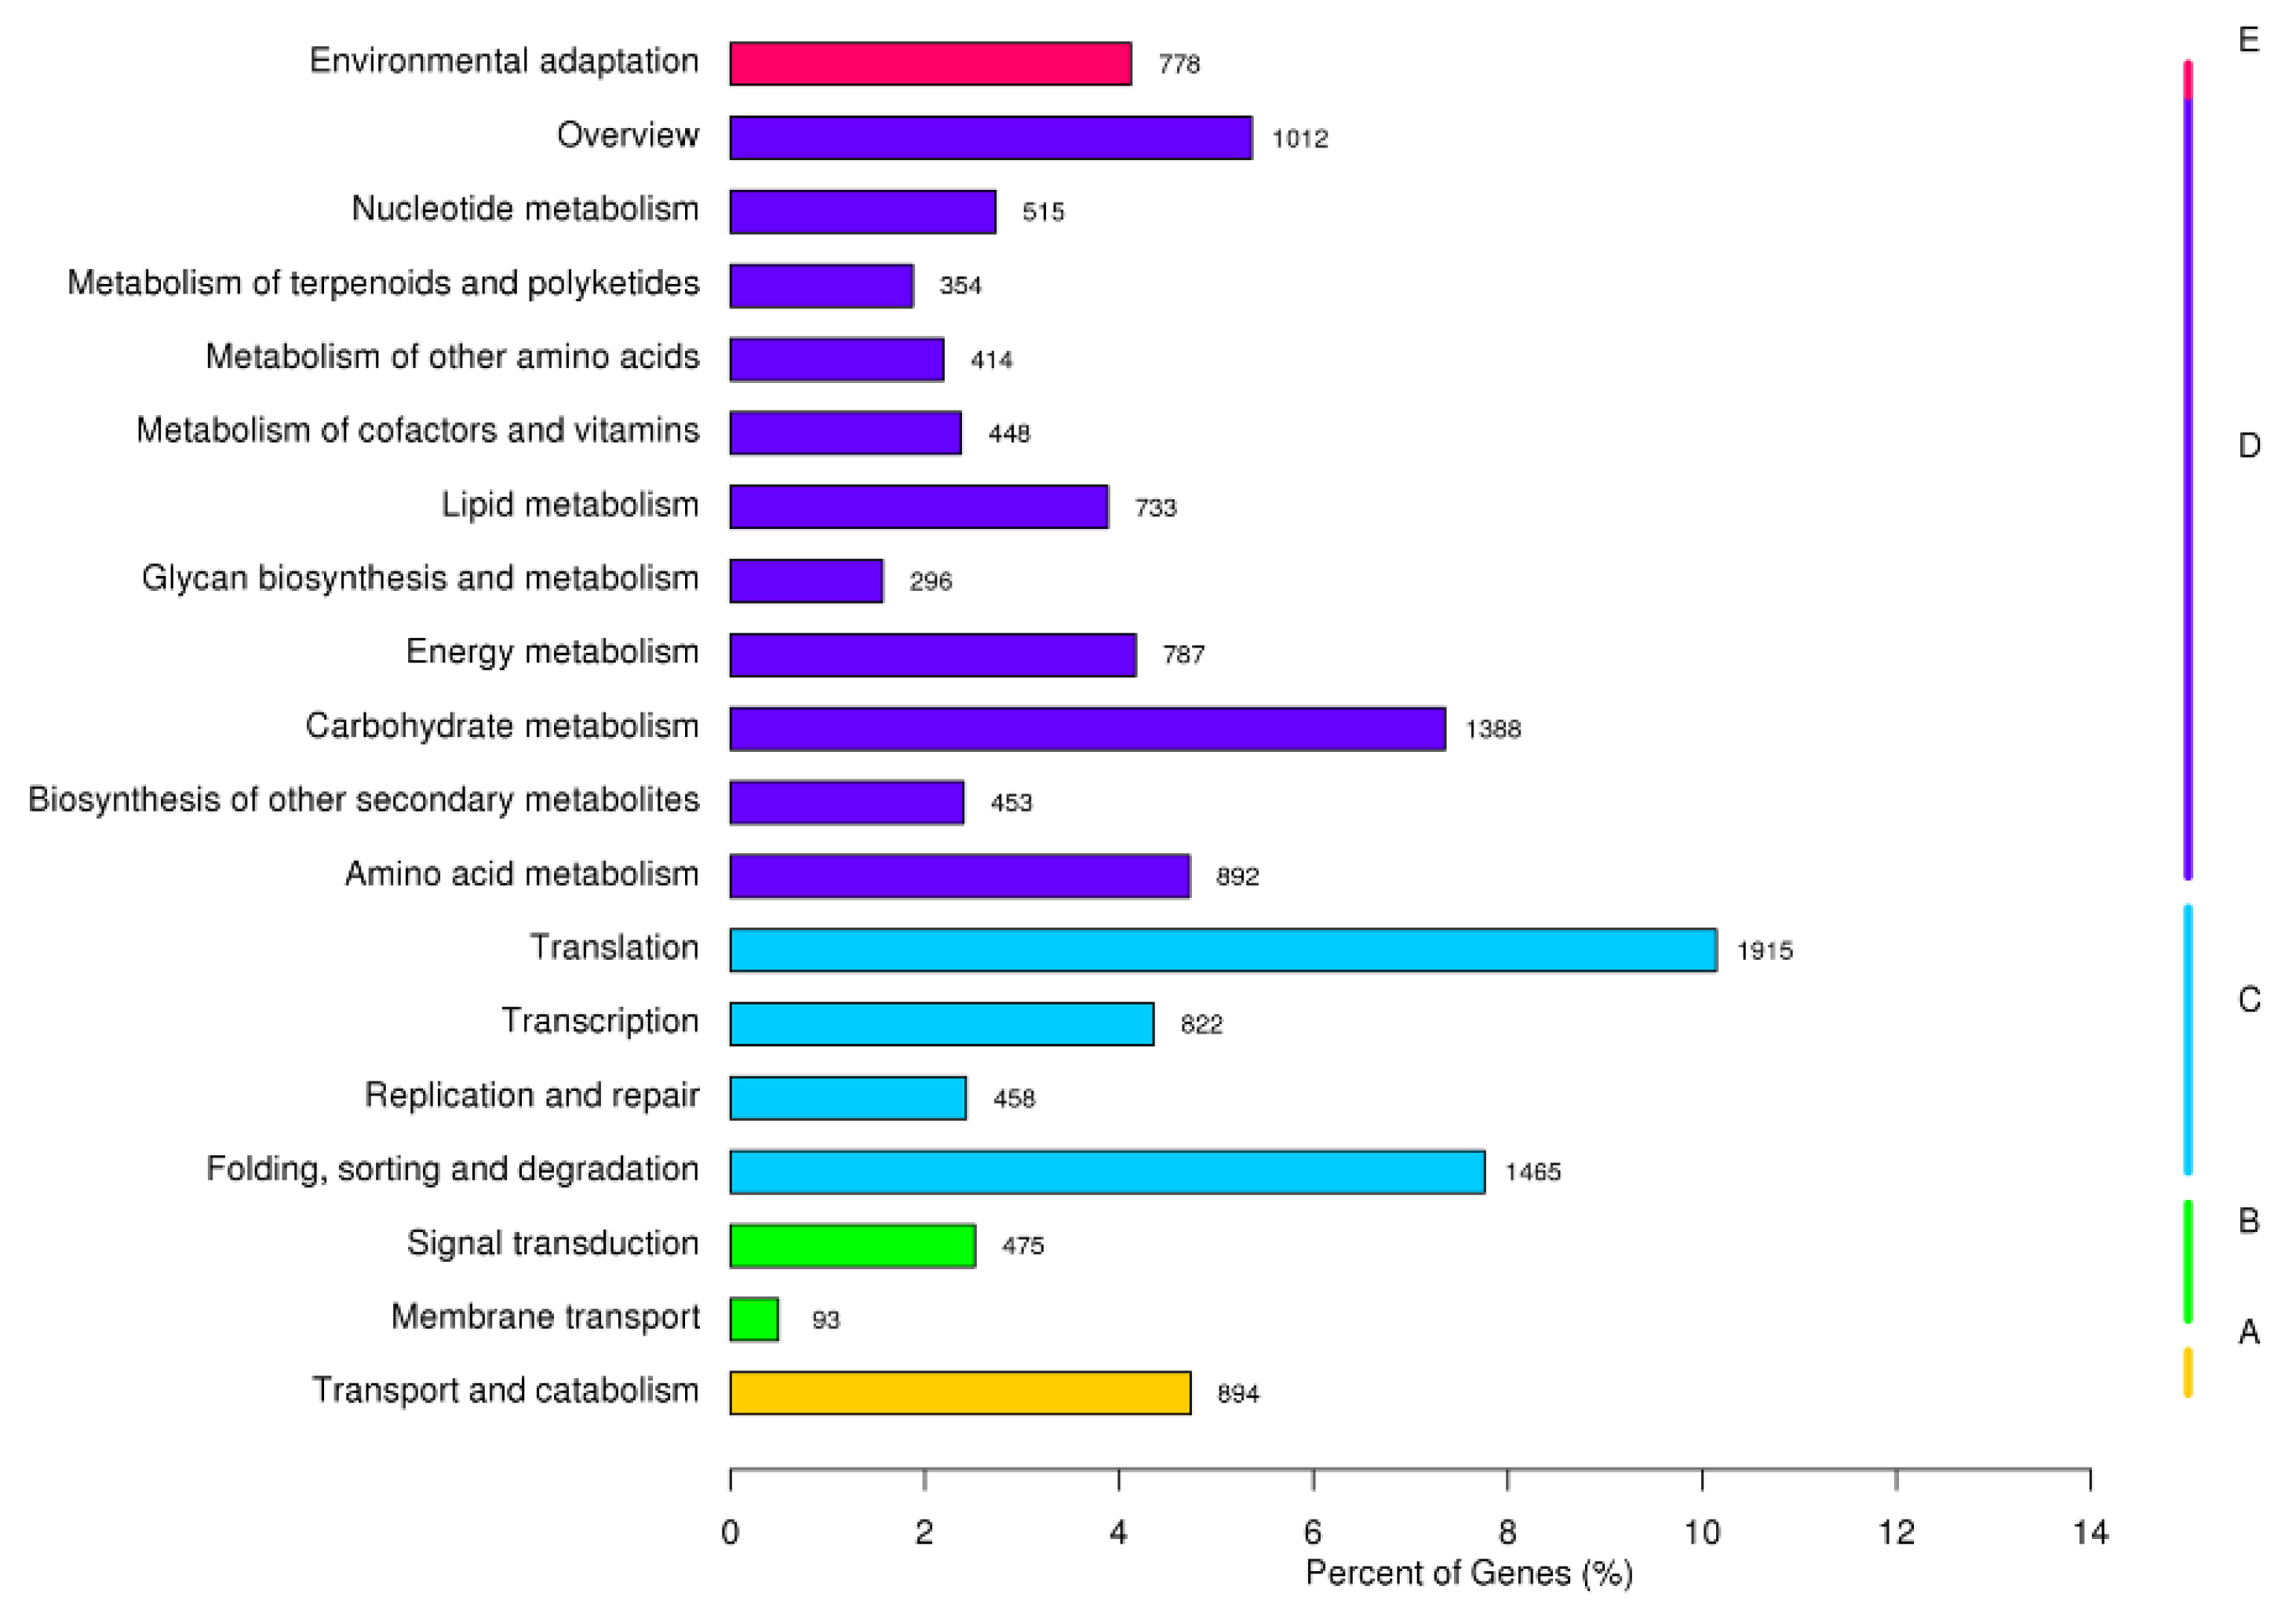
2.2. Functional Annotation and Classification of the Unigenes

Functional annotation of unigenes were performed to search for homologues against the NCBI non-redundant protein sequence database (Nr), NCBI nucleotide sequences (Nt), Pfam (Protein family), Kyoto Encyclopedia of Genes and Genomes (KEGG), swiss-prot sequence databases (SwissProt), Gene ontology (GO), and Eukaryotic Orthologous Groups (KOG) using the Basic Local Alignment Search Tool (BLAST) [18]. An e-value cut-off of 10−5 was applied to the homologue recognition. The results were shown in Table 2. 64551 (55.12%) total unigenes were annotated in at least one database and 8973 unigenes (7.66%) were annotated in all databases. 51,105 (43.64%) total unigenes were annotated in the Nr protein database.
The GO analysis indicated that a total of 41,116 unigenes were summarized into the three main GO categories (biological process, cellular component, and molecular function) and 56 sub-categories (Figure 2). In the biological process category, genes involved in cellular process, metabolic process, and single-organism process were dominant. As for the cellular component category, genes involved in cell, cell part, and organelle were highly represented. The molecular function category mainly included genes involved in binding and catalytic activity.
The KOG analysis showed that all of the 15,572 unigenes were divided into 26 different functional classes, which were represented by A to Z (Figure 3). Among the 26 categories, the largest group was ‘Post-translational modification, protein turnover, chaperon’ (2104, 13.51%) followed by ‘General function prediction’ (1906, 12.24%), ‘Translation, ribosomal structure, and biogenesis’ (1552, 9.97%), ‘RNA processing and modification’ (1272, 8.17%) and ‘Signal Transduction’ (1248, 8.01%). The smallest group was ‘Cell motility’ (7, 0.04%) and ‘Unnamed protein’ (2, 0.01%).
The KEGG pathway analysis revealed that 18876 (16.12%) of the unigenes could be mapped to the KEGG database and referred to 129 pathways (Figure 4). The pathway involved the highest number of unigenes was ‘Translation’ (1915, 10.14%), followed by ‘Folding, sorting, and degradation’ (1465, 7.76%), ‘Carbohydrate metabolism’ (1388, 7.35%) and ‘Overview’ (1012, 5.36%). These results are very important for studying the mechanism in B. halophila response to salt.

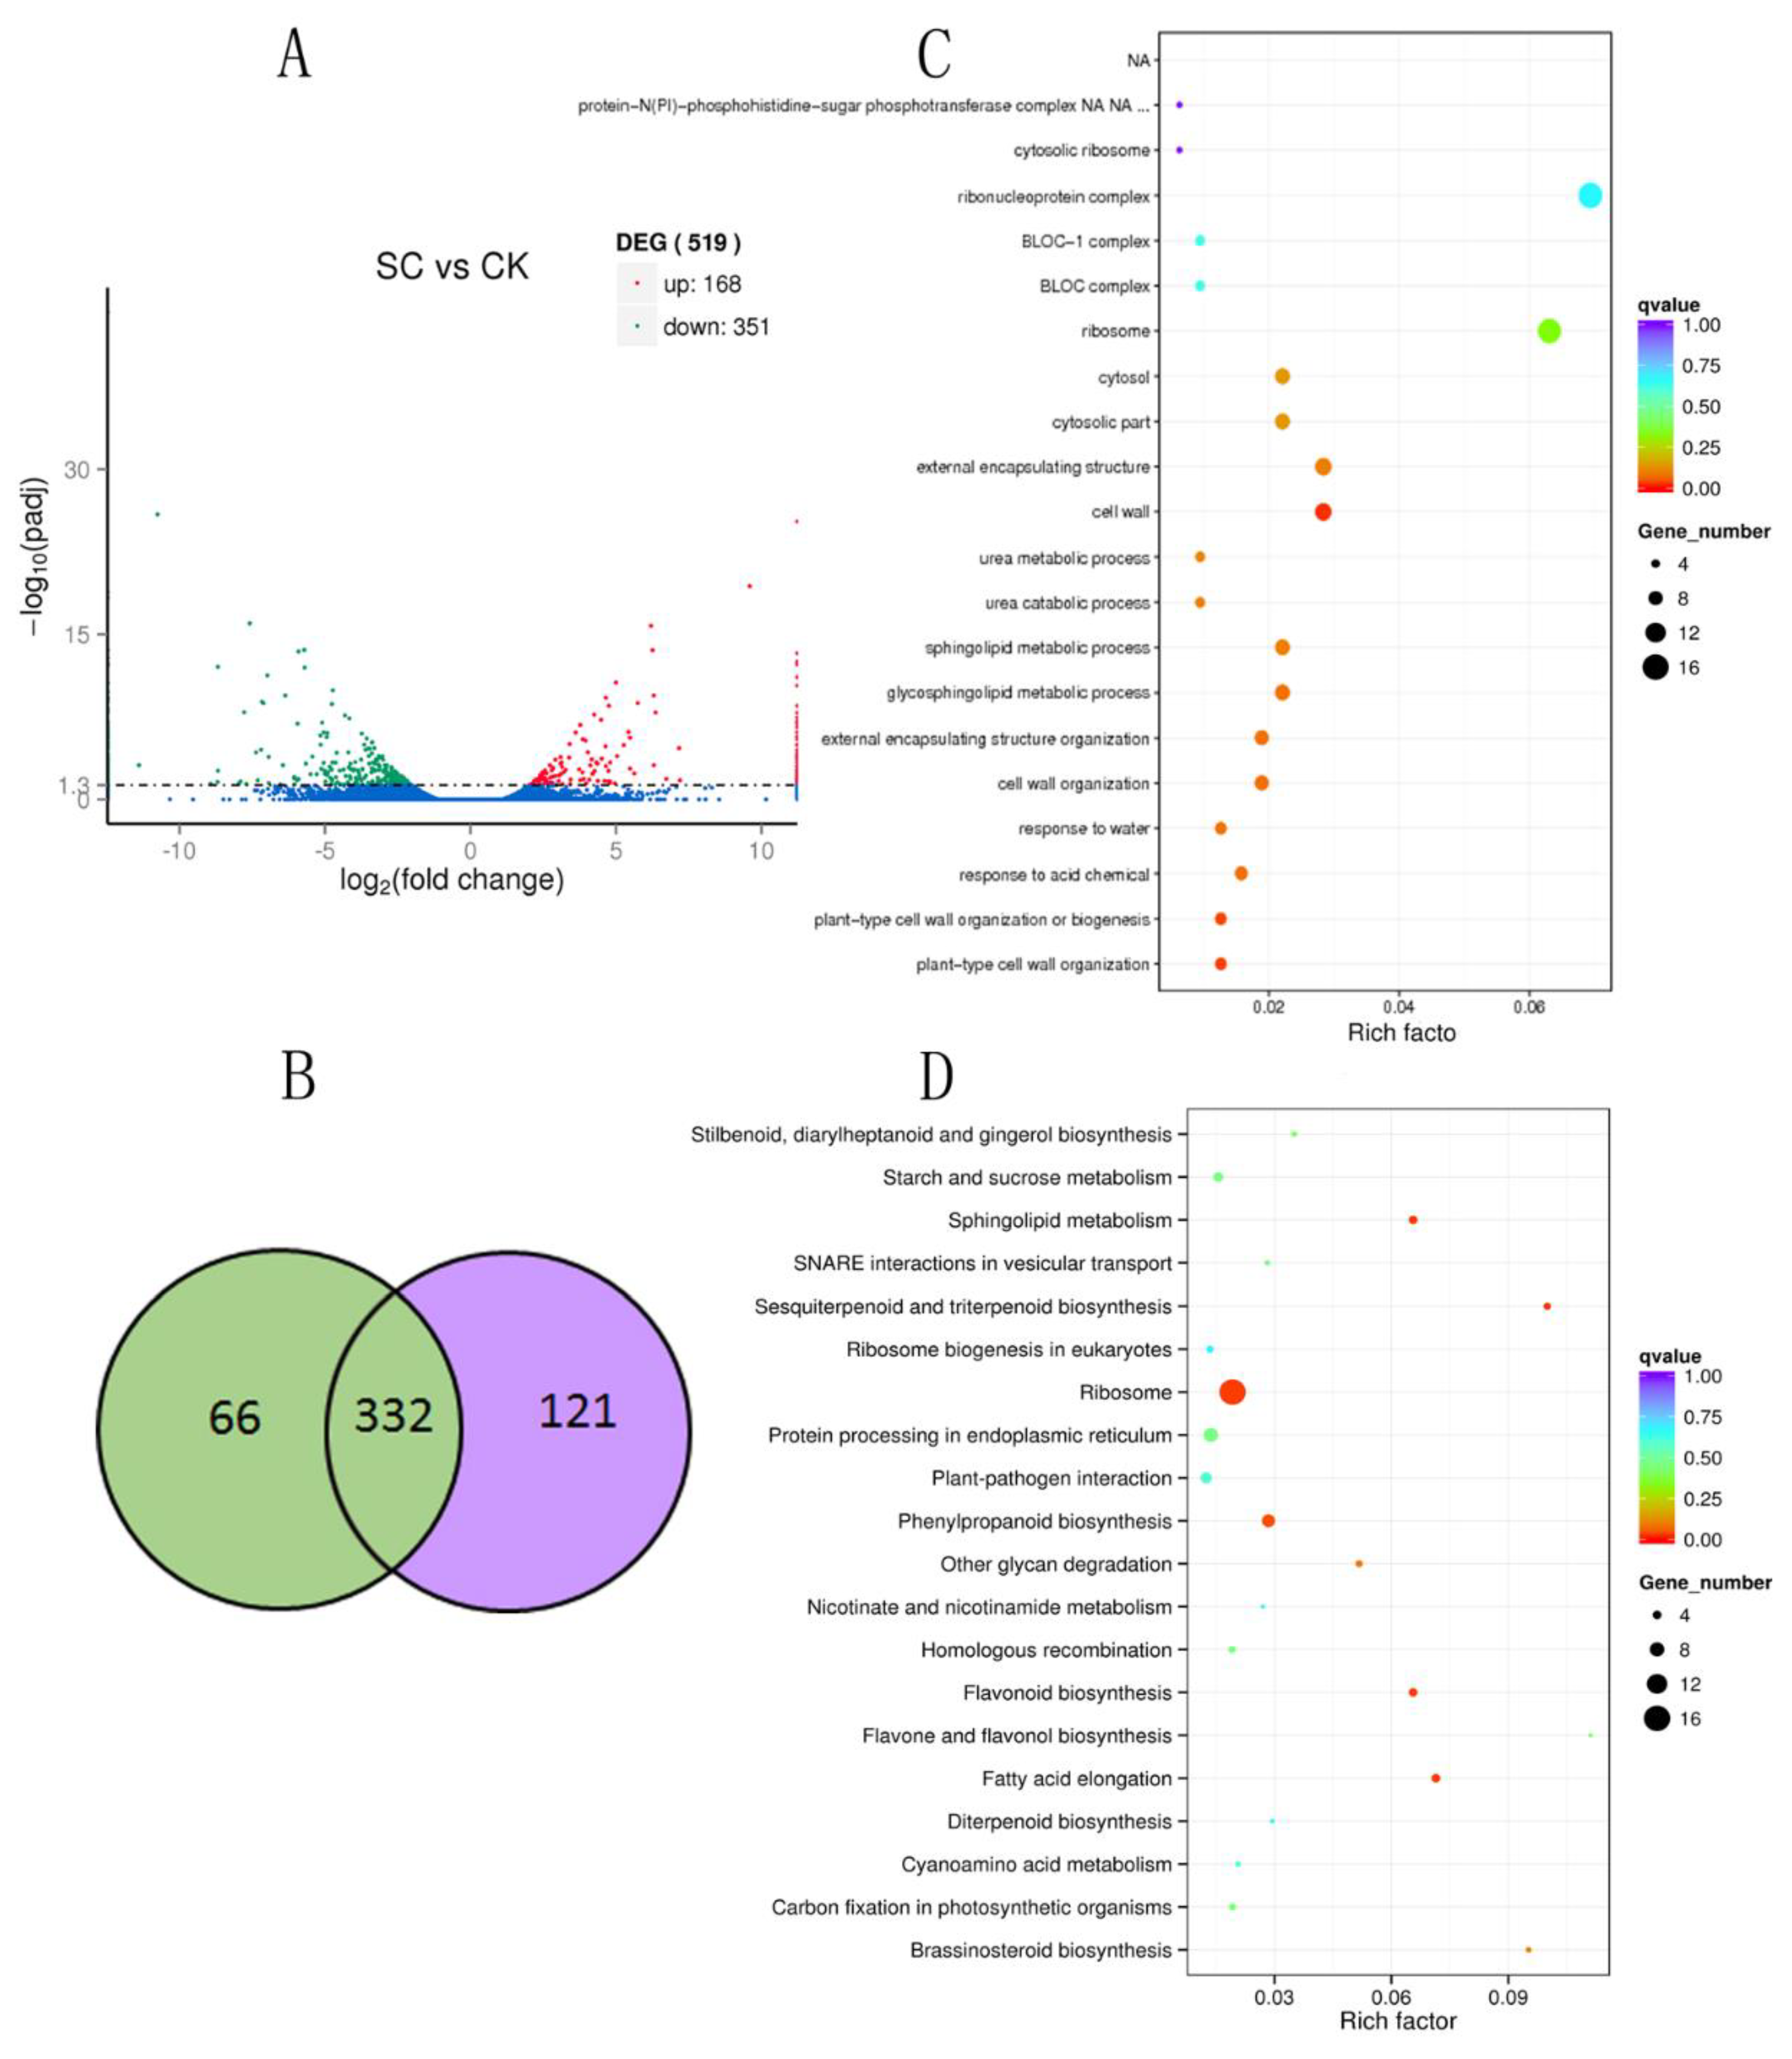
2.3. Differential Expression Genes in B. halophila Response to Salt

To obtain the differential expression genes’ response to salt in B. halophila, we compared the differentially expressed tags of two libraries. As a results, a total of 519 differentially expressed genes (DEGs) with q value < 0.05 and |log2 (fold change)| >1 were identified in the two libraries (Table S1). As shown in Figure 5a, there were more down-regulated genes (351) than up-regulated genes (168). Among these DEGs, 332 DEGs were present in both libraries, (Figure 5b). 66 DEGs were only detected in the salt stress library (Figure 5b) and 121 DEGs were only detected in the control library. In this study, the transcription factor AT-Hook Motif Nuclear Localized gene (AHL) was the most up-regulate gene in leaves after the salt stress. Conversely, a dehydrin (DHNs) was the most down-regulated gene. These results suggest that the two genes may have a high correlation with salt resistance of B. halophila. The GO and KEGG classification of the 519 DEGs were analyzed (Figure S1). GO enrichment and KEGG enrichment were performed for further analysis of the functions of 519 DEGs.

2.4. GO category Enrichment of DEGs Under Salt Stress

To characterize the function of the DEGs under salt stress, the GO category enrichment analysis was performed using Fisher’s exact test with p value ≤0.05 as the cutoff. GO category enrichment analysis for 519 DEGs under salt stress showed that these DEGs were mainly involved in a plant-type cell wall organization biological process, plant-type cell wall organization or biogenesis biological process, cell wall cellular component and structural constituent of cell wall molecular function (Figure 5c, Table S2). For the up-regulated DEGs, metalloendopeptidase activity molecular function was most highly enriched (Table S3). For down-regulated DEGs (Figure 5c), in the BP category, ‘plant-type cell wall organization biological process’, ‘plant-type cell wall organization or biogenesis biological process’, ‘cell wall organization biological process’, and ‘external encapsulating structure organization biological process’ were most highly enriched. In the CC category, ‘cell wall cellular component’, ‘cytosolic part cellular component’, ‘cytosol cellular component’, and ‘external encapsulating structure cellular component’ were the main enriched terms. In MF, the most enriched term was structural constituent of cell wall molecular function (Table S4).

2.5. KEGG Enrichment of DEGs under Salt Stress

The KEGG pathway enrichment analysis were performed to identify the candidate pathways involved in salt stress using KOBAS 2.0 [19]. The results showed that genes with KO number within 519 DEGs under salt stress were enriched in 48 KEGG pathways (Table S5). The top-four enriched pathways for DEGs in SC vs CK were ‘Fatty acid elongation’, ‘Ribosome’, ‘Sphingolipid metabolism’ and ‘Flavonoid biosynthesis’. For up-regulated DEGs (Table S6), the most highly enriched pathways were ‘Sphingolipid metabolism’, ‘Other glycan degradation’, ‘Brassinosteroid biosynthesis’ and ‘Citrate cycle (TCA cycle)’ (Figure 5d). For down-regulated DEGs (Table S7), ‘Ribosome’, ‘Fatty acid elongation’, ‘Flavonoid biosynthesis’ and ‘Phenylpropanoid biosynthesis’ were the top-four enriched pathways (Figure 5d).

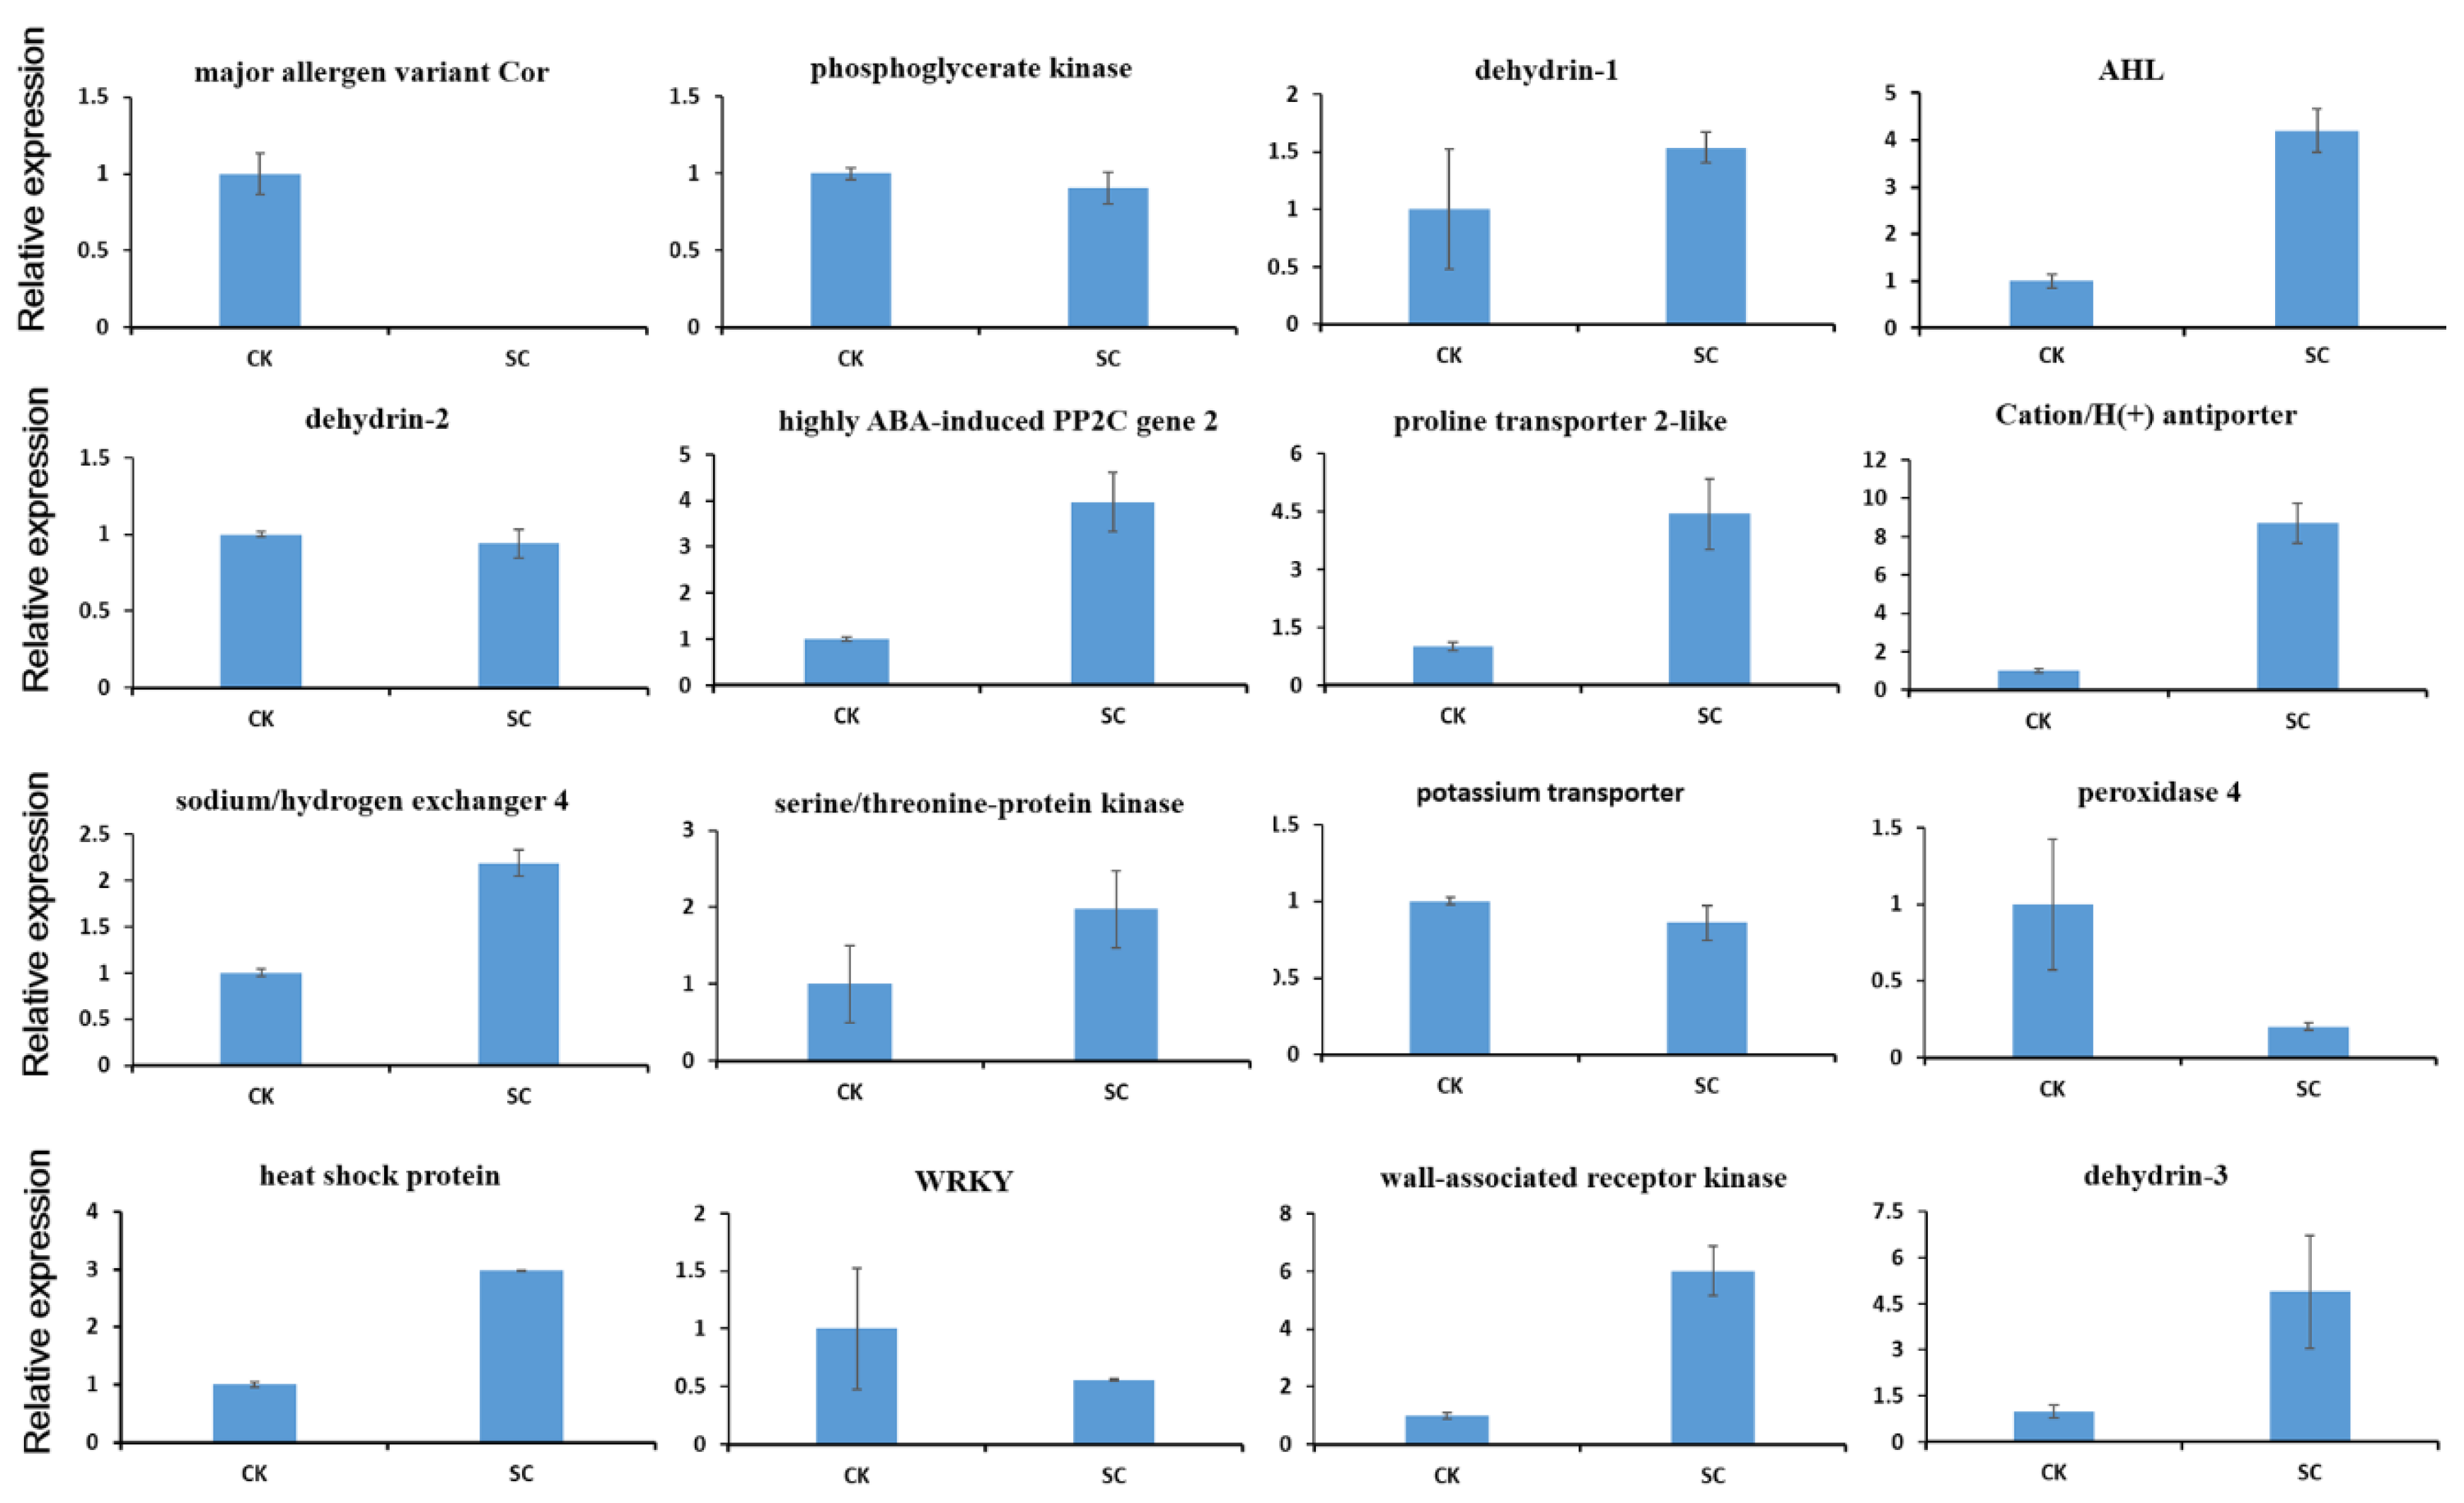
2.6. qRT-PCR Analysis

In order to validate the RNA-seq data and confirm the differential expression genes, we performed qRT-PCR on sixteen candidate DEGs associated with salt stress. The results revealed that these DEGs include AHL, dehydrin-1, highly ABA-induced PP2C gene, proline transporter 2-like, sodium/hydrogen exchanger 4, serine/threonine-protein kinase, heat shock protein, Cation/H(+) antiporter, wall-associated receptor kinase-like and dehydrin-3 were up-regulated in the leaves with salt treatment (Figure 6), whereas major allergen variant Cor, dehydrin-2, phosphoglycerate kinase, potassium transporter, peroxidase 4 and WRKY transcription factor were down- regulated in the leaves with salt treatment. The results indicated that these sixteen candidate DEGs had the same expression patterns compared with the sequencing data, suggesting the reliability of the RNA-seq data.

3. Discussion

B. halophila is a plant with high salt tolerance, so it is important to discover the salt tolerant genes of B. halophila for breeding salinity resistant varieties of trees. However, to our best knowledge, there is no report about genes associated with salt tolerance in B. halophila. In this study, we analyzed the transcriptomic data from the leaves of wild type B. halophila plants and plants with salt treatment. As a result, approximately 460 M raw reads were generated and were further assembled into 117,091 unigenes, among these unigenes, 64551 unigenes (55%) were annotated with gene descriptions, while the other 45% were unknown. This is the first report of transcriptome data from B. halophila. This transcriptome data provides an important genus resource for insight into the molecular mechanism of salt tolerance and facilitates discovery of novel genes responsive to salt stress in B. halophila.
In plants, salt stress responsive mechanisms are very complicated, which involve a complex interaction of physiological processes, metabolic pathways, and regulation at the molecular and cellular levels. Although plant response to salt stress has been extensively studied at different levels, the mechanisms underlying salinity tolerance are far from being completely understood. In addition, salt stress responsive mechanisms in different plants are also different. At present, the main mechanisms for which plants respond to salt stress include ion homeostasis and compartmentalization, ion transport and uptake, biosynthesis of osmoprotectants and compatible solutes, activation of antioxidant enzyme, and synthesis of antioxidant compounds [4,5,6,7,11]. In this study, 168 up-regulated genes and 351 down-regulated genes were identified in B. halophila under salt stress, respectively. These DEGs include dehydrin proteins, sodium/hydrogen exchanger, potassium transporter, sarcoplasmic/endoplasmic reticulum calcium ATPase, Ca2+ antiporter/cation exchanger, Nodulin MtN21/EamA-like transporter, heat shock protein, phosphoenolpyruvatecarboxykinase, NADH dehydrogenase, highly ABA-induced PP2C gene, homeobox-leucine zipper protein, phosphoglycerate kinase, WRKY transcription factor, AP2/ERF and B3 domain-containing transcription factor, flavonoid 3′,5′-hydroxylase, which is consistent with the other plants that are reported to be responsive to salt stress [20,21,22,23,24].
The analysis of GO enrichments suggested that the 519 DEGs response to salt stress was mainly involved in plant-type cell wall organization biological process, plant-type cell wall organization or biogenesis biological process, cell wall cellular component and structural constituent of cell wall molecular function. KEGG pathway enrichment results showed that the top-four enriched pathways for DEGs was ‘Fatty acid elongation’, ‘Ribosome’, ‘Sphingolipid metabolism’, and ‘Flavonoid biosynthesis’. The expression patterns of sixteen of these DEGs were analyzed by qRT-PCR to verify the RNA-seq results. It revealed that the qRT-PCR results were consistent with RNA-seq data.
Based on the functional annotations of the 519 DEGs and the physiological evidence of B. halophila in response to salt stress [25], the possible mechanism of salt tolerance in the leaves of B. halophila was summarized in Figure 7. The possible salt tolerance mechanism is coordinately linked with ion homeostasis, osmotic protection, antioxidant regulation, ABA signal pathway, transcription factors and chaperons. When the plant is treatment with 200mM NaCl, multiple signal pathways are activated to cope with salt stress such as the SOS pathway, antioxidant pathway and ABA signal pathway and so on. Meanwhile, the osmoprotectants such as proline and polyols were accumulated to protect the cell. In addition, the transcription factors (WRKY, ERF, ZIP and AHL) and (LEAs, HSPs and AQPs) were activated to regulate the genes involved in the above pathways [2,3,4,5,6]. Overall, the salt tolerance mechanism in B. halophila is a complex network that involved the interactions at multiple levels. This information will be useful in elucidating the salt tolerance mechanisms in B. halophila.
In the present study, we observed that one dehydrin (DHNs) which is the most down-regulated gene among these DEGs and two other dehydrins showed a distinct salt responsive expression, suggesting that these dehydrin proteins may play different roles in response to salt stress in B. halophila. Dehydrins, also known as group 2 LEA (Late Embryogenesis Abundant) proteins, play a fundamental role in plant response to abiotic stresses [26,27,28]. Their expression is often induced under salinity, dehydration, cold and frost stress. Dehydrins are divided into five structural subgroups: Kn, SKn, KnS, YxKn and YxSKn [28]. The three dehydrins protein features of B. halophila were all SK3 subclass. It has been shown that SK3 dehydrins play an important protective role in plant stress tolerance, including drought, cold, and salinity [27]. For example, the expression of the durum wheat DHN-5 in A. thaliana led to an increase in salt and osmotic stress tolerance [28]. Rab16A in salt-tolerant Indica rice variety Pokkali can enhance tolerance to drought and salt stress in tobacco plants [29]. Similarly, overexpression of the wheat dehydrin PMA80 (as well as the LEAI protein PMA1959) enhances rice tolerance to drought and salt stress [30]. Although experimental evidence suggests that dehydrins have diverse roles (membrane protection, cryoprotection of enzymes, and protection from reactive oxygen species) in response to stresses [27,28,29,30,31], further efforts are still needed to precisely confirm the roles of these dehydrins and explore the regulatory mechanism underlying these functions in plant adaptive response to abiotic stresses.
In addition, our results indicated that the transcription factor AT-Hook Motif Nuclear Localized gene (AHL) was the most up-regulated gene in leaves after salt stress, implying that it might play an important role in response to salt stress in B. halophila. Previous studies showed that the AHL genes regulate diverse aspects of growth and development in plants. Such as the homeostasis of phytohormones [32], and defense responses [33,34,35,36,37,38,39,40]. However, there is no report about the function of AHL genes associated with salt stress. Further studies are still needed to understand the function of AHL genes in salt stress.
Therefore, our results provide a list of candidate genes for further investigation to determine whether they have a role in allowing B. halophila to tolerate high salt levels, and may be helpful in the understanding of the molecular mechanisms of salt stress response in B. halophila.

4. Materials and Methods

4.1. Plant Materials

The seeds of B. halophila were obtained from Xinjiang Academy of Forestry. After germination, the seedlings of B. halophila were grown in the greenhouse in Chinese Academy of Forestry. Leaves were collected from eight-months-old plants, the fourth or fifth leaf from top to bottom was used for sampling and RNA extraction. Three independent biological replicates were performed for each experiment. All samples were frozen and stored in liquid nitrogen until use.

4.2. Salt stress Treatment

Based on Betula halophila physiological response to salt stress as described by Zhang et al. [25], plantlets were treated with 200 mM of NaCl for 24h and then leaves were collected from stressed plants, plantlets treated with water were used as controls. Three independent biological replicates were performed for each experiment. All samples were frozen and stored in liquid nitrogen until use.

4.3. Library Construction and Sequencing for RNA-seq

In order to construct cDNA libraries, total RNAs were extracted from the control and the NaCl treated plant using Trizol RNA extraction kit (Life Technology, Beijing, China) according to the manufacturer’s instruction. Six samples were sequenced by Novogene (Tianjin, China) using Illumina HiSeq2500 system.

4.4. Transcriptome Assembly and Bioinformatics Analysis

Transcriptome assembly was accomplished based on the left.fq and right.fq using Trinity [17] with min_kmer_cov set to 2 by default and all other parameters set default. In brief, the left files (read1 files) from all libraries/samples were pooled into one big left.fq file, and right files (read2 files) into one big right.fq file. Gene function was annotated based on Nr (NCBI non-redundant protein sequences), Nt (NCBI non-redundant nucleotide sequences), Pfam (Protein family), KOG/COG (Clusters of Orthologous Groups of proteins), Swiss-Prot (A manually annotated and reviewed protein sequence database), KO (KEGG Ortholog database), GO (Gene Ontology) databases. Gene expression levels were estimated by RSEM [41] for each sample. Clean data were mapped back onto the assembled transcriptome. Read counts for each gene were obtained from the mapping results. For differential expression analysis, prior to differential gene expression analysis, for each sequenced library, the read counts were adjusted by edgeR program package [42] through one scaling normalized factor. Differential expression analysis of six samples was performed using the DEGseq R package [43].
All transcripts were searched against the latest versions (as of August 2018) of Nr (nonredundant) database (http://www.ncbi.nlm.nih.gov/) and the Swiss-Prot database (http://www.gpmaw.com/html/swiss-prot. html) using the BLAST program with an e < 10−5. The transcripts with the top hits were selected as unigenes. Open reading frames (ORFs) were predicted using the GetORF program contained in the EMBOSS software package. The Blast2GO program was used for GO annotation (http://www.geneontology.org), and the unigenes were aligned to the eggNOG (evolutionary genealogy of genes: non-supervised orthologous groups) database (http://www.ncbi.nlm.nih.gov/COG/) to identify functional categories. The KEGG database (http://www.genome.jp/kegg/) was used for pathway annotation. All searches were conducted using an e-value cut-off of 10−5. GO terms were downloaded from the GO Analysis Toolkit and Database for Agriculture Community (AGRI go, http://bioinfo.cau.edu.cn/agriGO/download.php). All the genes identified with significant differential expression (p < 0.05) and FC >2 in this study were used as inputs to carry out GO enrichment analysis. Gene Ontology (GO) enrichment analysis of the differentially expressed genes (DEGs) was implemented by the GOseq R packages based Wallenius non-central hyper-geometric distribution [44] that can adjust for gene length bias in DEGs. KEGG pathway enrichment analysis used KOBAS [19] software to test the statistical enrichment of the differential expression genes in the KEGG pathways. In the scatterplot, the rich factor is the ratio of the differentially expressed gene number to the total gene number in a certain pathway.

4.5. Quantitative RT-PCR

The candidate DEGs in response to salt stress were selected to validate the reliability of the RNA-seq data using quantitative RT-PCR following the previously reported procedures [45,46]. Gene-specific primers were listed in Table S8. BhActin was used as a reference gene. Three independent biological replicates were performed. The results from gene-specific amplification were analyzed using the comparative Cq method, which uses an arithmetic formula, 2−ΔΔCq, to achieve results for relative quantification [47]. Cq represents the threshold cycle.

5. Conclusions

We sequenced and comparatively analyzed the transcriptomes from the leaves of wild type B. halophila plants and plants with salt treatment. This work enabled us to characterize gene expression profiles and identify functional genes related to salt tolerance. A total of 519 genes were differentially expressed under salt stress. These DEGs appear to be involved in many aspects, such as the SOS pathway, ion transport and uptake, antioxidant enzyme, ABA signal pathway and so on. It has been shown that one gene encoding the AT-Hook Motif Nuclear Localized transcription factor and three genes encoding dehydrins, might play important roles in response to salt stress in B. halophila. The results provide good candidate genes to breed salt tolerant plants, and will be helpful in understanding of the molecular mechanisms of salt stress in B. halophila.

Supplementary Materials

Supplementary materials can be found at https://www.mdpi.com/1422-0067/19/11/3412/s1. The sequencing data have been submitted to the SRA database under the accession number SRP146369.

Author Contributions

F.S. analyzed the data. F.S. and I.W.W. wrote the manuscript. L.Z. performed qRT-PCR. F.S. and D.Q. designed the experiment. All authors have read and approved the version of manuscript.

Funding

This work was supported by the National Key R & D Program of China (grant number 2016YFC0503103).

Conflicts of Interest

The authors declare that they have no competing interests.

Abbreviations

AHLAT-Hook Motif Nuclear Localized gene
BLASTthe Basic Local Alignment Search Tool
DEGsdifferentially expressed genes
DHNsdehydrins
GOGene ontology
KEGGKyoto Encyclopedia of Genes and Genomes
KOGEukaryotic Orthologous Groups
LEALate Embryogenesis Abundant
NrNCBI non-redundant protein sequence database
NtNCBI nucleotide sequences
ORFsOpen reading frames
PfamProtein family
SOSSalt Overly Sensitive
SwissProtSwiss-prot sequence data bases

References

  1. Flowers, T.J. Improving crop salt tolerance. J. Exp. Bot. 2004, 55, 307–319. [Google Scholar] [CrossRef] [PubMed] [Green Version]
  2. Munns, R.; Tester, M. Mechanisms of salinity tolerance. Annu. Rev. Plant Biol. 2008, 59, 651–681. [Google Scholar] [CrossRef] [PubMed]
  3. Wang, M.C.; Peng, Z.Y.; Li, C.L.; Li, F.; Liu, C.; Xia, G.M. Proteomic analysis on a high salt tolerance introgression strain of Triticumaestivum/Thinopyrumponticum. Proteomics 2008, 8, 1470–1489. [Google Scholar] [CrossRef] [PubMed]
  4. Roy, S.; Chakraborty, U. Salt tolerance mechanisms in Salt Tolerant Grasses (STGs) and their prospects in cereal crop improvement. Bot. Stud. 2014, 55, 31. [Google Scholar] [CrossRef] [PubMed] [Green Version]
  5. Gupta, B.; Huang, B. Mechanism of Salinity Tolerance in Plants: Physiological, Biochemical, and Molecular Characterization. Int. J. Genom. 2014, 2014, 701596. [Google Scholar] [CrossRef] [PubMed]
  6. Ji, H.; Pardo, J.M.; Batelli, G.; Van Oosten, M.J.; Bressan, R.A.; Li, X. The Salt Overly Sensitive (SOS) pathway: Established and emerging roles. Mol. Plant 2013, 6, 275–286. [Google Scholar] [CrossRef] [PubMed]
  7. Barragán, V.; Leidi, E.O.; Andrés, Z.; Rubio, L.; De Luca, A.; Fernández, J.A.; Cubero, B.; Pardo, J.M. Ion exchangers NHX1 and NHX2 mediate active potassium uptake into vacuoles to regulate cell turgor and stomatal function in Arabidopsis. Plant Cell 2012, 24, 1127–1142. [Google Scholar] [CrossRef] [PubMed] [Green Version]
  8. Dugasa, M.T.; Cao, F.; Ibrahim, W.; Wu, F. Genotypic difference in physiological and biochemical characteristics in response to single and combined stresses of drought and salinity between the two wheat genotypes (Triticumaestivum) differing in salt tolerance. Physiol. Plant 2018. [Google Scholar] [CrossRef] [PubMed]
  9. James, R.A.; Blake, C.; Byrt, C.S.; Munns, R. Major genes for Na+ exclusion, Nax1 and Nax2 (wheatHKT1;4 and HKT1;5), decrease Na+ accumulation in bread wheat leaves under saline and waterlogged conditions. J. Exp. Bot. 2011, 62, 2939–2947. [Google Scholar] [CrossRef] [PubMed]
  10. Xue, H.W.; Chen, X.; Mei, Y. Function and regulation of phospholipid signalling in plants. Biochem. J. 2009, 421, 145–156. [Google Scholar] [CrossRef] [PubMed] [Green Version]
  11. Apel, K.; Hirt, H. Reactive oxygen species: Metabolism, oxidative stress, and signal transduction. Annu. Rev. Plant Biol. 2004, 55, 373–399. [Google Scholar] [CrossRef] [PubMed]
  12. Wang, X.C.; Zhao, Q.Y.; Ma, C.L.; Zhang, Z.H.; Cao, H.L.; Kong, Y.M.; Yue, C.; Hao, X.Y.; Chen, L.; Ma, J.Q.; et al. Global transcriptome profiles of Camellia sinensis during cold acclimation. BMC Genom. 2013, 14, 415. [Google Scholar] [CrossRef] [PubMed]
  13. Zhang, Q.; Cai, M.; Yu, X.; Wang, L.; Guo, C.; Ming, R.; Zhang, J. Transcriptome dynamics of Camellia sinensis in response to continuous salinity and drought stress. Tree Genet. Genomes 2017, 13, 78. [Google Scholar] [CrossRef]
  14. Zeng, A.; Chen, P.; Korth, K.L.; Ping, J.; Thomas, J.; Wu, C.; Srivastava, S.; Pereira, A.; Hancock, F.; Brye, K.; et al. RNA sequencing analysis of salt tolerance in soybean (Glycine max). Genomics 2018. [Google Scholar] [CrossRef] [PubMed]
  15. Yu, J.; Chen, S.; Zhao, Q.; Wang, T.; Yang, C.; Diaz, C.; Sun, G.; Dai, S. Physiological and Proteomic Analysis of Salinity Tolerance in Puccinelliatenuiflora. J. Proteome Res. 2011, 10, 3852–3870. [Google Scholar] [CrossRef] [PubMed]
  16. Wei, G.S.; Jian, D.Y.; Fu, C.Z.; Yu, F.Z.; Xue, W.D. Research on introduction and salt tolerance of Betulahalophila. J. Gansu Agric. Univ. 2011, 5, 101–105. [Google Scholar]
  17. Grabherr, M.G.; Haas, B.J.; Yassour, M.; Levin, J.Z.; Thompson, D.A.; Amit, I.; Adiconis, X.; Fan, L.; Raychowdhury, R.; Zeng, Q.; et al. Full-length transcriptome assembly from RNA-Seq data without a reference genome. Nat. Biotechnol. 2011, 29, 644–652. [Google Scholar] [CrossRef] [PubMed] [Green Version]
  18. Altschul, S.F.; Madden, T.L.; Schäffer, A.A.; Zhang, J.; Zhang, Z.; Miller, W.; Lipman, D.J. Gapped BLAST and PSI-BLAST: A new generation of protein database search programs. Nucleic Acids Res. 1997, 25, 3389–3402. [Google Scholar] [CrossRef] [PubMed]
  19. Xie, C.; Mao, X.; Huang, J.; Ding, Y.; Wu, J.; Dong, S.; Kong, L.; Gao, G.; Li, C.Y.; Wei, L. KOBAS 2.0: A web server for annotation and identification of enriched pathways and diseases. Nucleic Acids Res. 2011, 39, W316–W322. [Google Scholar] [CrossRef] [PubMed]
  20. Zhang, J.; Feng, J.; Lu, J.; Yang, Y.; Zhang, X.; Wan, D.; Liu, J. Transcriptome differences between two sister desert poplar species under salt stress. BMC Genom. 2014, 15, 337. [Google Scholar] [CrossRef] [PubMed]
  21. Zhou, Y.; Yang, P.; Cui, F.; Zhang, F.; Luo, X.; Xie, J. Transcriptome Analysis of Salt Stress Responsiveness in the Seedlings of Dongxiang Wild Rice (OryzarufipogonGriff.). PLoS ONE 2016, 11, e0146242. [Google Scholar] [CrossRef]
  22. Wang, W.S.; Zhao, X.Q.; Li, M.; Huang, L.Y.; Xu, J.L.; Zhang, F.; Cui, Y.R.; Fu, B.Y.; Li, Z.K. Complex molecular mechanisms underlying seedling salt tolerance in rice revealed by comparative transcriptome and metabolomic profiling. J. Exp. Bot. 2016, 67, 405–419. [Google Scholar] [CrossRef] [PubMed]
  23. Villarino, G.H.; Hu, Q.; Scanlon, M.J.; Mueller, L.; Bombarely, A.; Mattson, N.S. Dissecting Tissue-Specific Transcriptomic Responses from Leaf and Roots under Salt Stress in Petunia hybrida Mitchell. Genes 2017, 8, 195. [Google Scholar] [CrossRef] [PubMed]
  24. Villarino, G.H.; Bombarely, A.; Giovannoni, J.J.; Scanlon, M.J.; Mattson, N.S. Transcriptomic analysis of Petunia hybrida in response to salt stress using high throughput RNA sequencing. PLoS ONE 2014, 9, e94651. [Google Scholar] [CrossRef] [PubMed]
  25. Zhang, H.B.; Zeng, Y.L.; Lan, H.Y.; Zhang, F.C. Physiological response of Betulahalophila (Betaluceae) to salt stress. Acta Bot. Yunnanica 2009, 31, 260–264. [Google Scholar] [CrossRef]
  26. Liu, Y.; Song, Q.; Li, D.; Yang, X.; Li, D. Multifunctional Roles of Plant Dehydrins in Response to Environmental Stresses. Front. Plant Sci. 2017, 8, 1018. [Google Scholar] [CrossRef] [PubMed]
  27. Kumar, M.; Lee, S.C.; Kim, J.Y.; Kim, S.J.; Aye, S.S.; Kim, S.R. Over-expression of dehydrin gene, OsDhn1, improves drought and salt stress tolerance through scavenging of reactive oxygen species in rice (Oryza sativa L.). J. Plant Biol. 2014, 57, 383–393. [Google Scholar] [CrossRef]
  28. Brini, F.; Hanin, M.; Lumbreras, V.; Amara, I.; Khoudi, H.; Hassairi, A.; Pagès, M.; Masmoudi, K. Overexpression of wheat dehydrin DHN5 enhances tolerance to salt and osmotic stress in Arabidopsis thaliana. Plant Cell Rep. 2007, 26, 2017–2026. [Google Scholar] [CrossRef] [PubMed]
  29. Roy Choudhury, A.; Sengupta, D.N. Transgenic tobacco plants overexpressing the heterologous lea gene Rab16A from rice during high salt and water deficit display enhanced tolerance to salinity stress. Plant Cell Rep. 2007, 26, 1839–1859. [Google Scholar] [CrossRef] [PubMed]
  30. Cheng, Z.; Targolli, J.; Huang, X.; Wu, R. Wheat LEA genes, PMA80 and PMA1959, enhance dehydration tolerance of transgenic rice (Oryza sativa L.). Mol. Breed. 2002, 10, 71–82. [Google Scholar] [CrossRef]
  31. Perdiguero, P.; Collada, C.; Soto, A. Novel dehydrins lacking complete K-segments in Pinaceae. The exception rather than the rule. Front. Plant Sci. 2014, 5, 682. [Google Scholar] [CrossRef] [PubMed]
  32. Close, T.J. Dehydrins: A commonalty in the response of plants to dehydration and low temperature. Physiol. Plant 1997, 100, 291–296. [Google Scholar] [CrossRef]
  33. Liu, C.C.; Li, C.M.; Liu, B.G.; Ge, S.J.; Dong, X.M.; Li, W.; Zhu, H.; Wang, B.; Yang, C. Genome-wide identification and characterization of a dehydrin gene family in poplar (Populustrichocarpa). Plant Mol. Biol. Rep. 2012, 30, 848–859. [Google Scholar] [CrossRef]
  34. Du, H.; Liu, H.; Xiong, L. Endogenous auxin and jasmonic acid levels are differentially modulated by abiotic stresses in rice. Front. Plant Sci. 2013, 4, 397. [Google Scholar] [CrossRef] [PubMed]
  35. Kim, H.B.; Oh, C.J.; Park, Y.C.; Lee, Y.; Choe, S.; An, C.S.; Choi, S.B. Comprehensive analysis of AHL homologous genes encoding AT-hook motif nuclear localized protein in rice. BMB Rep. 2011, 44, 680–685. [Google Scholar] [CrossRef] [PubMed] [Green Version]
  36. Matsushita, A.; Furumoto, T.; Ishida, S.; Takahashi, Y. AGF1, an AT-hook protein, is necessary for the negative feedback of AtGA3ox1 encoding GA3-oxidase. Plant Physiol. 2007, 143, 1152–1162. [Google Scholar] [CrossRef] [PubMed]
  37. Endt, D.V.; Silva, M.S.; Kijne, J.W.; Pasquali, G.; Memelink, J. Identification of a bipartite jasmonate-responsive promoter element in the Catharanthusroseus ORCA3 transcription factor gene that interacts specifically with AT-hook DNA-binding proteins. Plant Physiol. 2007, 144, 1680–1689. [Google Scholar] [CrossRef] [PubMed]
  38. Street, I.H.; Shah, P.K.; Smith, A.M.; Avery, N.; Neff, M.M. The AT-hook-containing proteins SOB3/AHL29 and ESC/AHL27 are negative modulators of hypocotyl growth in Arabidopsis. Plant J. 2008, 54, 1–14. [Google Scholar] [CrossRef] [PubMed]
  39. Lim, P.O.; Kim, Y.; Breeze, E.; Koo, J.C.; Woo, H.R.; Ryu, J.S.; Park, D.H.; Beynon, J.; Tabrett, A.; Buchanan-Wollaston, V.; et al. Overexpression of a chromatin architecture-controlling AT-hook protein extends leaf longevity and increases the post-harvest storage life of plants. Plant J. 2007, 52, 1140–1153. [Google Scholar] [CrossRef] [PubMed]
  40. Lu, H.; Zou, Y.; Feng, N. Overexpression of AHL20 negatively regulates defenses in Arabidopsis. J. Int. Plant Biol. 2010, 52, 801–808. [Google Scholar] [CrossRef] [PubMed]
  41. Li, B.; Dewey, C. RSEM: Accurate transcript quantification from RNA-Seq data with or without a reference genome. BMC Bioinform. 2011, 12, 323. [Google Scholar] [CrossRef] [PubMed]
  42. Robinson, M.D.; McCarthy, D.J.; Smyth, G.K. edgeR: A Bioconductor package for differential expression analysis of digital gene expression data. Bioinformatics 2010, 26, 139–140. [Google Scholar] [CrossRef] [PubMed]
  43. Wang, L.; Feng, Z.; Wang, X.; Wang, X.; Zhang, X. DEGseq: An R package for identifying differentially expressed genes from RNA-seq data. Bioinformatics 2010, 26, 136–138. [Google Scholar] [CrossRef] [PubMed]
  44. Young, M.D.; Wakefield, M.J.; Smyth, G.K.; Oshlack, A. Gene ontology analysis for RNA-seq: Accounting for selection bias. Genome Biol. 2010, 11, R14. [Google Scholar] [CrossRef] [PubMed]
  45. Shao, F.; Lu, Q.; Wilson, I.W.; Qiu, D. Genome-wide identification and characterization of the SPL gene family in Ziziphusjujuba. Gene 2017, 627, 315–321. [Google Scholar] [CrossRef] [PubMed]
  46. Lu, Q.; Shao, F.; Macmillan, C.; Wilson, I.W.; Van der Merwe, K.; Hussey, S.G.; Myburg, A.A.; Dong, X.; Qiu, D. Genomewide analysis of the lateral organ boundaries domain gene family in Eucalyptus grandis reveals members that differentially impact secondary growth. Plant Biotechnol. J. 2018, 16, 124–136. [Google Scholar] [CrossRef] [PubMed]
  47. Livak, K.J.; Schmittgen, T.D. Analysis of relative gene expression data using real-time quantitative PCR and the 2 (-Delta Delta, C.(T.)) method. Methods 2001, 25, 402–408. [Google Scholar] [CrossRef] [PubMed]
Figure 1. Length distribution of the assembled unigenes. (A) The number of contigs with same length. (B) The number of contigs with length 200–500 bp, 500 bp−1 kb, 1–2 kb and larger than 2 kb are shown.
Ijms 19 03412 g001
Figure 2. Gene ontology (GO) classification of unigenes. The GO terms are summarized into three main categories: biological process, cellular component, and molecular function.
Ijms 19 03412 g002
Figure 3. Eukaryotic Orthologous Groups (KOG) classification of the unigenes.
Ijms 19 03412 g003
Figure 4. Kyoto Encyclopedia of Genes and Genomes (KEGG) classification of KO annotated unigenes.
Ijms 19 03412 g004
Figure 5. A. Up-regulated and down-regulated differentially expressed genes in SC vs. CK; B. Venn diagrams showing unique and shared differentially expressed genes (DEGs) in SC (green) vs. CK (purple); C. Scatterplot of GO category enrichment of DEGs in SC vs. CK; D. Scatterplot of enriched KEGG pathways for DEGs in SC vs. CK. Rich factor is the ratio of the differentially expressed gene number to the total gene number in a certain pathway. The size and color of dot represent the gene number and the range of the q value, respectively.
Ijms 19 03412 g005
Figure 6. qRT-PCR validation of sixteen selected DEGs in leaves. Fold changes of the DEGs are shown. The expression levels in CK were arbitrarily set to 1. Error bars represent the standard deviations of three technical PCR replicates.
Ijms 19 03412 g006
Figure 7. The possible mechanism of salt tolerance in the leaves of B. halophila.
Ijms 19 03412 g007
Table 1. Summary of the sequencing data of the Betula halophila transcriptome.
SampleRaw ReadsClean ReadsClean BasesError (%)Q20 (%)Q30 (%)GC Content(%)
CK_168,348,35266,834,23610.03G0.0396.594.1746.88
CK_275,684,14473,359,33811G0.0396.4894.1447.4
CK_370,510,75069,082,97810.36G0.0396.2593.8347.29
SC_186,101,53684,155,54212.62G0.0396.5494.2347.28
SC_277,402,82475,577,00411.34G0.0396.4994.1647.33
SC_384,837,14282,931,75612.44G0.0396.4594.1247.29
Table 2. Summary of function annotation of the Betula halophila transcriptome.
Number of UnigenesPercentage (%)
Annotated in NR51,10543.64
Annotated in NT45,93339.22
Annotated in KO18,87616.12
Annotated in SwissProt40,62434.69
Annotated in PFAM40,66134.72
Annotated in GO41,11635.11
Annotated in KOG15,57213.29
Annotated in all Databases89737.66
Annotated in at least one Database64,55155.12
Total Unigenes117,091100

