Daytime-Dependent Changes of Cannabinoid Receptor Type 1 and Type 2 Expression in Rat Liver

Abstract
1. Introduction
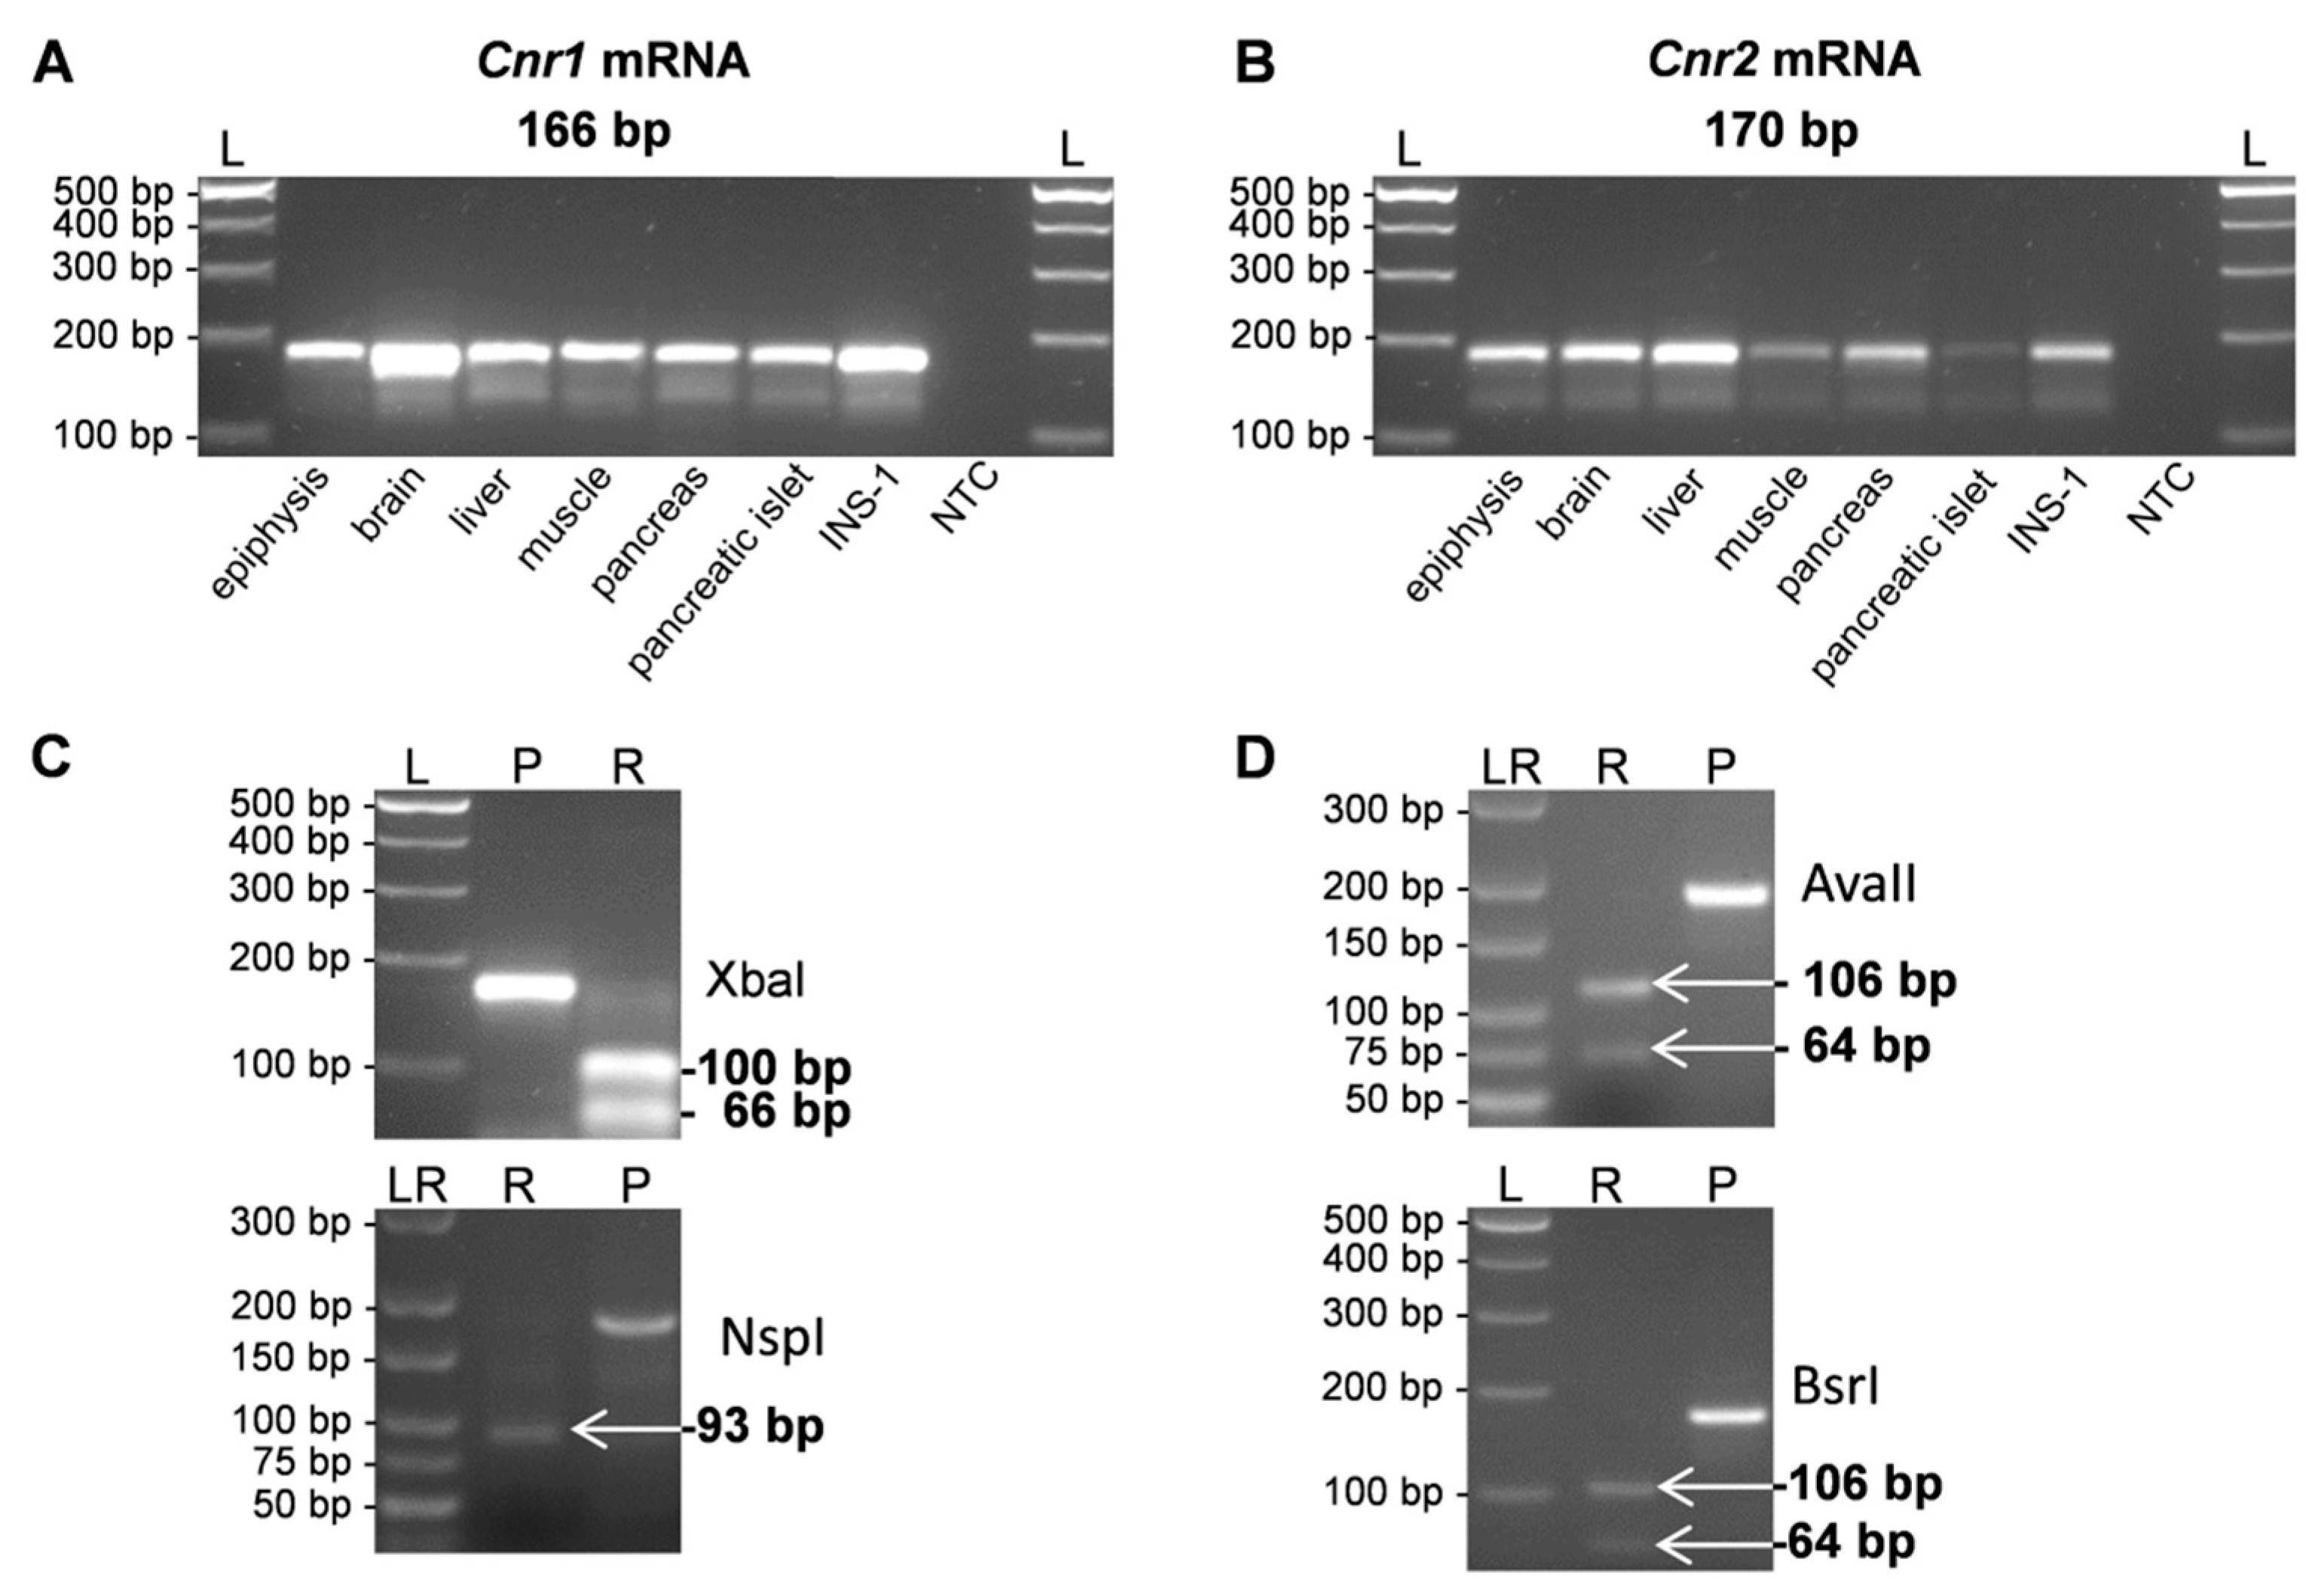
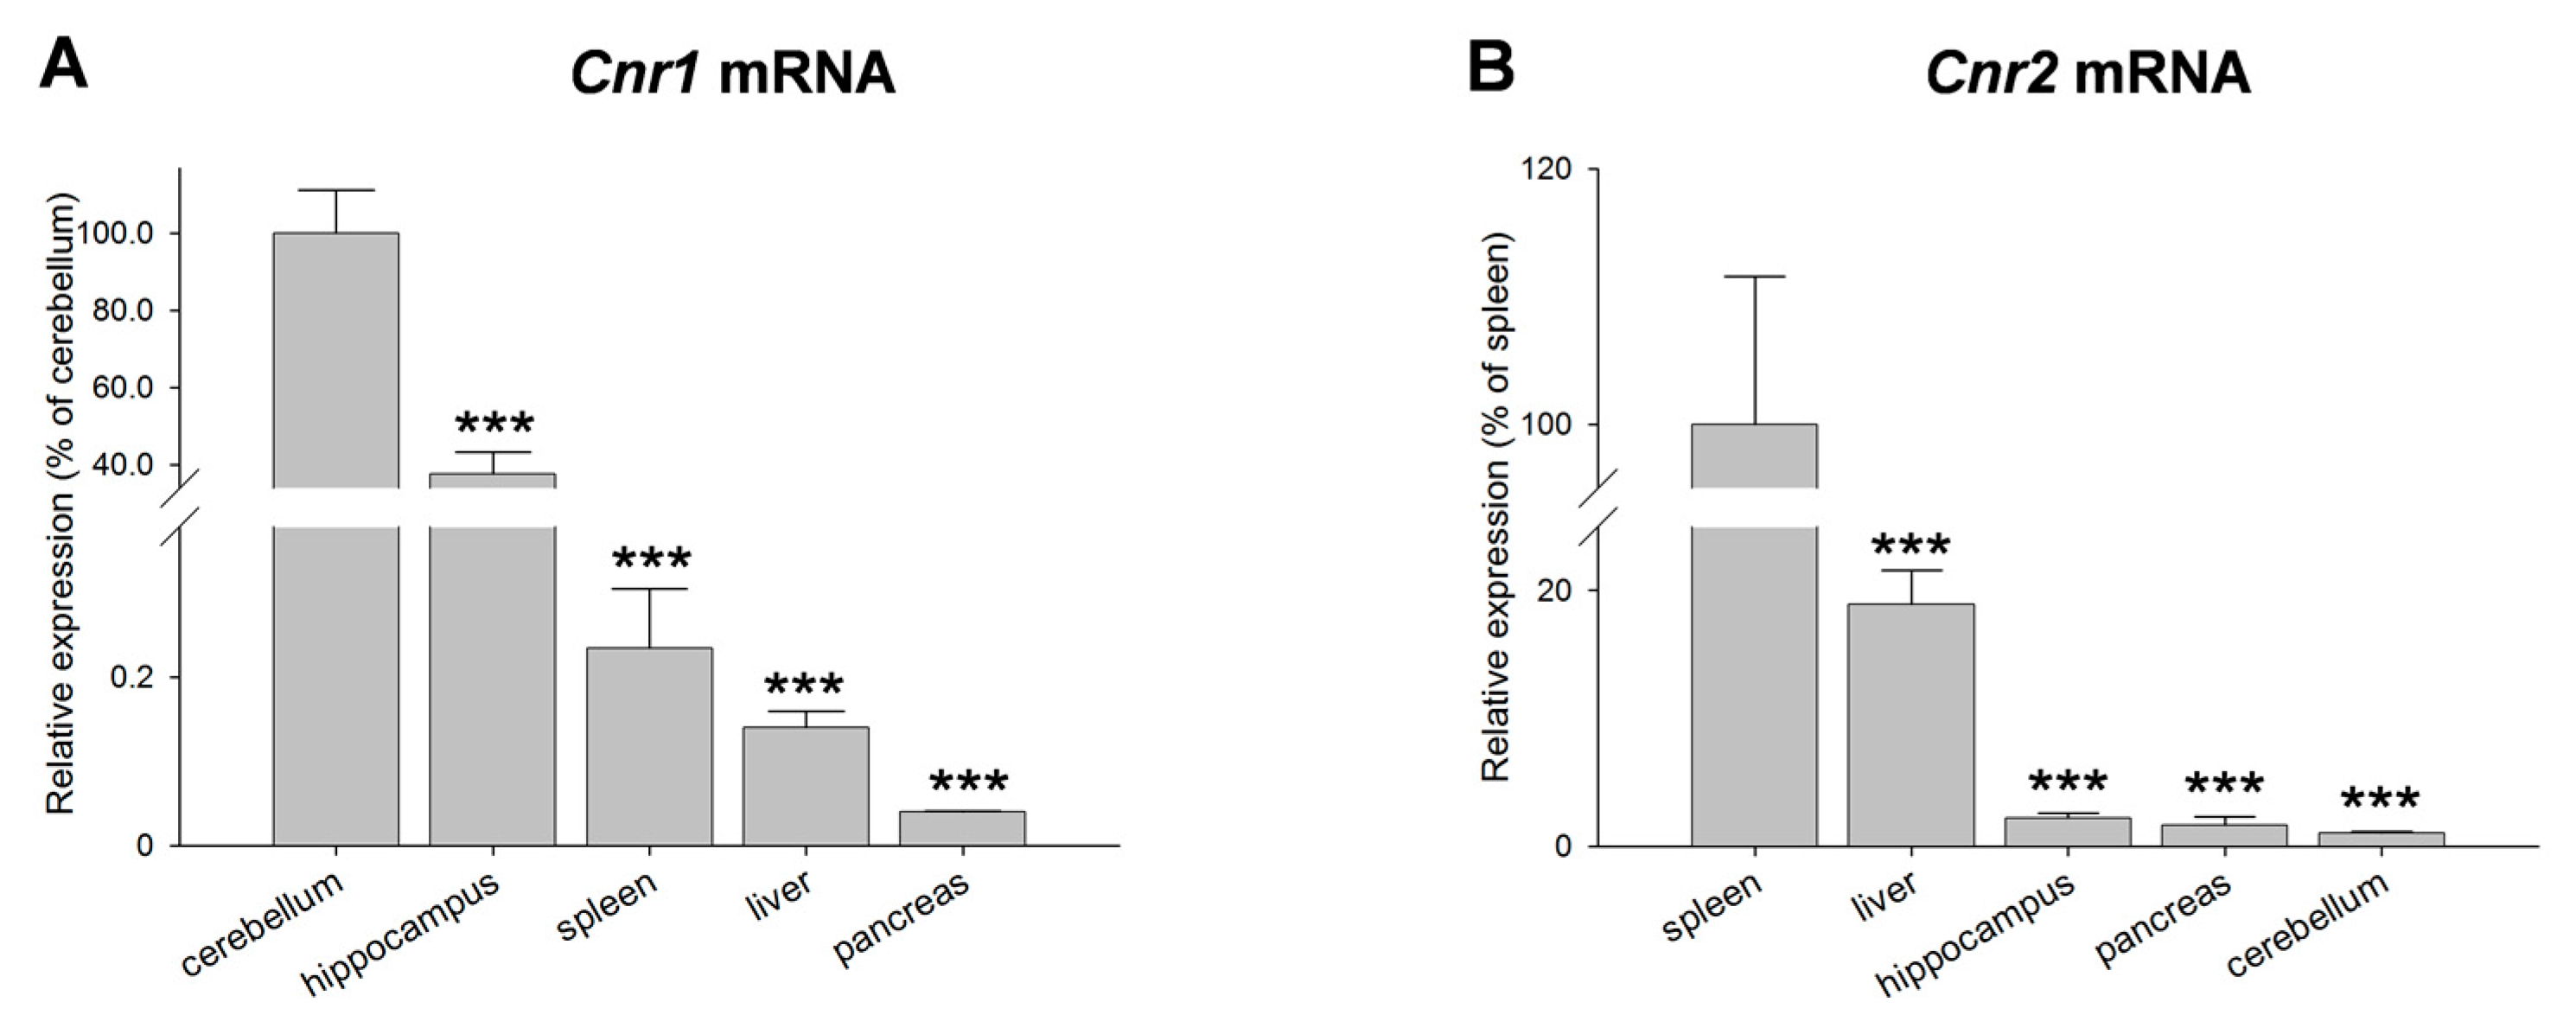
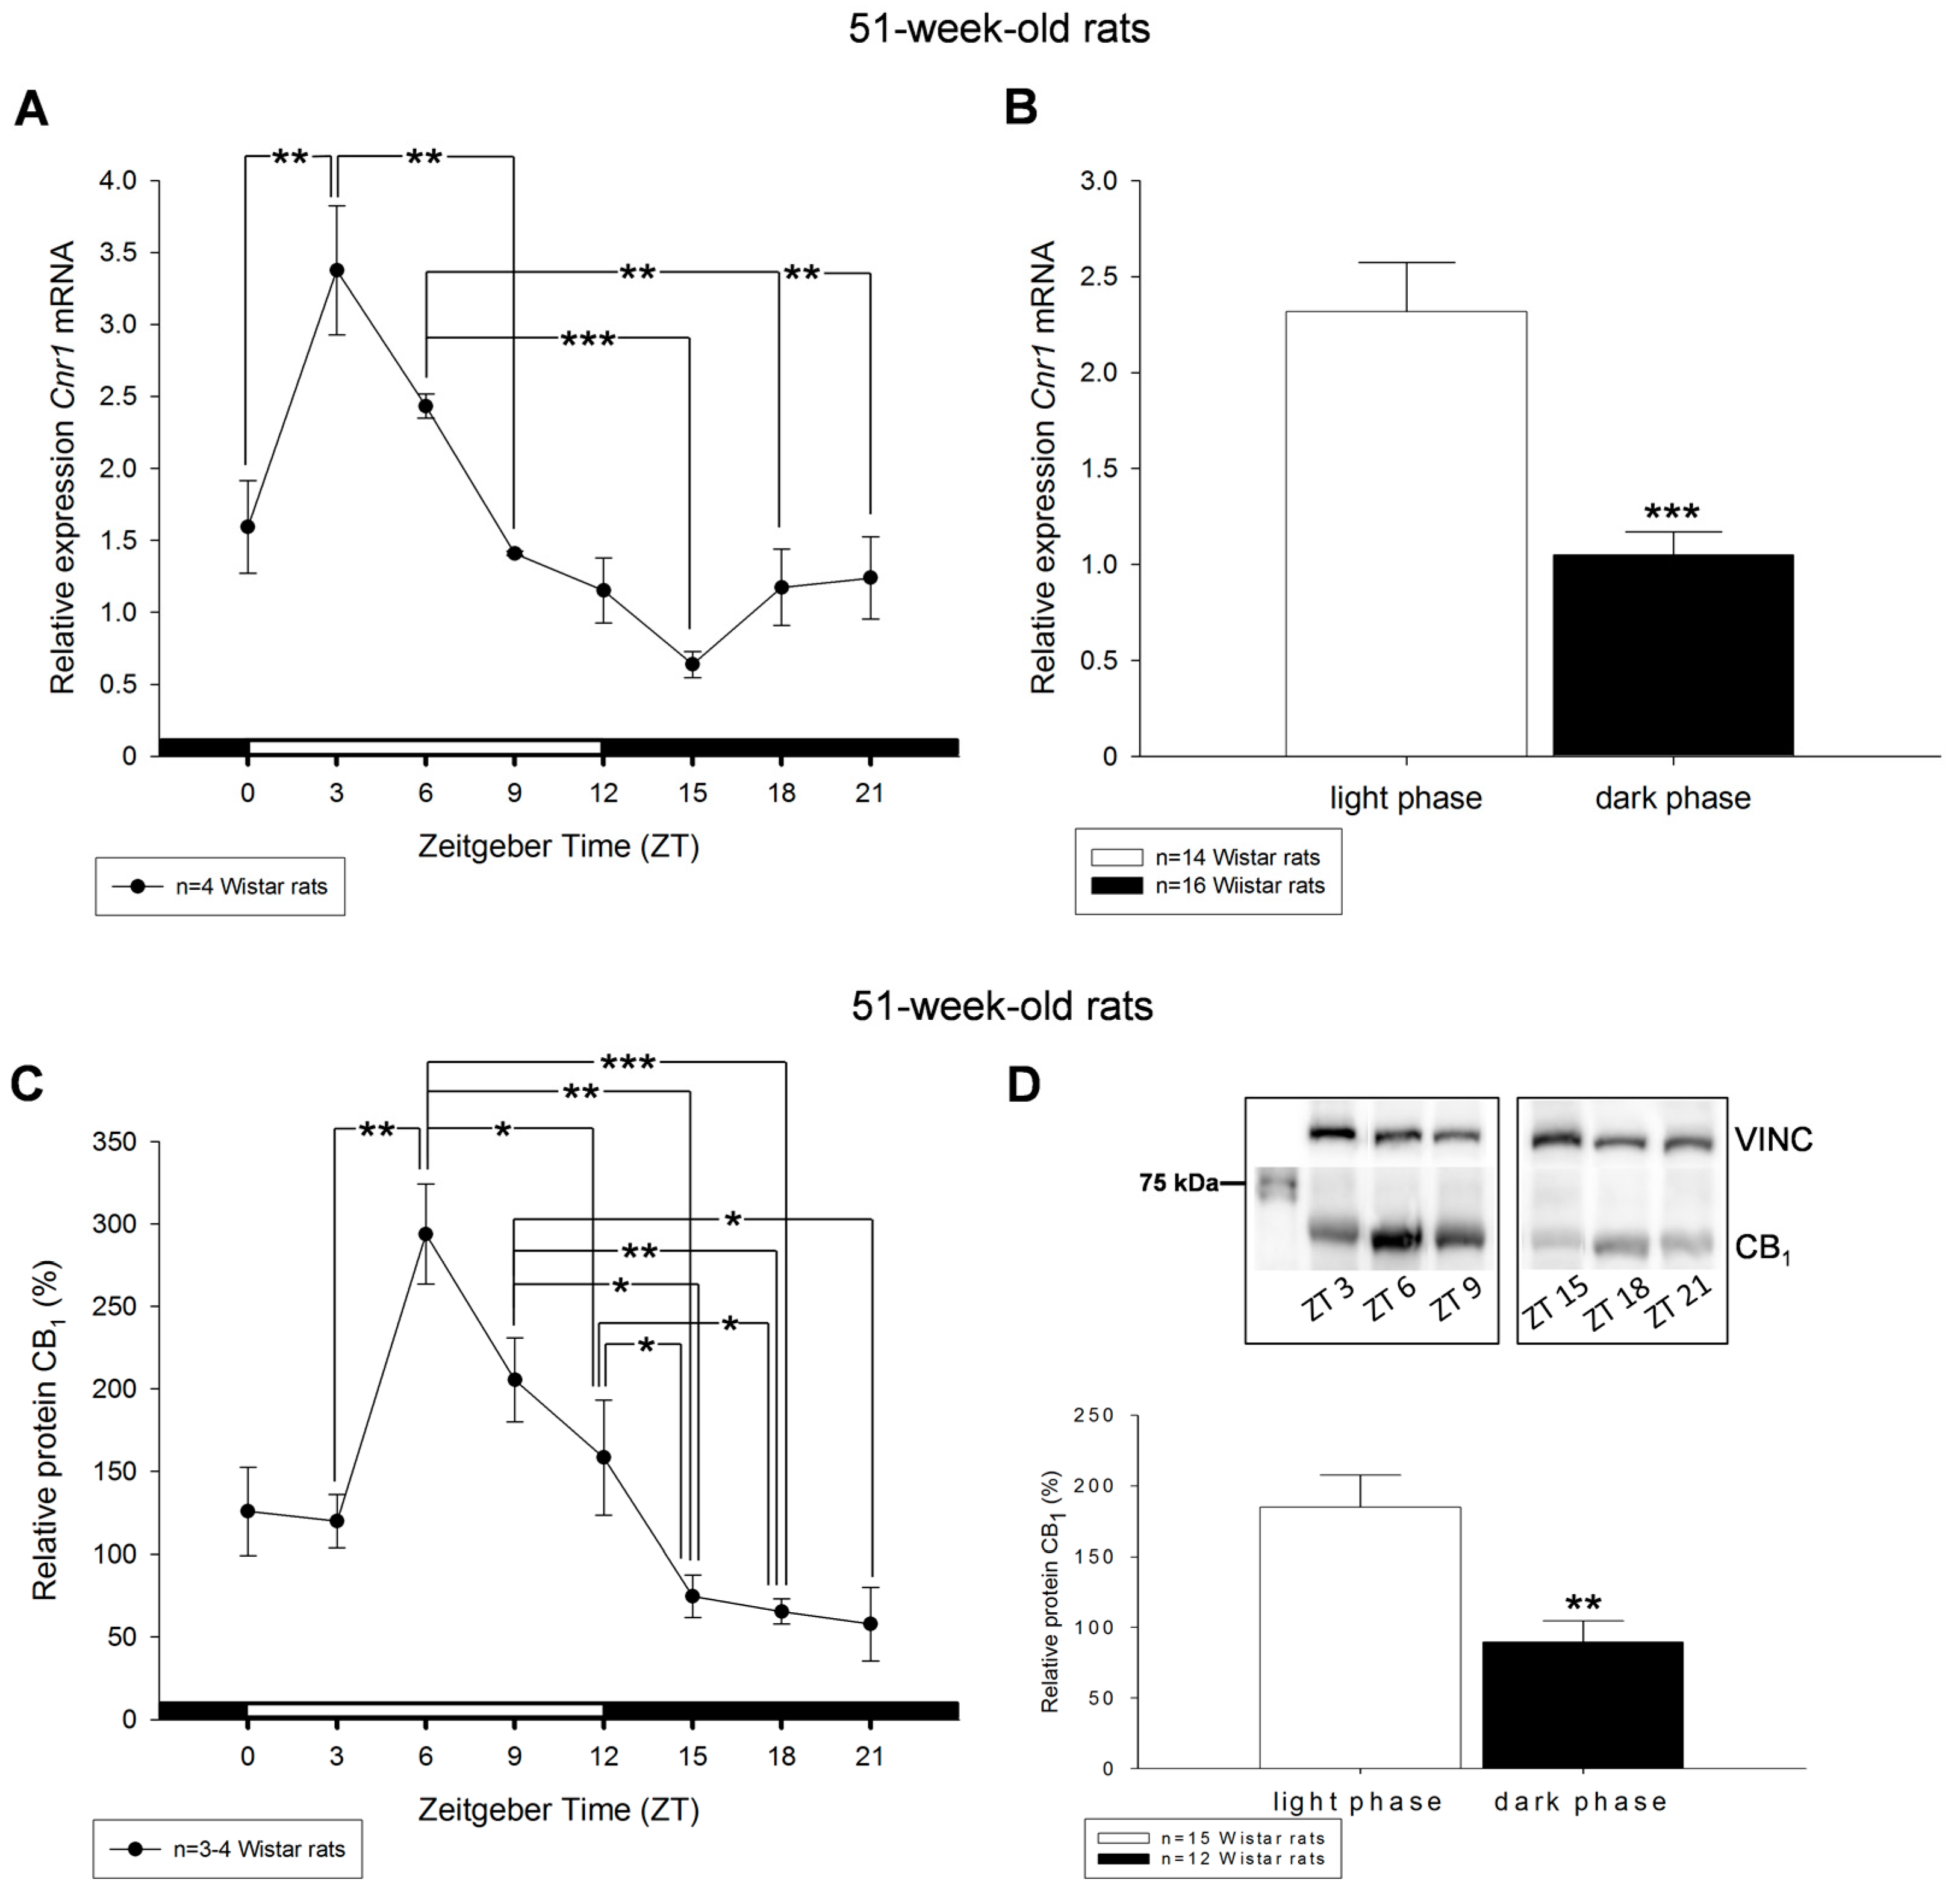
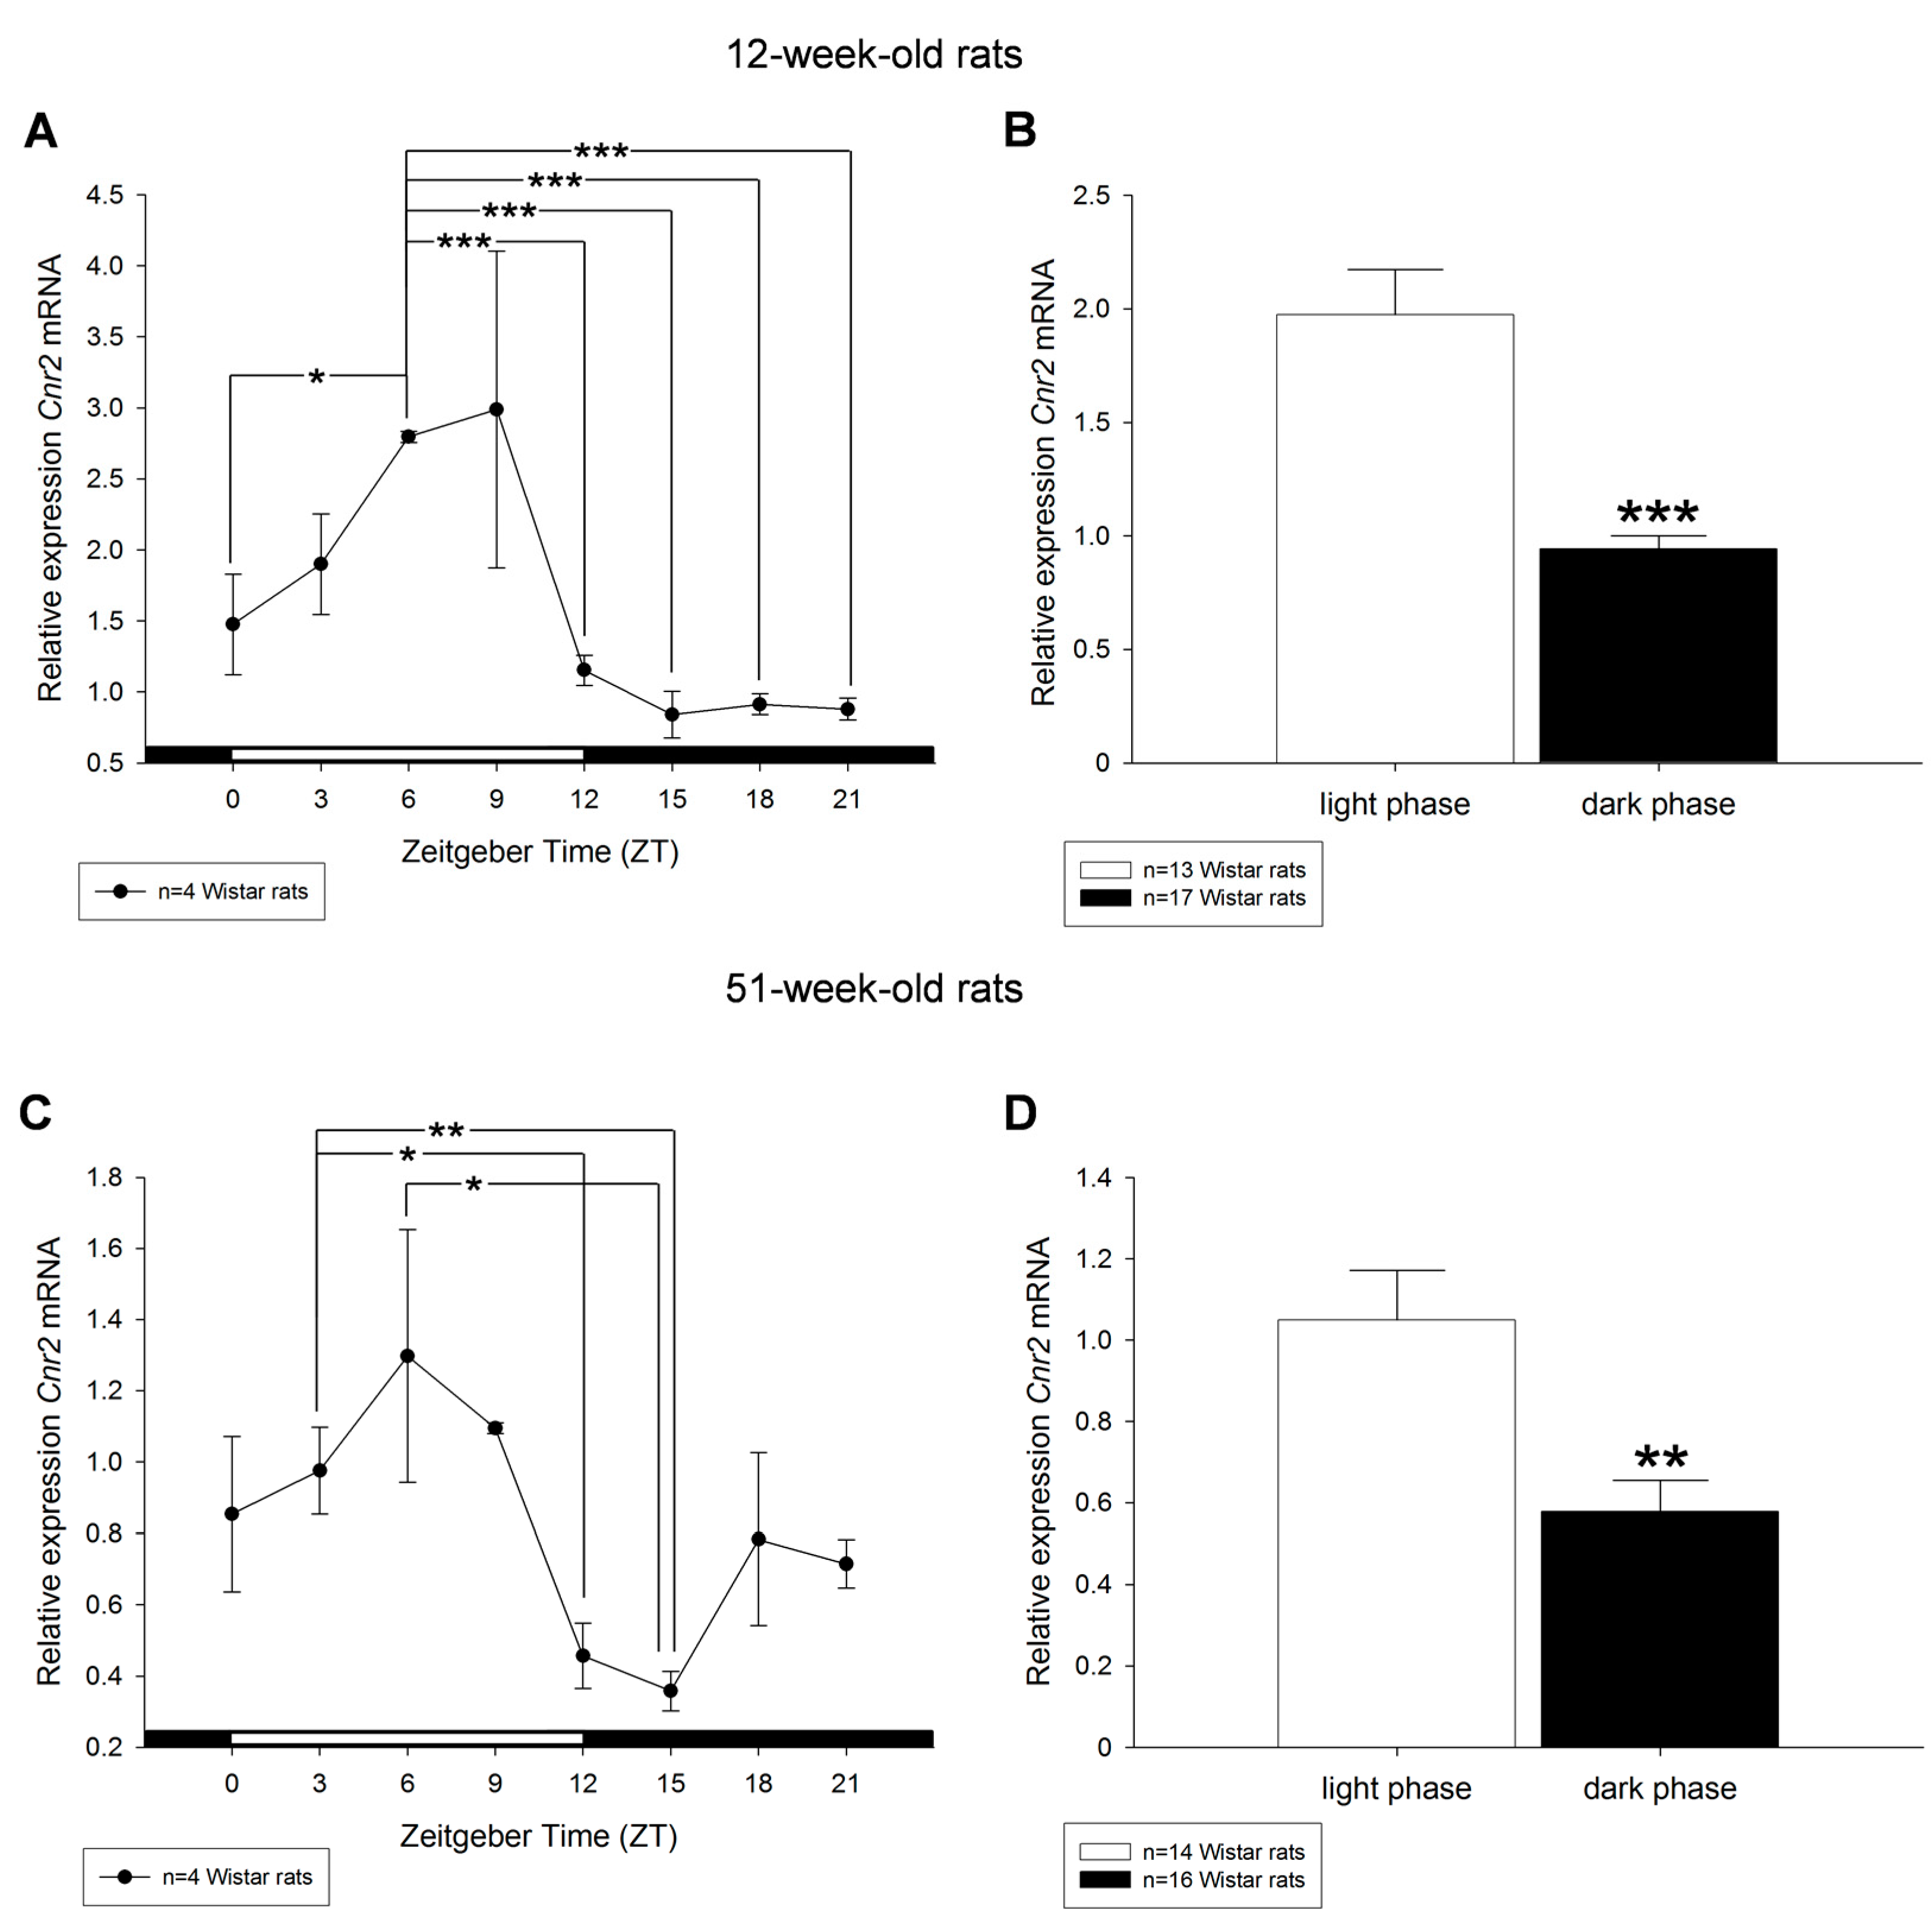
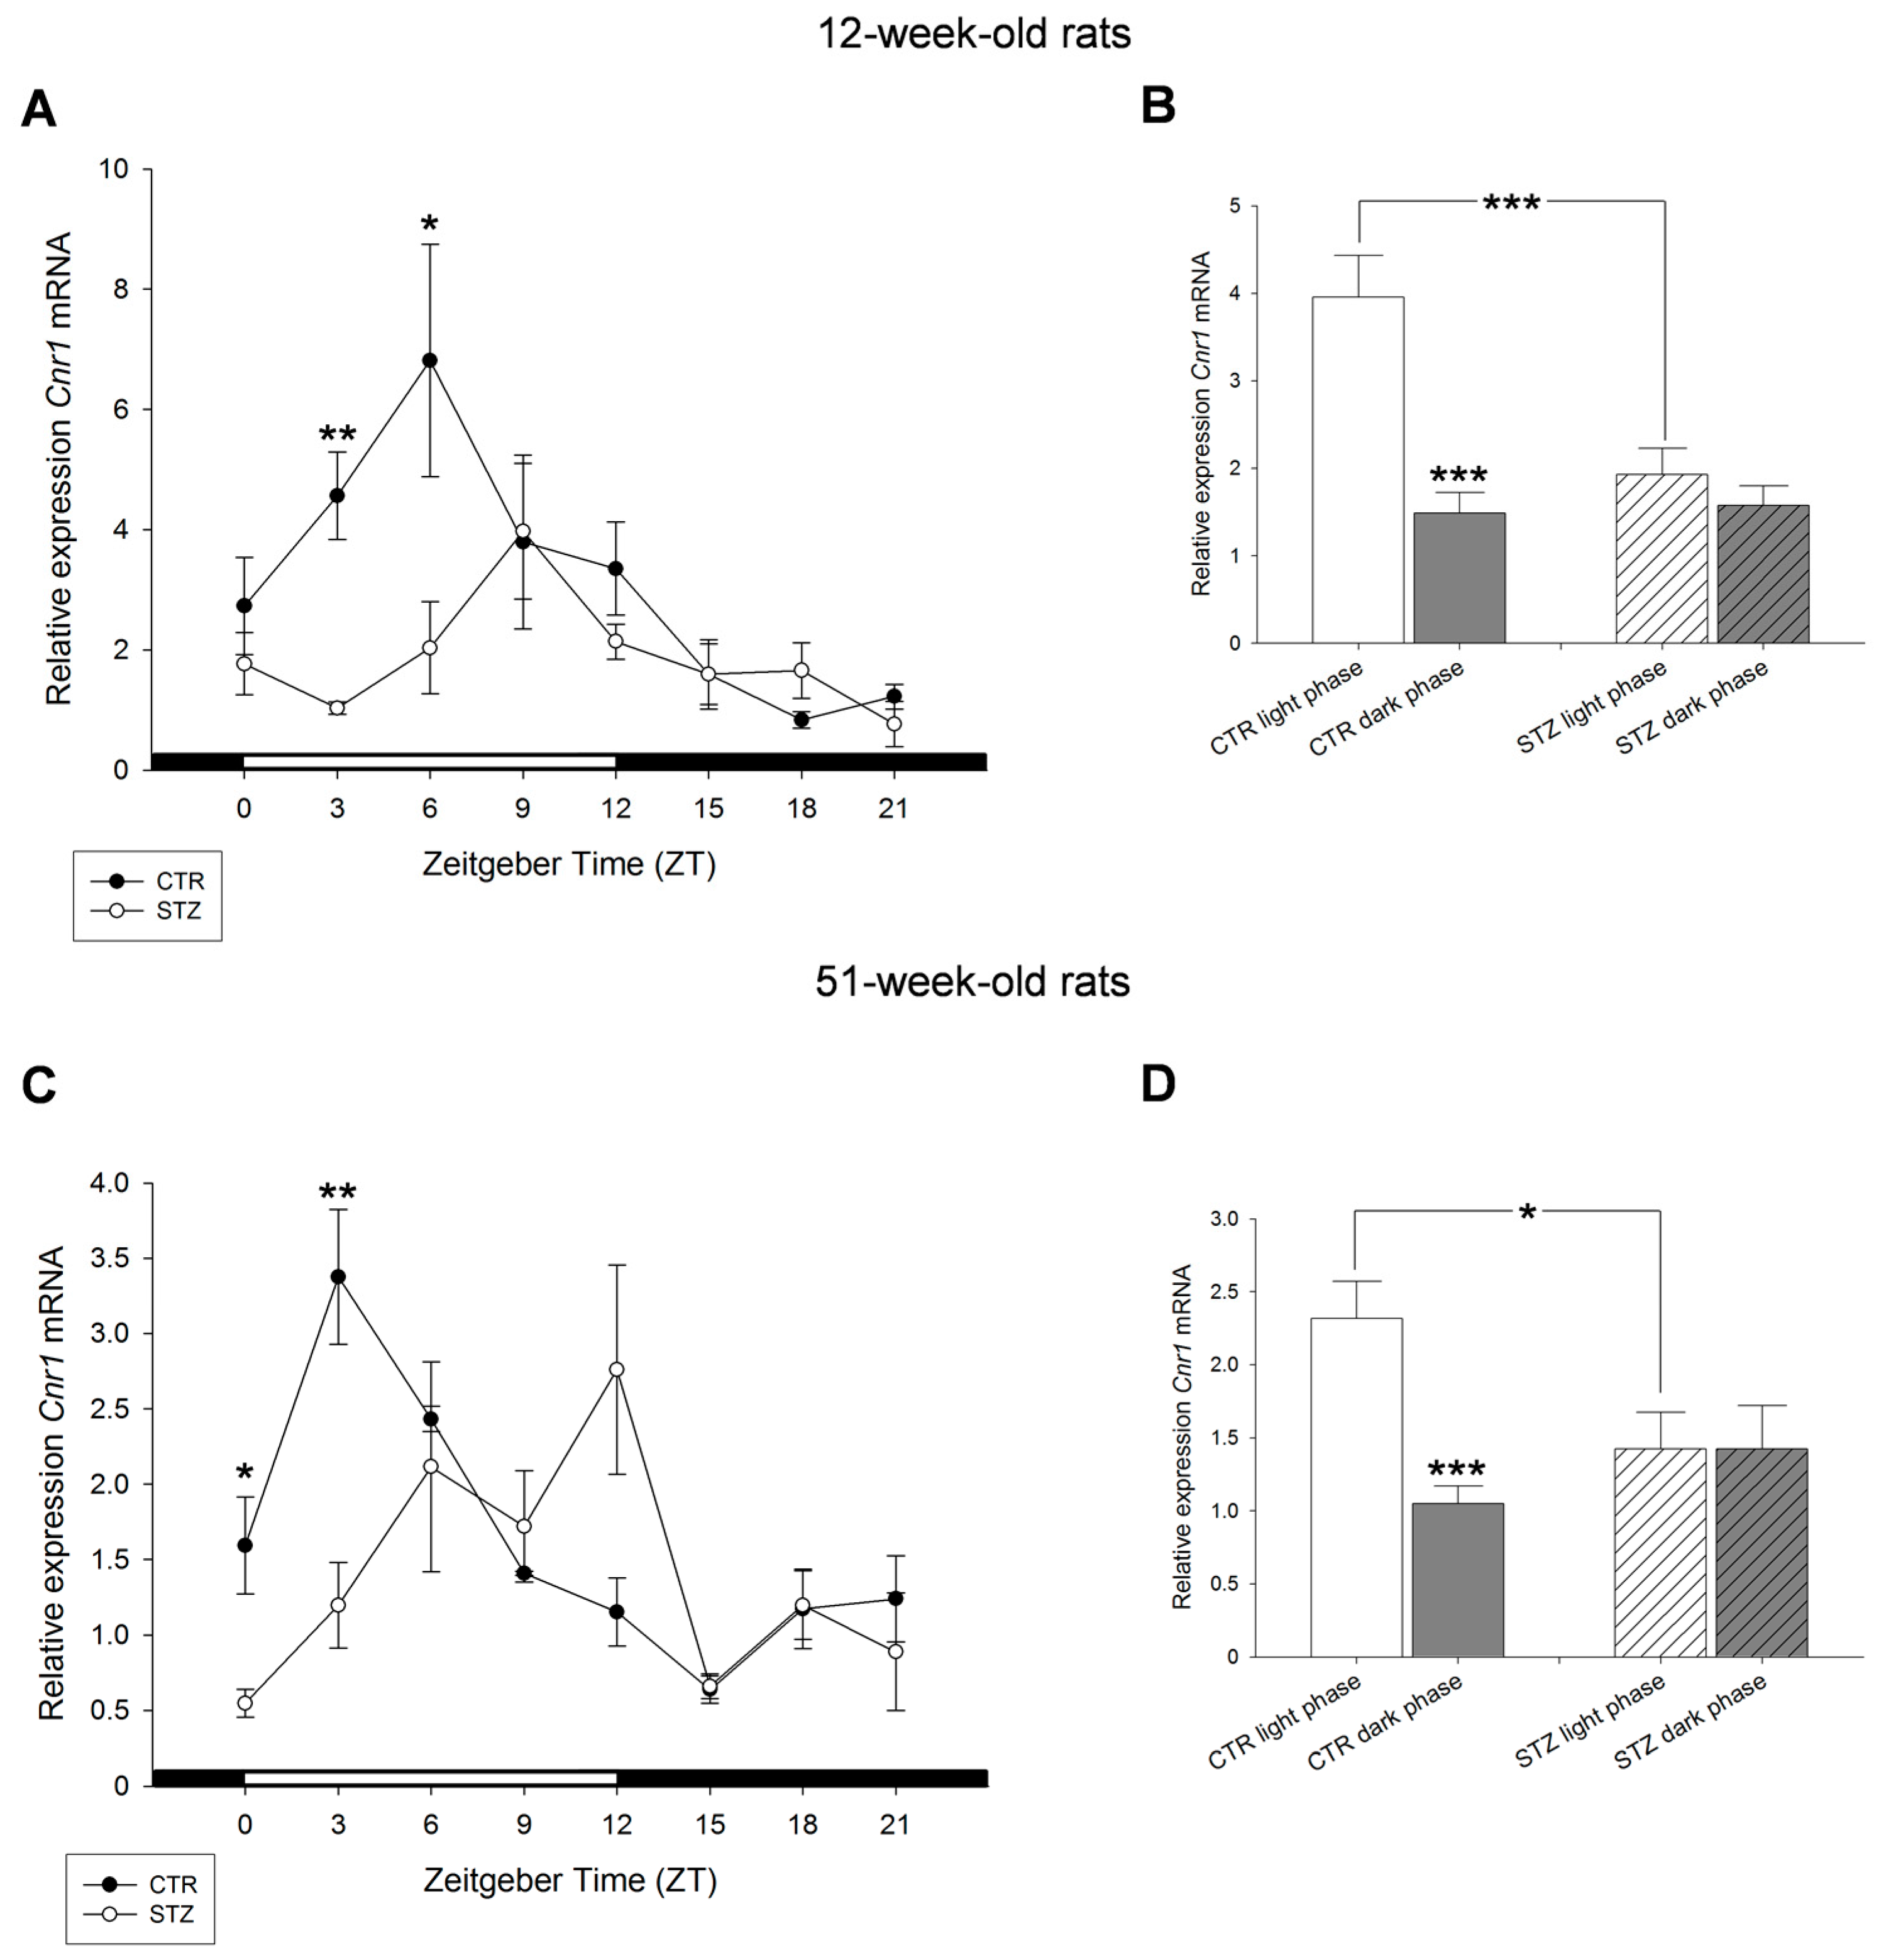
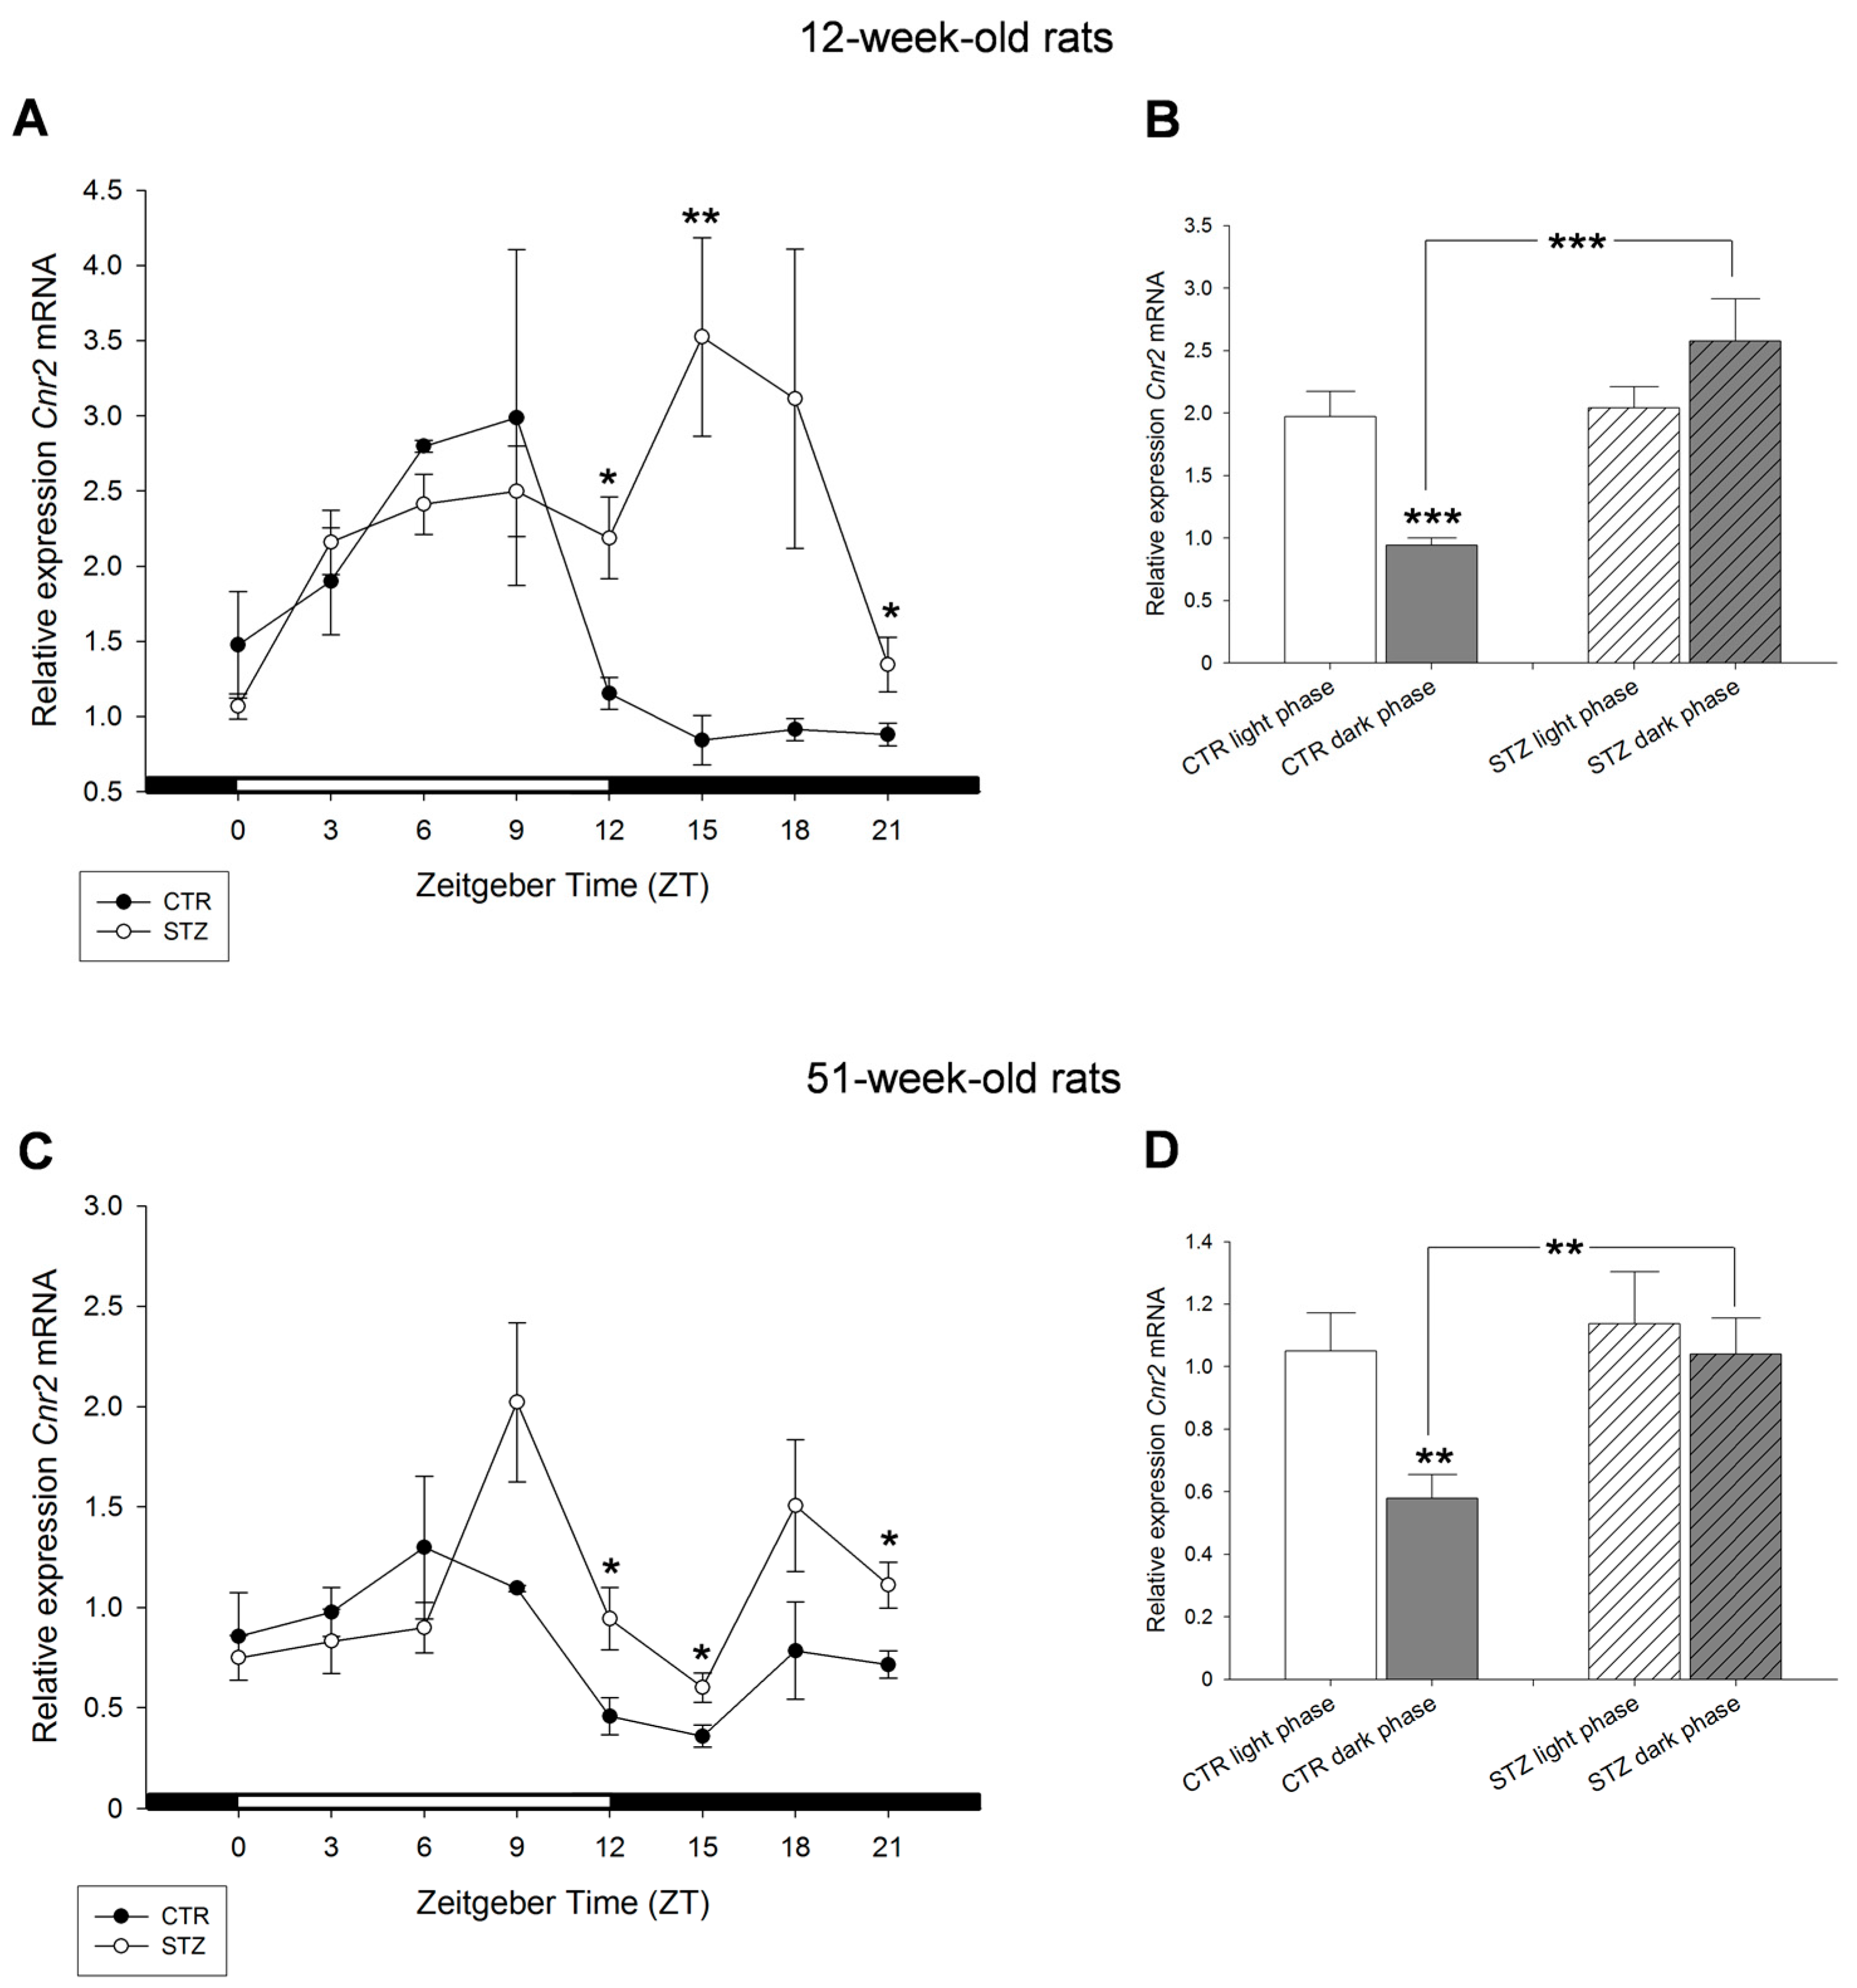
2. Results
3. Discussion
4. Materials and Methods
4.1. Animals and Tissue Collection
4.2. RNA Extraction, DNase 1 Digestion and Reverse Transcription
4.3. Semi-Quantitative, Real-Time RT-PCR
4.4. Western Blot
4.5. Statistics
Supplementary Materials
Acknowledgments
Author Contributions
Conflicts of Interest
References
- Di Marzo, V. CB1 receptor antagonism: Biological basis for metabolic effects. Drug Discov. Today 2008, 13, 1026–1041. [Google Scholar] [CrossRef] [PubMed]
- Matsuda, L.A.; Lolait, S.J.; Brownstein, M.J.; Young, A.C.; Bonner, T.I. Structure of a cannabinoid receptor and functional expression of the cloned cDNA. Nature 1990, 346, 561–564. [Google Scholar] [CrossRef] [PubMed]
- Munro, S.; Thomas, K.L.; Abu-Shaar, M. Molecular characterization of a peripheral receptor for cannabinoids. Nature 1993, 365, 61–65. [Google Scholar] [CrossRef] [PubMed]
- Herkenham, M.; Lynn, A.B.; Johnson, M.R.; Melvin, L.S.; de Costa, B.R.; Rice, K.C. Characterization and localization of cannabinoid receptors in rat brain: A quantitative in vitro autoradiographic study. J. Neurosci. 1991, 11, 563–583. [Google Scholar] [PubMed]
- Devane, W.A.; Hanus, L.; Breuer, A.; Pertwee, R.G.; Stevenson, L.A.; Griffin, G.; Gibson, D.; Mandelbaum, A.; Etinger, A.; Mechoulam, R. Isolation and structure of a brain constituent that binds to the cannabinoid receptor. Science 1992, 258, 1946–1949. [Google Scholar] [CrossRef] [PubMed]
- Dalton, G.D.; Bass, C.E.; van Horn, C.G.; Howlett, A.C. Signal transduction via cannabinoid receptors. CNS Neurol. Disord. Drug Targets 2009, 8, 422–431. [Google Scholar] [CrossRef] [PubMed]
- Massa, F.; Storr, M.; Lutz, B. The endocannabinoid system in the physiology and pathophysiology of the gastrointestinal tract. J. Mol. Med. 2005, 83, 944–954. [Google Scholar] [CrossRef] [PubMed]
- Osei-Hyiaman, D.; DePetrillo, M.; Pacher, P.; Liu, J.; Radaeva, S.; Bátkai, S.; Harvey-White, J.; Mackie, K.; Offertáler, L.; Wang, L.; et al. Endocannabinoid activation at hepatic CB1 receptors stimulates fatty acid synthesis and contributes to diet-induced obesity. J. Clin. Investig. 2005, 115, 1298–1305. [Google Scholar] [CrossRef] [PubMed]
- Cota, D. CB1 receptors: Emerging evidence for central and peripheral mechanisms that regulate energy balance, metabolism, and cardiovascular health. Diabetes Metab. Res. Rev. 2007, 23, 507–517. [Google Scholar] [CrossRef] [PubMed]
- Tharp, W.G.; Lee, Y.-H.; Maple, R.L.; Pratley, R.E. The cannabinoid CB1 receptor is expressed in pancreatic delta-cells. Biochem. Biophys. Res. Commun. 2008, 372, 595–600. [Google Scholar] [CrossRef] [PubMed]
- O’Keefe, L.; Simcocks, A.C.; Hryciw, D.H.; Mathai, M.L.; McAinch, A.J. The cannabinoid receptor 1 and its role in influencing peripheral metabolism. Diabetes Obes. Metab. 2014, 16, 294–304. [Google Scholar] [CrossRef] [PubMed]
- Van Sickle, M.D.; Duncan, M.; Kingsley, P.J.; Mouihate, A.; Urbani, P.; Mackie, K.; Stella, N.; Makriyannis, A.; Piomelli, D.; Davison, J.S.; et al. Identification and functional characterization of brainstem cannabinoid CB2 receptors. Science 2005, 310, 329–332. [Google Scholar] [CrossRef] [PubMed]
- Skaper, S.D.; Buriani, A.; Dal Toso, R.; Petrelli, L.; Romanello, S.; Facci, L.; Leon, A. The ALIAmide palmitoylethanolamide and cannabinoids, but not anandamide, are protective in a delayed postglutamate paradigm of excitotoxic death in cerebellar granule neurons. Proc. Natl. Acad. Sci. USA 1996, 93, 3984–3989. [Google Scholar] [CrossRef] [PubMed]
- Núñez, E.; Benito, C.; Pazos, M.R.; Barbachano, A.; Fajardo, O.; González, S.; Tolón, R.M.; Romero, J. Cannabinoid CB2 receptors are expressed by perivascular microglial cells in the human brain: An immunohistochemical study. Synapse 2004, 53, 208–213. [Google Scholar] [CrossRef] [PubMed]
- Buckley, N.E.; Hansson, S.; Harta, G.; Mezey, E. Expression of the CB1 and CB2 receptor messenger RNAs during embryonic development in the rat. Neuroscience 1998, 82, 1131–1149. [Google Scholar] [CrossRef]
- Teixeira-Clerc, F.; Julien, B.; Grenard, P.; van Tran Nhieu, J.; Deveaux, V.; Li, L.; Serriere-Lanneau, V.; Ledent, C.; Mallat, A.; Lotersztajn, S. CB1 cannabinoid receptor antagonism: A new strategy for the treatment of liver fibrosis. Nat. Med. 2006, 12, 671–676. [Google Scholar] [CrossRef] [PubMed]
- Murillo-Rodríguez, E. The role of the CB1 receptor in the regulation of sleep. Prog. Neuro-Psychopharmacol. Biol. Psychiatry 2008, 32, 1420–1427. [Google Scholar] [CrossRef] [PubMed]
- De Kloet, A.D.; Woods, S.C. Minireview: Endocannabinoids and their receptors as targets for obesity therapy. Endocrinology 2009, 150, 2531–2536. [Google Scholar] [CrossRef] [PubMed]
- Maccarrone, M.; Wenger, T. Effects of cannabinoids on hypothalamic and reproductive function. Handb. Exp. Pharmacol. 2005, 168, 555–571. [Google Scholar]
- Li, S.; Lin, J.D. Transcriptional control of circadian metabolic rhythms in the liver. Diabetes Obes. Metab. 2015, 17 (Suppl. S1), 33–38. [Google Scholar] [CrossRef] [PubMed]
- Agius, L. Role of glycogen phosphorylase in liver glycogen metabolism. Mol. Asp. Med. 2015, 46, 34–45. [Google Scholar] [CrossRef] [PubMed]
- Peschke, E.; Wolgast, S.; Bazwinsky, I.; Pönicke, K.; Muhlbauer, E. Increased melatonin synthesis in pineal glands of rats in streptozotocin induced type 1 diabetes. J. Pineal Res. 2008, 45, 439–448. [Google Scholar] [CrossRef] [PubMed]
- Honma, K.; Hikosaka, M.; Mochizuki, K.; Goda, T. Loss of circadian rhythm of circulating insulin concentration induced by high-fat diet intake is associated with disrupted rhythmic expression of circadian clock genes in the liver. Metabolism 2016, 65, 482–491. [Google Scholar] [CrossRef] [PubMed]
- Maccarrone, M.; Bab, I.; Bíró, T.; Cabral, G.A.; Dey, S.K.; Di Marzo, V.; Konje, J.C.; Kunos, G.; Mechoulam, R.; Pacher, P.; et al. Endocannabinoid signaling at the periphery: 50 years after THC. Trends Pharmacol. Sci. 2015, 36, 277–296. [Google Scholar] [CrossRef] [PubMed]
- Kunos, G.; Tam, J. The case for peripheral CB1 receptor blockade in the treatment of visceral obesity and its cardiometabolic complications. Br. J. Pharmacol. 2011, 163, 1423–1431. [Google Scholar] [CrossRef] [PubMed]
- Liu, J.; Zhou, L.; Xiong, K.; Godlewski, G.; Mukhopadhyay, B.; Tam, J.; Yin, S.; Gao, P.; Shan, X.; Pickel, J.; et al. Hepatic cannabinoid receptor-1 mediates diet-induced insulin resistance via inhibition of insulin signaling and clearance in mice. Gastroenterology 2012, 142, 1218.e1–1228.e1. [Google Scholar] [CrossRef] [PubMed]
- Chanda, D.; Kim, D.-K.; Li, T.; Kim, Y.-H.; Koo, S.-H.; Lee, C.-H.; Chiang, J.Y.L.; Choi, H.-S. Cannabinoid receptor type 1 (CB1R) signaling regulates hepatic gluconeogenesis via induction of endoplasmic reticulum-bound transcription factor cAMP-responsive element-binding protein H (CREBH) in primary hepatocytes. J. Biol. Chem. 2011, 286, 27971–27979. [Google Scholar] [CrossRef] [PubMed]
- Silvestri, C.; di Marzo, V. The endocannabinoid system in energy homeostasis and the etiopathology of metabolic disorders. Cell Metab. 2013, 17, 475–490. [Google Scholar] [CrossRef] [PubMed]
- Mazier, W.; Saucisse, N.; Gatta-Cherifi, B.; Cota, D. The endocannabinoid system: Pivotal orchestrator of obesity and metabolic disease. Trends Endocrinol. Metab. 2015, 26, 524–537. [Google Scholar] [CrossRef] [PubMed]
- Schmitz, K.; Mangels, N.; Häussler, A.; Ferreirós, N.; Fleming, I.; Tegeder, I. Pro-inflammatory obesity in aged cannabinoid-2 receptor-deficient mice. Int. J. Obes. 2016, 40, 366–379. [Google Scholar] [CrossRef] [PubMed]
- Lipina, C.; Vaanholt, L.M.; Davidova, A.; Mitchell, S.E.; Storey-Gordon, E.; Hambly, C.; Irving, A.J.; Speakman, J.R.; Hundal, H.S. CB1 receptor blockade counters age-induced insulin resistance and metabolic dysfunction. Aging Cell 2016, 15, 325–335. [Google Scholar] [CrossRef] [PubMed]
- Agudo, J.; Martin, M.; Roca, C.; Molas, M.; Bura, A.S.; Zimmer, A.; Bosch, F.; Maldonado, R. Deficiency of CB2 cannabinoid receptor in mice improves insulin sensitivity but increases food intake and obesity with age. Diabetologia 2010, 53, 2629–2640. [Google Scholar] [CrossRef] [PubMed]
- Kunos, G.; Osei-Hyiaman, D.; Liu, J.; Godlewski, G.; Bátkai, S. Endocannabinoids and the control of energy homeostasis. J. Biol. Chem. 2008, 283, 33021–33025. [Google Scholar] [CrossRef] [PubMed]
- Nogueiras, R.; Diaz-Arteaga, A.; Lockie, S.H.; Velásquez, D.A.; Tschop, J.; López, M.; Cadwell, C.C.; Diéguez, C.; Tschöp, M.H. The endocannabinoid system: Role in glucose and energy metabolism. Pharmacol. Res. 2009, 60, 93–98. [Google Scholar] [CrossRef] [PubMed]
- Asfari, M.; Janjic, D.; Meda, P.; Li, G.; Halban, P.A.; Wollheim, C.B. Establishment of 2-mercaptoethanol-dependent differentiated insulin-secreting cell lines. Endocrinology 1992, 130, 167–178. [Google Scholar] [CrossRef] [PubMed]
- Cooper, M.E.; Regnell, S.E. The hepatic cannabinoid 1 receptor as a modulator of hepatic energy state and food intake. Br. J. Clin. Pharmacol. 2014, 77, 21–30. [Google Scholar] [CrossRef] [PubMed]
- Pagotto, U.; Cervino, C.; Vicennati, V.; Marsicano, G.; Lutz, B.; Pasquali, R. How many sites of action for endocannabinoids to control energy metabolism? Int. J. Obes. 2006, 30 (Suppl. S1), S39–S43. [Google Scholar] [CrossRef] [PubMed]
- Bátkai, S.; Járai, Z.; Wagner, J.A.; Goparaju, S.K.; Varga, K.; Liu, J.; Wang, L.; Mirshahi, F.; Khanolkar, A.D.; Makriyannis, A.; et al. Endocannabinoids acting at vascular CB1 receptors mediate the vasodilated state in advanced liver cirrhosis. Nat. Med. 2001, 7, 827–832. [Google Scholar] [CrossRef] [PubMed]
- Osei-Hyiaman, D.; Liu, J.; Zhou, L.; Godlewski, G.; Harvey-White, J.; Jeong, W.-I.; Bátkai, S.; Marsicano, G.; Lutz, B.; Buettner, C.; et al. Hepatic CB1 receptor is required for development of diet-induced steatosis, dyslipidemia, and insulin and leptin resistance in mice. J. Clin. Investig. 2008, 118, 3160–3169. [Google Scholar] [CrossRef] [PubMed]
- Siegmund, S.V.; Uchinami, H.; Osawa, Y.; Brenner, D.A.; Schwabe, R.F. Anandamide induces necrosis in primary hepatic stellate cells. Hepatology 2005, 41, 1085–1095. [Google Scholar] [CrossRef] [PubMed]
- Siegmund, S.V.; Qian, T.; de Minicis, S.; Harvey-White, J.; Kunos, G.; Vinod, K.Y.; Hungund, B.; Schwabe, R.F. The endocannabinoid 2-arachidonoyl glycerol induces death of hepatic stellate cells via mitochondrial reactive oxygen species. FASEB J. 2007, 21, 2798–2806. [Google Scholar] [CrossRef] [PubMed]
- Siegmund, S.V.; Schwabe, R.F. Endocannabinoids and liver disease. II. Endocannabinoids in the pathogenesis and treatment of liver fibrosis. Am. J. Physiol. Gastrointest. Liver Physiol. 2008, 294, G357–G362. [Google Scholar] [CrossRef] [PubMed]
- Berrendero, F.; García-Gil, L.; Hernández, M.L.; Romero, J.; Cebeira, M.; de Miguel, R.; Ramos, J.A.; Fernández-Ruiz, J.J. Localization of mRNA expression and activation of signal transduction mechanisms for cannabinoid receptor in rat brain during fetal development. Development 1998, 125, 3179–3188. [Google Scholar] [PubMed]
- Bidaut-Russell, M.; Devane, W.A.; Howlett, A.C. Cannabinoid receptors and modulation of cyclic AMP accumulation in the rat brain. J. Neurochem. 1990, 55, 21–26. [Google Scholar] [CrossRef] [PubMed]
- Vollmers, C.; Gill, S.; DiTacchio, L.; Pulivarthy, S.R.; Le, H.D.; Panda, S. Time of feeding and the intrinsic circadian clock drive rhythms in hepatic gene expression. Proc. Natl. Acad. Sci. USA 2009, 106, 21453–21458. [Google Scholar] [CrossRef] [PubMed]
- Reddy, A.B.; Karp, N.A.; Maywood, E.S.; Sage, E.A.; Deery, M.; O’Neill, J.S.; Wong, G.K.Y.; Chesham, J.; Odell, M.; Lilley, K.S.; et al. Circadian orchestration of the hepatic proteome. Curr. Biol. 2006, 16, 1107–1115. [Google Scholar] [CrossRef] [PubMed]
- Eckel-Mahan, K.; Sassone-Corsi, P. Metabolism and the circadian clock converge. Physiol. Rev. 2013, 93, 107–135. [Google Scholar] [CrossRef] [PubMed]
- Martínez-Vargas, M.; Murillo-Rodríguez, E.; González-Rivera, R.; Landa, A.; Méndez-Díaz, M.; Prospro-García, O.; Navarro, L. Sleep modulates cannabinoid receptor 1 expression in the pons of rats. Neuroscience 2003, 117, 197–201. [Google Scholar] [CrossRef]
- Rueda-Orozco, P.E.; Soria-Gomez, E.; Montes-Rodriguez, C.J.; Martínez-Vargas, M.; Galicia, O.; Navarro, L.; Prospero-García, O. A potential function of endocannabinoids in the selection of a navigation strategy by rats. Psychopharmacology 2008, 198, 565–576. [Google Scholar] [CrossRef] [PubMed]
- Vaughn, L.K.; Denning, G.; Stuhr, K.L.; Wit, H.; de Hill, M.N.; Hillard, C.J. Endocannabinoid signalling: Has it got rhythm? Br. J. Pharmacol. 2010, 160, 530–543. [Google Scholar] [CrossRef] [PubMed]
- Kohsaka, A.; Laposky, A.D.; Ramsey, K.M.; Estrada, C.; Joshu, C.; Kobayashi, Y.; Turek, F.W.; Bass, J. High-fat diet disrupts behavioral and molecular circadian rhythms in mice. Cell Metab. 2007, 6, 414–421. [Google Scholar] [CrossRef] [PubMed]
- Bermúdez-Silva, F.J.; Suárez Pérez, J.; Nadal, A.; Rodríguez de Fonseca, F. The role of the pancreatic endocannabinoid system in glucose metabolism. Best Pract. Res. Clin. Endocrinol. Metab. 2009, 23, 87–102. [Google Scholar] [CrossRef] [PubMed]
- Deveaux, V.; Cadoudal, T.; Ichigotani, Y.; Teixeira-Clerc, F.; Louvet, A.; Manin, S.; Nhieu, J.T.-V.; Belot, M.P.; Zimmer, A.; Even, P.; et al. Cannabinoid CB2 receptor potentiates obesity-associated inflammation, insulin resistance and hepatic steatosis. PLoS ONE 2009, 4, e5844. [Google Scholar] [CrossRef] [PubMed]
- Gatta-Cherifi, B.; Cota, D. New insights on the role of the endocannabinoid system in the regulation of energy balance. Int. J. Obes. 2016, 40, 210–219. [Google Scholar] [CrossRef] [PubMed]
- Lamia, K.A.; Storch, K.-F.; Weitz, C.J. Physiological significance of a peripheral tissue circadian clock. Proc. Natl. Acad. Sci. USA 2008, 105, 15172–15177. [Google Scholar] [CrossRef] [PubMed]
- Fukuda, H.; Iritani, N. Diurnal variations of lipogenic enzyme mRNA quantities in rat liver. Biochim. Biophys. Acta 1991, 1086, 261–264. [Google Scholar] [CrossRef]
- Zardoya, R.; Diez, A.; Serradilla, M.C.; Madrid, J.A.; Bautista, J.M.; Garrido-Pertierra, A. Lipogenic activities in rat liver are subjected to circadian rhythms. Rev. Esp. Fisiol. 1994, 50, 239–244. [Google Scholar] [PubMed]
- Pascual, A.C.; Gaveglio, V.L.; Giusto, N.M.; Pasquaré, S.J. Aging modifies the enzymatic activities involved in 2-arachidonoylglycerol metabolism. BioFactors 2013, 39, 209–220. [Google Scholar] [CrossRef] [PubMed]
- Pascual, A.C.; Martín-Moreno, A.M.; Giusto, N.M.; de Ceballos, M.L.; Pasquaré, S.J. Normal aging in rats and pathological aging in human Alzheimer’s disease decrease FAAH activity: Modulation by cannabinoid agonists. Exp. Gerontol. 2014, 60, 92–99. [Google Scholar] [CrossRef] [PubMed]
- Blüher, M.; Engeli, S.; Klöting, N.; Berndt, J.; Fasshauer, M.; Bátkai, S.; Pacher, P.; Schön, M.R.; Jordan, J.; Stumvoll, M. Dysregulation of the peripheral and adipose tissue endocannabinoid system in human abdominal obesity. Diabetes 2006, 55, 3053–3060. [Google Scholar] [CrossRef] [PubMed]
- Díaz-Asensio, C.; Setién, R.; Echevarría, E.; Casis, L.; Casis, E.; Garrido, A.; Casis, O. Type 1 diabetes alters brain cannabinoid receptor expression and phosphorylation status in rats. Horm. Metab. Res. 2008, 40, 454–458. [Google Scholar] [CrossRef] [PubMed]
- You, Y.; Ren, T.; Zhang, S.; Shirima, G.G.; Cheng, Y.; Liu, X. Hypoglycemic effects of Zanthoxylum alkylamides by enhancing glucose metabolism and ameliorating pancreatic dysfunction in streptozotocin-induced diabetic rats. Food Funct. 2015, 6, 3144–3154. [Google Scholar] [CrossRef] [PubMed]
- Mallat, A.; Teixeira-Clerc, F.; Lotersztajn, S. Cannabinoid signaling and liver therapeutics. J. Hepatol. 2013, 59, 891–896. [Google Scholar] [CrossRef] [PubMed]
- Gruden, G.; Barutta, F.; Kunos, G.; Pacher, P. Role of the endocannabinoid system in diabetes and diabetic complications. Br. J. Pharmacol. 2016, 173, 1116–1127. [Google Scholar] [CrossRef] [PubMed]
- Weiss, L.; Zeira, M.; Reich, S.; Har-Noy, M.; Mechoulam, R.; Slavin, S.; Gallily, R. Cannabidiol lowers incidence of diabetes in non-obese diabetic mice. Autoimmunity 2006, 39, 143–151. [Google Scholar] [CrossRef] [PubMed]
- Weiss, L.; Zeira, M.; Reich, S.; Slavin, S.; Raz, I.; Mechoulam, R.; Gallily, R. Cannabidiol arrests onset of autoimmune diabetes in NOD mice. Neuropharmacology 2008, 54, 244–249. [Google Scholar] [CrossRef] [PubMed]
- Burstein, S. Cannabidiol (CBD) and its analogs: A review of their effects on inflammation. Bioorg. Med. Chem. 2015, 23, 1377–1385. [Google Scholar] [CrossRef] [PubMed]
- Pfaffl, M.W. A new mathematical model for relative quantification in real-time RT-PCR. Nucleic Acids Res. 2001, 29, e45. [Google Scholar] [CrossRef] [PubMed]
- Schmittgen, T.D.; Livak, K.J. Analyzing real-time PCR data by the comparative CT method. Nat. Protoc. 2008, 3, 1101–1108. [Google Scholar] [CrossRef] [PubMed]
- Balsalobre, A.; Damiola, F.; Schibler, U. A serum shock induces circadian gene expression in mammalian tissue culture cells. Cell 1998, 93, 929–937. [Google Scholar] [CrossRef]
- Damiola, F.; Le Minh, N.; Preitner, N.; Kornmann, B.; Fleury-Olela, F.; Schibler, U. Restricted feeding uncouples circadian oscillators in peripheral tissues from the central pacemaker in the suprachiasmatic nucleus. Genes Dev. 2000, 14, 2950–2961. [Google Scholar] [CrossRef] [PubMed]
- Song, C.; Howlett, A.C. Rat brain cannabinoid receptors are N-linked glycosylated proteins. Life Sci. 1995, 56, 1983–1989. [Google Scholar] [CrossRef]
- Fukudome, Y.; Ohno-Shosaku, T.; Matsui, M.; Omori, Y.; Fukaya, M.; Tsubokawa, H.; Taketo, M.M.; Watanabe, M.; Manabe, T.; Kano, M. Two distinct classes of muscarinic action on hippocampal inhibitory synapses: M2-mediated direct suppression and M1/M3-mediated indirect suppression through endocannabinoid signalling. Eur. J. Neurosci. 2004, 19, 2682–2692. [Google Scholar] [CrossRef] [PubMed]
- Kallendrusch, S.; Hobusch, C.; Ehrlich, A.; Ziebell, S.; Ueda, N.; Geisslinger, G.; Koch, M.; Dehghani, F. Site-specific and time-dependent activation of the endocannabinoid system after transection of long-range projections. PLoS ONE 2012, 7, e33537. [Google Scholar] [CrossRef] [PubMed]


| Gene | Forward Primer (5’–3’) | Reverse Primer (5’–3’) | Amplicon Size (bp) | GenBank ID |
|---|---|---|---|---|
| Cnr1 | AGGAGCAAGGACCTGAGACA | TAACGGTGCTCTTGATGCAG | 166 | NM_012784.4 |
| Cnr2 | AGGTTGCATTCCCAACAGAC | TTAGTTCCTCTGGGCAATGG | 170 | NM_001164143.2 |
| β-actin | ACTCCTACGTGGGCGACGAGG | CAGGTCCAGACGCAGGATGGC | 389 | NM_031144 |
© 2017 by the authors. Licensee MDPI, Basel, Switzerland. This article is an open access article distributed under the terms and conditions of the Creative Commons Attribution (CC BY) license (http://creativecommons.org/licenses/by/4.0/).
Share and Cite
Bazwinsky-Wutschke, I.; Zipprich, A.; Dehghani, F. Daytime-Dependent Changes of Cannabinoid Receptor Type 1 and Type 2 Expression in Rat Liver. Int. J. Mol. Sci. 2017, 18, 1844. https://doi.org/10.3390/ijms18091844
Bazwinsky-Wutschke I, Zipprich A, Dehghani F. Daytime-Dependent Changes of Cannabinoid Receptor Type 1 and Type 2 Expression in Rat Liver. International Journal of Molecular Sciences. 2017; 18(9):1844. https://doi.org/10.3390/ijms18091844
Chicago/Turabian StyleBazwinsky-Wutschke, Ivonne, Alexander Zipprich, and Faramarz Dehghani. 2017. "Daytime-Dependent Changes of Cannabinoid Receptor Type 1 and Type 2 Expression in Rat Liver" International Journal of Molecular Sciences 18, no. 9: 1844. https://doi.org/10.3390/ijms18091844
APA StyleBazwinsky-Wutschke, I., Zipprich, A., & Dehghani, F. (2017). Daytime-Dependent Changes of Cannabinoid Receptor Type 1 and Type 2 Expression in Rat Liver. International Journal of Molecular Sciences, 18(9), 1844. https://doi.org/10.3390/ijms18091844