
Folic Acid Supplementation Delays Atherosclerotic Lesion Development by Modulating MCP1 and VEGF DNA Methylation Levels In Vivo and In Vitro

Abstract
:
1. Introduction
2. Results
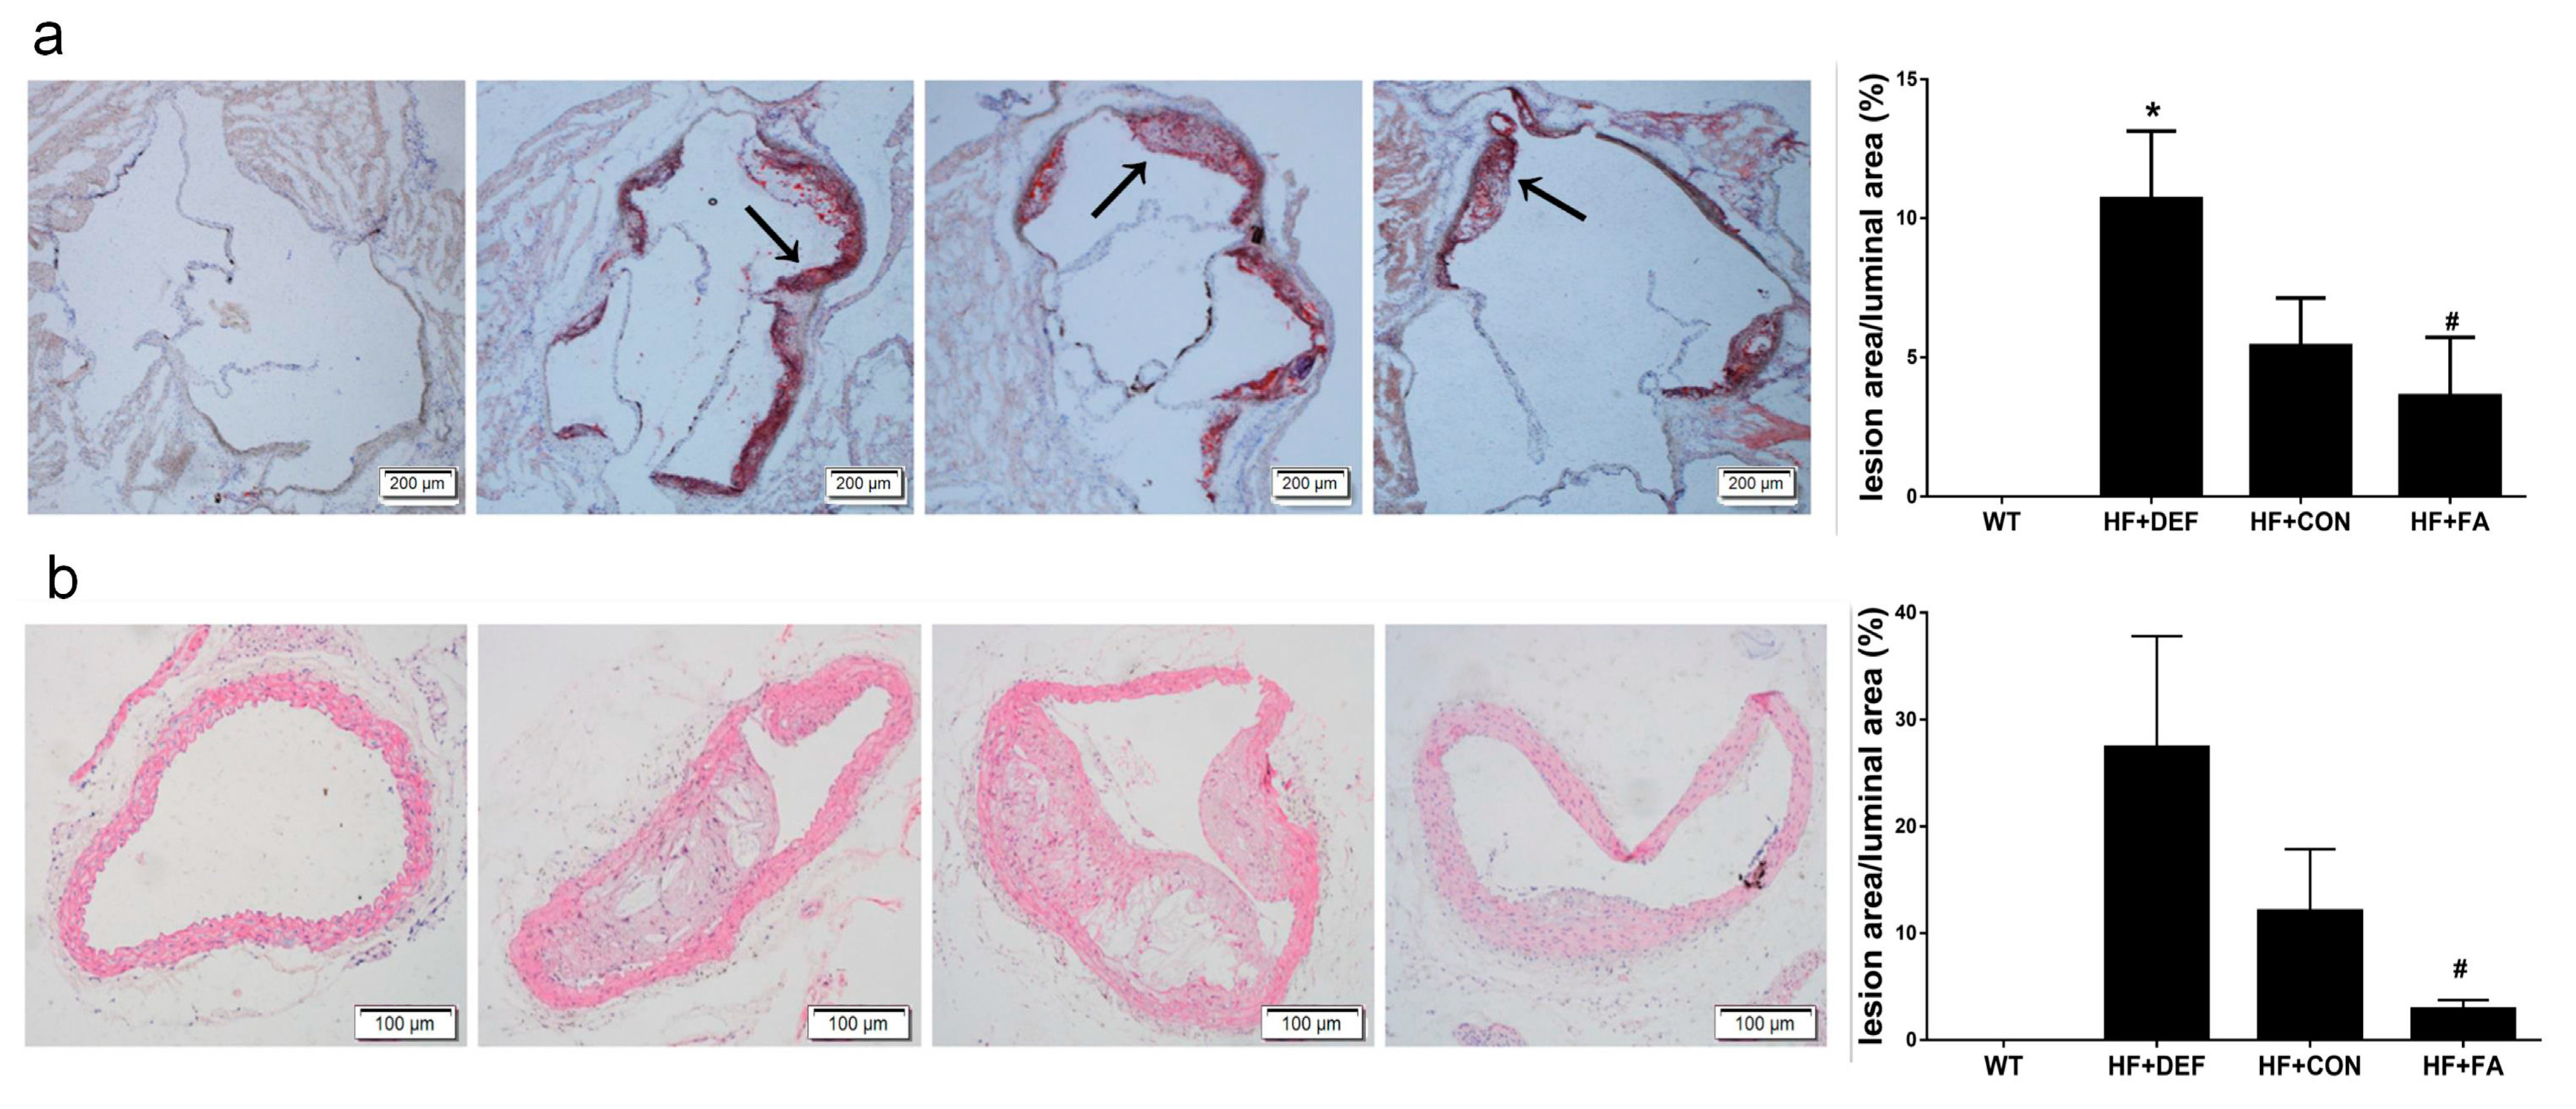
2.1. Folic Acid Attenuates the Development of Atherosclerotic Lesions in ApoE−/− Mice
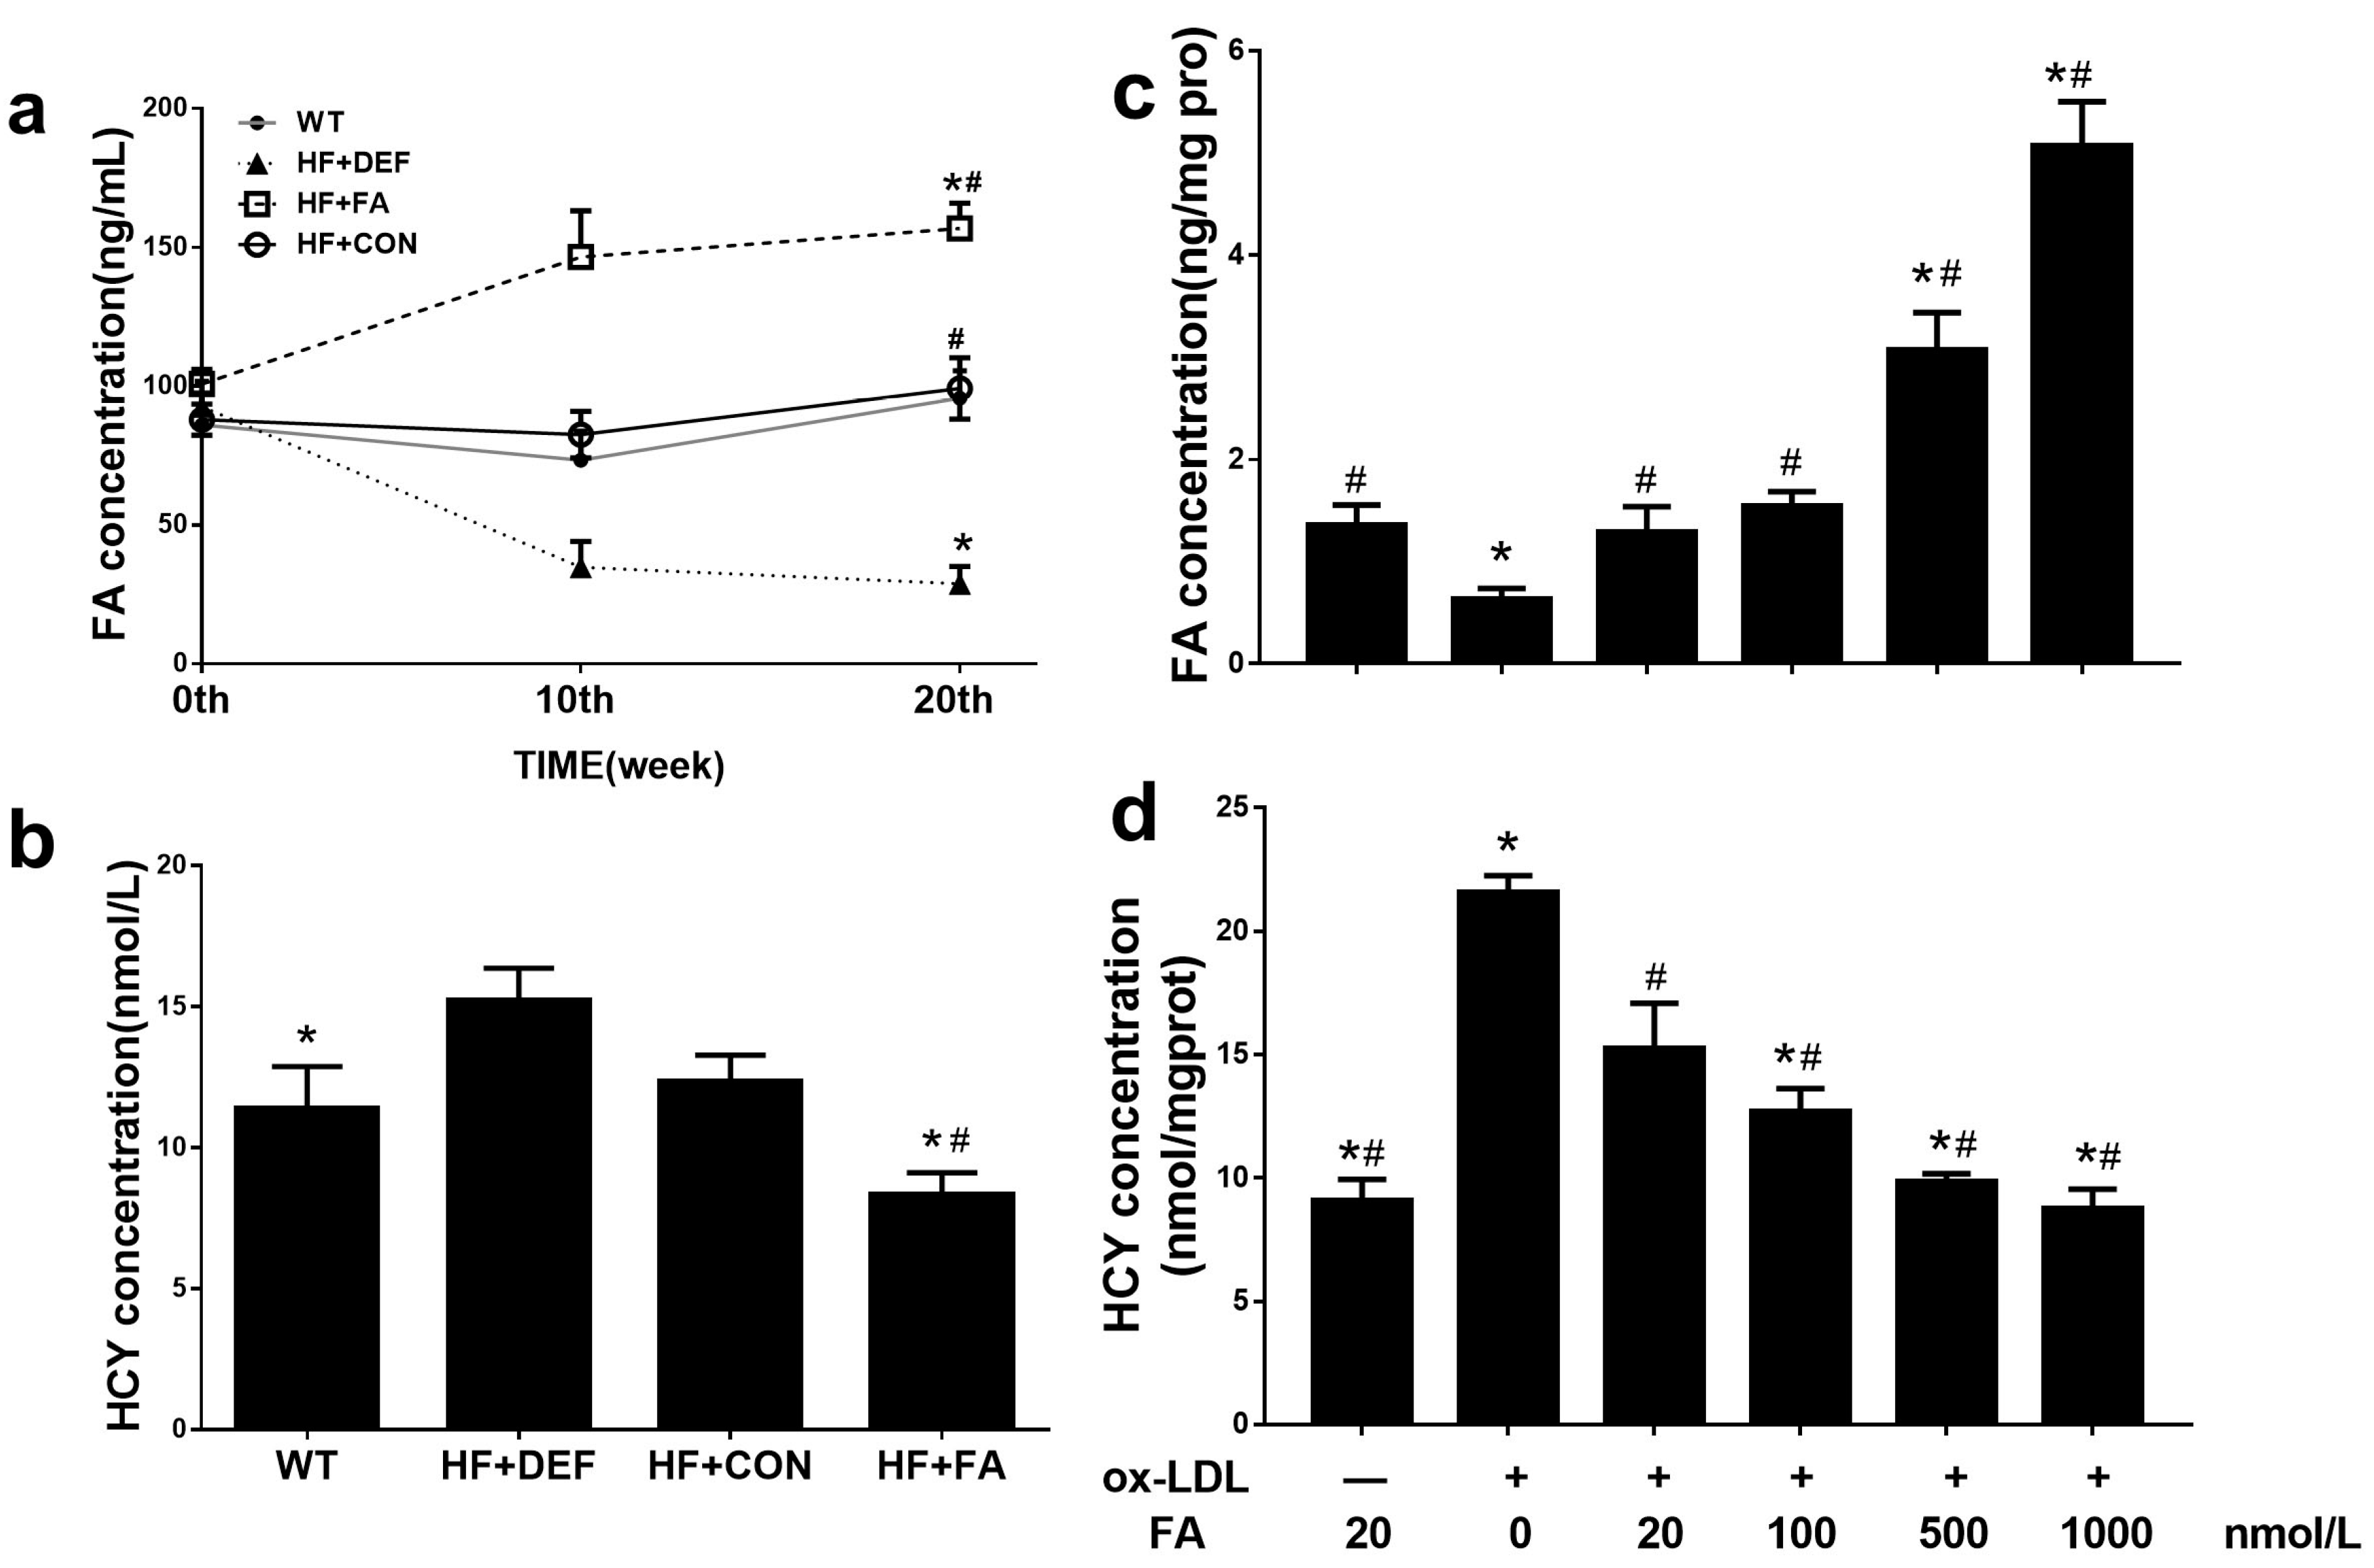
2.2. Supplementation with Folic Acid Raises the Folate Concentration and Decreases Homocysteine Concentration In Vivo and In Vitro
2.3. Folic Acid Does Not Alter Body Weight or the Amount of Food Intake in ApoE−/− Mice, but Reduces the Concentration of Serum Total Cholesterol
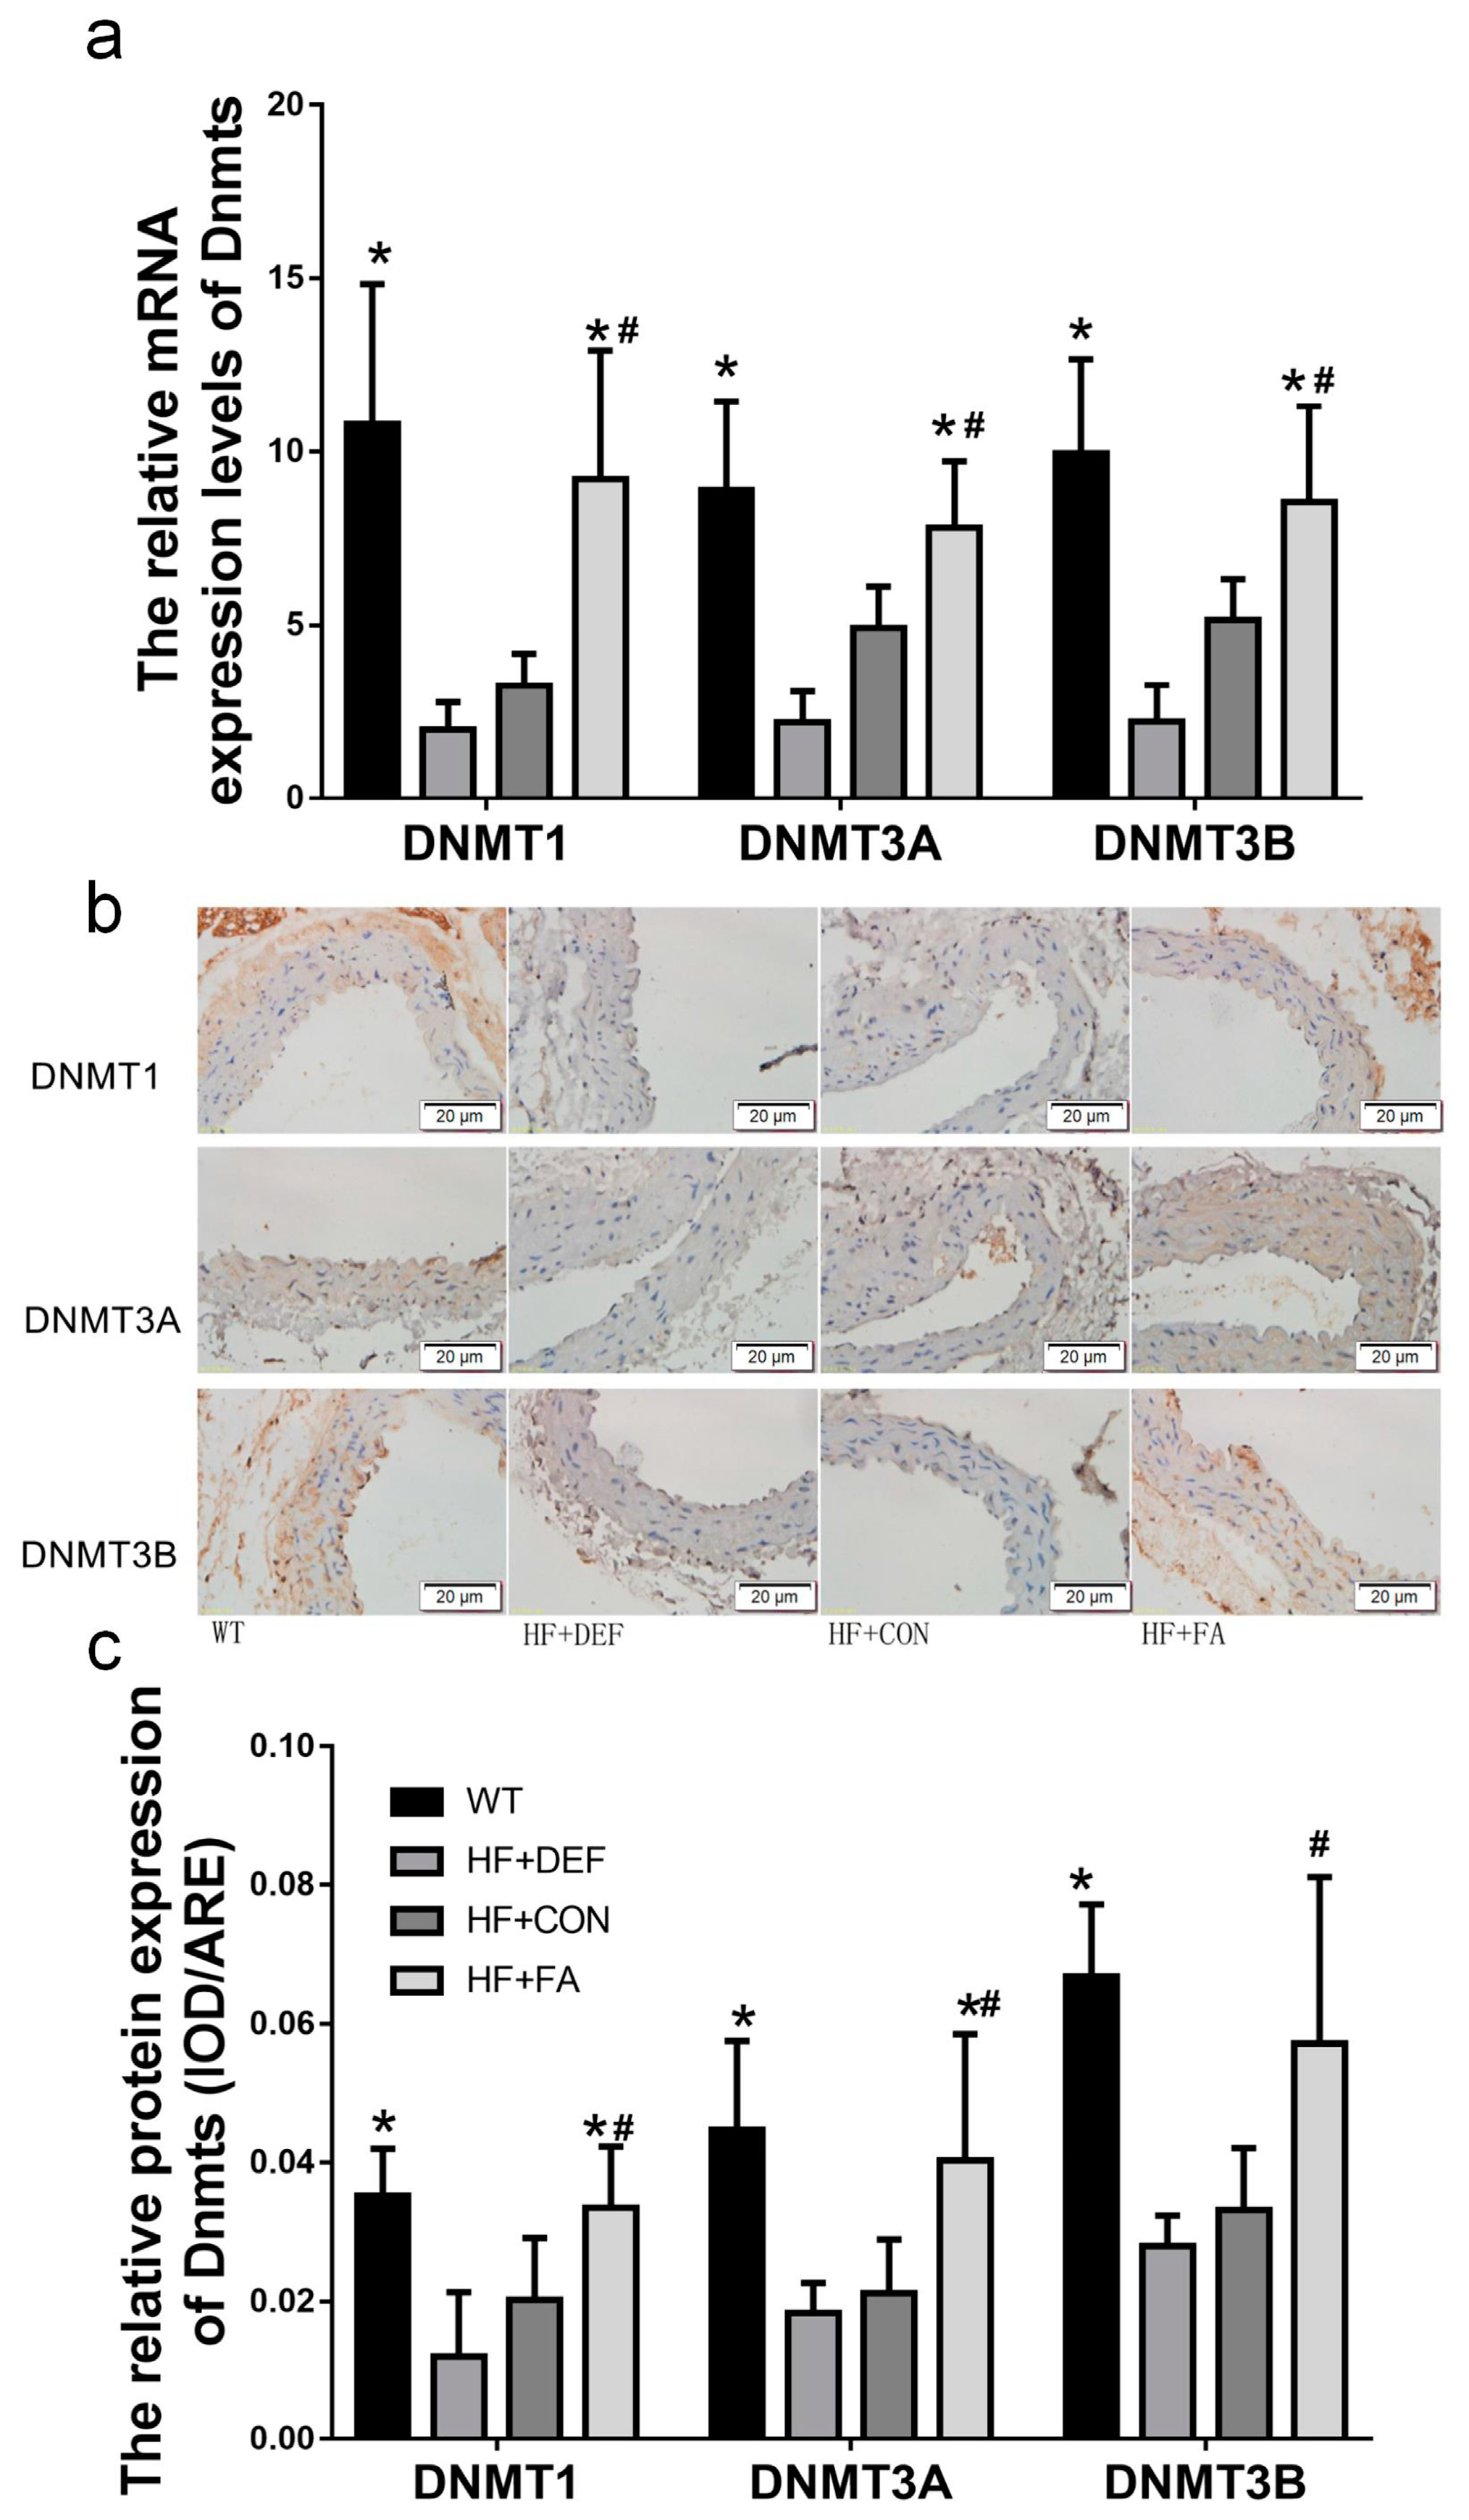
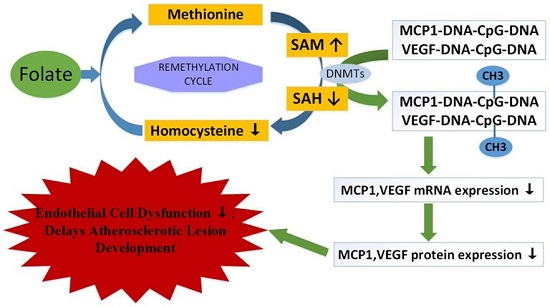
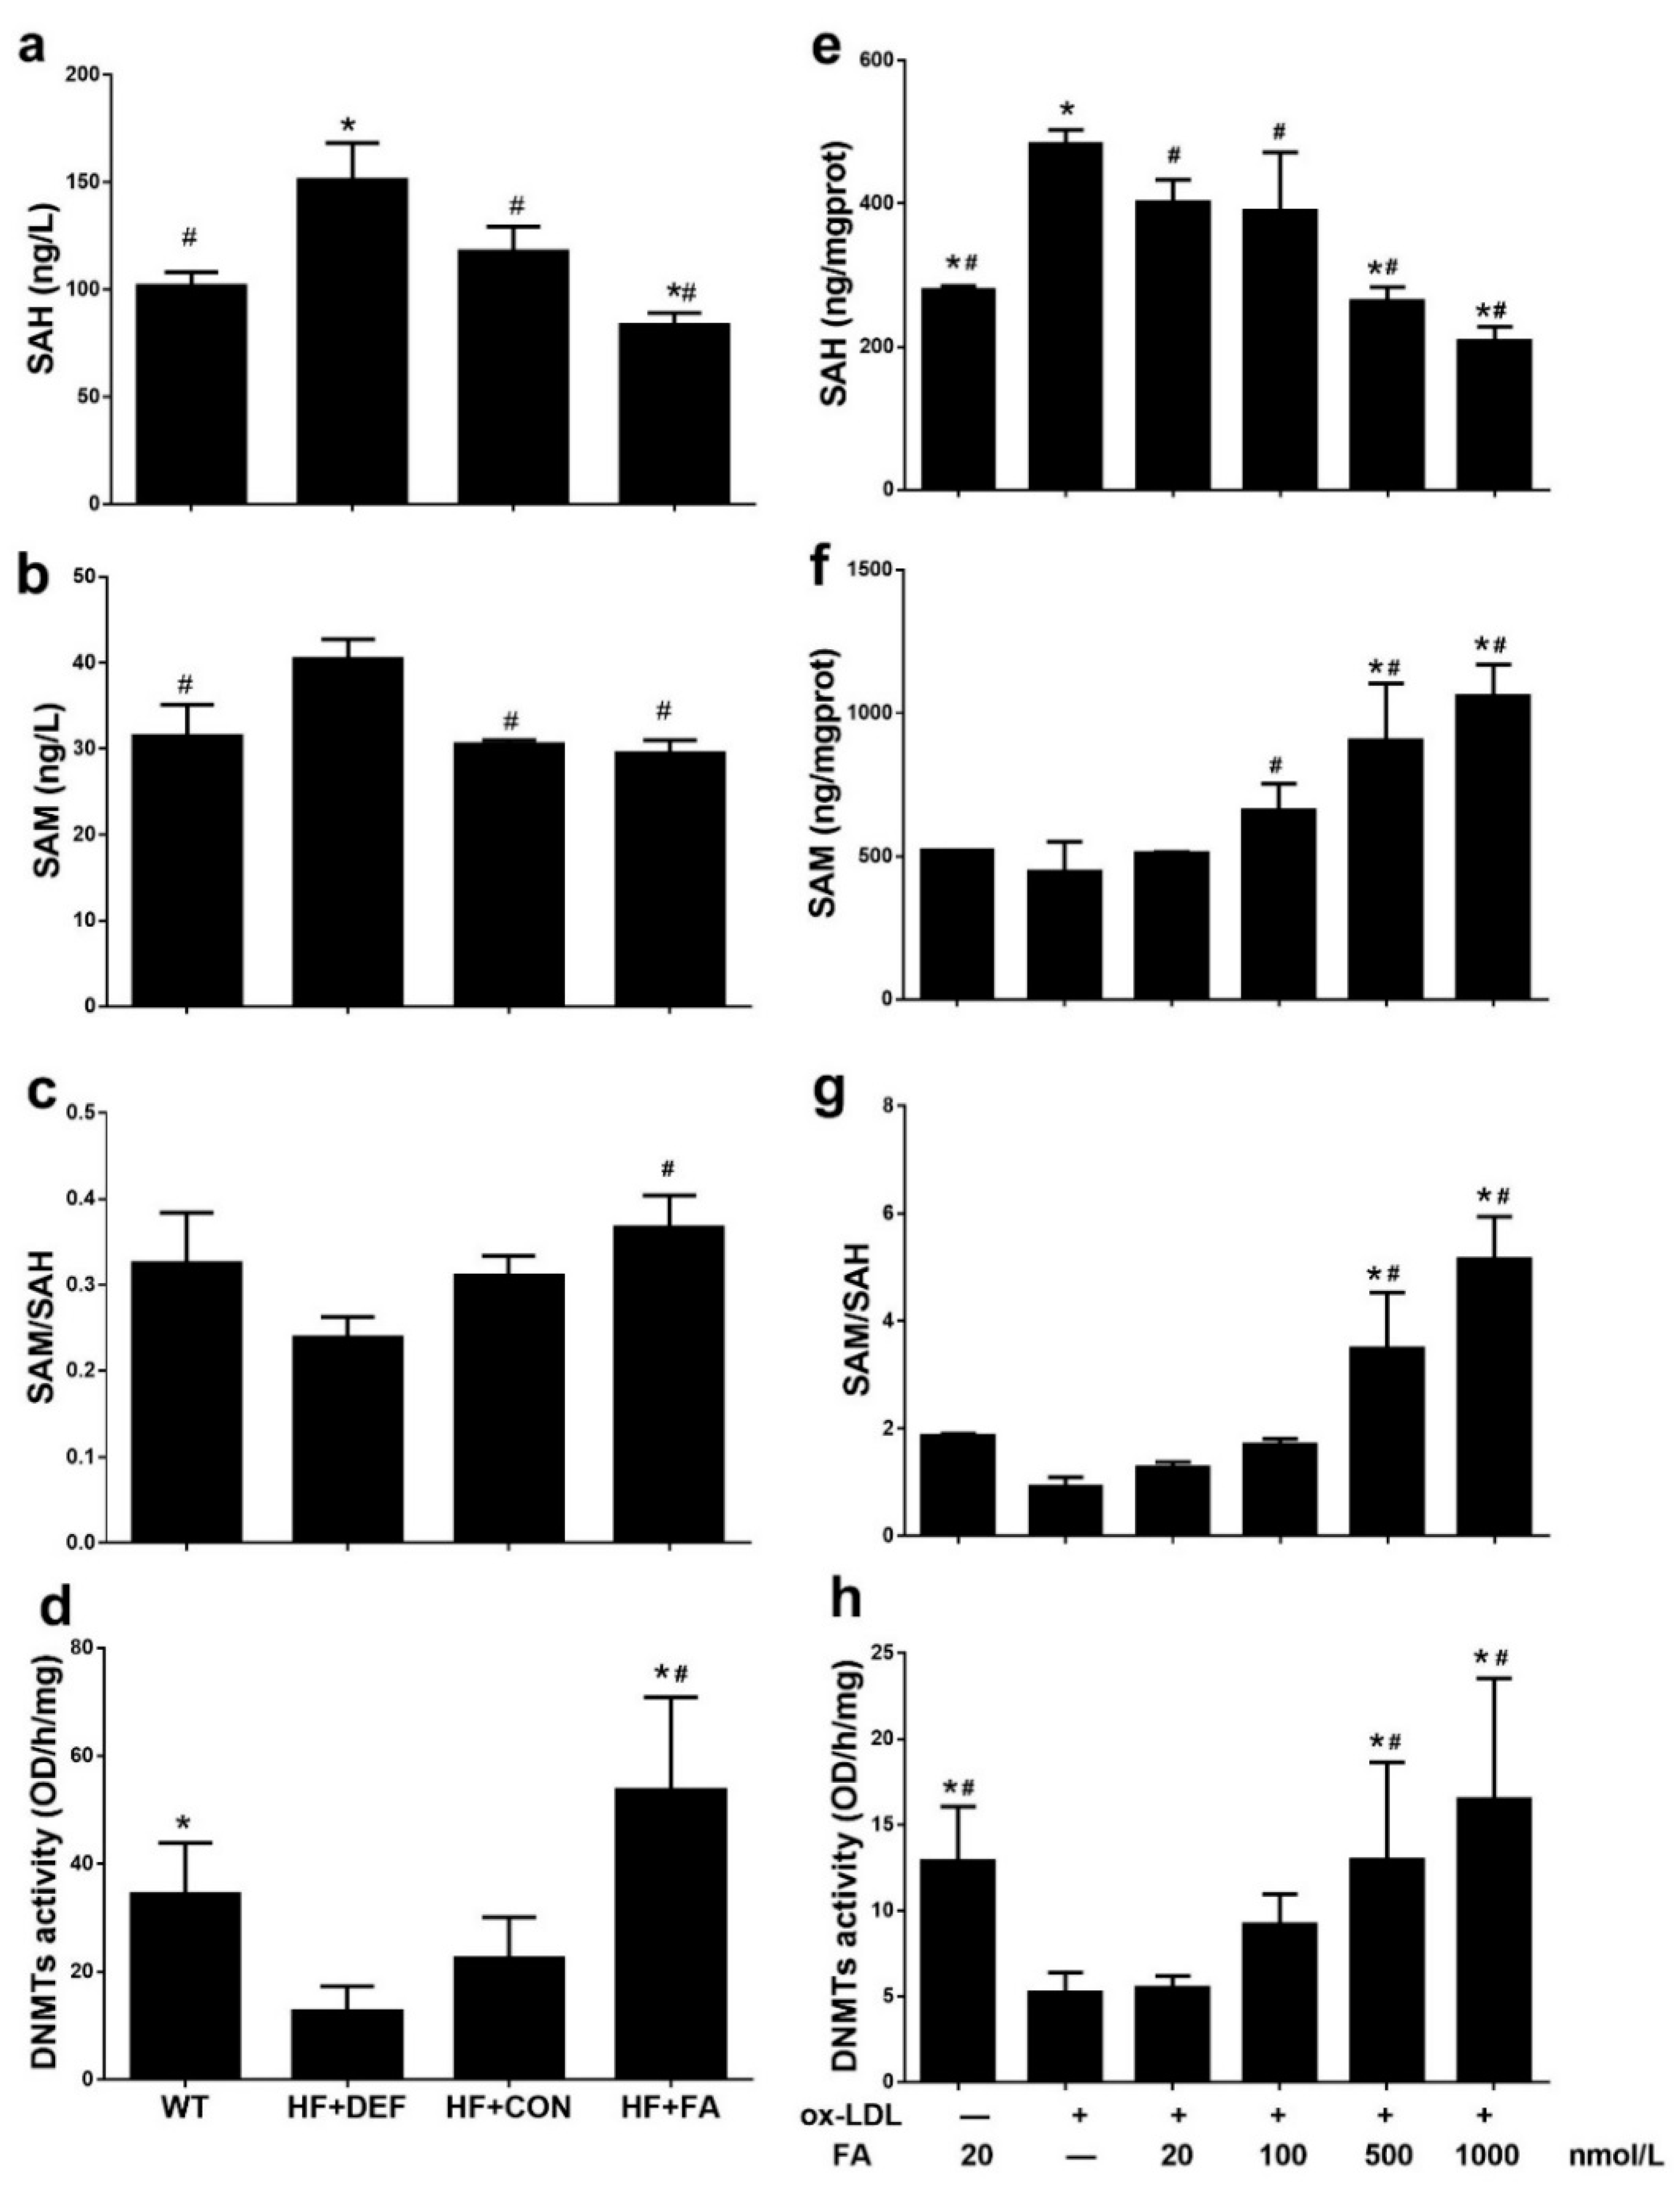
2.4. Folic Acid Increases DNMT Expression, Activity, and Methylation Potential
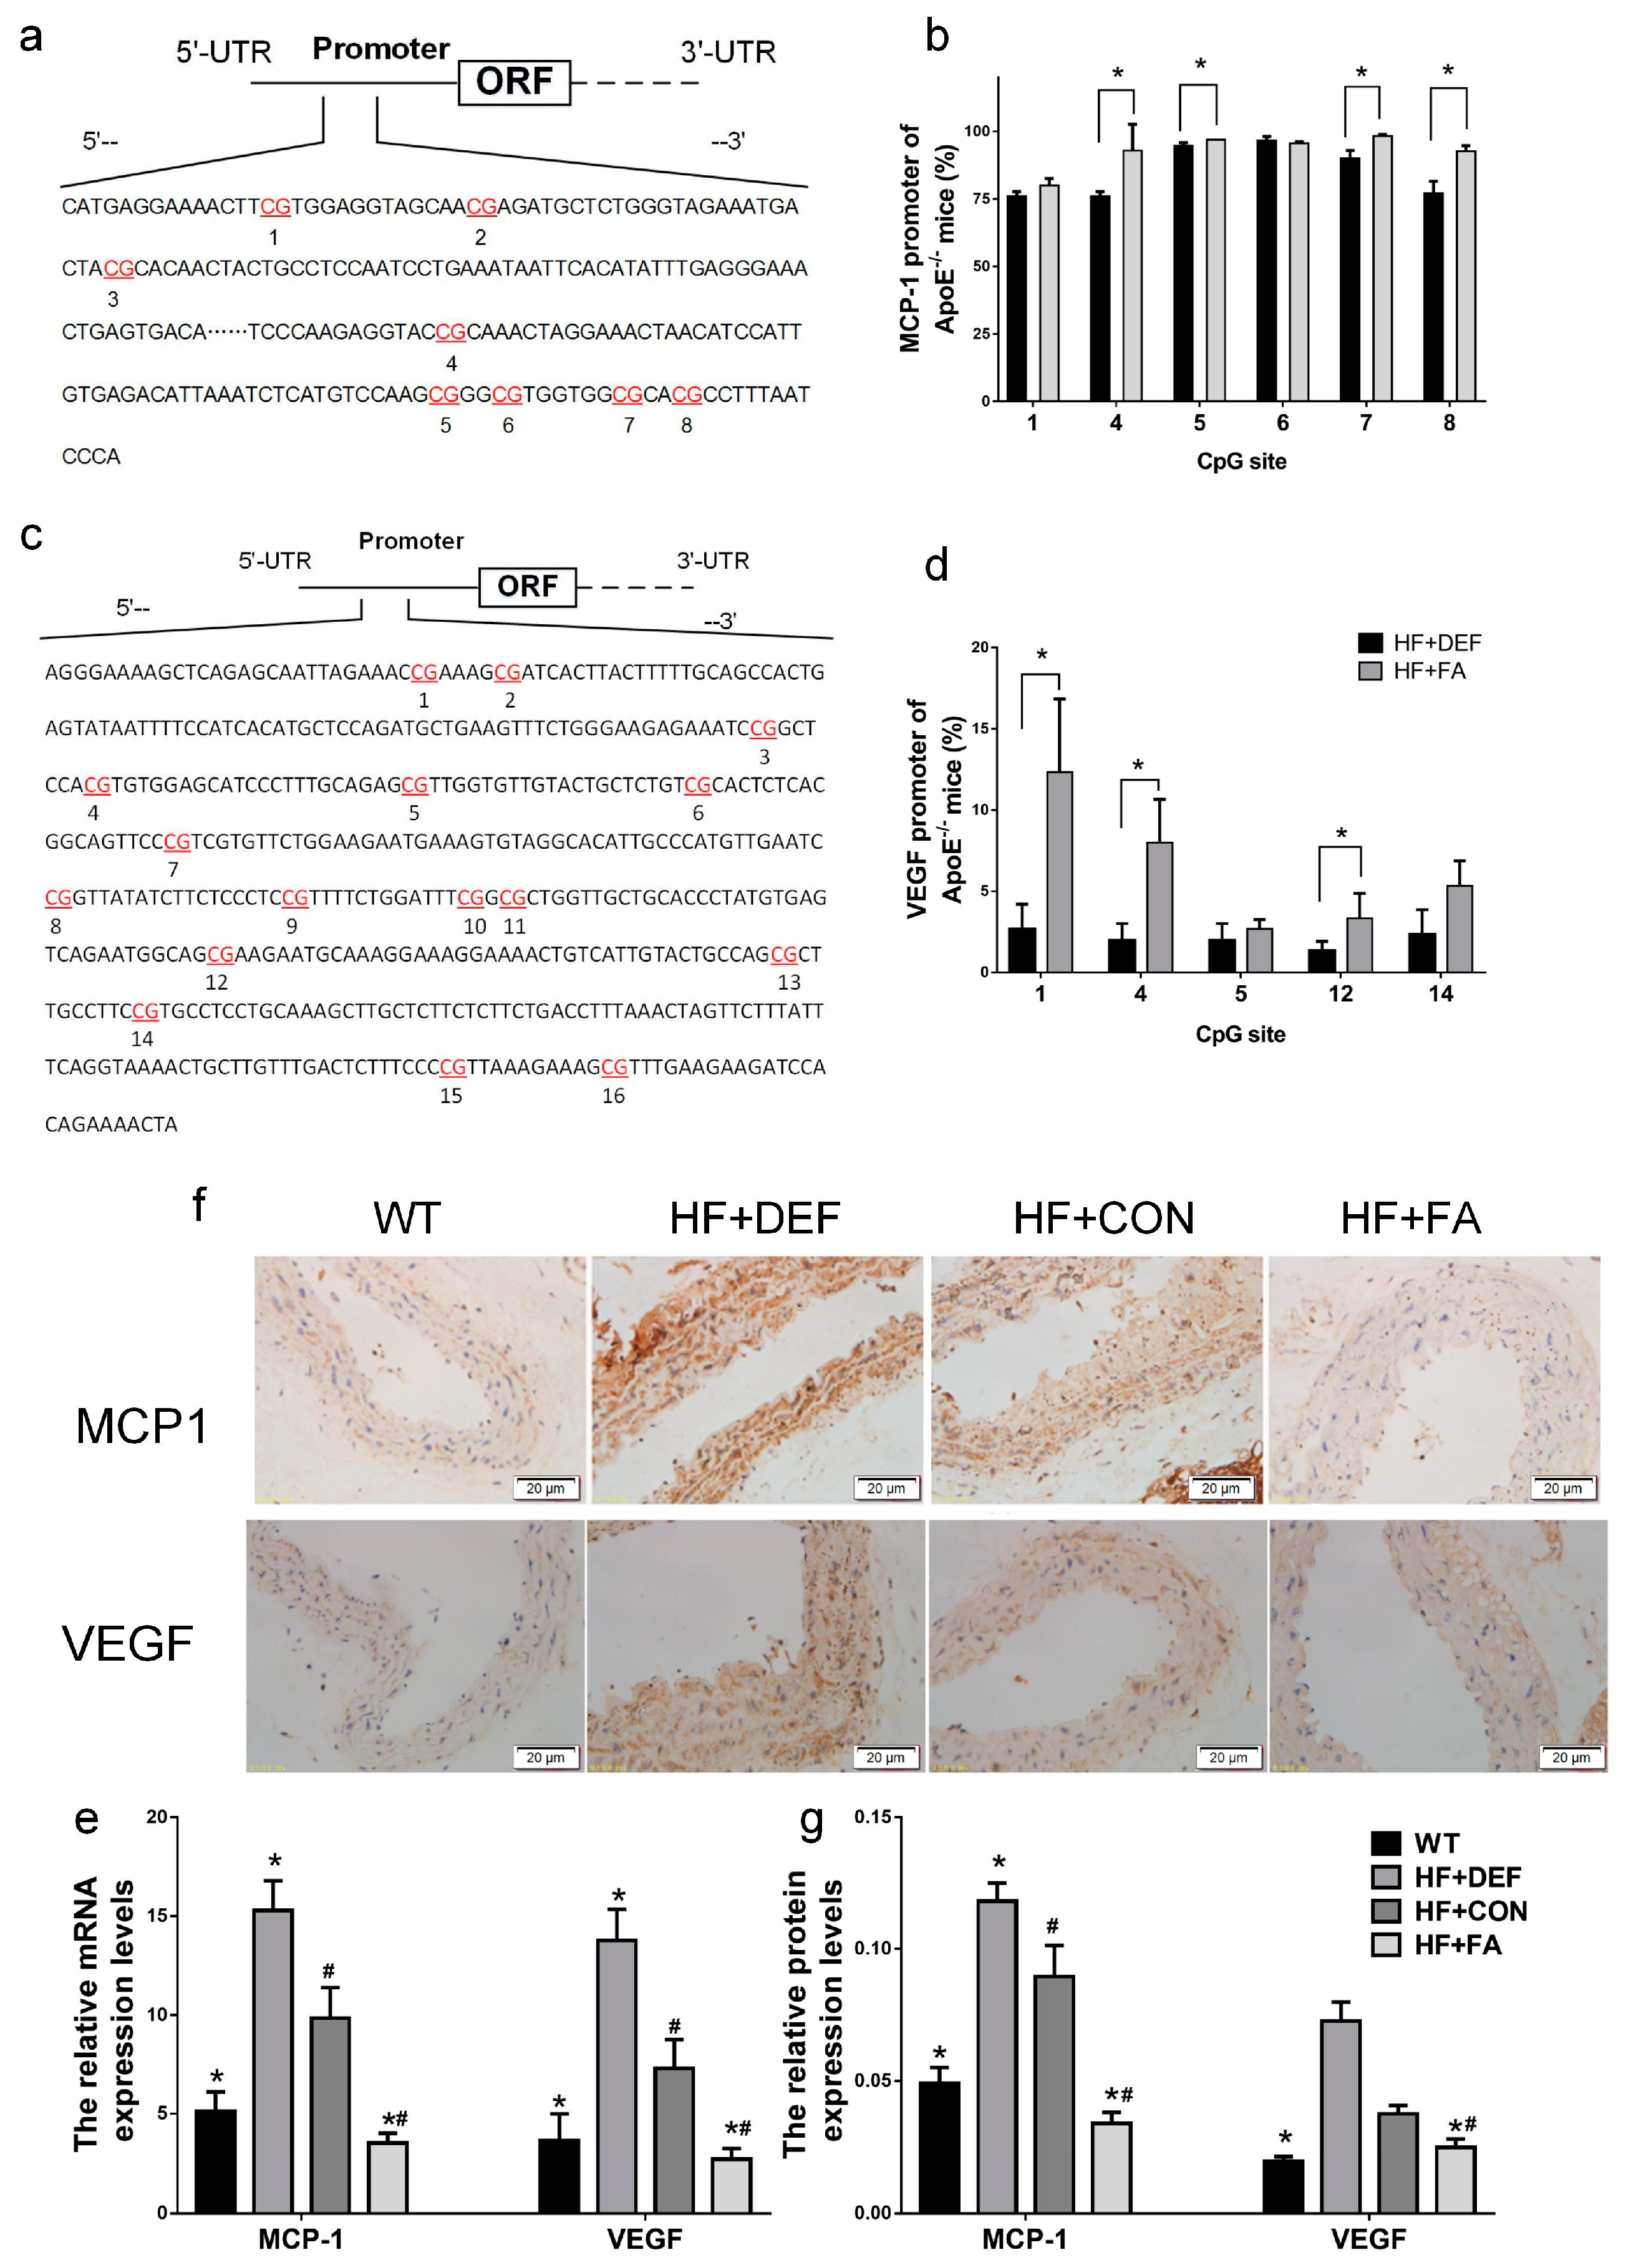
2.5. Folic Acid Ameliorates MCP1 and VEGF Methylation Levels and Expression In Vivo and In Vitro
3. Discussion
4. Materials and Methods
4.1. Animals, Diets, and Experimental Procedures
4.2. HUVECs Culture
4.3. Histomorphometric Analysis of Plaque Morphology
4.4. Assessment of Folate Levels in Serum and Cells
4.5. Assessment of HCY Levels in Serum and Cells
4.6. DNMT Activity Assay
4.7. Methylation Potential Assay
4.8. Real-Time PCR Analysis
4.9. Immunohistochemistry
4.10. MCP1 and VEGF Promoter Methylation Analyses
4.11. Plasma Lipid Parameters Analysis
4.12. Statistical Analysis
5. Conclusions
Acknowledgments
Author Contributions
Conflicts of Interest
Abbreviations
| ApoE −/− | Apolipoprotein E-deficient |
| AS | Atherosclerosis |
| BSA | Bovine serum albumin |
| CVDs | Cardiovascular diseases |
| CHD | Coronary heart disease |
| DNMTs | DNA methyltransferases |
| DNMT1 | DNA methyltransferase 1 |
| DNMT3A | DNA methyltransferase 3 alpha |
| DNMT3B | DNA methyltransferase 3 beta |
| FA | Folic acid |
| HCY | Homocysteine |
| HE | Hematoxylin and eosin |
| HF | High fat diet (fed) |
| HUVECs | Human umbilical vein endothelial cells |
| MALDI-TOF | Matrix-assisted laser desorption/ionization time-of-flight |
| MCP1 | Monocyte chemotactic protein-1 |
| OD | Optical density |
| Ox-LDL | Oxidized low-density lipoprotein |
| PBS | Phosphate buffered saline |
| PCR | Polymerase chain reaction |
| SAH | S-adenosylhomocysteine |
| SAM | S-adenosylmethionine |
| TBST | Tris-buffered saline Tween 20 |
| TC | Total cholesterol |
| TG | Triglyceride |
| VEGF | Vascular endothelial growth factor |
References
- Vos, T.; Barber, R.M.; Bell, B.; Bertozzi-Villa, A.; Biryukov, S.; Bolliger, I.; Charlson, F.; Davis, A.; Degenhardt, L.; Dicker, D.; et al. Global, regional, and national incidence, prevalence, and years lived with disability for 301 acute and chronic diseases and injuries in 188 countries, 1990–2013: A systematic analysis for the global burden of disease study 2013. Lancet 2015, 386, 743–800. [Google Scholar] [CrossRef]
- Libby, P. Inflammation in atherosclerosis. Nature 2002, 420, 868–874. [Google Scholar] [CrossRef] [PubMed]
- Rollins, B.J.; Yoshimura, T.; Leonard, E.J.; Pober, J.S. Cytokine-activated human endothelial cells synthesize and secrete a monocyte chemoattractant, MCP-1/JE. Am. J. Pathol. 1990, 136, 1229–1233. [Google Scholar] [PubMed]
- Schiopu, A.; Bengtsson, E.; Goncalves, I.; Nilsson, J.; Fredrikson, G.N.; Bjorkbacka, H. Associations between macrophage colony-stimulating factor and monocyte chemotactic protein 1 in plasma and first-time coronary events: A nested case-control study. J. Am. Heart Assoc. 2016, 5, e002851. [Google Scholar] [CrossRef] [PubMed]
- Zaina, S.; Heyn, H.; Carmona, F.J.; Varol, N.; Sayols, S.; Condom, E.; Ramirez-Ruz, J.; Gomez, A.; Goncalves, I.; Moran, S.; et al. DNA methylation map of human atherosclerosis. Circ. Cardiovasc. Genet. 2014, 7, 692–700. [Google Scholar] [CrossRef] [PubMed]
- Udali, S.; Guarini, P.; Moruzzi, S.; Choi, S.W.; Friso, S. Cardiovascular epigenetics: From DNA methylation to micrornas. Mol. Asp. Med. 2013, 34, 883–901. [Google Scholar] [CrossRef] [PubMed]
- Schiano, C.; Vietri, M.T.; Grimaldi, V.; Picascia, A.; De Pascale, M.R.; Napoli, C. Epigenetic-related therapeutic challenges in cardiovascular disease. Trends Pharmacol. Sci. 2015, 36, 226–235. [Google Scholar] [CrossRef] [PubMed]
- Okano, M.; Bell, D.W.; Haber, D.A.; Li, E. DNA methyltransferases DNMT3A and DNMT3B are essential for de novo methylation and mammalian development. Cell 1999, 99, 247–257. [Google Scholar] [CrossRef]
- Wang, J.; Jiang, Y.; Yang, A.; Sun, W.; Ma, C.; Ma, S.; Gong, H.; Shi, Y.; Wei, J. Hyperhomocysteinemia-induced monocyte chemoattractant protein-1 promoter DNA methylation by nuclear factor-κB/DNA methyltransferase 1 in apolipoprotein E-deficient mice. BioRes. Open Access 2013, 2, 118–127. [Google Scholar] [CrossRef] [PubMed]
- Kim, J.Y.; Hwang, J.H.; Zhou, W.; Shin, J.; Noh, S.M.; Song, I.S.; Kim, J.Y.; Lee, S.H.; Kim, J. The expression of VEGF receptor genes is concurrently influenced by epigenetic gene silencing of the genes and VEGF activation. Epigenetics 2009, 4, 313–321. [Google Scholar] [CrossRef] [PubMed]
- Yang, H.T.; Lee, M.; Hong, K.S.; Ovbiagele, B.; Saver, J.L. Efficacy of folic acid supplementation in cardiovascular disease prevention: An updated meta-analysis of randomized controlled trials. Eur. J. Intern. Med. 2012, 23, 745–754. [Google Scholar] [CrossRef] [PubMed]
- Wang, L.; Li, H.; Zhou, Y.; Jin, L.; Liu, J. Low-dose B vitamins supplementation ameliorates cardiovascular risk: A double-blind randomized controlled trial in healthy Chinese elderly. Eur. J. Nutr. 2015, 54, 455–464. [Google Scholar] [CrossRef] [PubMed]
- Geng, Y.; Gao, R.; Chen, X.; Liu, X.; Liao, X.; Li, Y.; Liu, S.; Ding, Y.; Wang, Y.; He, J. Folate deficiency impairs decidualization and alters methylation patterns of the genome in mice. Mol. Hum. Reprod. 2015, 21, 844–856. [Google Scholar] [CrossRef] [PubMed]
- Crider, K.S.; Yang, T.P.; Berry, R.J.; Bailey, L.B. Folate and DNA methylation: A review of molecular mechanisms and the evidence for folate’s role. Adv. Nutr. 2012, 3, 21–38. [Google Scholar] [CrossRef] [PubMed]
- Mandaviya, P.R.; Stolk, L.; Heil, S.G. Homocysteine and DNA methylation: A review of animal and human literature. Mol. Genet. Metab. 2014, 113, 243–252. [Google Scholar] [CrossRef] [PubMed]
- Fiorito, G.; Guarrera, S.; Valle, C.; Ricceri, F.; Russo, A.; Grioni, S.; Mattiello, A.; di Gaetano, C.; Rosa, F.; Modica, F.; et al. B-vitamins intake, DNA-methylation of one carbon metabolism and homocysteine pathway genes and myocardial infarction risk: The epicor study. Nutr. Metab. Cardiovasc. Dis. 2014, 24, 483–488. [Google Scholar] [CrossRef] [PubMed]
- Yang, Q.; Botto, L.D.; Erickson, J.D.; Berry, R.J.; Sambell, C.; Johansen, H.; Friedman, J.M. Improvement in stroke mortality in canada and the united states, 1990 to 2002. Circulation 2006, 113, 1335–1343. [Google Scholar] [CrossRef] [PubMed]
- Bentley, T.G.; Weinstein, M.C.; Willett, W.C.; Kuntz, K.M. A cost-effectiveness analysis of folic acid fortification policy in the United States. Public Health Nutr. 2009, 12, 455–467. [Google Scholar] [CrossRef] [PubMed]
- Mierzecki, A.; Kloda, K.; Bukowska, H.; Chelstowski, K.; Makarewicz-Wujec, M.; Kozlowska-Wojciechowska, M. Association between low-dose folic acid supplementation and blood lipids concentrations in male and female subjects with atherosclerosis risk factors. Med. Sci. Monit. 2013, 19, 733–739. [Google Scholar] [PubMed]
- Voutilainen, S.; Rissanen, T.H.; Virtanen, J.; Lakka, T.A.; Salonen, J.T. Kuopio Ischemic Heart Disease Risk Factor Study. Low dietary folate intake is associated with an excess incidence of acute coronary events: The kuopio ischemic heart disease risk factor study. Circulation 2001, 103, 2674–2680. [Google Scholar] [CrossRef] [PubMed]
- Rimm, E.B.; Willett, W.C.; Hu, F.B.; Sampson, L.; Colditz, G.A.; Manson, J.E.; Hennekens, C.; Stampfer, M.J. Folate and vitamin B6 from diet and supplements in relation to risk of coronary heart disease among women. JAMA 1998, 279, 359–364. [Google Scholar] [CrossRef] [PubMed]
- Zhou, Y.H.; Tang, J.Y.; Wu, M.J.; Lu, J.; Wei, X.; Qin, Y.Y.; Wang, C.; Xu, J.F.; He, J. Effect of folic acid supplementation on cardiovascular outcomes: A systematic review and meta-analysis. PLoS ONE 2011, 6, e25142. [Google Scholar] [CrossRef] [PubMed]
- Lee, M.; Hong, K.S.; Chang, S.C.; Saver, J.L. Efficacy of homocysteine-lowering therapy with folic acid in stroke prevention: A meta-analysis. Stroke 2010, 41, 1205–1212. [Google Scholar] [CrossRef] [PubMed]
- Lin, J.; Kakkar, V.; Lu, X. Impact of MCP-1 in atherosclerosis. Curr. Pharm. Des. 2014, 20, 4580–4588. [Google Scholar] [CrossRef] [PubMed]
- Boring, L.; Gosling, J.; Cleary, M.; Charo, I.F. Decreased lesion formation in CCR2−/− mice reveals a role for chemokines in the initiation of atherosclerosis. Nature 1998, 394, 894–897. [Google Scholar] [CrossRef] [PubMed]
- Feng, D.; Zhou, Y.; Xia, M.; Ma, J. Folic acid inhibits lipopolysaccharide-induced inflammatory response in raw264.7 macrophages by suppressing MAPKs and NK-κB activation. Inflamm. Res. 2011, 60, 817–822. [Google Scholar] [CrossRef] [PubMed]
- Chiarello, P.G.; Penaforte, F.R.; Japur, C.C.; Souza, C.D.; Vannucchi, H.; Troncon, L.E. Increased folate intake with no changes in serum homocysteine and decreased levels of C-reactive protein in patients with inflammatory bowel diseases. Dig. Dis. Sci. 2009, 54, 627–633. [Google Scholar] [CrossRef] [PubMed]
- Sahinarslan, A.; Kocaman, S.A.; Topal, S.; Ercin, U.; Bukan, N.; Timurkaynak, T. The relation of serum monocyte chemoattractant protein-1 level with coronary atherosclerotic burden and collateral degree in stable coronary artery disease. Turk Kardiyol. Dern. Arsivi 2011, 39, 269–275. [Google Scholar] [CrossRef] [PubMed]
- Suehiro, J.; Kanki, Y.; Makihara, C.; Schadler, K.; Miura, M.; Manabe, Y.; Aburatani, H.; Kodama, T.; Minami, T. Genome-wide approaches reveal functional vascular endothelial growth factor (VEGF)-inducible nuclear factor of activated T cells (NFAT) c1 binding to angiogenesis-related genes in the endothelium. J. Biol. Chem. 2014, 289, 29044–29059. [Google Scholar] [CrossRef] [PubMed]
- Liu, X.L.; Zhang, P.F.; Ding, S.F.; Wang, Y.; Zhang, M.; Zhao, Y.X.; Ni, M.; Zhang, Y. Local gene silencing of monocyte chemoattractant protein-1 prevents vulnerable plaque disruption in apolipoprotein E-knockout mice. PLoS ONE 2012, 7, e33497. [Google Scholar] [CrossRef] [PubMed]
- Vuorio, T.; Jauhiainen, S.; Yla-Herttuala, S. Pro- and anti-angiogenic therapy and atherosclerosis with special emphasis on vascular endothelial growth factors. Expert Opin. Biol. Ther. 2012, 12, 79–92. [Google Scholar] [CrossRef] [PubMed]
- Wojtala, M.; Pirola, L.; Balcerczyk, A. Modulation of the vascular endothelium functioning by dietary components, the role of epigenetics. Biofactors 2017, 43, 5–16. [Google Scholar] [CrossRef] [PubMed]
- Adaikalakoteswari, A.; Finer, S.; Voyias, P.D.; McCarthy, C.M.; Vatish, M.; Moore, J.; Smart-Halajko, M.; Bawazeer, N.; Al-Daghri, N.M.; McTernan, P.G.; et al. Vitamin B12 insufficiency induces cholesterol biosynthesis by limiting S-adenosylmethionine and modulating the methylation of SREBF1 and LDLR genes. Clin. Epigenetics 2015, 7, 14. [Google Scholar] [CrossRef] [PubMed]
- Hai, Z.; Zuo, W. Aberrant DNA methylation in the pathogenesis of atherosclerosis. Clin. Chim. Acta 2016, 456, 69–74. [Google Scholar] [CrossRef] [PubMed]
- Glier, M.B.; Green, T.J.; Devlin, A.M. Methyl nutrients, DNA methylation, and cardiovascular disease. Mol. Nutr. Food Res. 2014, 58, 172–182. [Google Scholar] [CrossRef] [PubMed]
- Caudill, M.A.; Wang, J.C.; Melnyk, S.; Pogribny, I.P.; Jernigan, S.; Collins, M.D.; Santos-Guzman, J.; Swendseid, M.E.; Cogger, E.A.; James, S.J. Intracellular S-adenosylhomocysteine concentrations predict global DNA hypomethylation in tissues of methyl-deficient cystathionine β-synthase heterozygous mice. J. Nutr. 2001, 131, 2811–2818. [Google Scholar] [PubMed]
- Xiao, Y.; Su, X.; Huang, W.; Zhang, J.; Peng, C.; Huang, H.; Wu, X.; Huang, H.; Xia, M.; Ling, W. Role of S-adenosylhomocysteine in cardiovascular disease and its potential epigenetic mechanism. Int. J. Biochem. Cell Biol. 2015, 67, 158–166. [Google Scholar] [CrossRef] [PubMed]
- Svedruzic, Z.M. Mammalian cytosine DNA methyltransferase DNMT1: Enzymatic mechanism, novel mechanism-based inhibitors, and RNA-directed DNA methylation. Curr. Med. Chem. 2008, 15, 92–106. [Google Scholar] [CrossRef] [PubMed]
- Jafari, S.; Hosseini, M.S.; Hajian, M.; Forouzanfar, M.; Jafarpour, F.; Abedi, P.; Ostadhosseini, S.; Abbasi, H.; Gourabi, H.; Shahverdi, A.H.; et al. Improved in vitro development of cloned bovine embryos using S-adenosylhomocysteine, a non-toxic epigenetic modifying reagent. Mol. Reprod. Dev. 2011, 78, 576–584. [Google Scholar] [CrossRef] [PubMed]
- Li, W.; Liu, H.; Yu, M.; Zhang, X.; Zhang, M.; Wilson, J.X.; Huang, G. Folic acid administration inhibits amyloid β-peptide accumulation in APP/PS1 transgenic mice. J. Nutr. Biochem. 2015, 26, 883–891. [Google Scholar] [CrossRef] [PubMed]
- Hodis, H.N.; Mack, W.J.; Dustin, L.; Mahrer, P.R.; Azen, S.P.; Detrano, R.; Selhub, J.; Alaupovic, P.; Liu, C.R.; Liu, C.H.; et al. High-dose B vitamin supplementation and progression of subclinical atherosclerosis: A randomized controlled trial. Stroke 2009, 40, 730–736. [Google Scholar] [CrossRef] [PubMed]
- Davies, A.R.; Smeeth, L.; Grundy, E.M. Contribution of changes in incidence and mortality to trends in the prevalence of coronary heart disease in the UK: 1996–2005. Eur. Heart J. 2007, 28, 2142–2147. [Google Scholar] [CrossRef] [PubMed]
- Meyer, M.R.; Haas, E.; Barton, M. Gender differences of cardiovascular disease: New perspectives for estrogen receptor signaling. Hypertension 2006, 47, 1019–1026. [Google Scholar] [CrossRef] [PubMed]
- Regitz-Zagrosek, V.; Lehmkuhl, E.; Weickert, M.O. Gender differences in the metabolic syndrome and their role for cardiovascular disease. Clin. Res. Cardiol. 2006, 95, 136–147. [Google Scholar] [CrossRef] [PubMed]
- Stampfer, M.J.; Colditz, G.A. Estrogen replacement therapy and coronary heart disease: A quantitative assessment of the epidemiologic evidence. Prev. Med. 1991, 20, 47–63. [Google Scholar] [CrossRef]
- Caligiuri, G.; Nicoletti, A.; Zhou, X.; Tornberg, I.; Hansson, G.K. Effects of sex and age on atherosclerosis and autoimmunity in ApoE-deficient mice. Atherosclerosis 1999, 145, 301–308. [Google Scholar] [CrossRef]
- Ribas, V.; Drew, B.G.; Le, J.A.; Soleymani, T.; Daraei, P.; Sitz, D.; Mohammad, L.; Henstridge, D.C.; Febbraio, M.A.; Hewitt, S.C.; et al. Myeloid-specific estrogen receptor α deficiency impairs metabolic homeostasis and accelerates atherosclerotic lesion development. Proc. Natl. Acad. Sci. USA 2011, 108, 16457–16462. [Google Scholar] [CrossRef] [PubMed]
- Chalvon-Demersay, T.; Blachier, F.; Tome, D.; Blais, A. Animal models for the study of the relationships between diet and obesity: A focus on dietary protein and estrogen deficiency. Front. Nutr. 2017, 4, 5. [Google Scholar] [CrossRef] [PubMed]
- Han, J.M.; Li, H.; Cho, M.H.; Baek, S.H.; Lee, C.H.; Park, H.Y.; Jeong, T.S. Soy-leaf extract exerts atheroprotective effects via modulation of kruppel-like factor 2 and adhesion molecules. Int. J. Mol. Sci. 2017, 18, 373. [Google Scholar] [CrossRef] [PubMed]
- Peng, J.; Yang, Q.; Li, A.F.; Li, R.Q.; Wang, Z.; Liu, L.S.; Ren, Z.; Zheng, X.L.; Tang, X.Q.; Li, G.H.; et al. Tet methylcytosine dioxygenase 2 inhibits atherosclerosis via upregulation of autophagy in ApoE−/− mice. Oncotarget 2016, 7, 76423–76436. [Google Scholar] [CrossRef] [PubMed]
- Lawrie, A.; Hameed, A.G.; Chamberlain, J.; Arnold, N.; Kennerley, A.; Hopkinson, K.; Pickworth, J.; Kiely, D.G.; Crossman, D.C.; Francis, S.E. Paigen diet-fed apolipoprotein E knockout mice develop severe pulmonary hypertension in an interleukin-1-dependent manner. Am. J. Pathol. 2011, 179, 1693–1705. [Google Scholar] [CrossRef] [PubMed]
- Andres-Manzano, M.J.; Andres, V.; Dorado, B. Oil red O and hematoxylin and eosin staining for quantification of atherosclerosis burden in mouse aorta and aortic root. Methods Mol. Biol. 2015, 1339, 85–99. [Google Scholar] [PubMed]


| Age | Group | Body Weight (g) | TC (mmol/L) | TG (mmol/L) |
|---|---|---|---|---|
| 4 weeks | WT | 22.3 ± 1.6 | 3.2 ± 0.6 * | 1.4 ± 0.5 |
| HF+DEF | 23.2 ± 0.8 | 8.9 ± 1.9 | 1.6 ± 0.5 | |
| HF+CON | 23.3 ± 1.6 | 8.9 ± 1.0 | 1.6 ± 0.7 | |
| HF+FA | 23.0 ± 1.6 | 9.0 ± 2.7 | 1.5 ± 0.4 | |
| 24 weeks | WT | 29.9 ± 3.0 * | 4.5 ± 2.9 * | 2.7 ± 0.6 |
| HF+DEF | 33.4 ± 2.4 | 15.3 ± 3.2 | 3.5 ± 2.9 | |
| HF+CON | 34.5 ± 2.6 | 14.7 ± 3.4 | 3.4 ± 1.5 | |
| HF+FA | 37.2 ± 3.9 | 10.4 ± 2.5 *,# | 3.1 ± 1.8 |
| Gene Name | Primer |
|---|---|
| Mouse-β-actin | Forward: GCTACAGCTTCACCACCACAG Reverse: GGTCTTTACGGATGTCAACGTC |
| Mouse-MCP1 | Forward: GCCTGCTGTTCACAGTTGC Reverse: GGTGATCCTCTTGTAGCTCTCC |
| Mouse-VEGF | Forward: CTTGTTCAGAGCGGAGAAAGC Reverse: ACATCTGCAAGTACGTTCGTT |
| Mouse-DNMT1 | Forward: CCTAGTTCCGTGGCTACGAGGAGAA Reverse: TCTCTCTCCTCTGCAGCCGACTCA |
| Mouse-DNMT3A | Forward: GGCCGAATTGTGTCTTGGTG Reverse: CCATCTCCGAACCACATGAC |
| Mouse-DNMT3B | Forward: TTCAGTGACCAGTCCTCAGACACGAA Reverse: TCAGAAGGCTGGAGACCTCCCTCTT |
© 2017 by the authors. Licensee MDPI, Basel, Switzerland. This article is an open access article distributed under the terms and conditions of the Creative Commons Attribution (CC BY) license (http://creativecommons.org/licenses/by/4.0/).
Share and Cite
Cui, S.; Li, W.; Lv, X.; Wang, P.; Gao, Y.; Huang, G. Folic Acid Supplementation Delays Atherosclerotic Lesion Development by Modulating MCP1 and VEGF DNA Methylation Levels In Vivo and In Vitro. Int. J. Mol. Sci. 2017, 18, 990. https://doi.org/10.3390/ijms18050990
Cui S, Li W, Lv X, Wang P, Gao Y, Huang G. Folic Acid Supplementation Delays Atherosclerotic Lesion Development by Modulating MCP1 and VEGF DNA Methylation Levels In Vivo and In Vitro. International Journal of Molecular Sciences. 2017; 18(5):990. https://doi.org/10.3390/ijms18050990
Chicago/Turabian StyleCui, Shanshan, Wen Li, Xin Lv, Pengyan Wang, Yuxia Gao, and Guowei Huang. 2017. "Folic Acid Supplementation Delays Atherosclerotic Lesion Development by Modulating MCP1 and VEGF DNA Methylation Levels In Vivo and In Vitro" International Journal of Molecular Sciences 18, no. 5: 990. https://doi.org/10.3390/ijms18050990
APA StyleCui, S., Li, W., Lv, X., Wang, P., Gao, Y., & Huang, G. (2017). Folic Acid Supplementation Delays Atherosclerotic Lesion Development by Modulating MCP1 and VEGF DNA Methylation Levels In Vivo and In Vitro. International Journal of Molecular Sciences, 18(5), 990. https://doi.org/10.3390/ijms18050990