
The Application of a Modified d-ROMs Test for Measurement of Oxidative Stress and Oxidized High-Density Lipoprotein


Abstract
: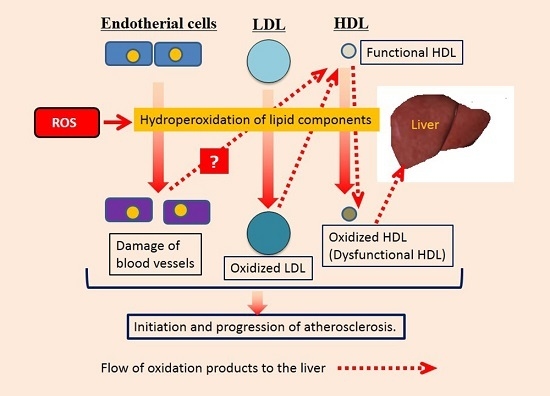
1. Introduction
2. Results
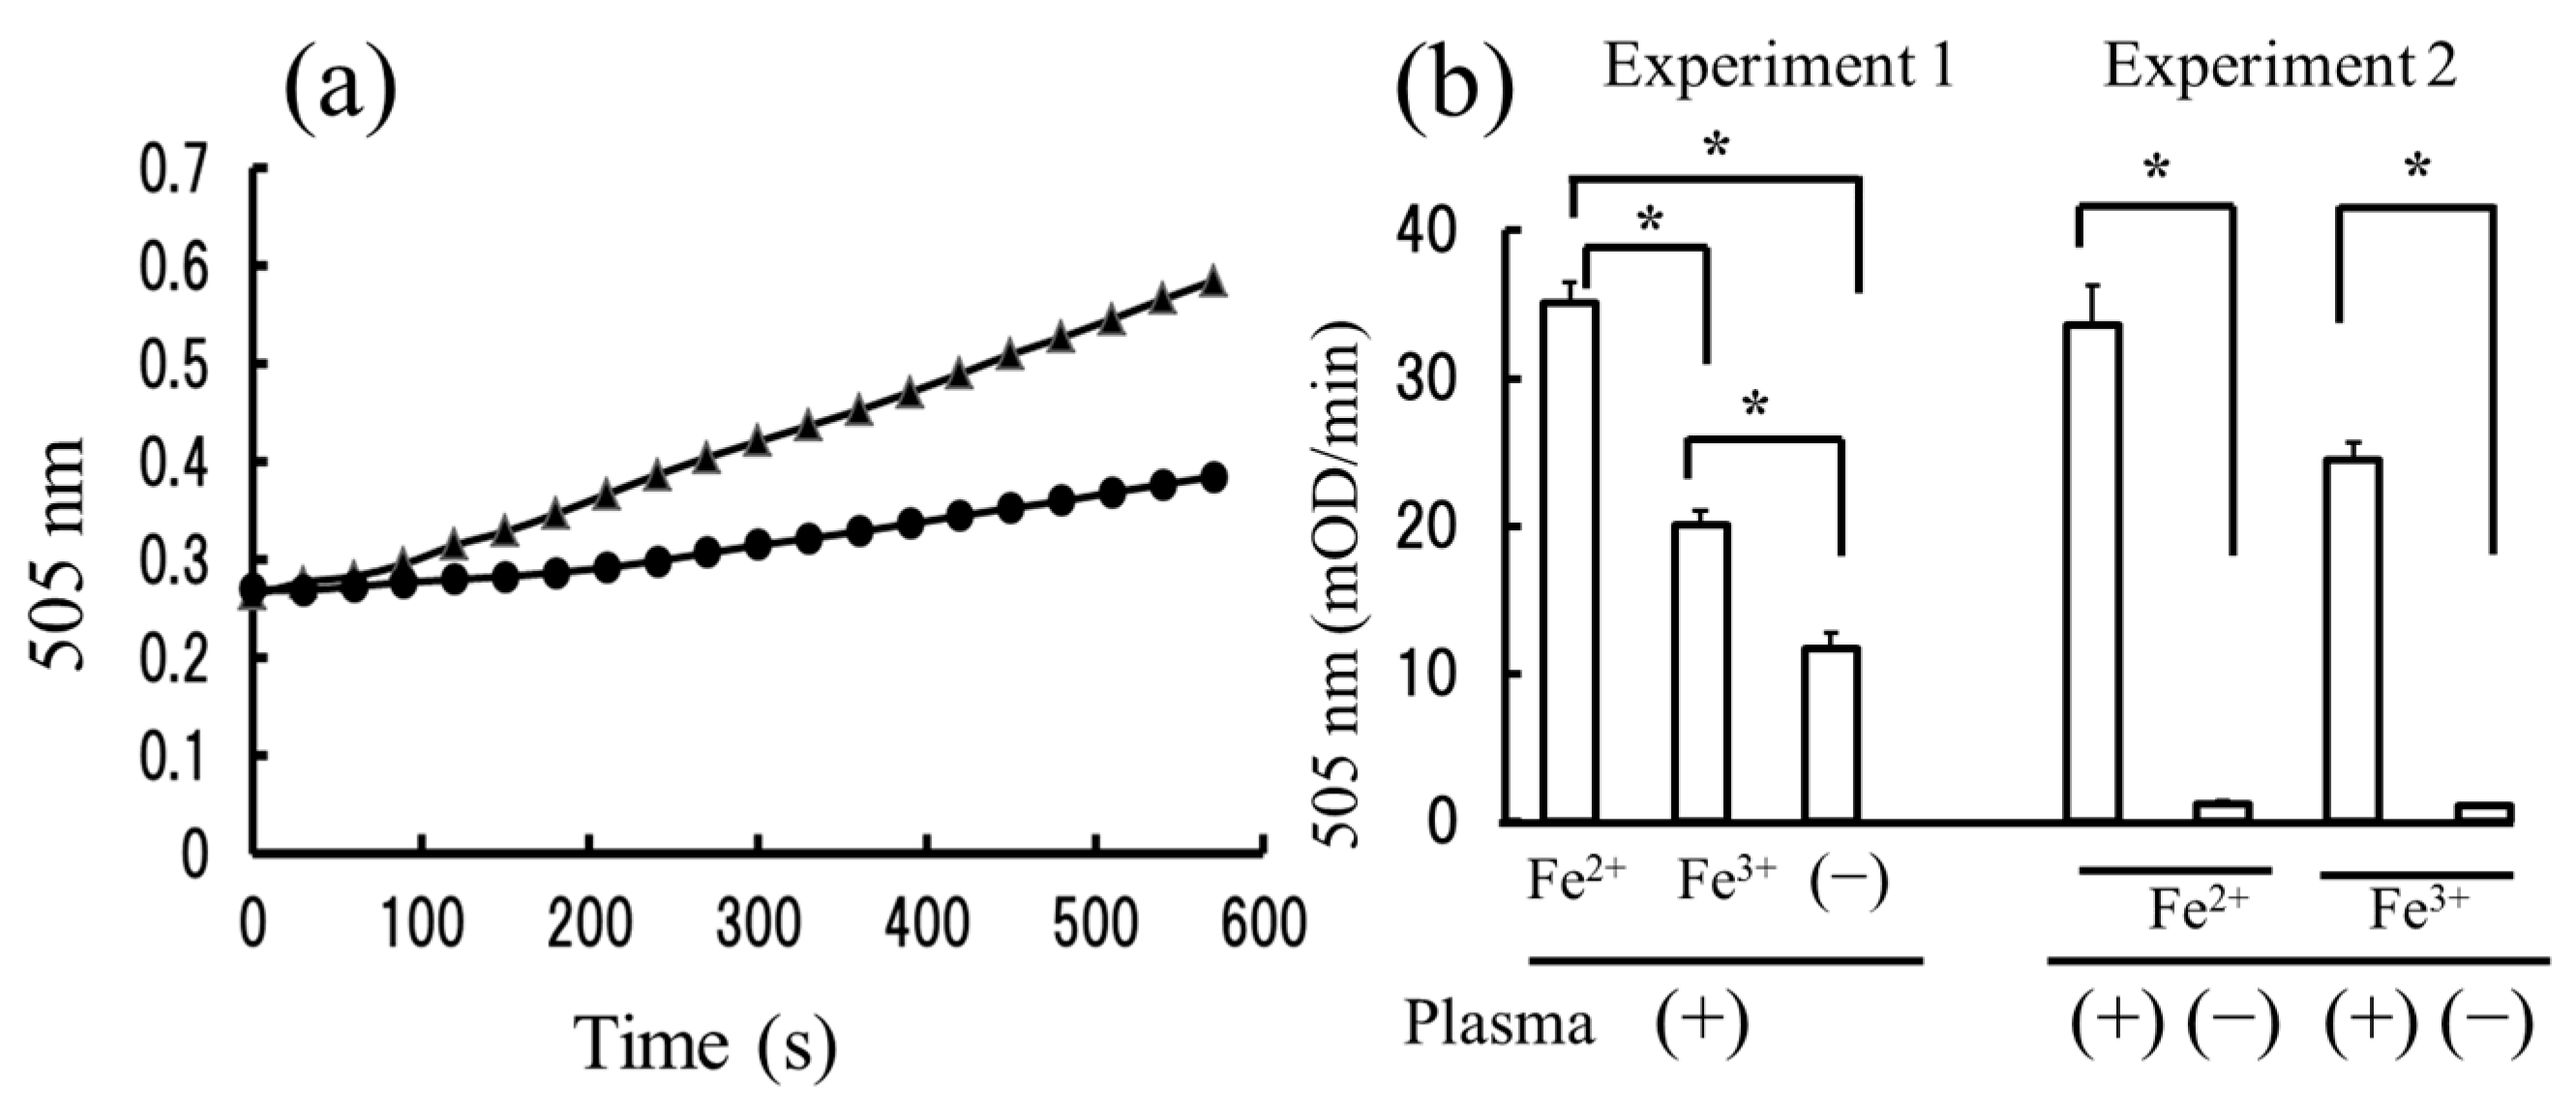
2.1. The Measurement of Hydroperoxides in Plasma by the Diacron-Reactive Oxygen Metabolites (d-ROMs) and Fe-ROMs Tests
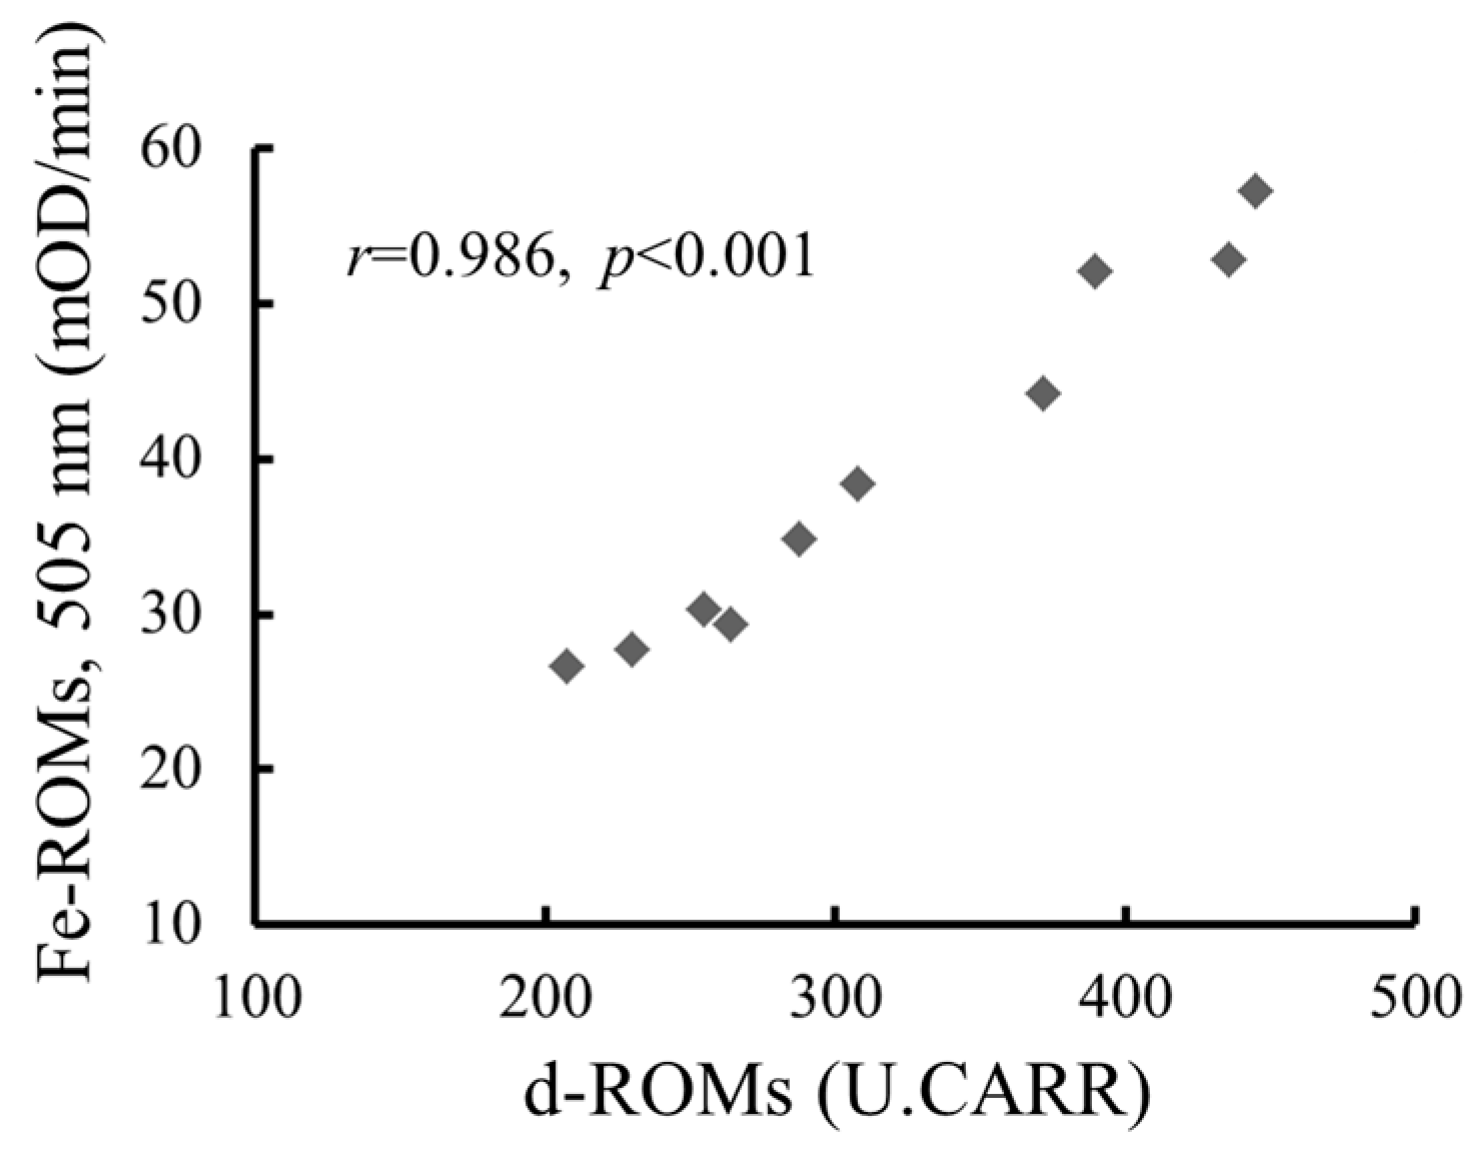
2.2. The Strong Correlation between Levels of Hydroperoxides Measured by the d-ROMs and Fe-ROMs Tests
2.3. The Fe-ROMs Test Detects the Oxidation of Plasma Molecules of High Molecular Weight
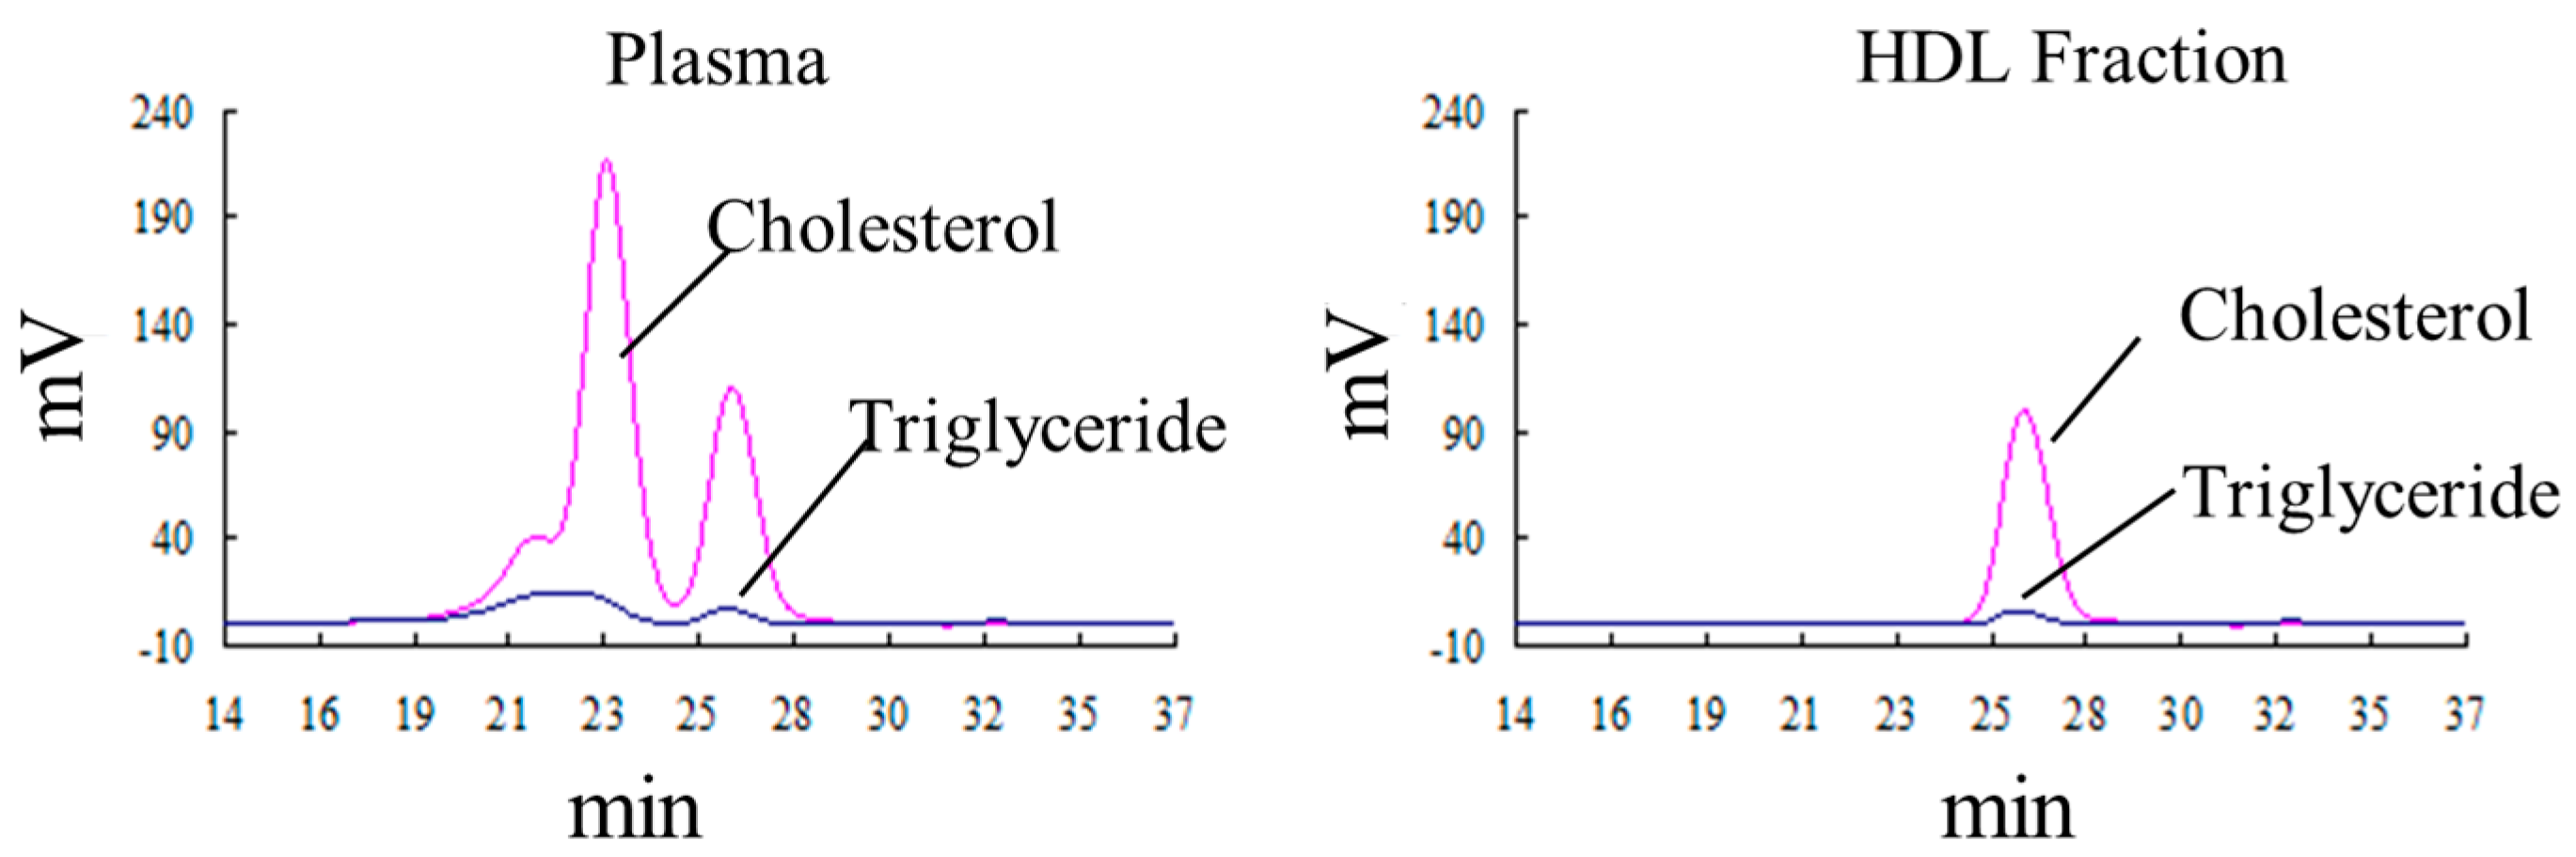
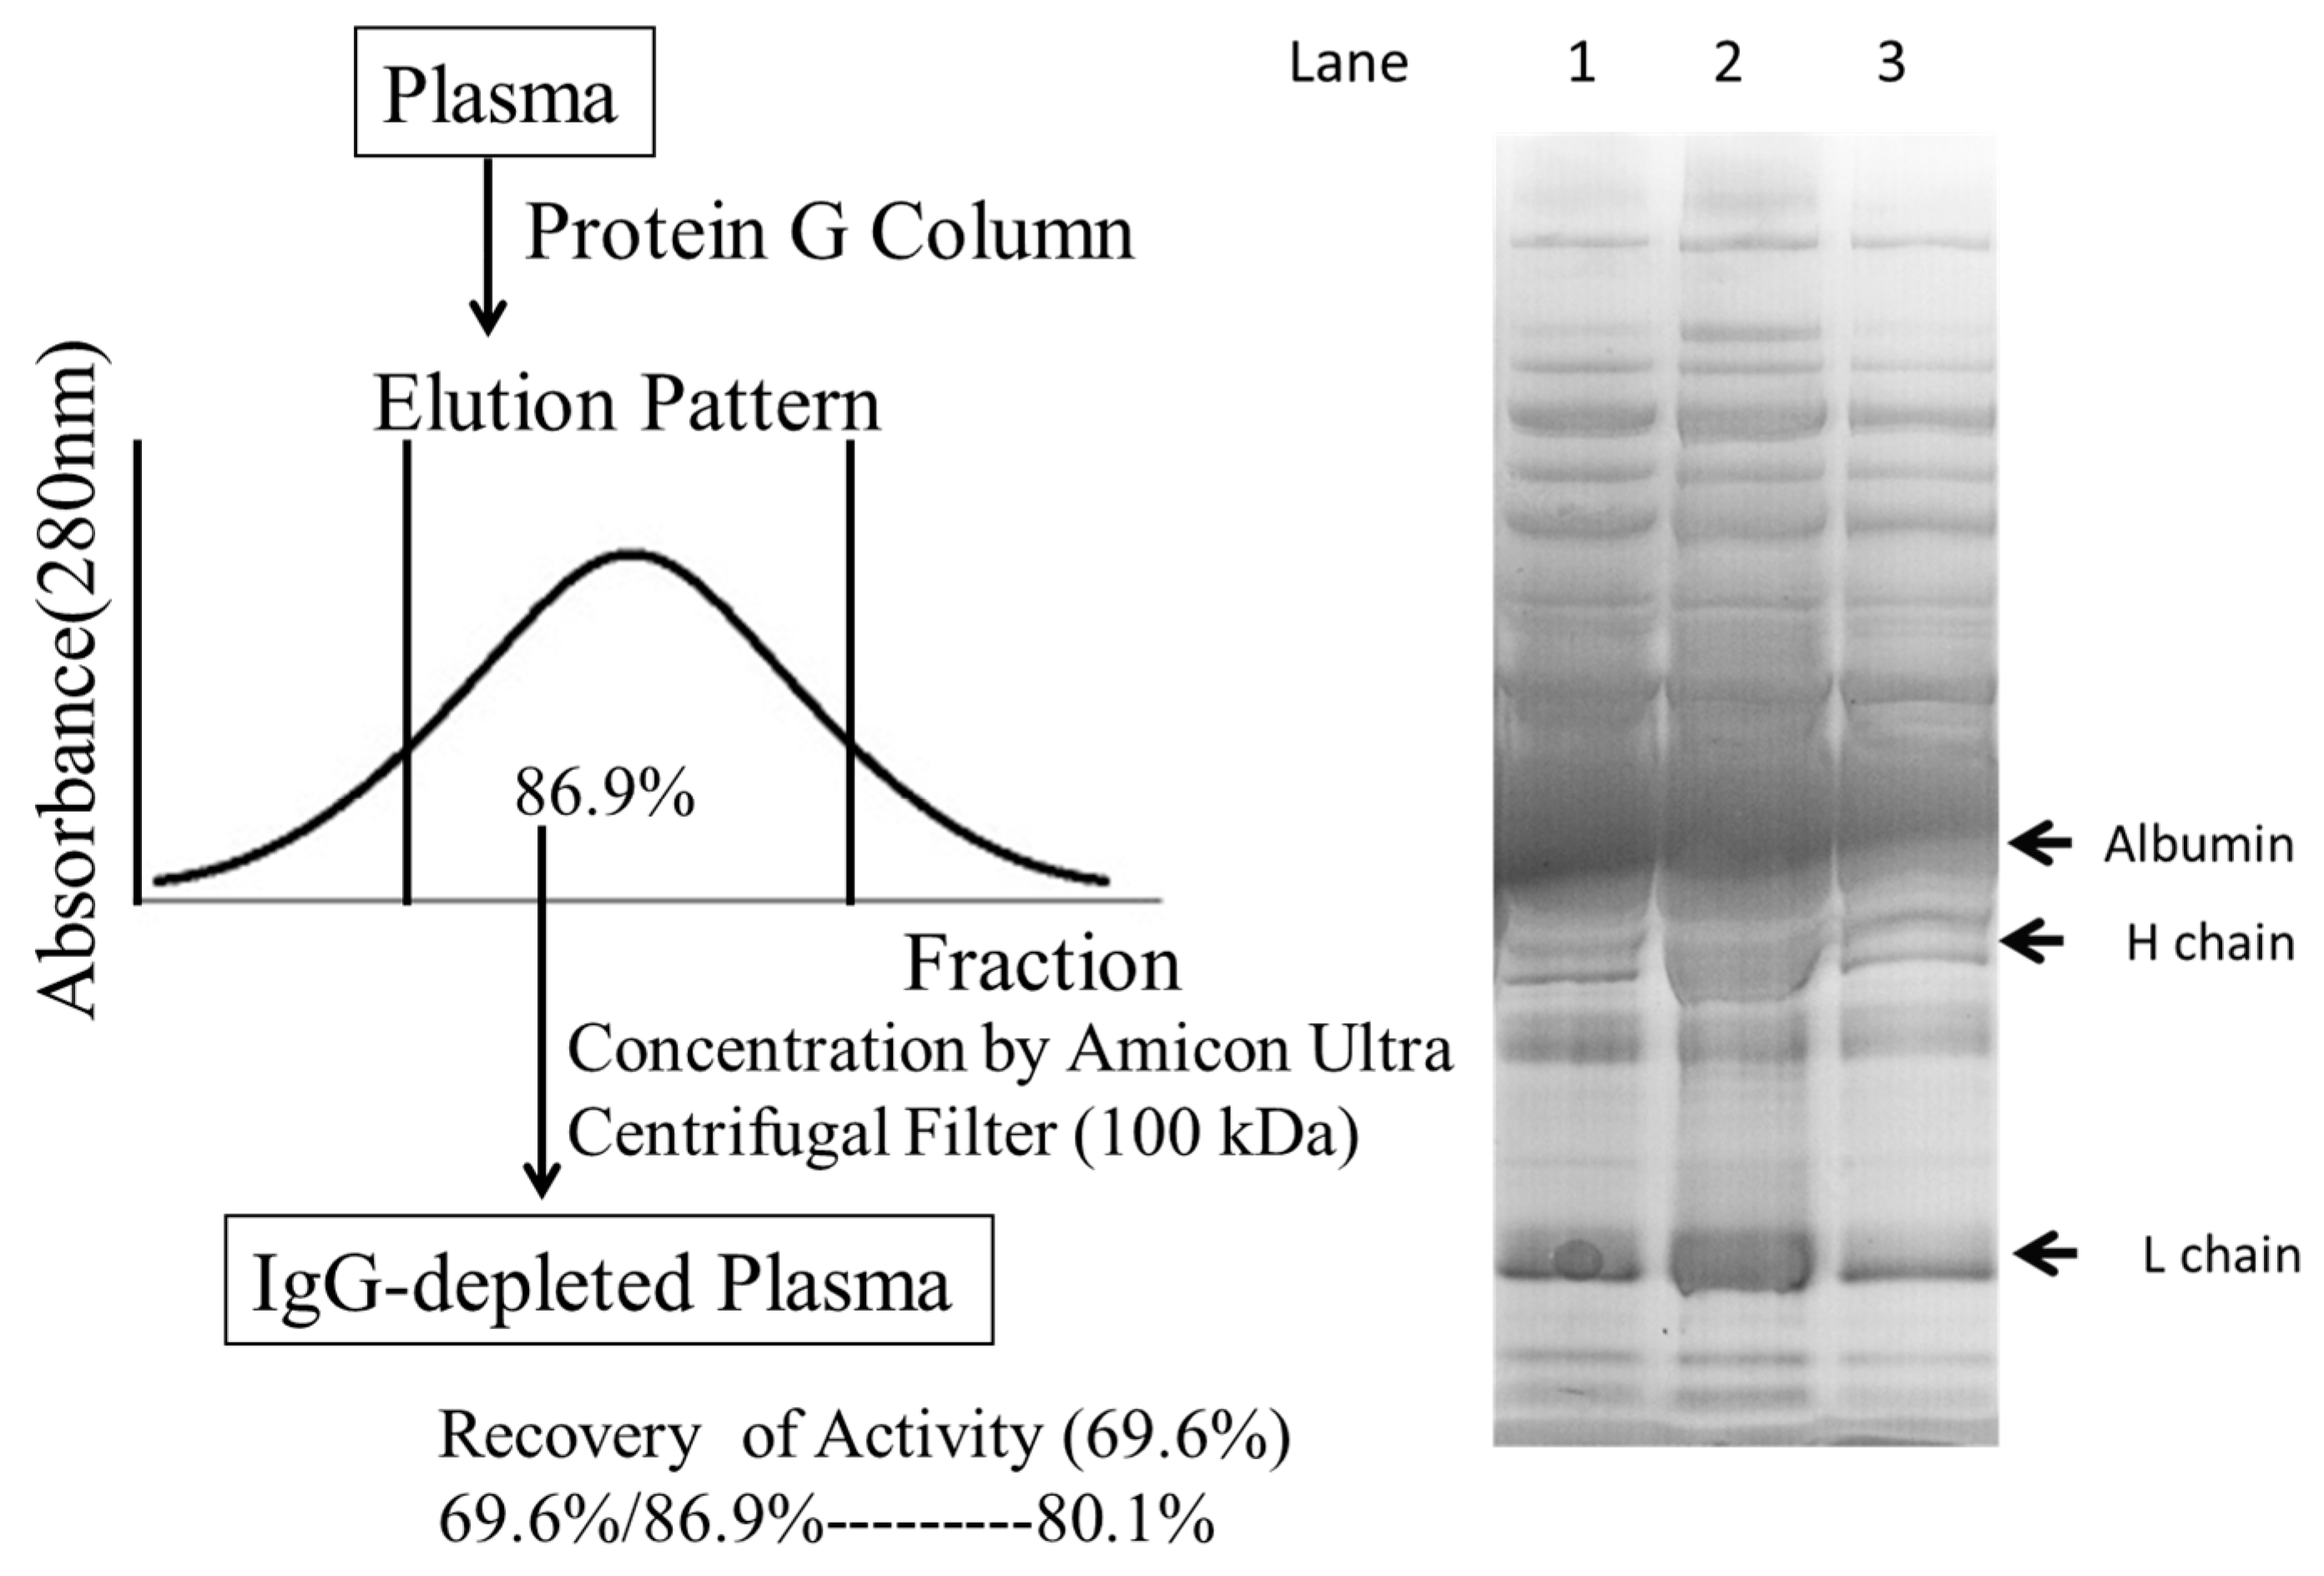
2.4. Defining the Macromolecular Components Oxidized in Plasma: Oxidized Macromolecular Components Are Not Low-Density Lipoprotein/Very Low-Density Lipoprotein (LDL/VLDL)
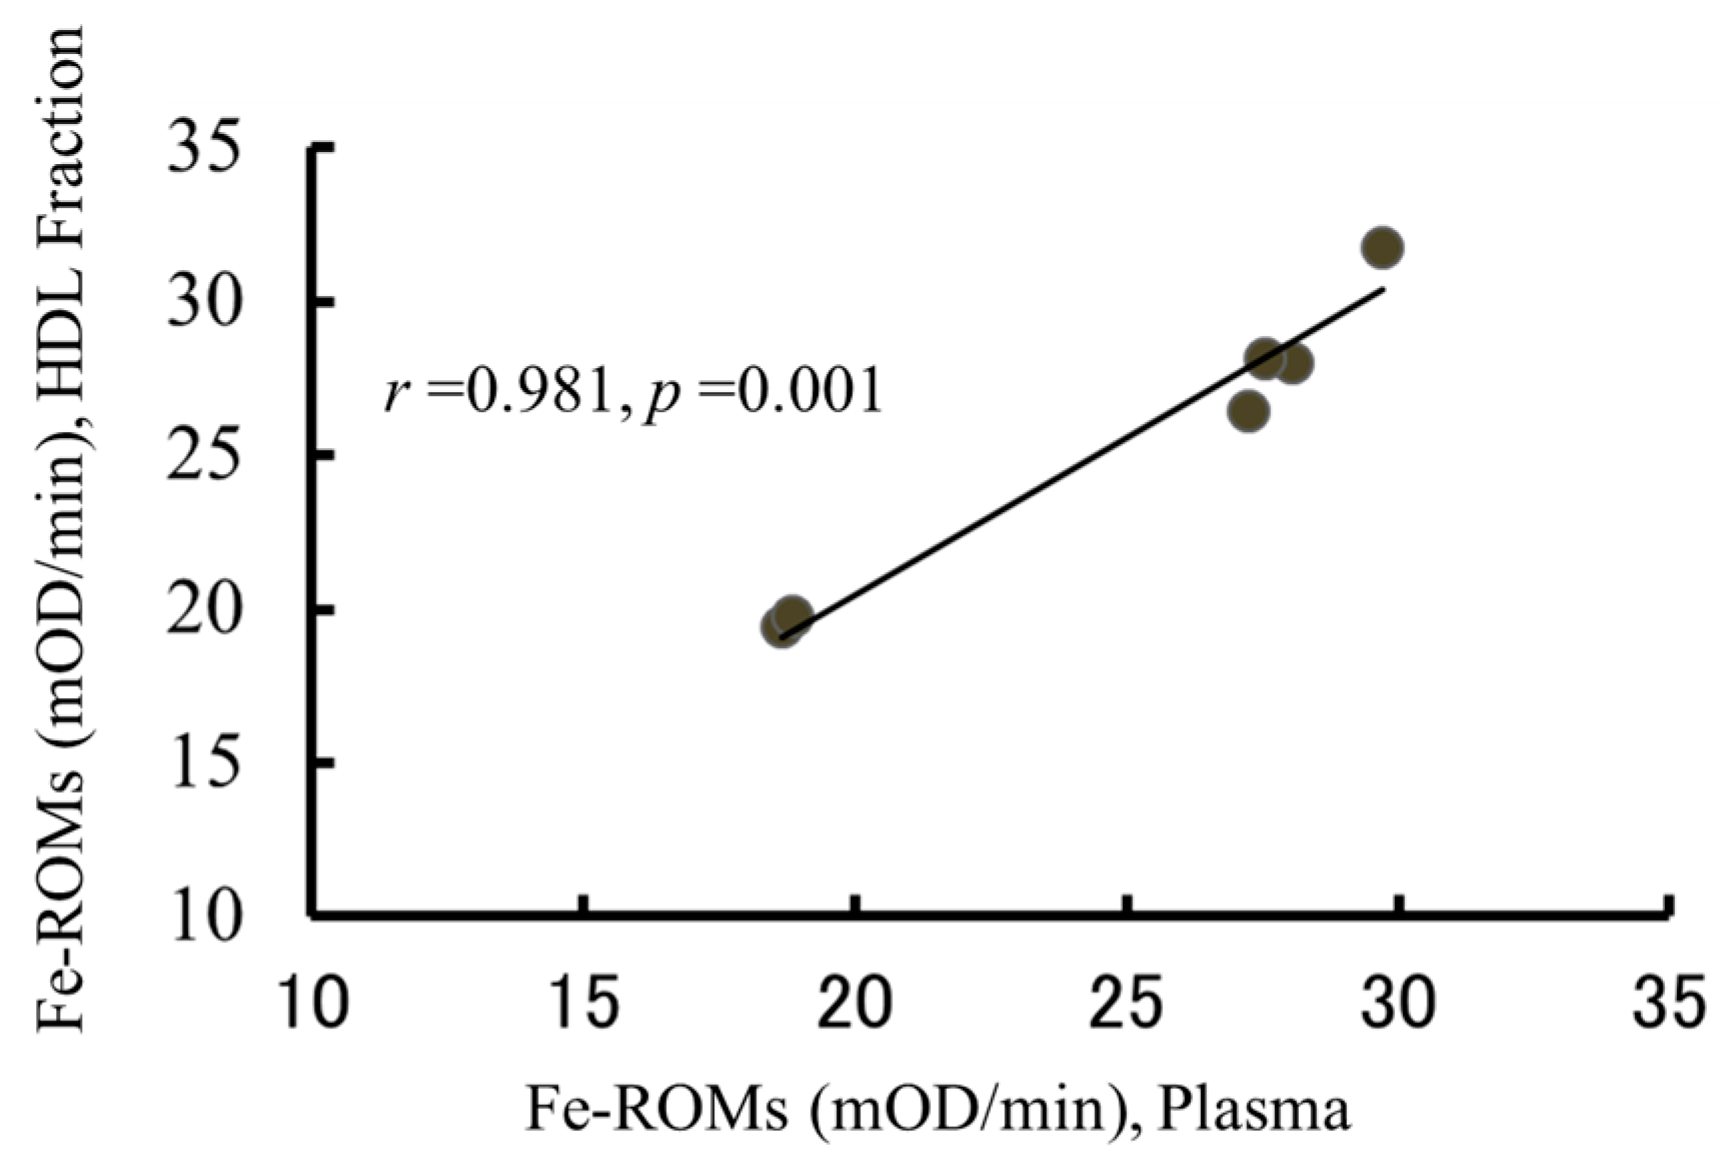
2.5. The Oxidation of HDL Is Detected by the Fe-ROMs Test
2.6. The Fe-ROMs Test Is a Useful Method for the Determination of Oxidized High-Density Lipoprotein (HDL)
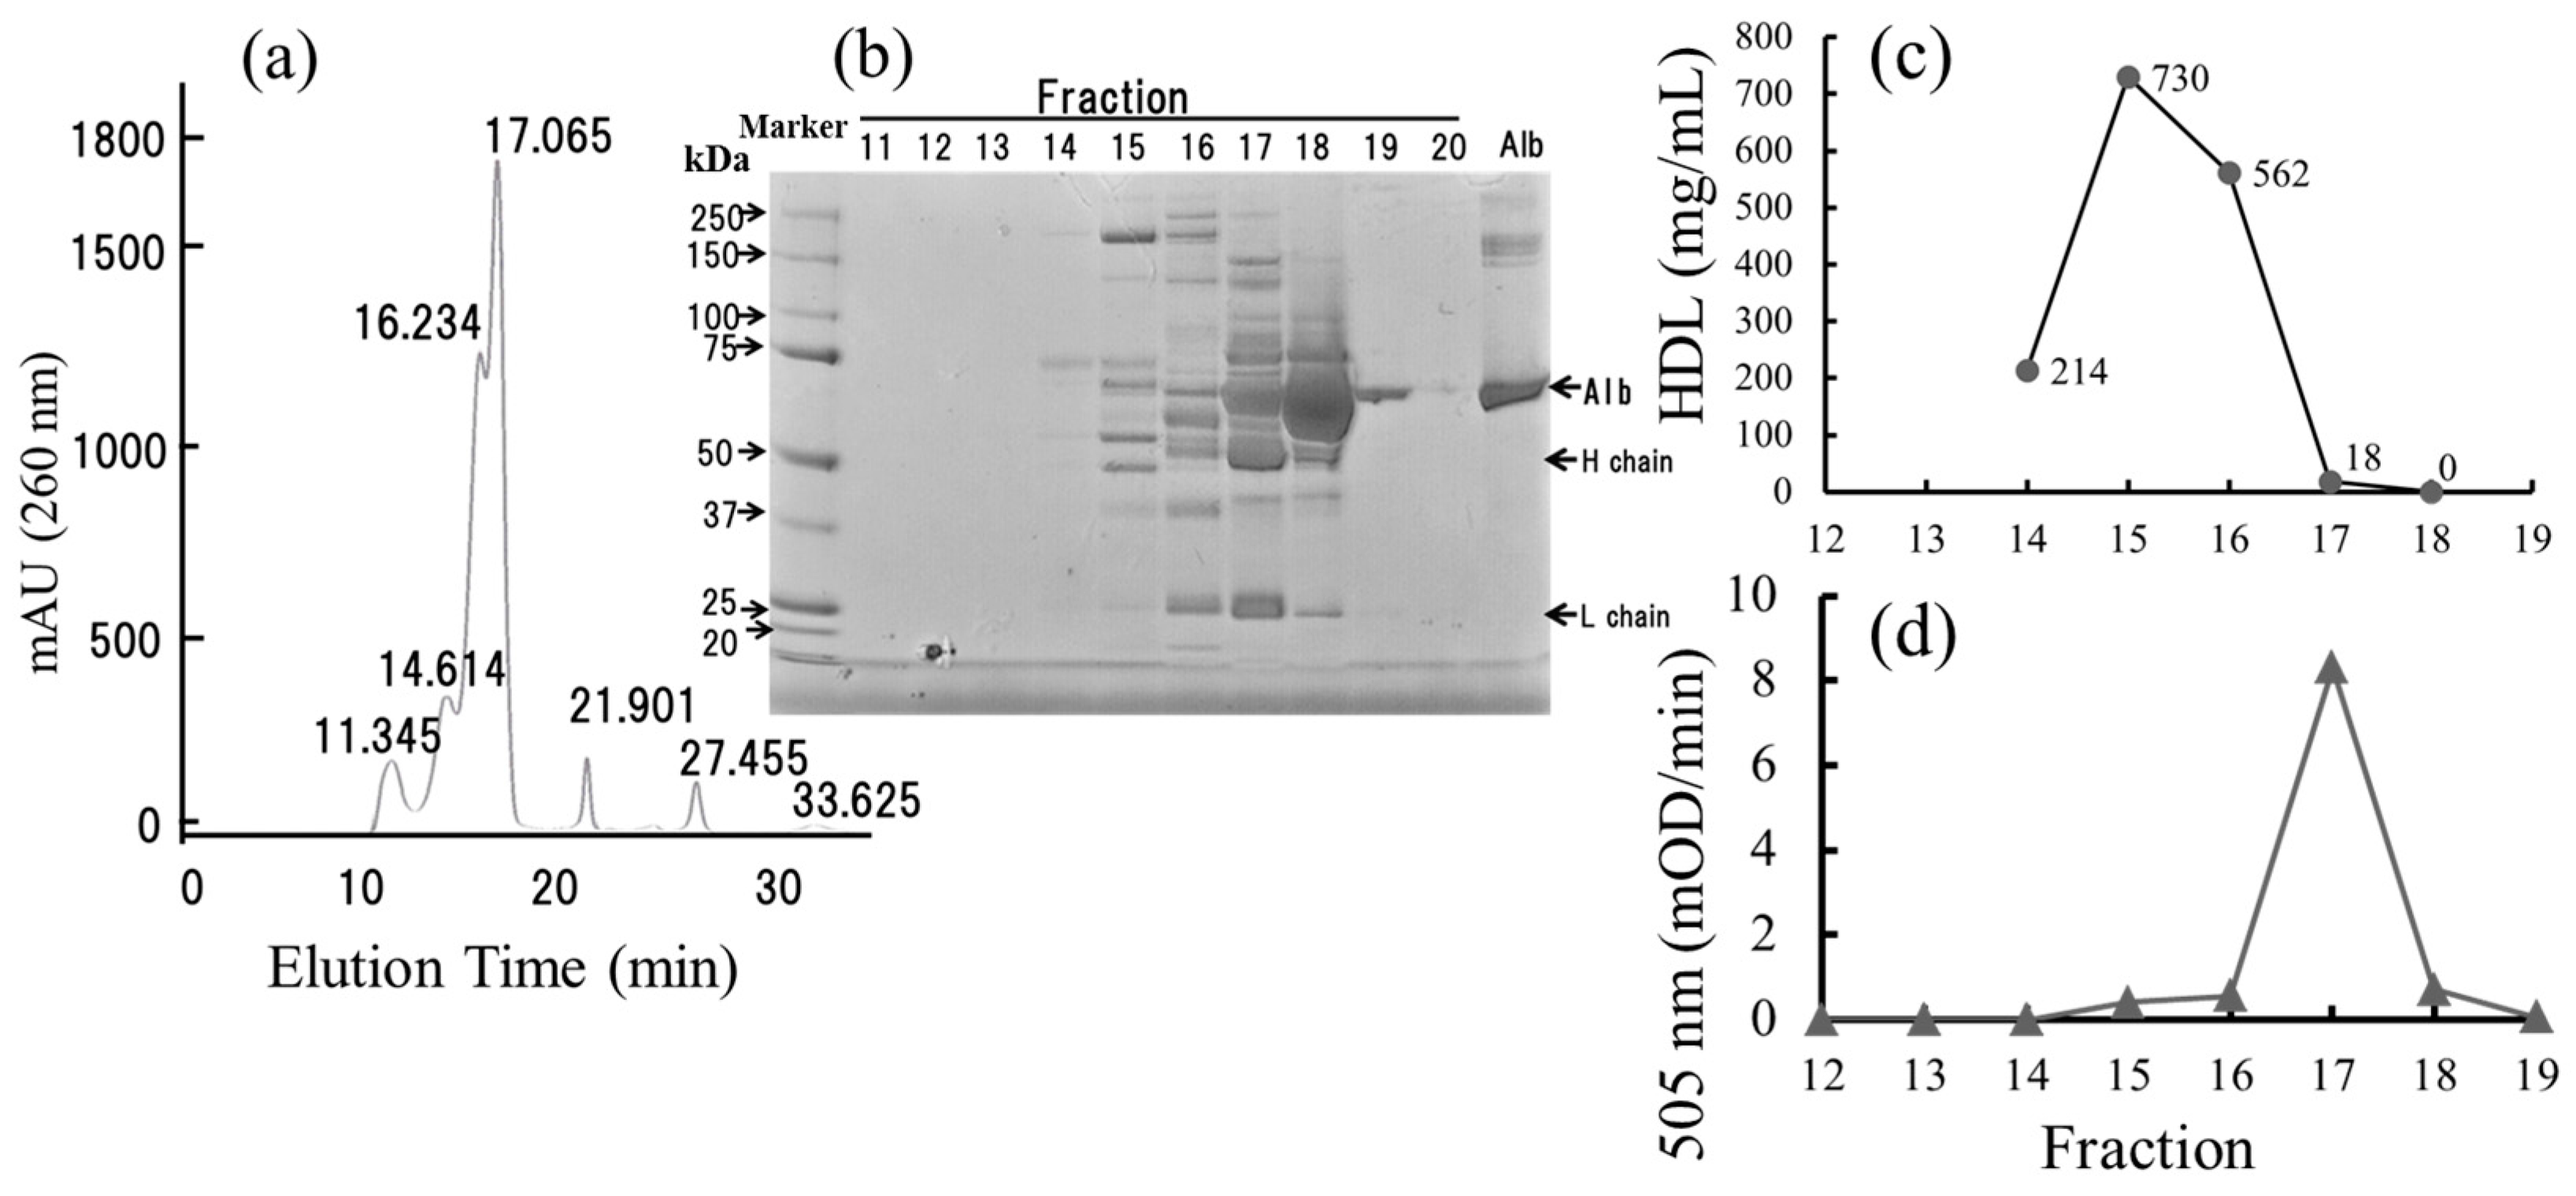
2.7. Small-Sized HDL Is a Major Oxidized Molecule in Plasma
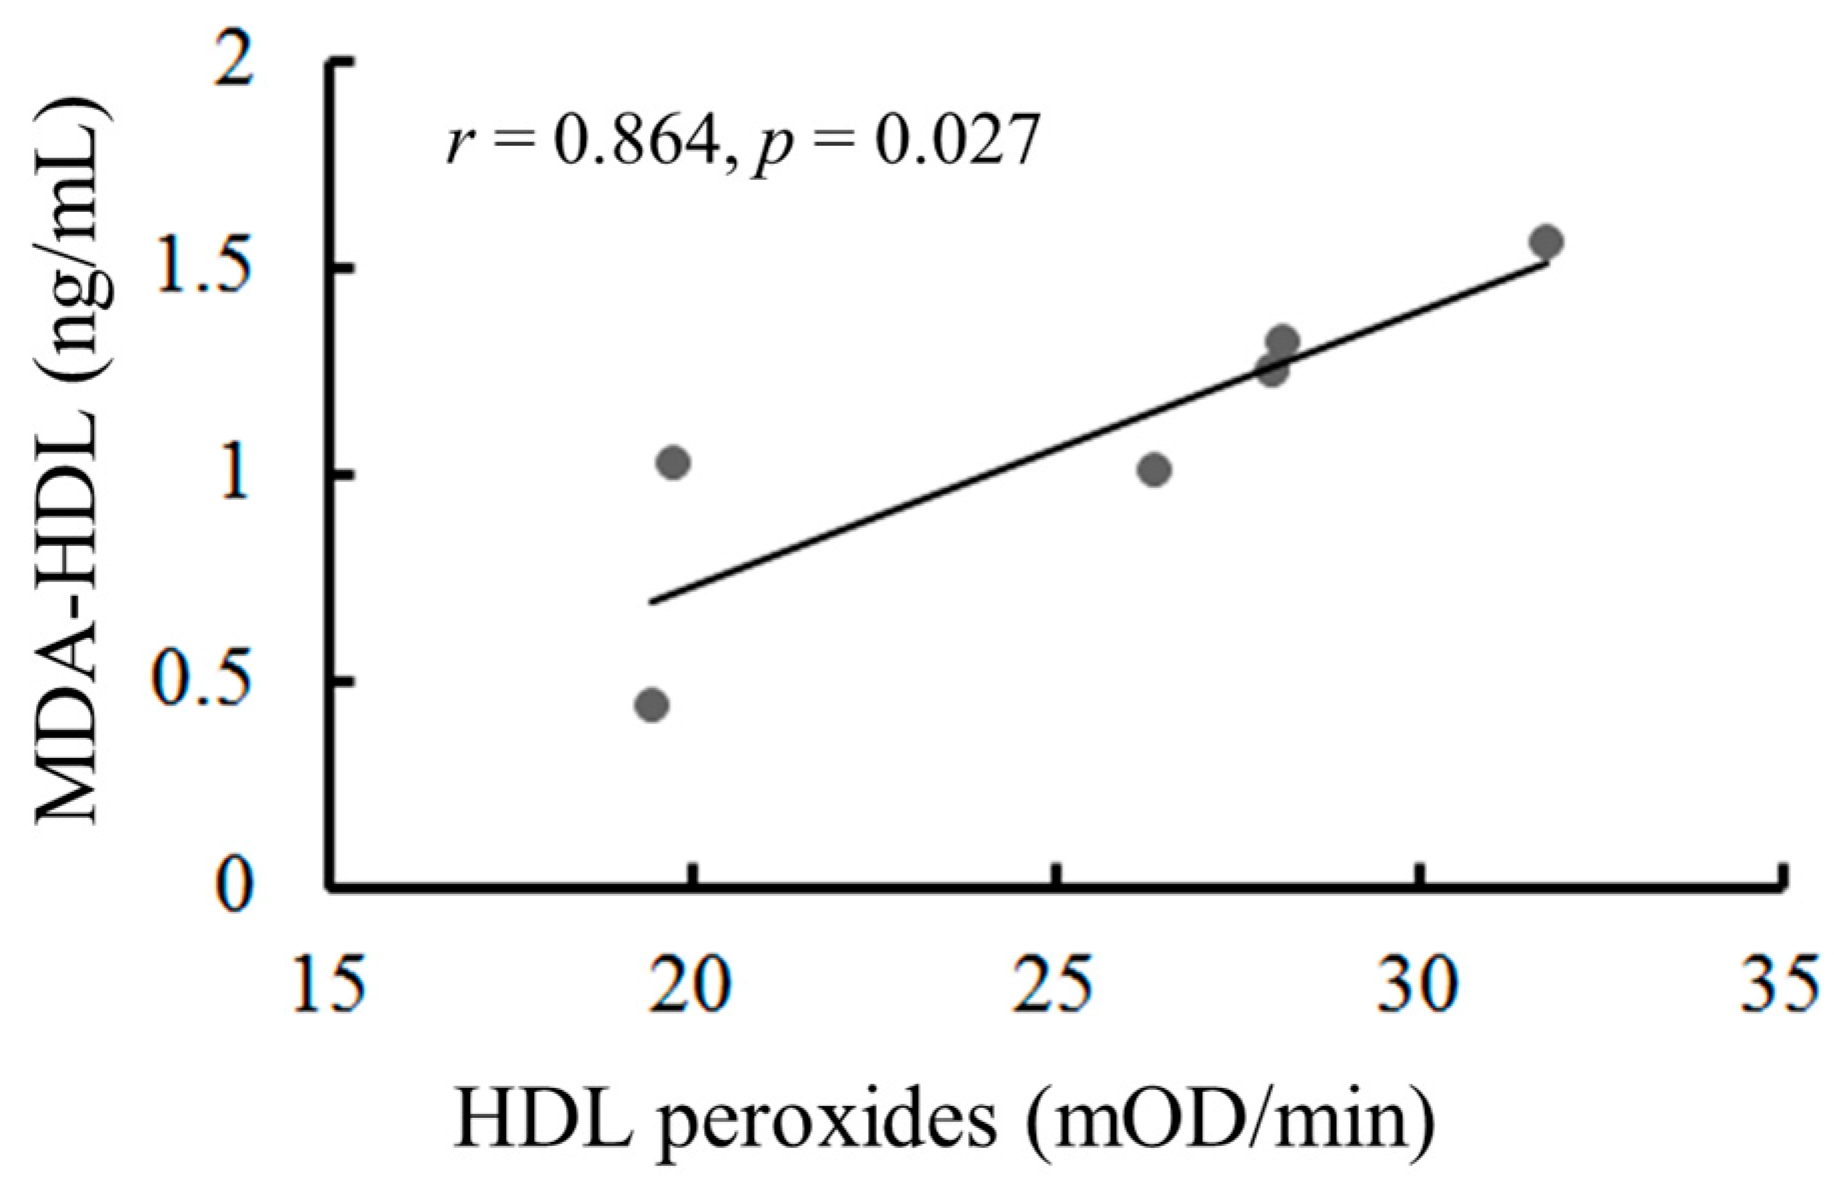
2.8. The Oxidation of HDL Can Be Measured by the Malondialdehyde (MDA)-HDL Enzyme-Linked Immunosorbent Assay and the Fe-ROMs Test
2.9. Plasma HDL Concentrations in Subjects with Different HDL Oxidation Levels
3. Discussion
4. Materials and Methods
4.1. Materials
4.2. Subjects
4.3. The Measurement of Reactive Oxygen Metabolites by the d-ROMs and Fe-ROMs Tests
4.4. Fractionation of HDL by the Dextran Sulfate-Mg2+ Precipitation Method
4.5. Lipoprotein Analysis of the Plasma by HPLC
4.6. Protein Analysis by SDS-PAGE
4.7. Protein G Affinity Chromatography
4.8. Other Methods
4.9. Statistical Analysis
5. Conclusions
Supplementary Materials
Acknowledgments
Author Contributions
Conflicts of Interest
Abbreviations
| DHP | Dihydropyridine |
| d-ROMs | Diacron reactive oxygen metabolites |
| ELISA | Enzyme-linked immunosorbent assay |
| HDL | High-density lipoprotein |
| HPLC | High-performance liquid chromatography |
| LDL | Low-density lipoprotein |
| MDA | Malondialdehyde |
| oxLDL | Oxidatively modified low-density lipoprotein |
| oxHDL | Oxidized high-density lipoprotein |
| PUFA | Polyunsaturated fatty acid |
| ROS | Reactive oxygen species |
| SDS PAGE | Sodium dodecyl sulfate poly-acrylamide gel electrophoresis |
| VLDL | Very low-density lipoprotein |
References
- McCord, J.M. The evolution of free radicals and oxidative stress. Am. J. Med. 2000, 108, 652–659. [Google Scholar] [CrossRef]
- Li, S.; Tan, H.Y.; Wang, N.; Zhang, Z.J.; Lao, L.; Wong, C.W.; Feng, Y. The role of oxidative stress and antioxidants in liver diseases. Int. J. Mol. Sci. 2015, 16, 26087–26124. [Google Scholar] [CrossRef] [PubMed]
- Maritim, A.C.; Sanders, R.A.; Watkins, J.B., 3rd. Diabetes, oxidative stress, and antioxidants: A review. J. Biochem. Mol. Toxicol. 2003, 17, 24–38. [Google Scholar] [CrossRef] [PubMed]
- Bonomini, F.; Tengattini, S.; Fabiano, A.; Bianchi, R.; Rezzani, R. Atherosclerosis and oxidative stress. Histol. Histopathol. 2008, 23, 381–390. [Google Scholar] [PubMed]
- Naudi, A.; Jove, M.; Ayala, V.; Portero-Otin, M.; Barja, G.; Pamplona, R. Membrane lipid unsaturation as physiological adaptation to animal longevity. Front. Physiol. 2013, 4, 372. [Google Scholar] [CrossRef] [PubMed]
- Casanas-Sanchez, V.; Perez, J.A.; Fabelo, N.; Quinto-Alemany, D.; Diaz, M.L. Docosahexaenoic (DHA) modulates phospholipid-hydroperoxide glutathione peroxidase (Gpx4) gene expression to ensure self-protection from oxidative damage in hippocampal cells. Front. Physiol. 2015, 6, 203. [Google Scholar] [CrossRef] [PubMed]
- Niki, E.; Yoshida, Y.; Saito, Y.; Noguchi, N. Lipid peroxidation: Mechanisms, inhibition, and biological effects. Biochem. Biophys. Res. Commun. 2005, 338, 668–676. [Google Scholar] [CrossRef] [PubMed]
- Catala, A. Lipid peroxidation of membrane phospholipids generates hydroxy-alkenals and oxidized phospholipids active in physiological and/or pathological conditions. Chem. Phys. Lipids 2009, 157, 1–11. [Google Scholar] [CrossRef] [PubMed]
- Fritz, K.S.; Petersen, D.R. An overview of the chemistry and biology of reactive aldehydes. Free Radic. Biol. Med. 2013, 59, 85–91. [Google Scholar] [CrossRef] [PubMed]
- Lamore, S.D.; Azimian, S.; Hom, D.; Anglin, B.L.; Uchida, K.; Cabello, C.M.; Wondrak, G.T. The malondialdehyde-derived fluorophore DHP-lysine is a potent sensitizer of UVA-induced photooxidative stress in human skin cells. J. Photochem. Photobiol. B 2010, 101, 251–264. [Google Scholar] [CrossRef] [PubMed]
- Slatter, D.A.; Murray, M.; Bailey, A.J. Formation of a dihydropyridine derivative as a potential cross-link derived from malondialdehyde in physiological systems. FEBS Lett. 1998, 421, 180–184. [Google Scholar] [CrossRef]
- Le, N.A. Lipoprotein-associated oxidative stress: A new twist to the postprandial hypothesis. Int. J. Mol. Sci. 2014, 16, 401–419. [Google Scholar] [CrossRef] [PubMed]
- Rahmanto, A.S.; Morgan, P.E.; Hawkins, C.L.; Davies, M.L. Cellular effects of peptide and protein hydroperoxides. Free Radic. Biol. Med. 2010, 48, 1071–1078. [Google Scholar] [CrossRef] [PubMed]
- Morita, M.; Naito, Y.; Yoshikawa, T.; Niki, E. Plasma lipid oxidation induced by peroxynitrite, hypochlorite, lipooxygenase and peroxyl radicals and its inhibition by antioxidants as assessed by diphenyl-1-pyrenylphosphine. Redox Biol. 2016, 8, 127–135. [Google Scholar] [CrossRef] [PubMed]
- Palinski, W.; Rosenfeld, M.E.; Yla-Herttuala, S.; Gurtner, G.C.; Socher, S.S.; Butler, S.W.; Parthasarathy, S.; Carew, T.E.; Steinberg, D.; Witztum, J.L. Low density lipoprotein undergoes oxidative modification in vivo. Proc. Natl. Acad. Sci. USA 1989, 86, 1372–1376. [Google Scholar] [CrossRef] [PubMed]
- Uchida, Y.; Maezawa, Y.; Uchida, Y.; Hiruta, N.; Shimoyama, E.; Kawai, S. Localization of oxidized low-density lipoprotein and its relation to plaque morphology in human coronary artery. PLoS ONE 2013, 8, e55188. [Google Scholar] [CrossRef] [PubMed]
- Ishigaki, Y.; Oka, Y.; Katagiri, H. Circulating oxidized LDL: A biomarker and a pathogenic factor. Curr. Opin. Lipidol. 2009, 20, 363–369. [Google Scholar] [CrossRef] [PubMed]
- Itabe, H. Oxidized low-density lipoproteins: What is understood and what remains to be clarified. Biol. Pharm. Bull. 2003, 26, 1–9. [Google Scholar] [CrossRef] [PubMed]
- Pirillo, A.; Norata, G.D.; Catapano, A.L. High-density lipoprotein subfractions—What the clinicians need to know. Cardiology 2013, 124, 116–125. [Google Scholar] [CrossRef] [PubMed]
- Rosenson, R.S.; Brewer, H.B.; Chapman, J.; Fazio, S.; Hussain, M.; Kontush, A.; Krauss, R.M.; Otvos, J.D.; Remaley, A.T.; Schaefer, E.J. HDL measures, particle heterogeneity, proposed nomenclature, and relation to atherosclerotic cardiovascular events. Clin. Chem. 2011, 57, 392–410. [Google Scholar] [CrossRef] [PubMed]
- Soran, H.; Schofield, J.D.; Durrington, P.N. Antioxidant properties of HDL. Front. Pharmacol. 2015, 6, 222. [Google Scholar] [CrossRef] [PubMed]
- Bonnefont-Rousselot, D.; Motta, C.; Khalil, A.O.; Sola, R.; La Ville, A.E.; Delattre, J.; Gardes-Albert, M. Physicochemical changes in human high-density lipoprotein (HDL) oxidized by γ radiolysis-generated oxyradicals. Effect on their cholesterol effluxing capacity. Biochim. Biophys. Acta 1995, 1255, 23–30. [Google Scholar] [CrossRef]
- Kontush, A.; Chapman, M.J. Antiatherogenic function of HDL particle subpopulations: Focus on antioxidative activities. Curr. Opin. Lipidol. 2010, 21, 312–318. [Google Scholar] [CrossRef] [PubMed]
- Lűscher, T.F.; Landmesser, U.; von Eckardstein, A.; Fogelman, A.M. High-density lipoprotein: Vascular protective effects, dysfunction, and potential as therapeutic target. Circ. Res. 2014, 114, 171–182. [Google Scholar] [CrossRef] [PubMed]
- Rasmiena, A.A.; Barlow, C.K.; Ng, T.W.; Tull, D.; Meikle, P.J. High density lipoprotein efficiently accepts surface but not internal oxidized lipids from oxidized low density lipoprotein. Biochim. Biophys. Acta 2016, 1861, 69–77. [Google Scholar] [CrossRef] [PubMed]
- Matsuzawa, Y.; Kawashima, T.; Kuwabara, R.; Hayakawa, S.; Irie, T.; Yoshida, T.; Rikitake, H.; Wakabayashi, T.; Okada, N.; Kawashima, K.; et al. Change in serum marker of oxidative stress in the progression of idiopathic pulmonary fibrosis. Pulm. Pharmacol. Ther. 2015, 32, 1–6. [Google Scholar] [CrossRef] [PubMed]
- Morimoto, M.; Satomura, S.; Hashimoto, T.; Ito, E.; Kyotani, S. Oxidative stress measurement and prediction of epileptic seizure in children and adults with severe motor and intellectual disabilities. J. Clin. Med. Res. 2016, 8, 437–444. [Google Scholar] [CrossRef] [PubMed]
- Bemeis, K.K.; Krauss, R.M. Metabolic origins and clinical significance of LDL heterogeneity. J. Lipid Res. 2002, 43, 1363–1379. [Google Scholar]
- Brunzell, J.D. Increased ApoB in small dense LDL particles predicts premature coronary artery disease. Arterioscler. Thromb. Vasc. Biol. 2005, 25, 474–475. [Google Scholar] [CrossRef] [PubMed]
- Griffin, B.A. Lipoprotein atherogenicity: An overview of current mechanisms. Proc. Nutr. Soc. 1999, 58, 163–169. [Google Scholar] [CrossRef] [PubMed]
- Kilk, K.; Meitern, R.; Harmson, O.; Soomets, U.; Horak, P. Assessment of oxidative stress in serum by d-ROMs test. Free Radic. Res. 2014, 48, 883–889. [Google Scholar] [CrossRef] [PubMed]
- Eckenroth, B.E.; Steere, A.N.; Chasteen, N.D.; Everse, S.J.; Mason, A.B. How the binding of human transferrin primes the transferrin receptor potentiating iron release at endosomal pH. Proc. Natl. Acad. Sci. USA 2011, 108, 13089–13094. [Google Scholar] [CrossRef] [PubMed]
- Colombini, F.; Carratelli, M.; Alberti, A. Oxidative stress, d-ROMs test, and ceruloplasmin. Free Radic. Res. 2016, 50, 447–453. [Google Scholar] [CrossRef] [PubMed]
- Abuelo, A.; Hernandez, J.; Alves-Nores, V.; Benedito, J.L.; Castillo, C. Association of serum concentration of different trace elements with biomarkers of systemic oxidant status in dairy cattle. Biol. Trace Elem. Res. 2016, 174, 319–324. [Google Scholar] [CrossRef] [PubMed]
- Ayala, A.; Munoz, M.F.; Arquelles, S. Lipid peroxidation: Production, metabolism, and signaling mechanisms of malondialdehyde and 4-hydrox-2-nonenal. Oxid. Med. Cell. Longev. 2014, 2014, 360438. [Google Scholar] [CrossRef] [PubMed]
- Holvoet, P. Oxidized LDL and coronary heart disease. Acta Cadiol. 2004, 9, 479–484. [Google Scholar] [CrossRef] [PubMed]
- Navab, M.; Ananthramaiah, G.M.; Reddy, S.T.; van Lenten, B.J.; Ansell, B.J.; Fonarow, G.C.; Vahabzadeh, K.; Hama, S.; Hough, G.; Kamranpour, N.; et al. The oxidation hypothesis of atherogenesis: The role of oxidized phospholipids and HDL. J. Lipid Res. 2004, 45, 993–1007. [Google Scholar] [CrossRef] [PubMed]
- Kontush, A.; Chantepie, S.; Chapman, M.J. Small, dense HDL particles exert potent protection of atherogenic LDL against oxidative stress. Arterioscler. Thromb. Vasc. Biol. 2003, 23, 1881–1888. [Google Scholar] [CrossRef] [PubMed]
- Kontush, A.; Chapman, M.J. Antiatherogenic small, dense HDL-guardian angel of the arterial wall? Nat. Clin. Pract. Cardiovas. Med. 2006, 3, 144–153. [Google Scholar] [CrossRef] [PubMed]
- Stocker, R.; Bowry, V.W.; Frei, B. Ubiquinol-10 protects human low density lipoprotein more efficiently against lipid peroxidation than does alpha-tocopherol. Proc. Natl. Acad. Sci. USA 1991, 88, 1646–1650. [Google Scholar] [CrossRef] [PubMed]
- Kontush, A.; de Faria, E.C.; Chantepie, S.; Chapman, M.J. A normotriglyceridemic, low HDL-cholesterol phenotype is characterized by oxidative stress and HDL particles with attenuated antioxidative activity. Atherosclerosis 2005, 182, 277–285. [Google Scholar] [CrossRef] [PubMed]
- Nobecourt, E.; Jacqueminet, S.; Hansel, B.; Chantepie, S.; Grimaldi, A.; Chapman, M.J.; Kontush, A. Defective antioxidative activity of small dense HDL3 particles in type 2 diabetes: Relationship to elevated oxidative stress and hyperglycaemia. Diabetologia 2005, 48, 529–538. [Google Scholar] [CrossRef] [PubMed]
- McPherson, P.A.C.; Young, I.S.; McKibben, B.; McEneny, J. High density lipoprotein subfractions: Isolation, composition, and their duplicitous role in oxidation. J. Lipid Res. 2007, 48, 86–95. [Google Scholar] [CrossRef] [PubMed]
- Favari, E.; Chroni, A.; Tietge, U.J.; Zanotti, I.; Escolà-Gil, J.C.; Bernini, F. Cholesterol efflux and reverse cholesterol transport. Handb. Exp. Pharmacol. 2015, 224, 181–206. [Google Scholar] [PubMed]
- Tabet, F.; Rye, K.-A. High-density lipoproteins, inflammation and oxidative stress. Clin. Sci. 2009, 116, 87–98. [Google Scholar] [CrossRef] [PubMed]
- Barter, P.J.; Nicholls, S.; Rye, K.A.; Anantharamaiah, G.M.; Navab, M.; Fogelman, A.M. Antiinflammatory properties of HDL. Circ. Res. 2004, 95, 764–772. [Google Scholar] [CrossRef] [PubMed]
- Shao, B.; Tang, C.; Sinha, A.; Mayer, P.S.; Davenport, G.D.; Brot, N.; Oda, M.N.; Zhao, X.Q.; Heinecke, J.W. Humans with atherosclerosis have impaired ABCA1 cholesterol efflux and enhanced HDL oxidation by myeroperoxidase. Circ. Res. 2014, 114, 1733–1742. [Google Scholar] [CrossRef] [PubMed]
- Shao, B.; Oda, M.N.; Oram, J.F.; Heinecke, J.W. Myeroperoxidase: An oxidative pathway for generating dysfunctional HDL. Chem. Res. Toxicol. 2010, 23, 447–454. [Google Scholar] [CrossRef] [PubMed]
- Shao, B. Site-specific oxidation of apolipoprotein A-I impairs cholesterol export by ABCA1, a key cardioprotective function of HDL. Biochim. Biophys. Acta 2012, 1821, 490–501. [Google Scholar] [CrossRef] [PubMed]
- Aviram, M.; Rosenblat, M.; Bisgaier, C.L.; Newton, R.S.; Primo-Parma, S.L.; La Du, B.N. Paroxonase inhibits high-density lipoprotein oxidation and preserve its functions. A possible peroxidative role for paroxonase. J. Clin. Investig. 1998, 101, 1581–1590. [Google Scholar] [CrossRef] [PubMed]
- Bowry, V.W.; Stanley, K.K.; Stocker, R. High density lipoprotein is the major carrier of lipid hydroxides in human blood plasma from fasting donors. Proc. Natl. Acad. Sci. USA 1992, 89, 10316–10320. [Google Scholar] [CrossRef] [PubMed]
- Warnick, G.R.; Benderson, J.; Alberts, J.J. Dextran sulfate-Mg2+ precipitation procedure for quantitation of high density-lipoprotein cholesterol. Clin. Chem. 1982, 28, 1379–1388. [Google Scholar] [PubMed]
- Usui, S.; Hara, Y.; Hosaki, S.; Okazaki, M. A new on-line dual enzymatic method for simultaneous quantification of cholesterol and triglycerides in lipoproteins by HPLC. J. Lipid Res. 2002, 43, 805–814. [Google Scholar] [PubMed]


| Class | Sub-Class | Cholesterol (mg/dL) | |
|---|---|---|---|
| Plasma | HDL | ||
| CM (>80 nm) | 1.73 | 0.01 | |
| VLDL (30–80 nm) | Large | 24.81 | 0.03 |
| Medium | 8.21 | 0.01 | |
| Small | 7.31 | 0.01 | |
| LDL (16–30 nm) | Large | 34.02 | 0.03 |
| Medium | 57.74 | 0.02 | |
| Small | 21.12 | 0.06 | |
| Very small | 7.73 | 0.23 | |
| HDL (8–16 nm) | Very large | 3.66 | 2.36 |
| Large | 22.76 | 20.63 | |
| Medium | 22.48 | 20.32 | |
| Small | 13.69 | 12.17 | |
| Very small | 5.11 | 4.14 | |
| Total | 230.36 | 60.62 | |
| Subject | Fe-ROMs Level 505 nm (mOD/min) | Cholesterol (mg/dL) | ||||
|---|---|---|---|---|---|---|
| Total | CM | VLDL | LDL | HDL | ||
| >80 nm | 30–80 nm | 16–30 nm | 8–16 nm | |||
| 1 | Low (19.5) | 46.36 | 0.02 | 0.06 | 0.29 | 45.99 |
| 2 | Low (19.8) | 47.87 | 0.01 | 0.05 | 0.30 | 47.50 |
| 3 | High (31.8) | 46.00 | 0.01 | 0.05 | 0.33 | 45.61 |
| 4 | High (28.0) | 41.49 | 0.01 | 0.07 | 0.31 | 41.11 |
| Subject | HDL Cholesterol (mg/dL) | ||||||
|---|---|---|---|---|---|---|---|
| Very Large | Large | Medium | Small | Very Small | |||
| Fraction 14 | Fraction 15 | Fraction 16 | Fraction 17 | Fraction 18 | Fraction 19 | Fraction 20 | |
| 1 | 0.07 | 1.25 | 9.83 | 18.02 | 12.08 | 3.68 | 1.08 |
| 2 | 0.02 | 1.65 | 11.57 | 17.90 | 11.58 | 3.67 | 1.11 |
| 3 | 0.05 | 1.66 | 10.39 | 16.85 | 11.80 | 3.70 | 1.15 |
| 4 | 0.03 | 2.33 | 10.89 | 14.07 | 9.57 | 3.16 | 1.06 |
© 2017 by the authors. Licensee MDPI, Basel, Switzerland. This article is an open access article distributed under the terms and conditions of the Creative Commons Attribution (CC BY) license ( http://creativecommons.org/licenses/by/4.0/).
Share and Cite
Ito, F.; Ito, T.; Suzuki, C.; Yahata, T.; Ikeda, K.; Hamaoka, K. The Application of a Modified d-ROMs Test for Measurement of Oxidative Stress and Oxidized High-Density Lipoprotein. Int. J. Mol. Sci. 2017, 18, 454. https://doi.org/10.3390/ijms18020454
Ito F, Ito T, Suzuki C, Yahata T, Ikeda K, Hamaoka K. The Application of a Modified d-ROMs Test for Measurement of Oxidative Stress and Oxidized High-Density Lipoprotein. International Journal of Molecular Sciences. 2017; 18(2):454. https://doi.org/10.3390/ijms18020454
Chicago/Turabian StyleIto, Fumiaki, Tomoyuki Ito, Chinatsu Suzuki, Tomoyo Yahata, Kazuyuki Ikeda, and Kenji Hamaoka. 2017. "The Application of a Modified d-ROMs Test for Measurement of Oxidative Stress and Oxidized High-Density Lipoprotein" International Journal of Molecular Sciences 18, no. 2: 454. https://doi.org/10.3390/ijms18020454
APA StyleIto, F., Ito, T., Suzuki, C., Yahata, T., Ikeda, K., & Hamaoka, K. (2017). The Application of a Modified d-ROMs Test for Measurement of Oxidative Stress and Oxidized High-Density Lipoprotein. International Journal of Molecular Sciences, 18(2), 454. https://doi.org/10.3390/ijms18020454