
Transcriptional Induction of Metallothionein by Tris(pentafluorophenyl)stibane in Cultured Bovine Aortic Endothelial Cells


 ,
, 
Abstract
:
1. Introduction
2. Results
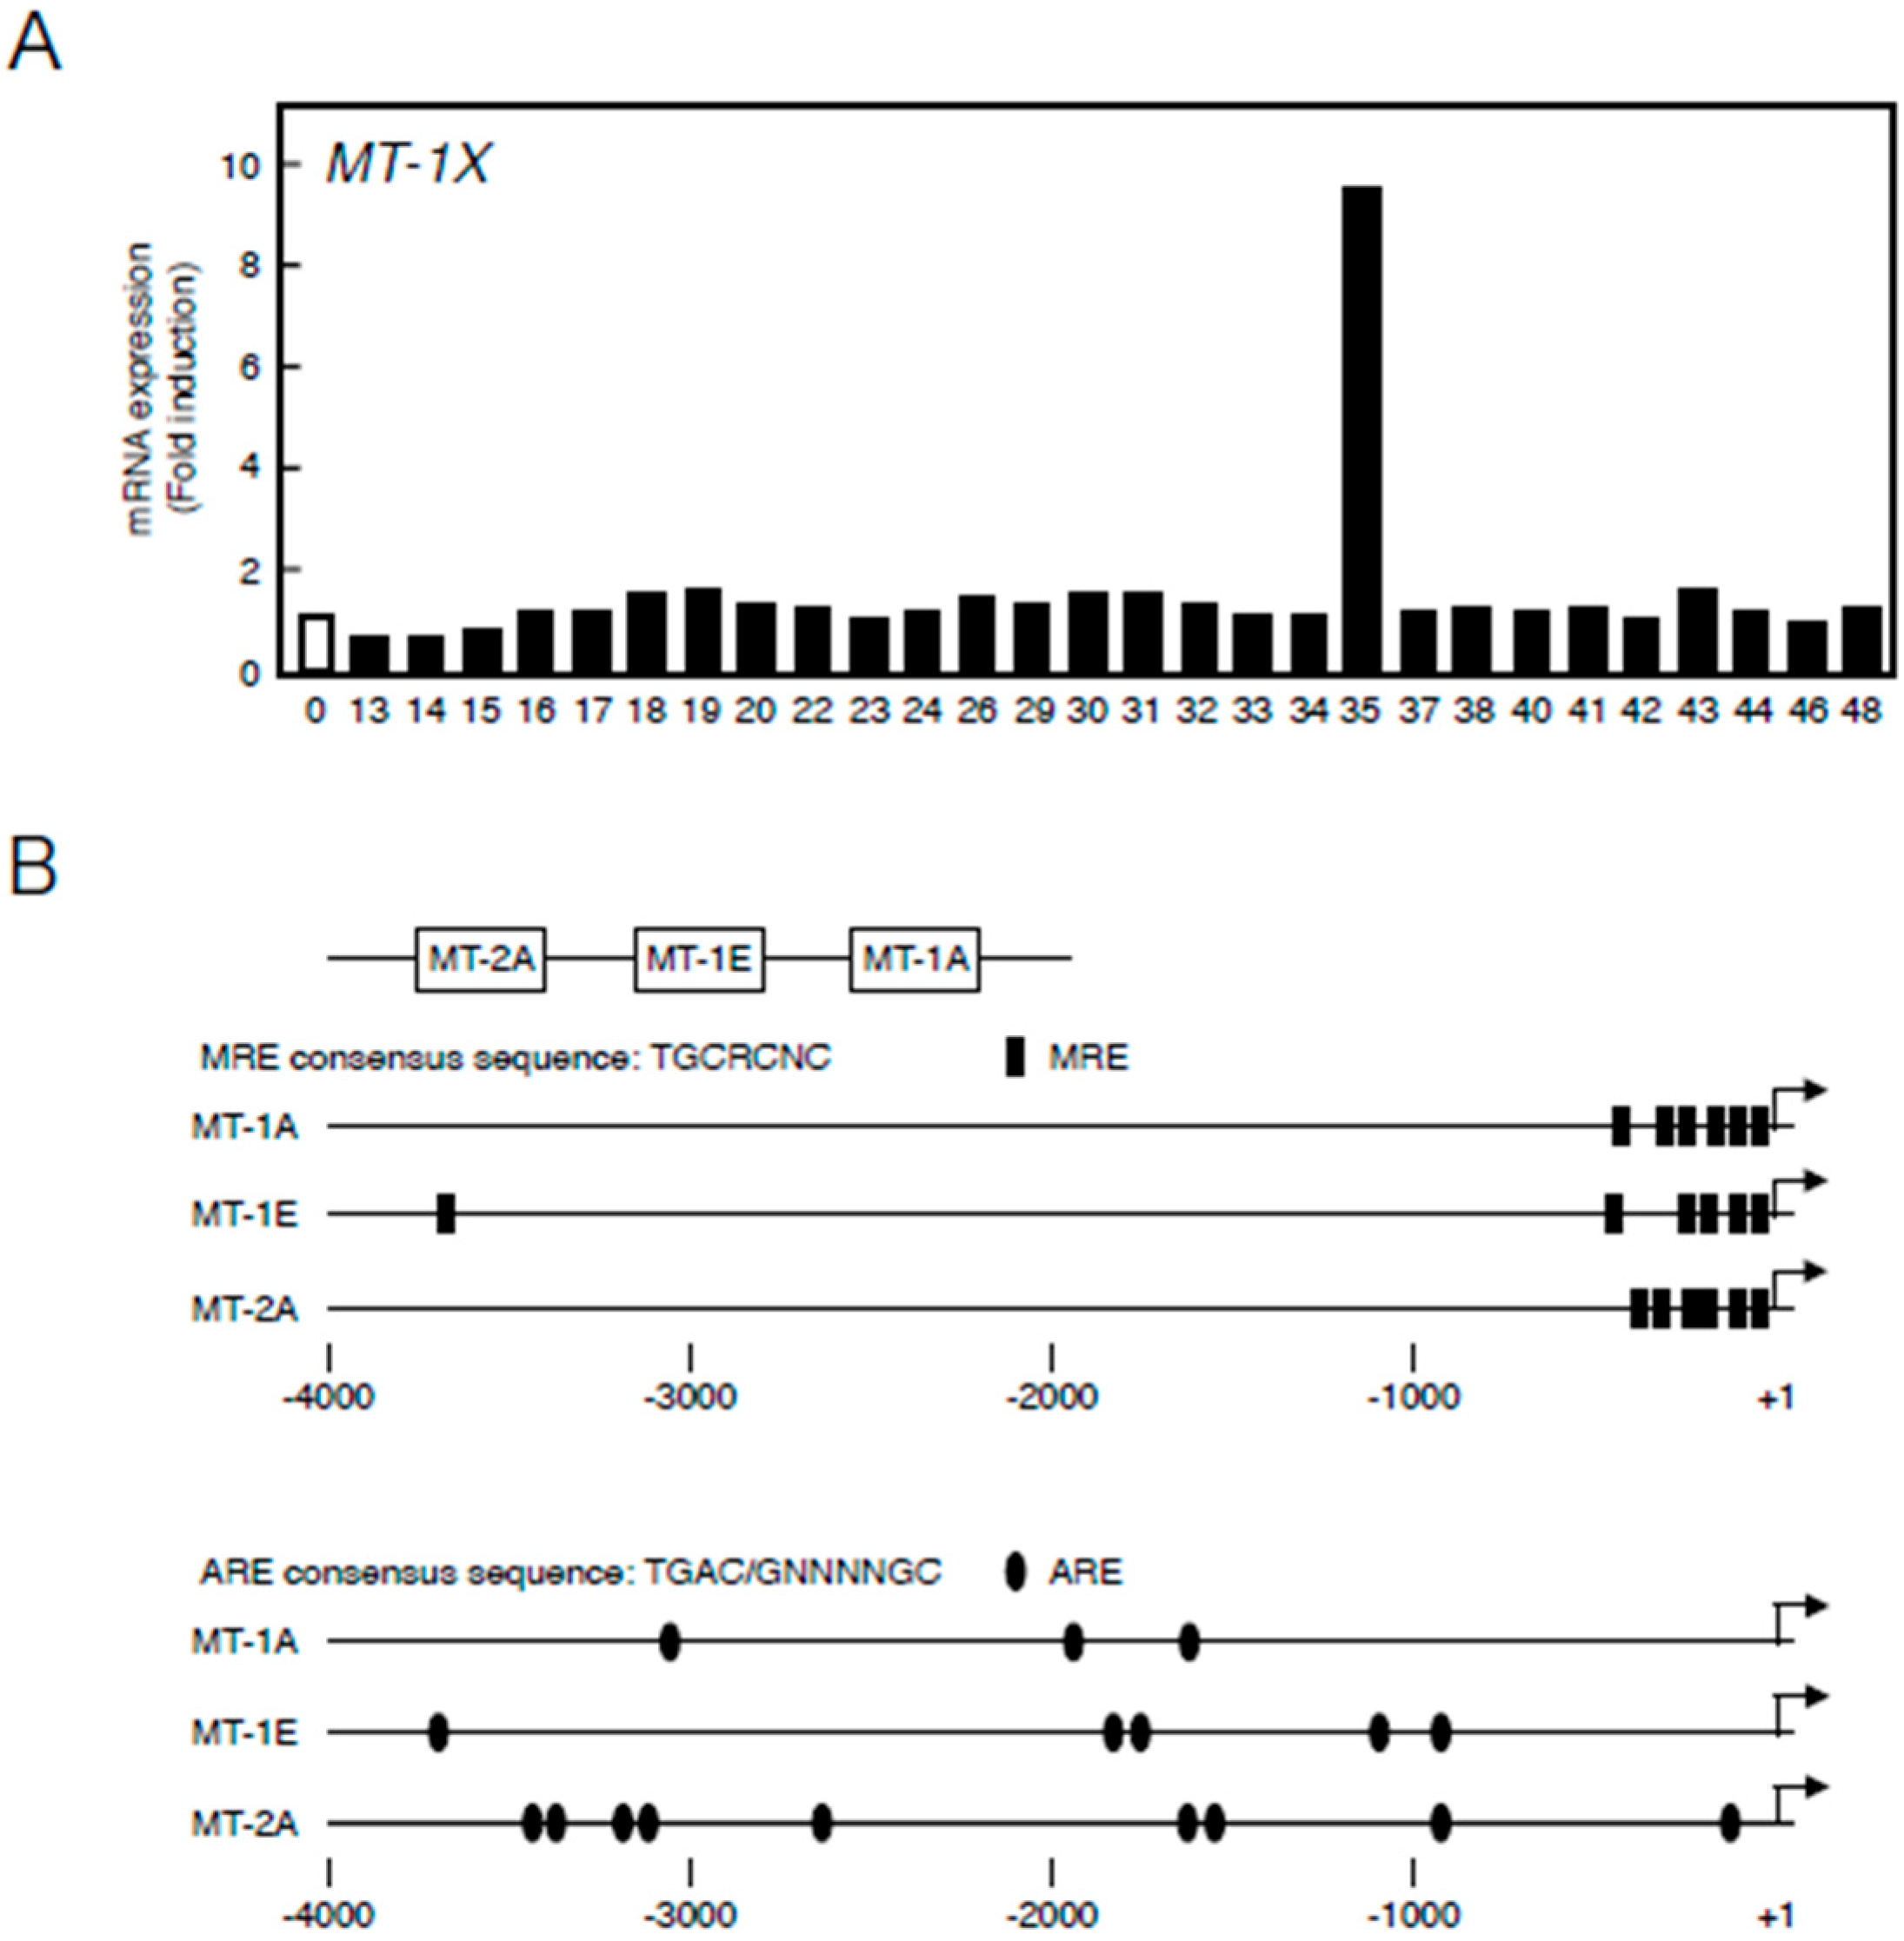
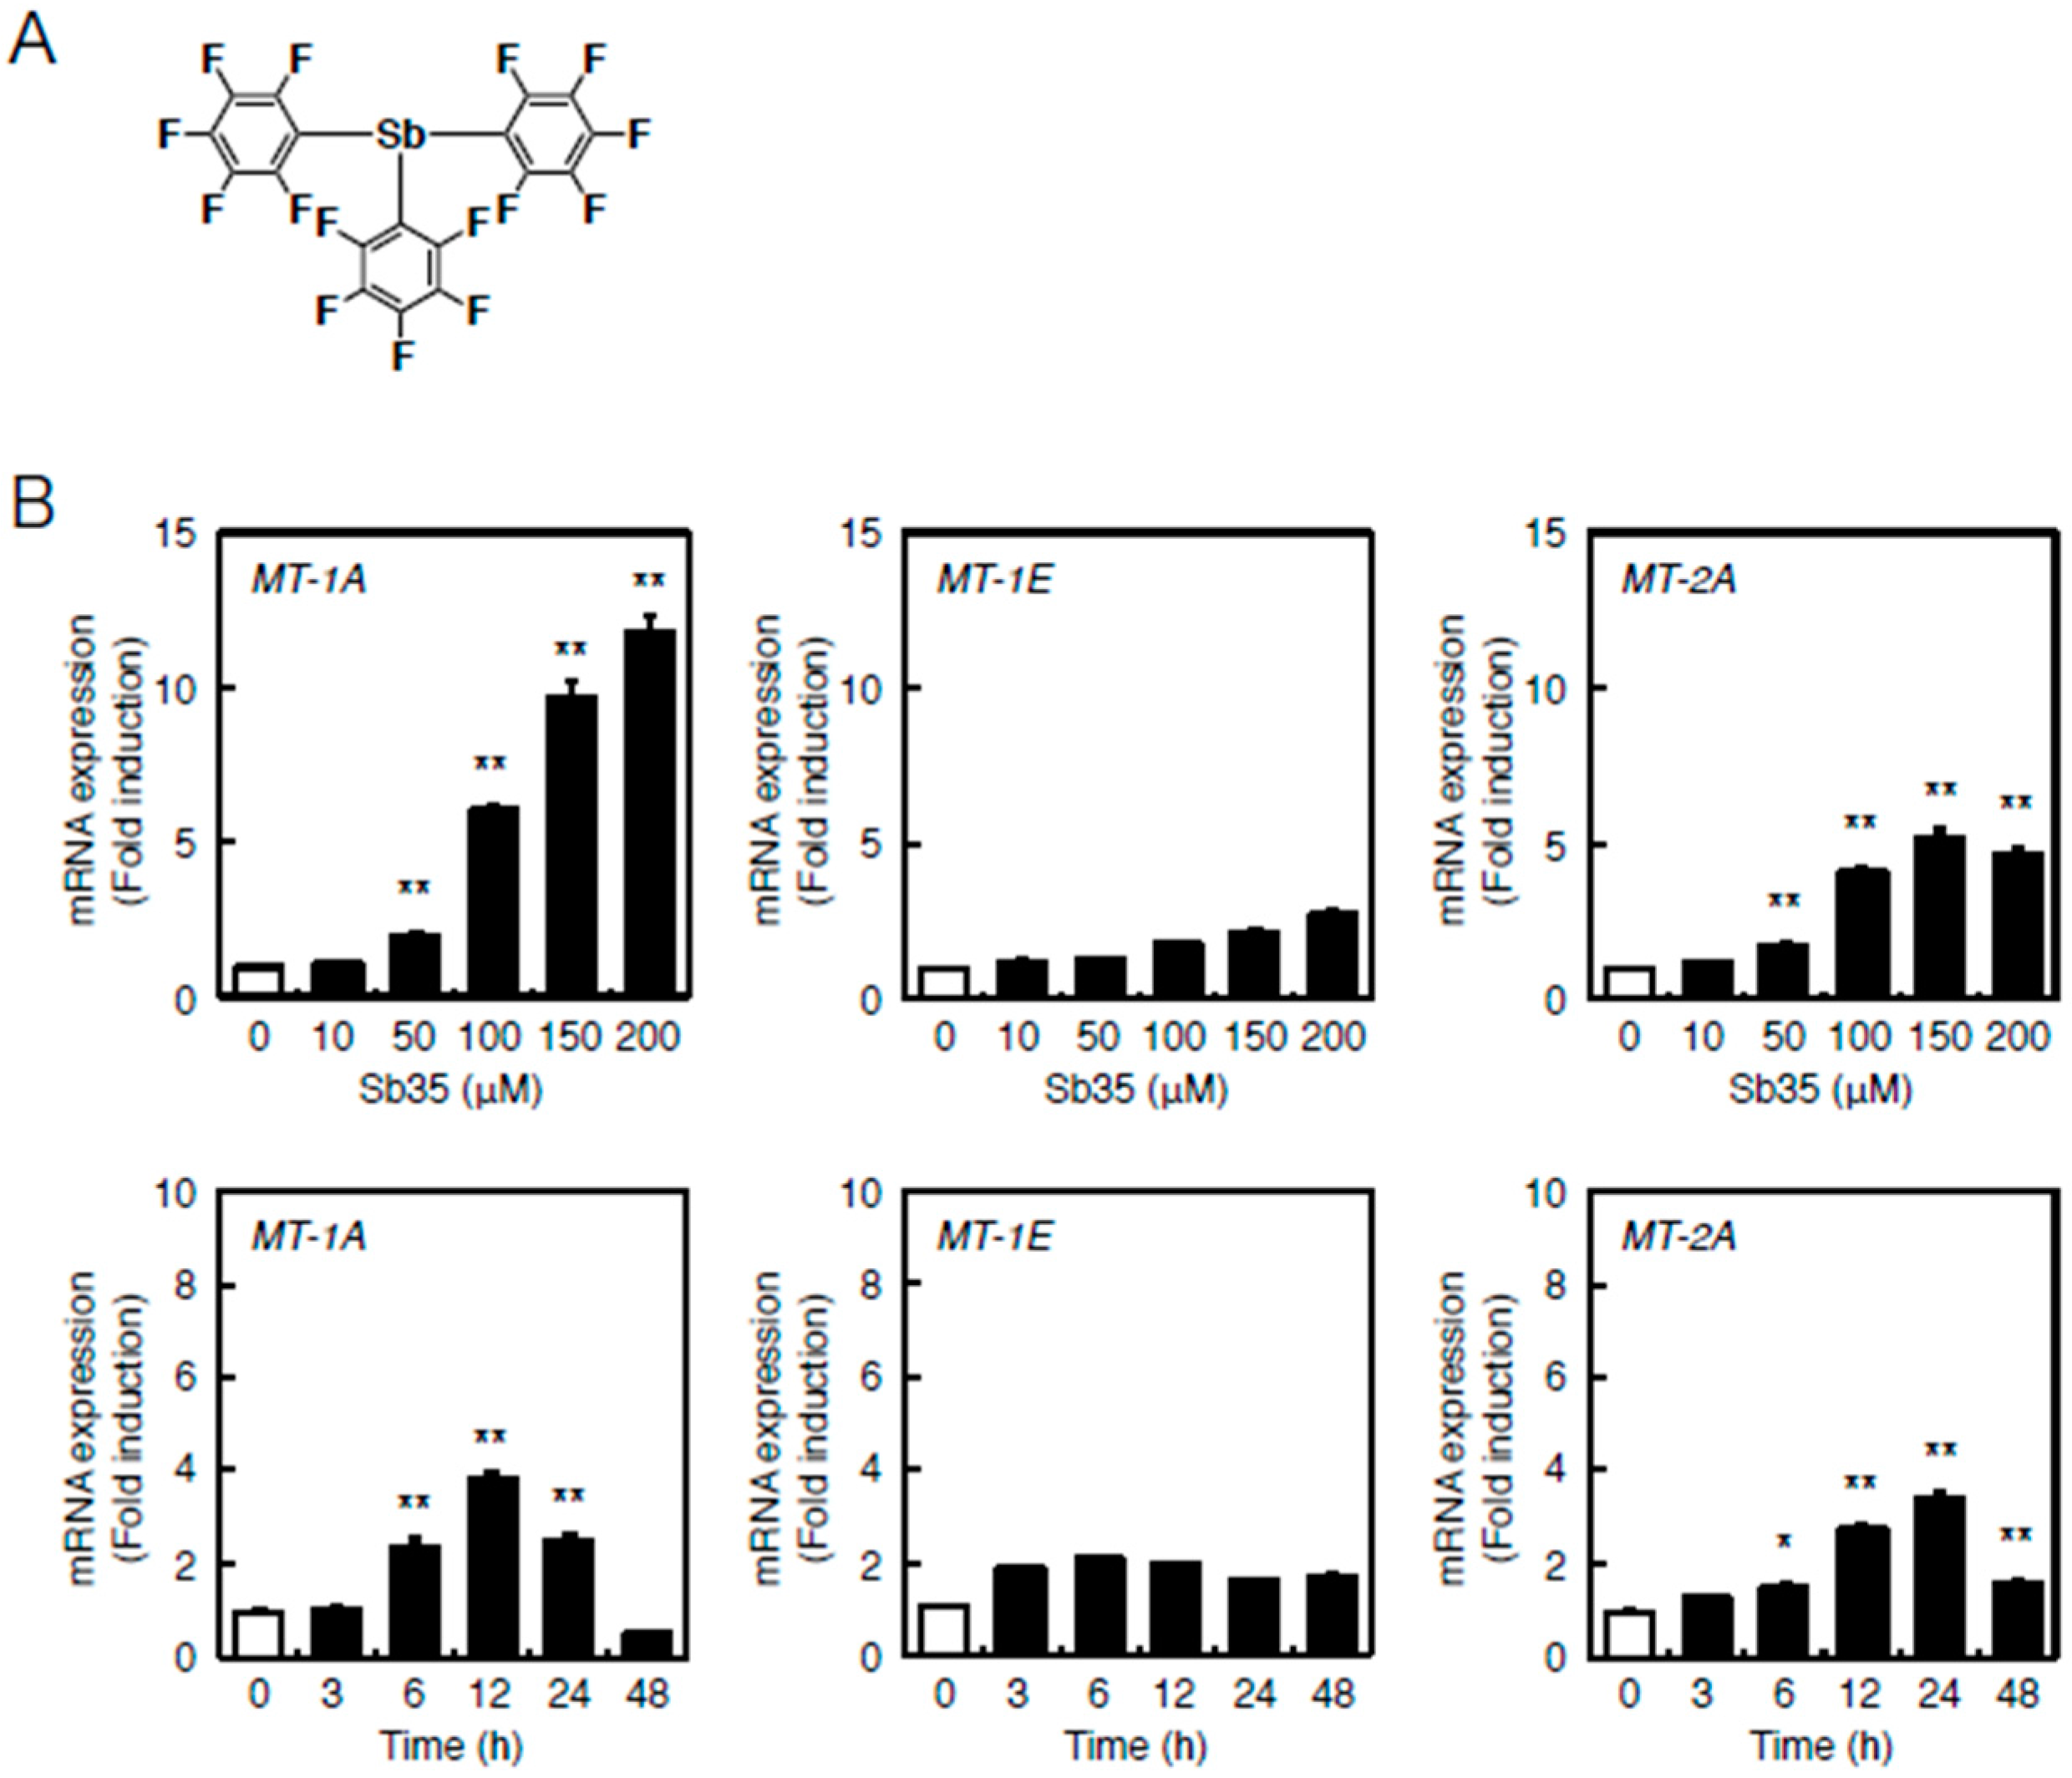
2.1. Transcriptional Induction of MT Isoforms by Sb35
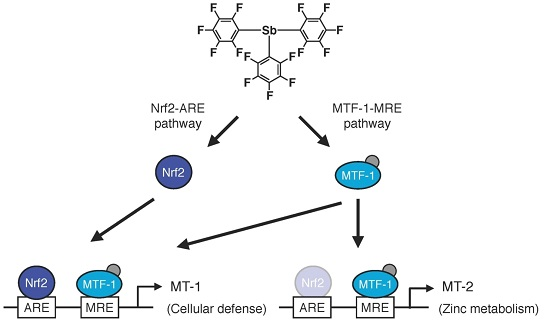
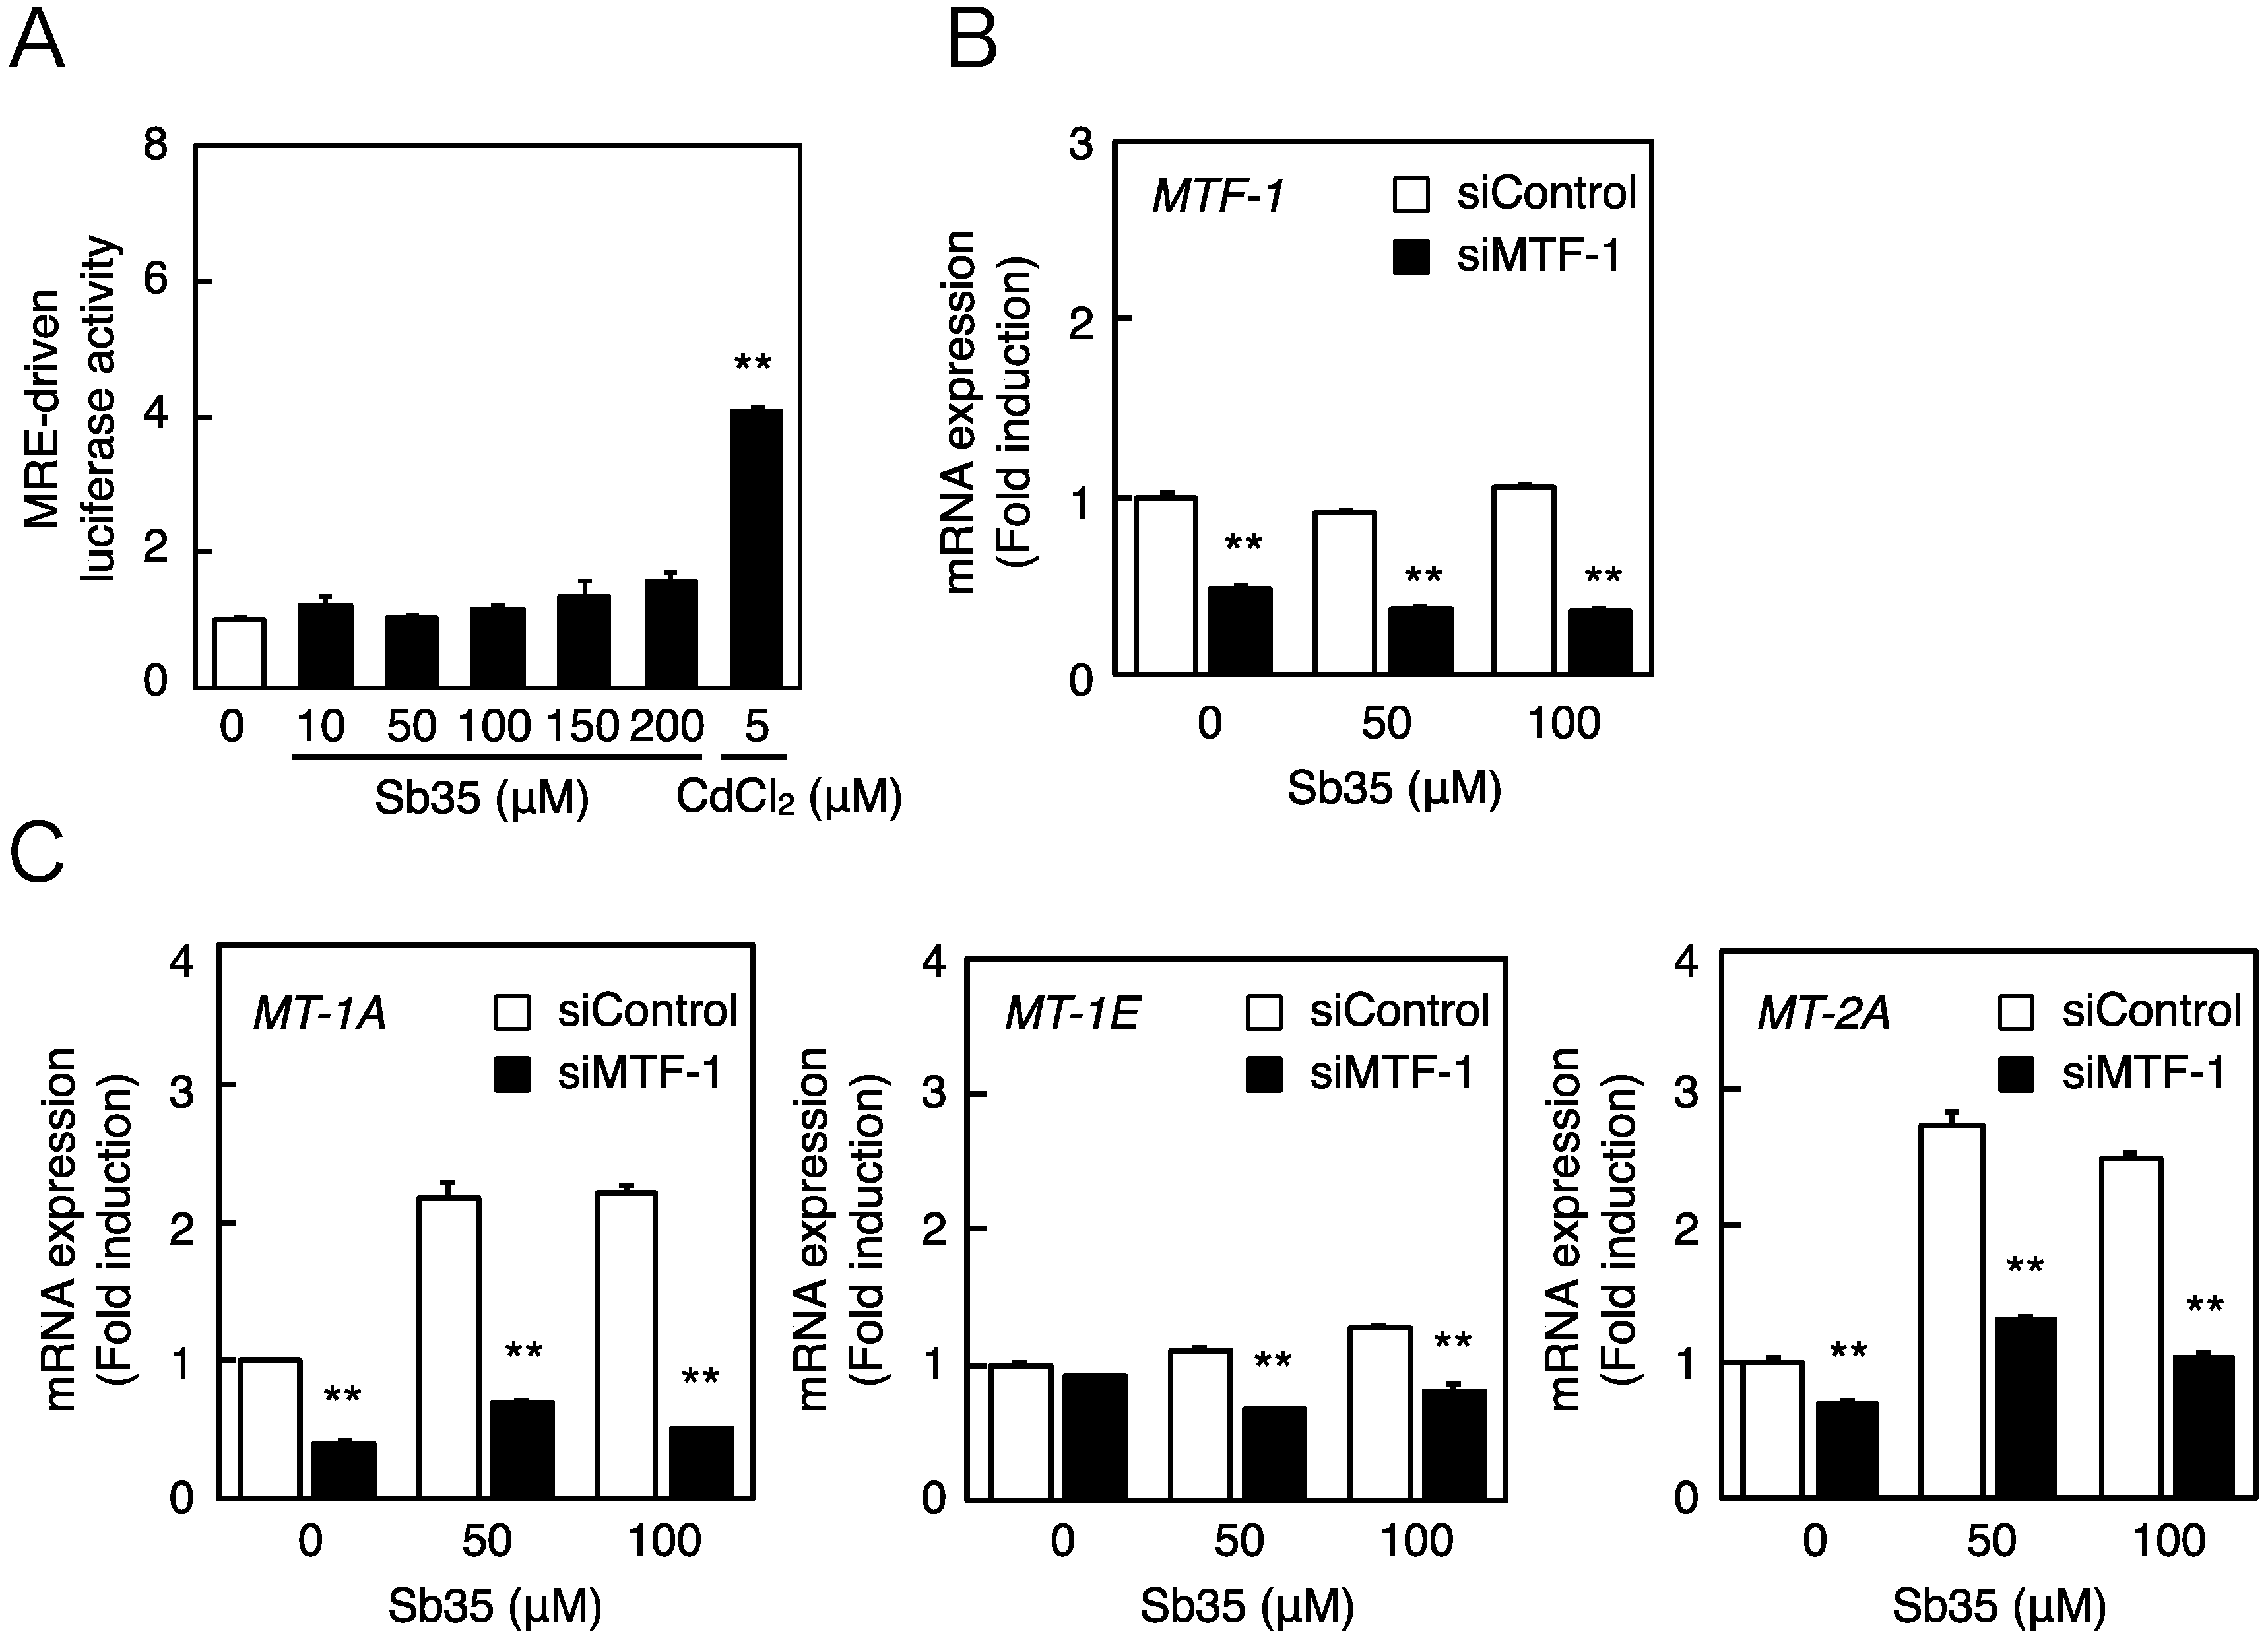
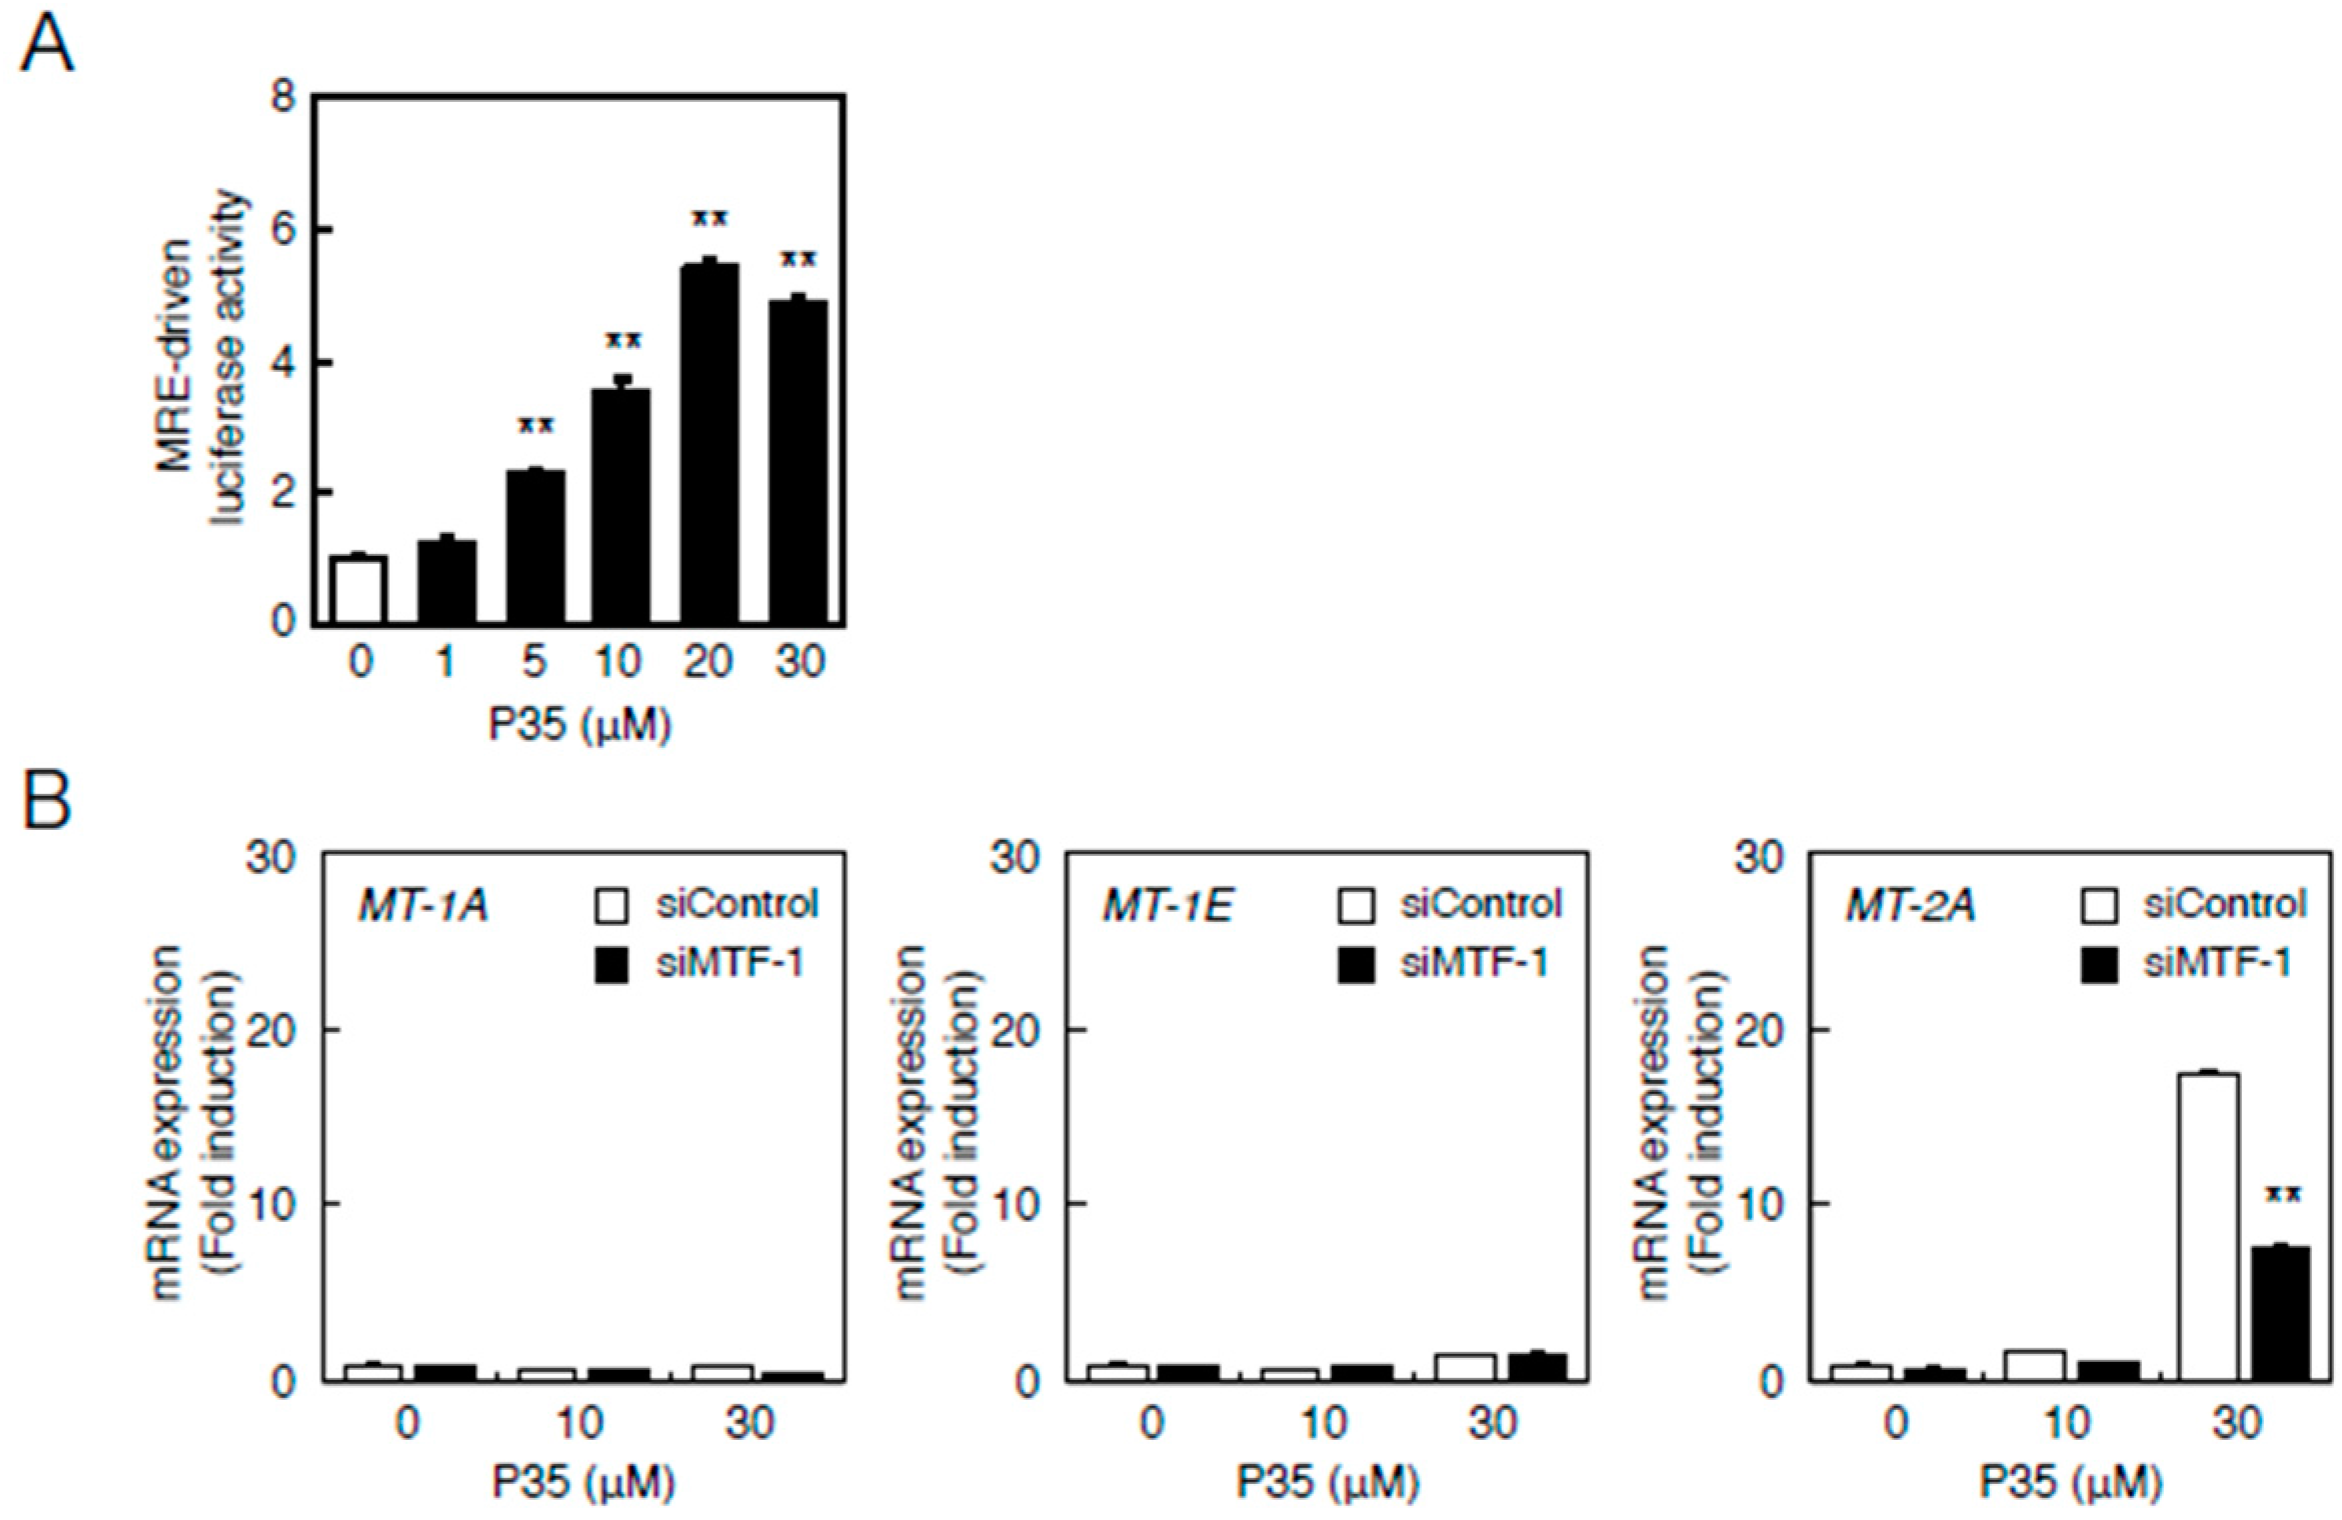
2.2. Involvement of the MTF-1–MRE Pathway
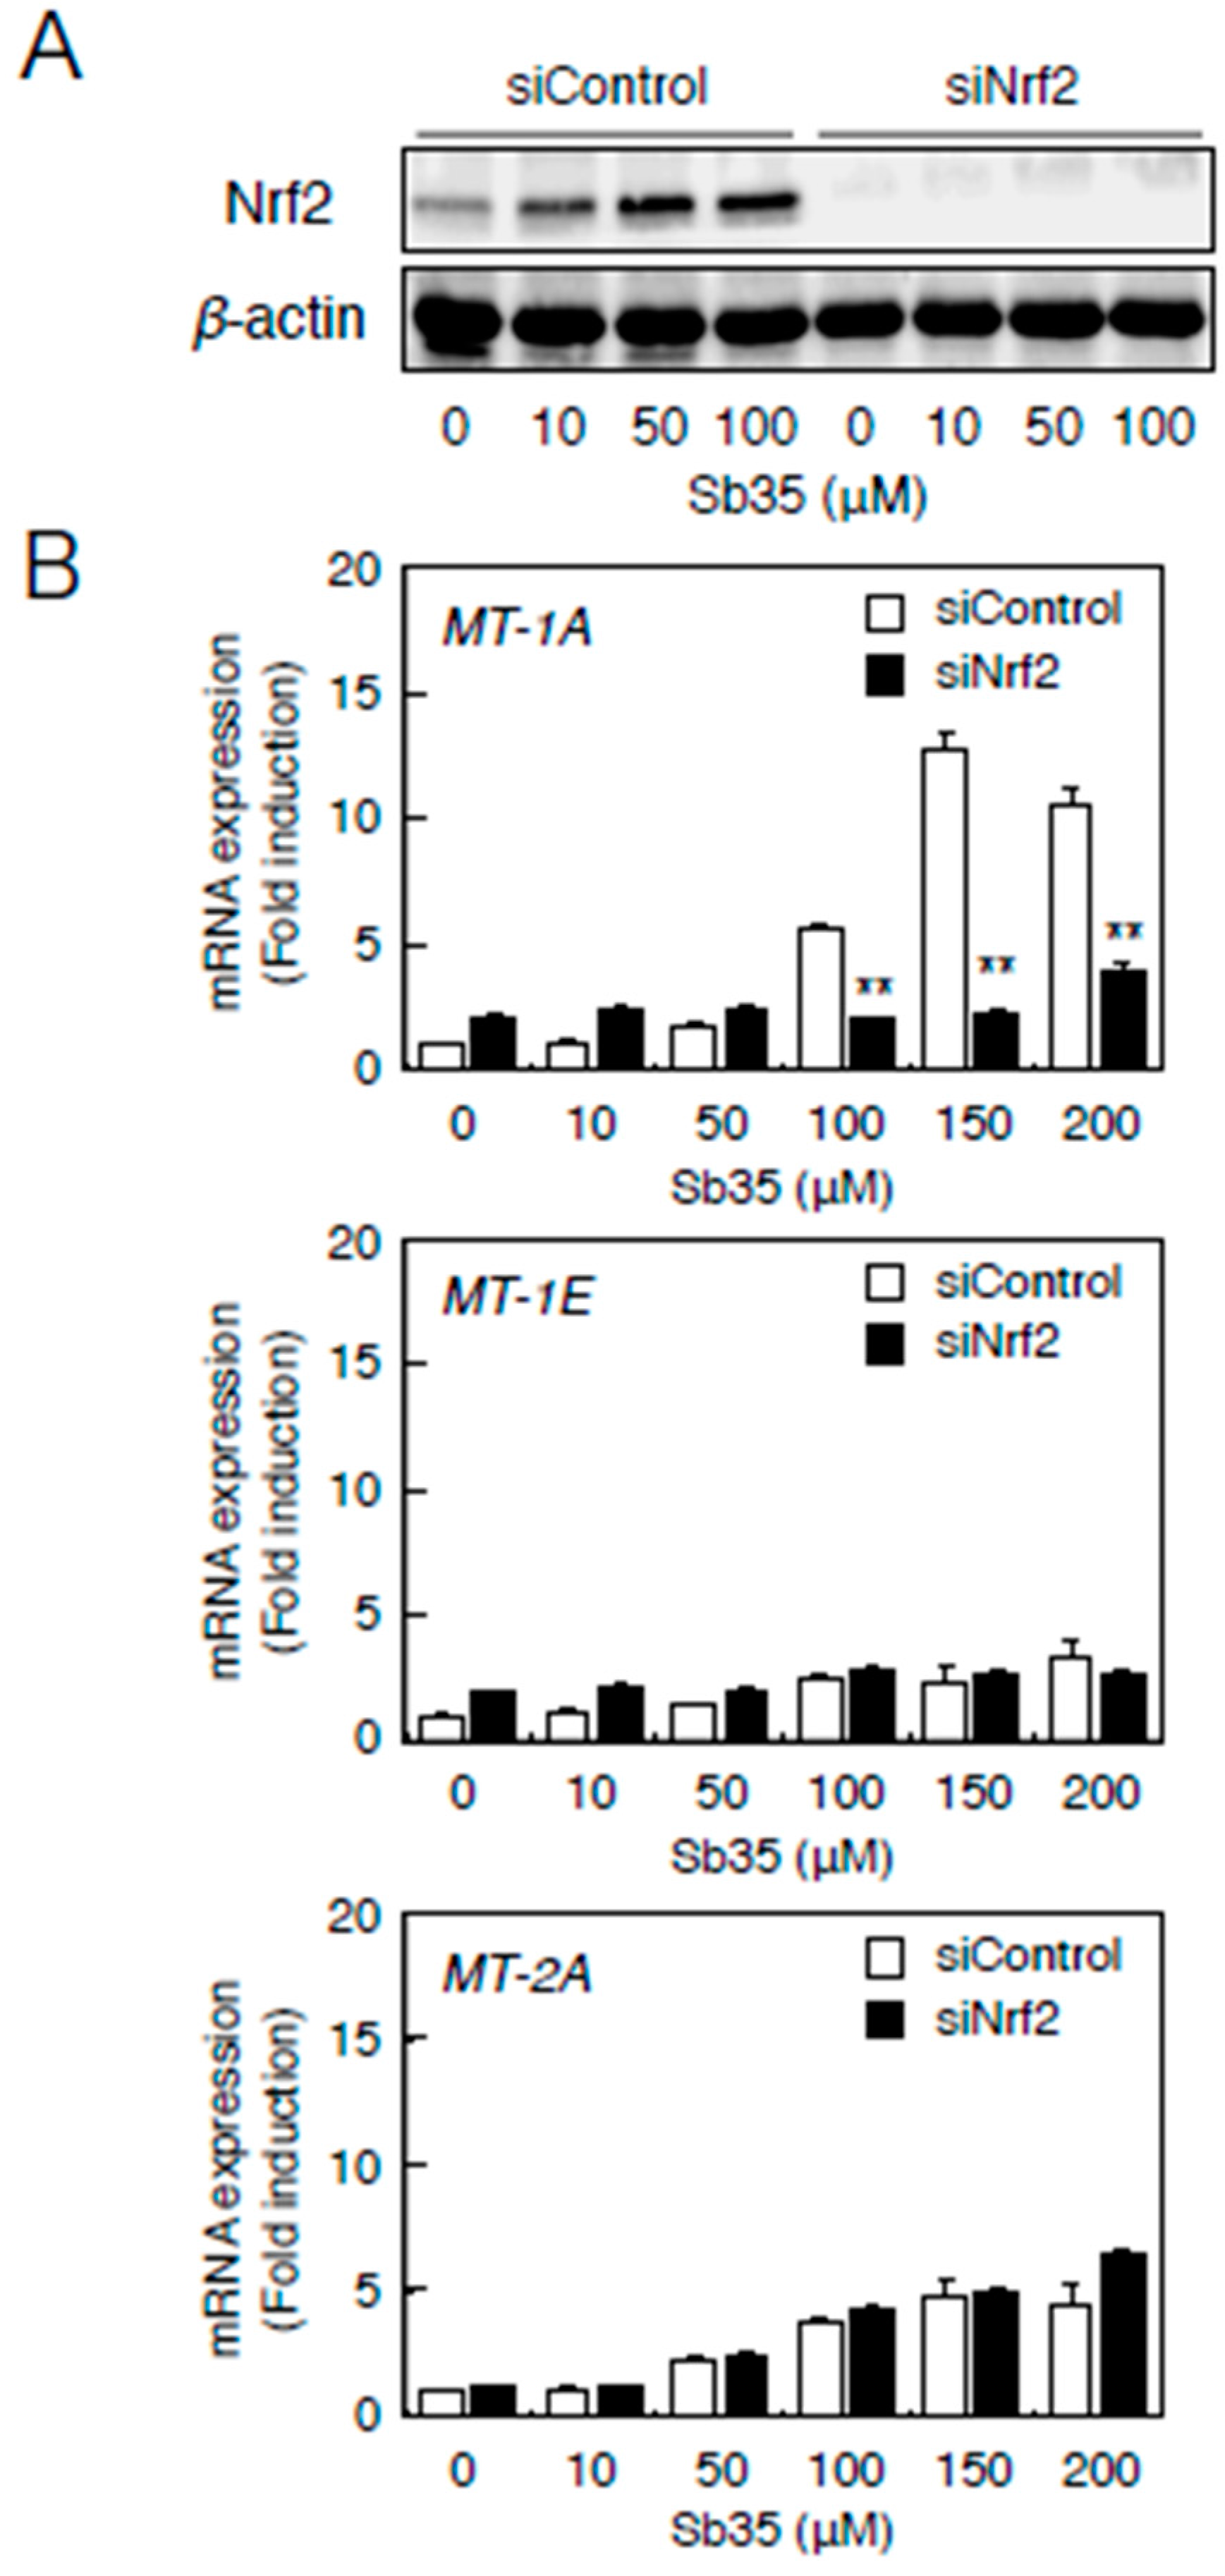
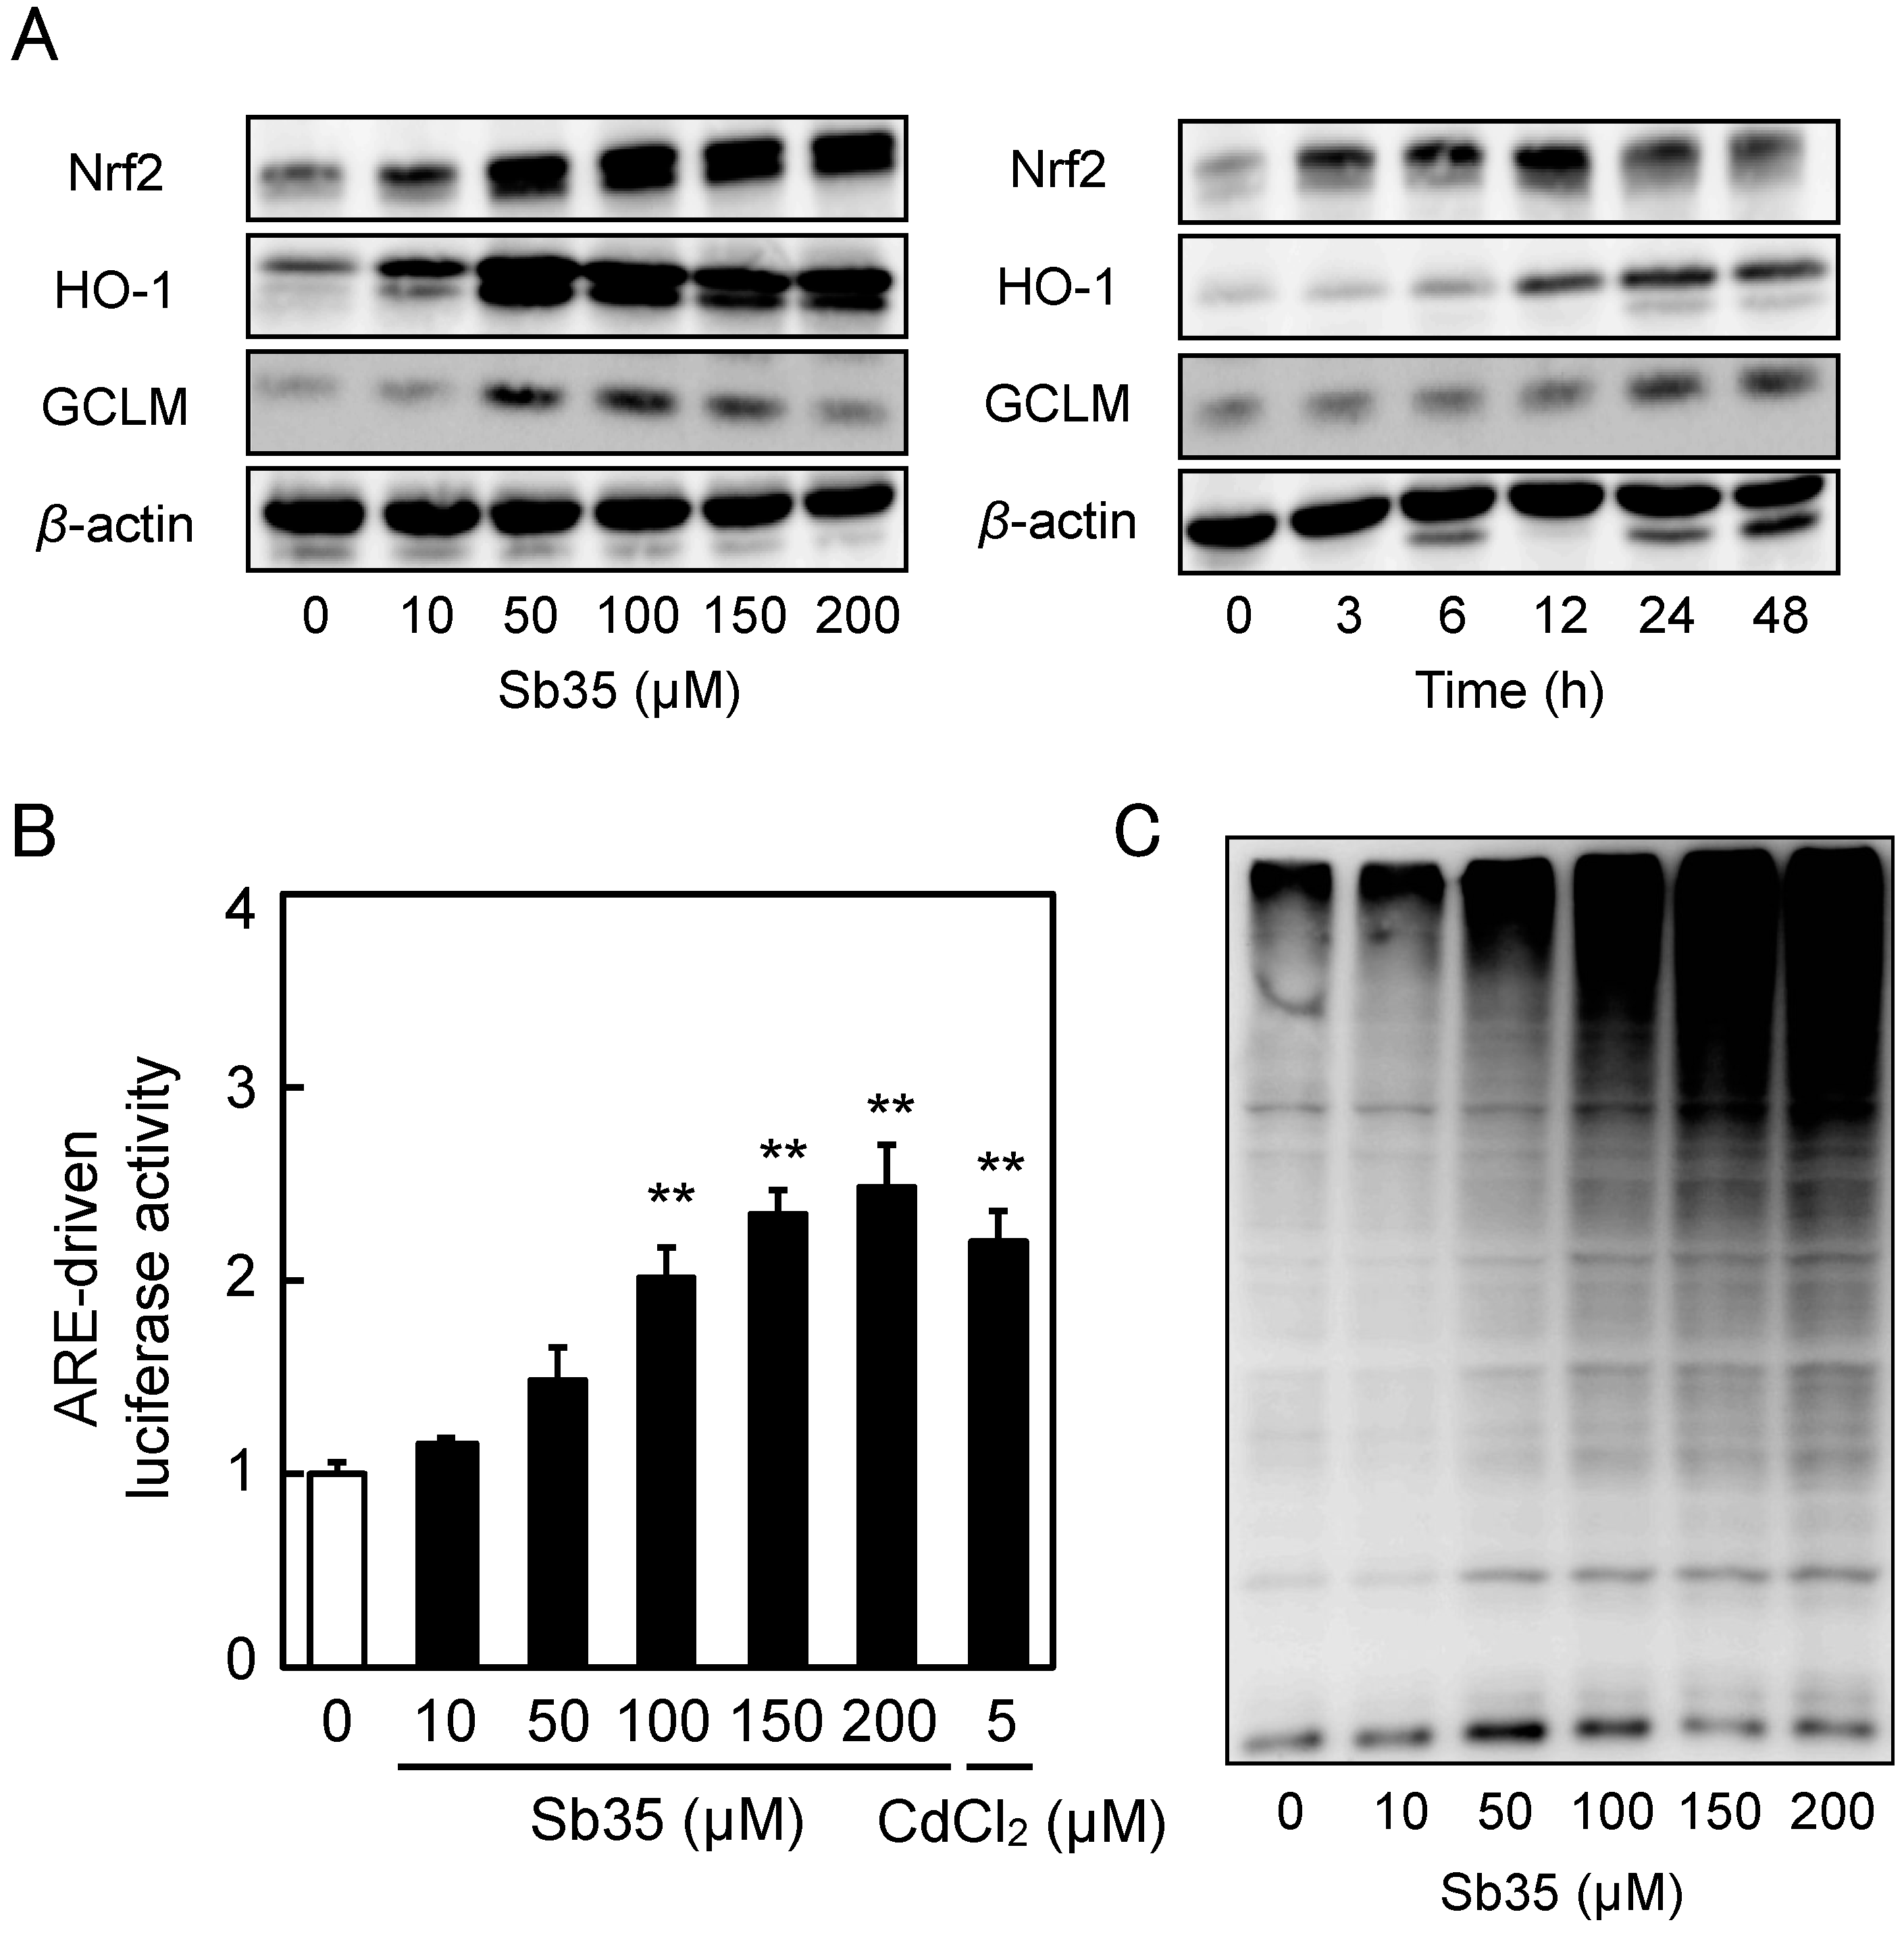
2.3. Involvement of the Nrf2–ARE Pathway
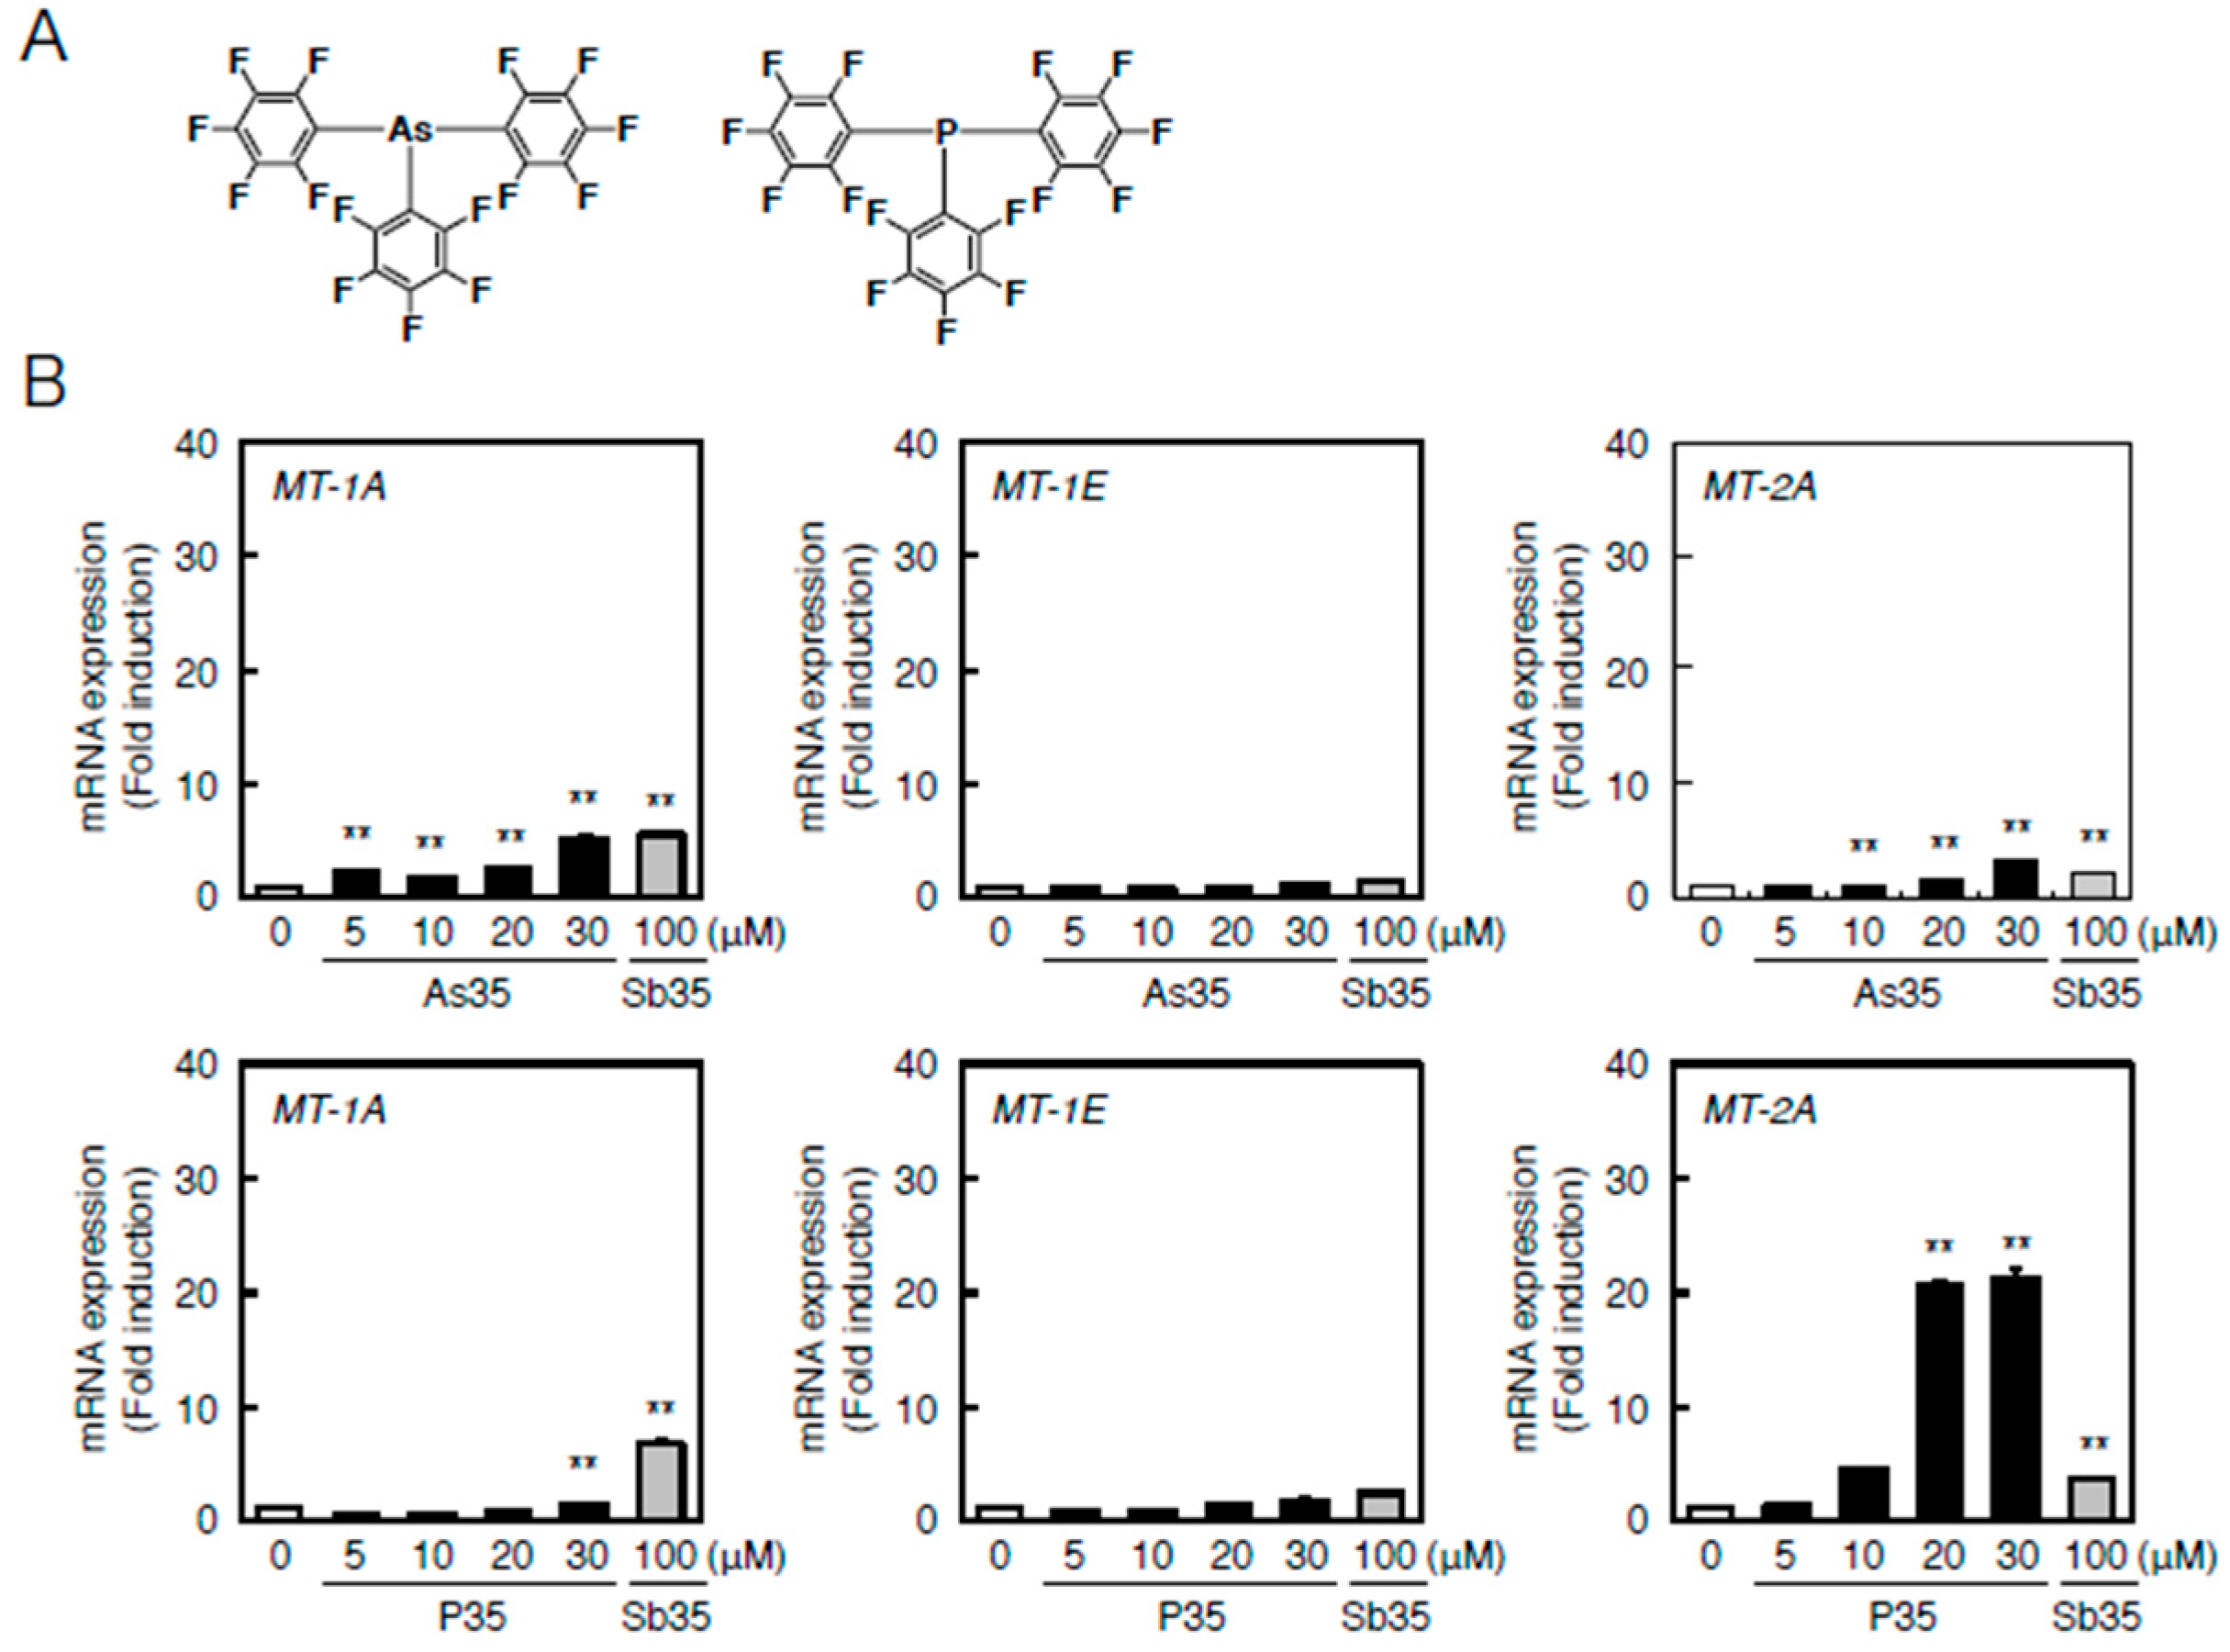
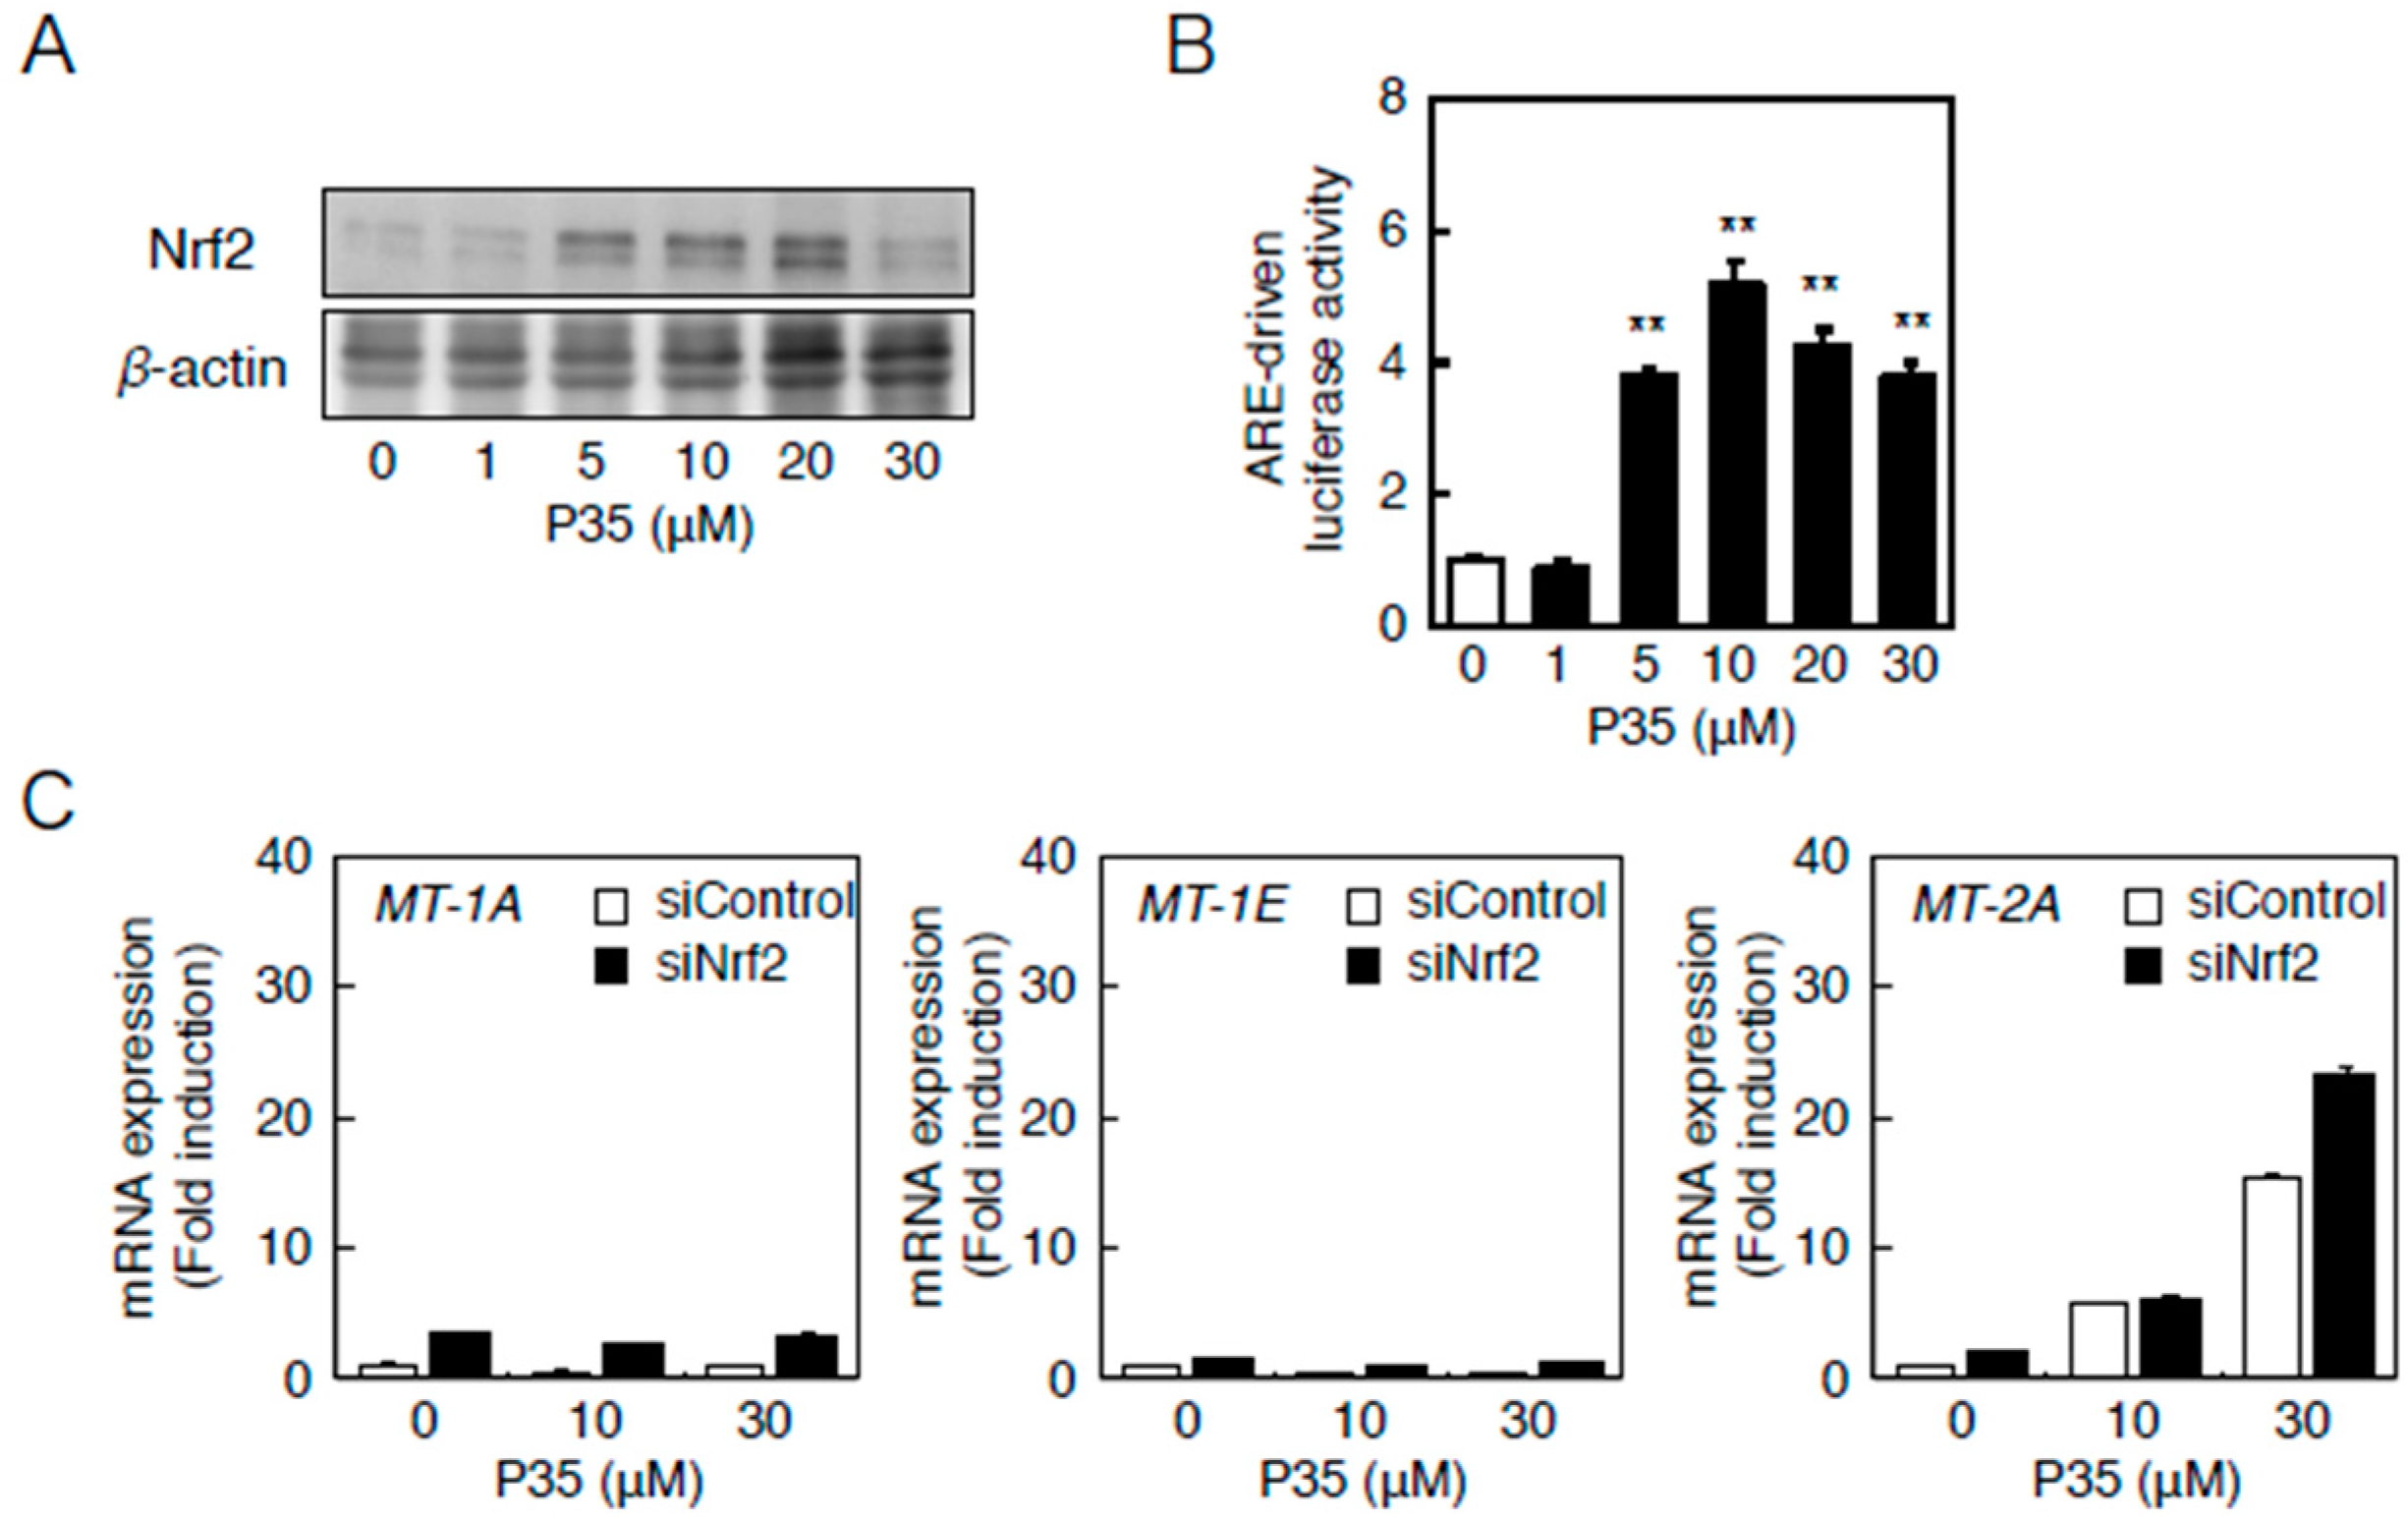
2.4. Determination of the Pathway Involved in the Transcriptional Induction of Endothelial MT Using Tris(pentafluorophenyl)phosphane (P35)
3. Discussion
4. Experimental Section
4.1. Synthesis of Sb35, P35, and As35
4.2. Cell Culture and Treatment
4.3 Transfection
4.4. Luciferase Assay
4.5. Real-Time RT-PCR
4.6. Western Blot Analysis
4.7. Statistical Analysis
Supplementary Materials
Acknowledgments
Author Contributions
Conflicts of Interest
Abbreviations
| ARE | Antioxidant Response Element |
| As35 | Tris(pentafluorophenyl)arsane |
| GAPDH | Glyceraldehydes-3-Phosphate Dehydrogenase |
| GCLM | Glutamate-Cysteine Ligase, Modifier subunit |
| HO-1 | Heme Oxygenase-1 |
| MRE | Metal Responsive Element |
| MTF-1 | Metal response element-binding Transcription Factor-1 |
| Nrf2 | Nuclear Factor-erythroid 2-related factor 2 |
| P35 | Tris(pentafluorophenyl)phosphane |
| Sb35 | Tris(pentafluorophenyl)stibane |
| siRNA | Small interfering RNA |
References
- Margoshes, M.; Vallee, B.L. A cadmium protein from equine kidney cortex. J. Am. Chem. Soc. 1957, 79, 4813–4814. [Google Scholar] [CrossRef]
- Blindauer, C.A.; Metallothionein, F. Transport and Storage of Metal Ions in Biological Cells (RSC Metallobiology Series 2); Maret, W., Wedd, A., Eds.; The Royal Society of Chemistry: Cambridge, UK, 2014; pp. 606–665. [Google Scholar]
- Quaife, C.J.; Findley, S.D.; Erickson, J.C.; Froelick, G.J.; Kelly, E.J.; Zambrowicz, B.P.; Palmiter, R.D. Induction of a new metallothionein isoform (MT-IV) occurs during differentiation of stratified squamous epithelia. Biochemistry 1994, 33, 7250–7259. [Google Scholar] [CrossRef] [PubMed]
- Yeiser, E.C.; Fitch, C.A.; Horning, M.S.; Rutkoski, N.; Levenson, C.W. Regulation of metallothionein-3 mRNA by thyroid hormone in developing rat brain and primary cultures of rat astrocytes and neurons. Brain Res. Dev. Brain Res. 1999, 115, 195–200. [Google Scholar] [CrossRef]
- Kägi, J.M. Overview of metallothionein. Methods Enzymol. 1999, 205, 613–626. [Google Scholar]
- Sato, M.; Bremner, I. Oxygen free radicals and metallothionein. Free Radic. Biol. Med. 1993, 14, 325–337. [Google Scholar] [CrossRef]
- Searle, P.F.; Davison, B.L.; Stuart, G.W.; Wilkie, T.M.; Norstedt, G.; Palmiter, R.D. Regulation, linkage, and sequence of mouse metallothionein I and II genes. Mol. Cell. Biol. 1984, 4, 1221–1230. [Google Scholar] [CrossRef] [PubMed]
- Yagle, M.K.; Palmiter, R.D. Coordinate regulation of mouse metallothionein I and II genes by heavy metals and glucocorticoids. Mol. Cell. Biol. 1985, 5, 291–294. [Google Scholar] [CrossRef] [PubMed]
- Kobayashi, S.; Sayato-Suzuki, J. Isolation of mouse isometallothioneins—A comparison of isometallothioneins in growing cells and post-mitotic cells. Biochem. J. 1988, 251, 649–655. [Google Scholar] [CrossRef] [PubMed]
- Kershaw, W.C.; Lehman-McKeeman, L.D.; Klaassen, C.D. Hepatic isometallothioneins in mice: Induction in adults and postnatal ontogeny. Toxicol. Appl. Pharmacol. 1990, 104, 267–275. [Google Scholar] [CrossRef]
- Jahroudi, N.; Foster, R.; Price-Haughey, J.; Beitel, G.; Gedamu, L. Cell-type specific and differential regulation of the human metallothionein genes. Correlation with DNA methylation and chromatin structure. J. Biol. Chem. 1990, 265, 6506–6511. [Google Scholar] [PubMed]
- Cavigelli, M.; Kägi, J.H.; Hunziker, P.E. Cell- and inducer-specific accretion of human isometallothioneins. Biochem. J. 1993, 292, 551–554. [Google Scholar] [CrossRef] [PubMed]
- Somji, S.; Sens, M.A.; Lamm, D.L.; Garrett, S.H.; Sens, D.A. Metallothionein isoform 1 and 2 gene expression in the human bladder: Evidence for regulation of MT-1X mRNA in bladder cancer. Cancer Detect. Prev. 2001, 25, 62–75. [Google Scholar] [PubMed]
- Lim, D.; Phann, T.T.; Yip, G.W.; Bay, B.H. Up-regulation of metallothionein isoforms in keloid keratinocytes. Int. J. Mol. Med. 2006, 17, 385–389. [Google Scholar] [CrossRef] [PubMed]
- Hauchel, R.; Radtke, F.; Georgiev, O.; Stark, G.; Aguet, M.; Schaffner, W. The transcription factor MTF-1 is essential for basal and heavy metal-induced metallothionein gene expression. EMBO J. 1994, 13, 2870–2875. [Google Scholar]
- Stuart, G.W.; Searle, P.F.; Palmiter, R.D. Identification of multiple metal regulatory elements in mouse metallothionein-I promoter by assaying synthetic sequences. Nature 1985, 317, 828–831. [Google Scholar] [CrossRef] [PubMed]
- Culotta, V.C.; Hamer, D.H. Fine mapping of a mouse metallothionein gene metal response element. Mol. Cell. Biol. 1989, 9, 1376–1380. [Google Scholar] [CrossRef] [PubMed]
- Palmiter, R.D. Molecular biology of metallothionein gene expression. Exp. Suppl. 1987, 52, 63–80. [Google Scholar]
- Ohtsuji, M.; Katsuoka, F.; Kobayashi, A.; Aburatani, H.; Hayes, J.D.; Yamamoto, M. Nrf1 and Nrf2 play distinct roles in activation of antioxidant response element-dependent genes. J. Biol. Chem. 2008, 283, 33554–33562. [Google Scholar] [CrossRef] [PubMed]
- Dalton, T.; Palmiter, R.D.; Andrews, G.K. Transcriptional induction of the mouse metallothionein-1 gene in hydrogen peroxide-treated Hepa cells involves a composite major late transcription factor/antioxidant response element and metal response promoter element. Nucleic Acids Res. 1994, 22, 5016–5023. [Google Scholar] [CrossRef] [PubMed]
- Harker, L.A.; Schwartz, S.M.; Ross, R. Endothelium and arteriosclerosis. Clin. Haematol. 1981, 10, 283–296. [Google Scholar] [PubMed]
- Kägi, J.M.; Schaffer, A. Biochemistry of metallothionein. Biochemistry 1988, 27, 8509–8515. [Google Scholar] [CrossRef] [PubMed]
- Messner, B.; Knoflach, M.; Seubert, A.; Ritsch, A.; Pfller, K.; Henderson, B.; Shen, Y.H.; Zeller, I.; Willeit, G.; Laufer, G.; et al. Cadmium is a novel and independent risk factor for early atherosclerosis mechanisms and in vivo relevance. Atherioscler. Thromb. Res. 2009, 29, 1392–1398. [Google Scholar] [CrossRef] [PubMed]
- Houston, M.C. Role of mercury toxicity in hypertension, cardiovascular disease, and stroke. J. Clin. Hypertens. 2011, 13, 621–627. [Google Scholar] [CrossRef] [PubMed]
- Thornalley, P.J.; Vasák, M. Possible role for metallothionein in protection against radiation-induced oxidative stress. Kinetics and mechanism of its reaction with superoxide and hydroxyl radicals. Biochim. Biophys. Acta 1985, 21, 36–44. [Google Scholar] [CrossRef]
- Kaji, T.; Mishima, A.; Koyanagi, E.; Yamamoto, C.; Sakamoto, M.; Kozuka, H. Possible mechanism for zinc protection against cadmium cytotoxicity in cultured vascular endothelial cells. Toxicology 1992, 76, 257–270. [Google Scholar] [CrossRef]
- Fujie, T.; Segawa, Y.; Uehara, A.; Nakamura, T.; Kimura, T.; Yoshida, E.; Yamamoto, C.; Uchiyama, M.; Naka, H.; Kaji, T. Zinc diethyldithiocarbamate as an inducer of metallothionein in cultured vascular endothelial cells. J. Toxicol. Sci. 2016, 41, 217–224. [Google Scholar] [CrossRef] [PubMed]
- Bobilya, D.J.; Reynolds, J.T.; Faia, K.L.; Briske-Anderson, M.; Reeves, P.G. Zinc-related metallothionein metabolism in bovine pulmonary artery endothelial cells. J. Nutr. Biochem. 1999, 10, 139–145. [Google Scholar] [CrossRef]
- Schulkens, I.A.; Castricum, K.C.M.; Weijers, E.M.; Koolwijk, P.; Griffioen, A.W.; Thijssen, V.L. Expression, regulation and function of human metallothioneins in endothelial cells. J. Vasc. Res. 2014, 51, 231–238. [Google Scholar] [CrossRef] [PubMed]
- Grignard, V. Some new organometallic combinations of magnesium and their application to the synthesis of alcohols and hydrocarbons. C. R. Acad. Sci. 1900, 130, 1322–1324. [Google Scholar]
- Wittig, G.; Schöllkopf, U. Triphenylphosphinemethylene as an olefin-forming reagent. Chem. Ber. 1954, 97, 1318–1330. [Google Scholar] [CrossRef]
- Kohri, K.; Yoshida, E.; Yasuike, S.; Fujie, T.; Yamamoto, C.; Kaji, T. The cytotoxicity of organobismuth compounds with certain molecular structures can be diminished by replacing the bismuth atom with an antimony atom in the molecules. J. Toxicol. Sci. 2015, 40, 321–327. [Google Scholar] [CrossRef] [PubMed]
- Murakami, M.; Fujie, T.; Matsumura, M.; Yoshida, E.; Yamamoto, C.; Fujiwara, Y.; Yasuike, S.; Kaji, T. Comparative cytotoxicity of triphenylstibane and fluorine-substituted triarylpnictogens in cultured vascular endothelial cells. Fundam. Toxicol. Sci. 2015, 2, 61–66. [Google Scholar] [CrossRef]
- Gunther, V.; Lindert, U.; Schaffner, W. The taste of heavy metals: Gene regulation by MTF-1. Biochim. Biophys. Acta 2012, 1823, 1416–1425. [Google Scholar] [CrossRef] [PubMed]
- Krizkova, S.; Kepinska, M.; Emri, G.; Rodrigo, M.A.M.; Tmejova, K.; Nerudova, D.; Kizek, R.; Adam, V. Microarray analysis of metallothionein in human diseases. J. Pharm. Biomed. Anal. 2016, 117, 464–473. [Google Scholar] [CrossRef] [PubMed]
- Katsutani, K.; Ito, N.; Kanekiyo, M.; Muto, N.; Tanaka, K. Requirement for cooperative interaction of interleukin-6 responsive element type 2 and glucocorticoid responsive element in the synergistic activation of mouse metallothionein-1 gene by interleukin-6 and glucocorticoid. Toxicol. Appl. Pharmacol. 1998, 151, 143–151. [Google Scholar] [CrossRef] [PubMed]
- Alam, J.; Stewart, D.; Touchard, C.; Boinapally, S.; Choi, S.M.K.; Cook, J.L. Nrf2, a Cap’n’Collar transcription factor, regulates induction of the heme oxygenase-1 gene. J. Biol. Chem. 1999, 274, 26071–26078. [Google Scholar] [CrossRef] [PubMed]
- Erickson, A.M.; Nevarea, Z.; Gipp, J.J.; Muleahy, R.T. Identification of a variant antioxidant response element in the promoter of the human glutamate-cysteine ligase modifier subunit gene. J. Biol. Chem. 2002, 277, 30730–30737. [Google Scholar] [CrossRef] [PubMed]
- Artells, E.; Palacos, O.; Capdevila, M.; Atrian, S. Mammalian MT1 and MT2 metallothioneins differ in their metal binding abilities. Metallomics 2013, 5, 1397–1410. [Google Scholar] [CrossRef] [PubMed]
- Shinkai, Y.; Kimura, T.; Itagaki, A.; Yamamoto, C.; Taguchi, K.; Yamamoto, M.; Kumagai, Y.; Kaji, T. Partial contribution of the Keap1-Nrf2 system to cadmium-mediated metallothionein expression in vascular endothelial cells. Toxicol. Appl. Pharmacol. 2015, 295, 37–46. [Google Scholar] [CrossRef] [PubMed]
- Sun, Z.; Chin, Y.E.; Zhang, D.D. Acetylation of Nrf2 by p300/CBP augments promoter-specific DNA binding of Nrf2 during the antioxidant response. Mol. Cell. Biol. 2009, 29, 2658–2672. [Google Scholar]
- Stewart, D.; Killeen, E.; Naquin, R.; Alam, S.; Alam, J. Degradation of transcription factor Nrf2 via the ubiquitin-proteasome pathway and stabilization by cadmium. J. Biol. Chem. 2003, 278, 2396–2402. [Google Scholar] [CrossRef] [PubMed]
- Mercado, N.; Thimmulappa, R.; Thomas, C.M.R.; Fenwick, P.S.; Chana, K.K.; Donnelly, L.E.; Biswal, S.; Ito, K.; Barnes, P.J. Decreased histone deacetylase 2 impairs Nrf2 activation by oxidative stress. Biochem. Biophys. Res. Commun. 2011, 406, 292–298. [Google Scholar] [CrossRef] [PubMed]
- Fujie, T.; Murakami, M.; Yoshida, E.; Tachinami, T.; Shinkai, Y.; Fujiwara, Y.; Yamamoto, C.; Kumagai, Y.; Naka, H.; Kaji, T. Copper diethyldithiocarbamate as an activator of Nrf2 in cultured vascular endothelial cells. J. Biol. Inorg. Chem. 2016, 21, 263–273. [Google Scholar] [CrossRef] [PubMed]
- Chen, X.; Agarwal, A.; Giedroc, D.P. Structural and functional heterogeneity among the zinc fingers of human MRE-binding transcription factor-1. Biochemistry 1998, 37, 11152–11161. [Google Scholar] [CrossRef] [PubMed]
- Bittel, D.; Smirnova, I.V.; Andrew, G.K. Functional heterogeneity in the zinc finger of metalloregulatory protein metal response element-binding transcription factor-1. J. Biol. Chem. 2000, 275, 37194–37201. [Google Scholar] [CrossRef] [PubMed]
- Bittel, D.; Dalton, T.; Samson, S.L.; Gedamu, L.; Andrews, G.K. The DNA binding activity of metal response element-binding transcription factor-1 is activated in vivo and in vitro by zinc, but not by other transition metals. J. Biol. Chem. 1998, 273, 7127–7133. [Google Scholar] [CrossRef] [PubMed]
- Grotz, N.; Fox, T.; Connolly, E.; Park, W.; Guerinot, M.L.; Eide, D. Identification of a family of zinc transporter genes from Arabidopsis that respond to zinc deficiency. Proc. Natl. Acad. Sci. USA 1998, 95, 7220–7224. [Google Scholar] [CrossRef] [PubMed]
- Fukada, T.; Kambe, T. Molecular and genetic features of zinc transporters in physiology and pathogenesis. Metallomics 2011, 3, 662–674. [Google Scholar] [CrossRef] [PubMed]
- Taniguchi, M.; Fukunaka, A.; Hagihara, M.; Watanabe, K.; Kamino, S.; Kambe, T.; Enomoto, S.; Hironuma, M. Essential role of the zinc transporter ZIP9/SLC39A9 in regulating the activations of Akt and Erk in B-cell receptor signaling pathway in DT40 cells. PLoS ONE 2013, 8, e5822. [Google Scholar] [CrossRef] [PubMed]
- Taylor, K.M.; Hiscox, S.; Nicholson, R.I.; Hogstrand, C.; Kille, P. Structure-function analysis of HKE4, a member of the new LIV-1 subfamily of zinc transporters. Biochem. J. 2004, 377, 131–139. [Google Scholar] [CrossRef] [PubMed]
- Fild, M.; Glemser, O.; Christoph, G. Synthesis of tris(pentafluorophenyl)arsine, -stibine, and -phosphine and of pentafluorophenyl-trimethylsilane. Angew. Chem. Int. Ed. 1964, 3, 801. [Google Scholar] [CrossRef]
- Kant, R.; Singhal, K.; Shukla, S.K.; Chandrashekar, K.; Saxena, A.K.; Ranjan, A.; Raj, P. Synthesis and biological activity of a novel compound: (C6F5)2SbPh. Phosphorus Sulfur Silicon Relat. Elem. 2008, 183, 2029–2039. [Google Scholar] [CrossRef]
- Schäfer, A.; Reißmann, M.; Schäfer, A.; Saak, W.; Haase, D.; Müller, T. A new synthesis of triarylsilylium ions and their application in dihydrogen activation. Angew. Chem. Int. Ed. 2011, 50, 12636–12638. [Google Scholar] [CrossRef] [PubMed]
- Jiang, J.; Yin, H.; Wang, F.; Han, Z.; Wang, F.; Cheng, S.; Hong, M. Novel tetranuclear triarylantimony(V) complexes with (±)-mandelic acid ligands: Synthesis, characterization, in vitro cytotoxicity and DNA binding properties. Dalton Trans. 2013, 42, 8563–8566. [Google Scholar] [CrossRef] [PubMed]
- Kimura, T.; Itoh, N.; Takehara, M.; Oguro, I.; Ishizaki, J.; Nakanishi, T.; Tanaka, K. MRE-binding transcription factor-1 is activated during endotoxemia: A central role for metallothionein. Toxicol. Lett. 2002, 129, 77–84. [Google Scholar] [CrossRef]
- Kimura, T.; Kawasaki, Y.; Okumura, F.; Sone, T.; Natsuki, R.; Isobe, M. Ethanol-induced expression of glutamate-cysteine ligase catalytic subunit gene is mediated by NF-κB. Toxicol. Lett. 2009, 185, 110–115. [Google Scholar] [CrossRef] [PubMed]
- Fujie, T.; Segawa, Y.; Yoshida, E.; Fujiwara, Y.; Yamamoto, C.; Satoh, M.; Naka, H.; Kaji, T. Induction of metallothionein isoforms by copper diethyldithiocarbamate in cultured vascular endothelial cells. J. Toxicol. Sci. 2016, 41, 225–232. [Google Scholar] [CrossRef] [PubMed]
- Stitt, M.S.; Wasserloos, K.J.; Tang, X.; Liu, X.; Pitt, B.R.; St. Croix, C.M. Nitric oxide-induced nuclear translocation of the metal responsive transcription factor, MTF-1 is mediated by zinc release from metallothionein. Vasc. Pharmacol. 2006, 44, 149–155. [Google Scholar] [CrossRef] [PubMed]


| No. | Molecular Formula | |
|---|---|---|
| Sb13 | C23H20NSb | N-Methyl-Sb-phenylethynyl-5,6,7,12-tetrahydrodibenz[c,f][1,5]azastibocine |
| Sb14 | C24H22NSb | N-Ethyl-Sb-phenylethynyl-5,6,7,12-tetrahydrodibenz[c,f][1,5]azastibocine |
| Sb15 | C25H24NSb | N-iso-propyl-Sb-Phenylethynyl-5,6,7,12-tetrahydrodibenz[c,f][1,5]azastibocine |
| Sb16 | C26H26NSb | N-2-Methylpropyl-Sb-phenylethynyl-5,6,7,12-tetrahydrodibenz[c,f][1,5]azastibocine |
| Sb17 | C28H28NSb | N-Cyclohexyl-Sb-phenylethynyl-5,6,7,12-tetrahydrodibenz[c,f][1,5]azastibocine |
| Sb18 | C28H22NSb | N-Phenyl-Sb-phenylethynyl-5,6,7,12-tetrahydrodibenz[c,f][1,5]azastibocine |
| Sb19 | C21H20NSb | N-Methyl-Sb-phenyl-5,6,7,12-tetrahydrodibenz[c,f][1,5]azastibocine |
| Sb20 | C24H26NSb | N-t-Butyl-Sb-phenyl-5,6,7,12-tetrahydrodibenz[c,f][1,5]azastibocine |
| Sb22 | C16H18NSb | N-Methyl-Sb-methyl-5,6,7,12-tetrahydrodibenz[c,f][1,5]azastibocine |
| Sb23 | C19H26NSb | N-Methyl-Sb-trimethylsilylmethyl-5,6,7,12-tetrahydrodibenz[c,f][1,5]azastibocine |
| Sb24 | C19H24NSb | N-t-Butyl-Sb-methyl-5,6,7,12-tetrahydrodibenz[c,f][1,5]azastibocine |
| Sb26 | C21H21O3Sb | Tris(4-methoxylphenyl)stibane |
| Sb29 | C21H21Sb | Tris(4-methylphenyl)stibane |
| Sb30 | C21H21Sb | Tris(3-methylphenyl)stibane |
| Sb31 | C21H21Sb | Tris(2-methylphenyl)stibane |
| Sb32 | C27H33Sb | Tris(2,4,6-trimethylphenyl)stibane |
| Sb33 | C18H12F3Sb | Tris(4-fluorophenyl)stibane |
| Sb34 | C18H12Cl3Sb | Tris(4-chlorophenyl)stibane |
| Sb35 | C18F15Sb | Tris(pentafluorophenyl)stibane |
| Sb37 | C24H15S3Sb | Tris(1-benzothiophen-2-yl)stibane |
| Sb38 | C24H15O3Sb | Tris(2-benzofuranyl)stibane |
| Sb40 | C21H12F9Sb | Tris[(4-trifluoromethyl)phenyl]stibane |
| Sb41 | C27H27O6Sb | Tris(4-ethoxycarbonylphenyl)stibane |
| Sb42 | C27H36N3Sb | Tris[2-(N,N-dimethylaminomethyl)phenyl]stibane |
| Sb43 | C24H27O3Sb | Tris[2-(methoxymethyl)phenyl]stibane |
| Sb44 | C24H27S3Sb | Tris[2-(methylsulfanylmethyl)phenyl]stibane |
| Sb46 | C18H15Cl2Sb | Triphenylantimony dichloride |
| Sb48 | C22H21O4Sb | Triphenylantimony diacetate |
© 2016 by the authors; licensee MDPI, Basel, Switzerland. This article is an open access article distributed under the terms and conditions of the Creative Commons Attribution (CC-BY) license (http://creativecommons.org/licenses/by/4.0/).
Share and Cite
Fujie, T.; Murakami, M.; Yoshida, E.; Yasuike, S.; Kimura, T.; Fujiwara, Y.; Yamamoto, C.; Kaji, T. Transcriptional Induction of Metallothionein by Tris(pentafluorophenyl)stibane in Cultured Bovine Aortic Endothelial Cells. Int. J. Mol. Sci. 2016, 17, 1381. https://doi.org/10.3390/ijms17091381
Fujie T, Murakami M, Yoshida E, Yasuike S, Kimura T, Fujiwara Y, Yamamoto C, Kaji T. Transcriptional Induction of Metallothionein by Tris(pentafluorophenyl)stibane in Cultured Bovine Aortic Endothelial Cells. International Journal of Molecular Sciences. 2016; 17(9):1381. https://doi.org/10.3390/ijms17091381
Chicago/Turabian StyleFujie, Tomoya, Masaki Murakami, Eiko Yoshida, Shuji Yasuike, Tomoki Kimura, Yasuyuki Fujiwara, Chika Yamamoto, and Toshiyuki Kaji. 2016. "Transcriptional Induction of Metallothionein by Tris(pentafluorophenyl)stibane in Cultured Bovine Aortic Endothelial Cells" International Journal of Molecular Sciences 17, no. 9: 1381. https://doi.org/10.3390/ijms17091381
APA StyleFujie, T., Murakami, M., Yoshida, E., Yasuike, S., Kimura, T., Fujiwara, Y., Yamamoto, C., & Kaji, T. (2016). Transcriptional Induction of Metallothionein by Tris(pentafluorophenyl)stibane in Cultured Bovine Aortic Endothelial Cells. International Journal of Molecular Sciences, 17(9), 1381. https://doi.org/10.3390/ijms17091381