
Spectrophotometric Determination of Phenolic Antioxidants in the Presence of Thiols and Proteins


Abstract
:
1. Introduction
2. Results
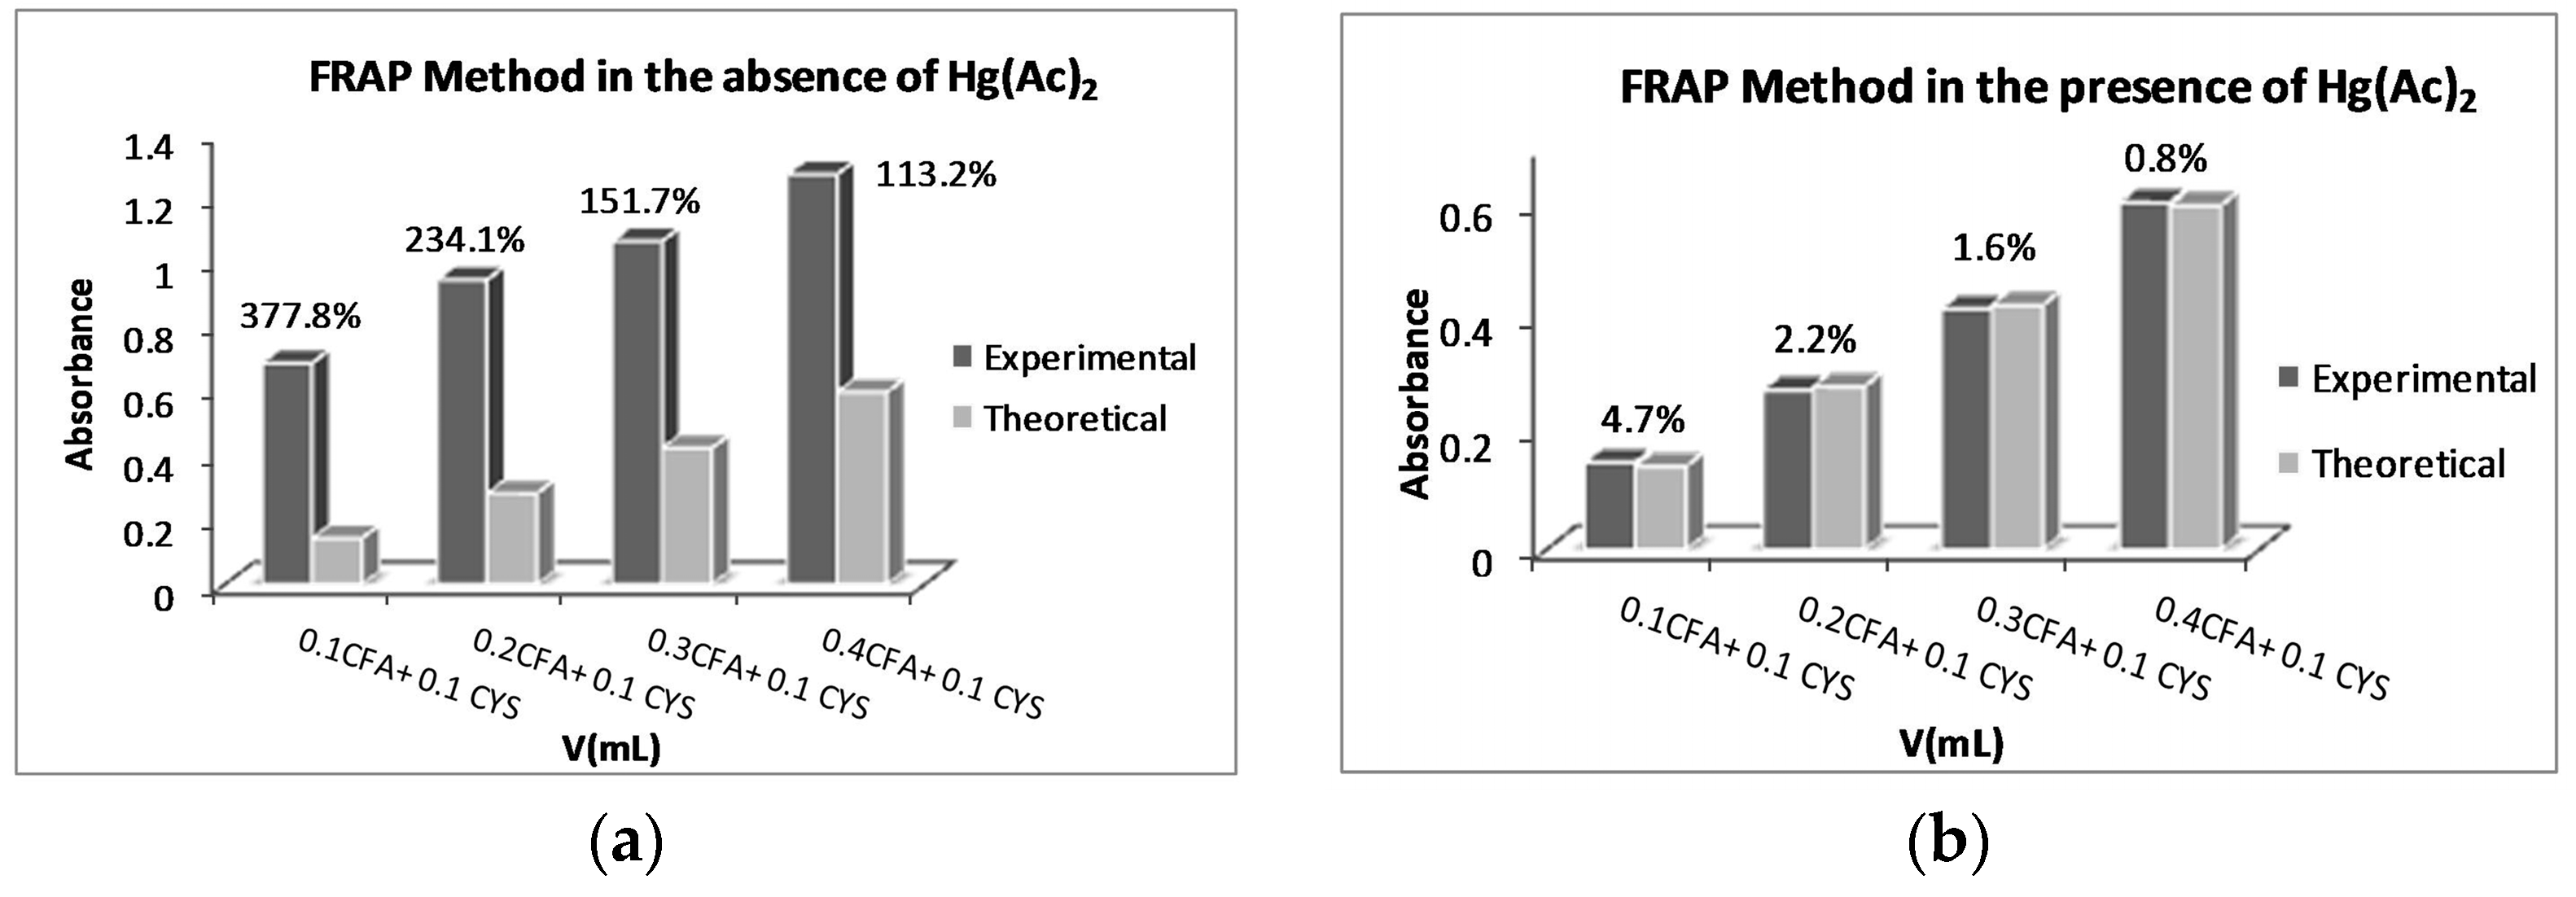
2.1. Optimization of the Amount of Hg(Ac)2 for the Ferric Reducing Antioxidant Power (FRAP) Method
2.2. FRAP Method Experiments
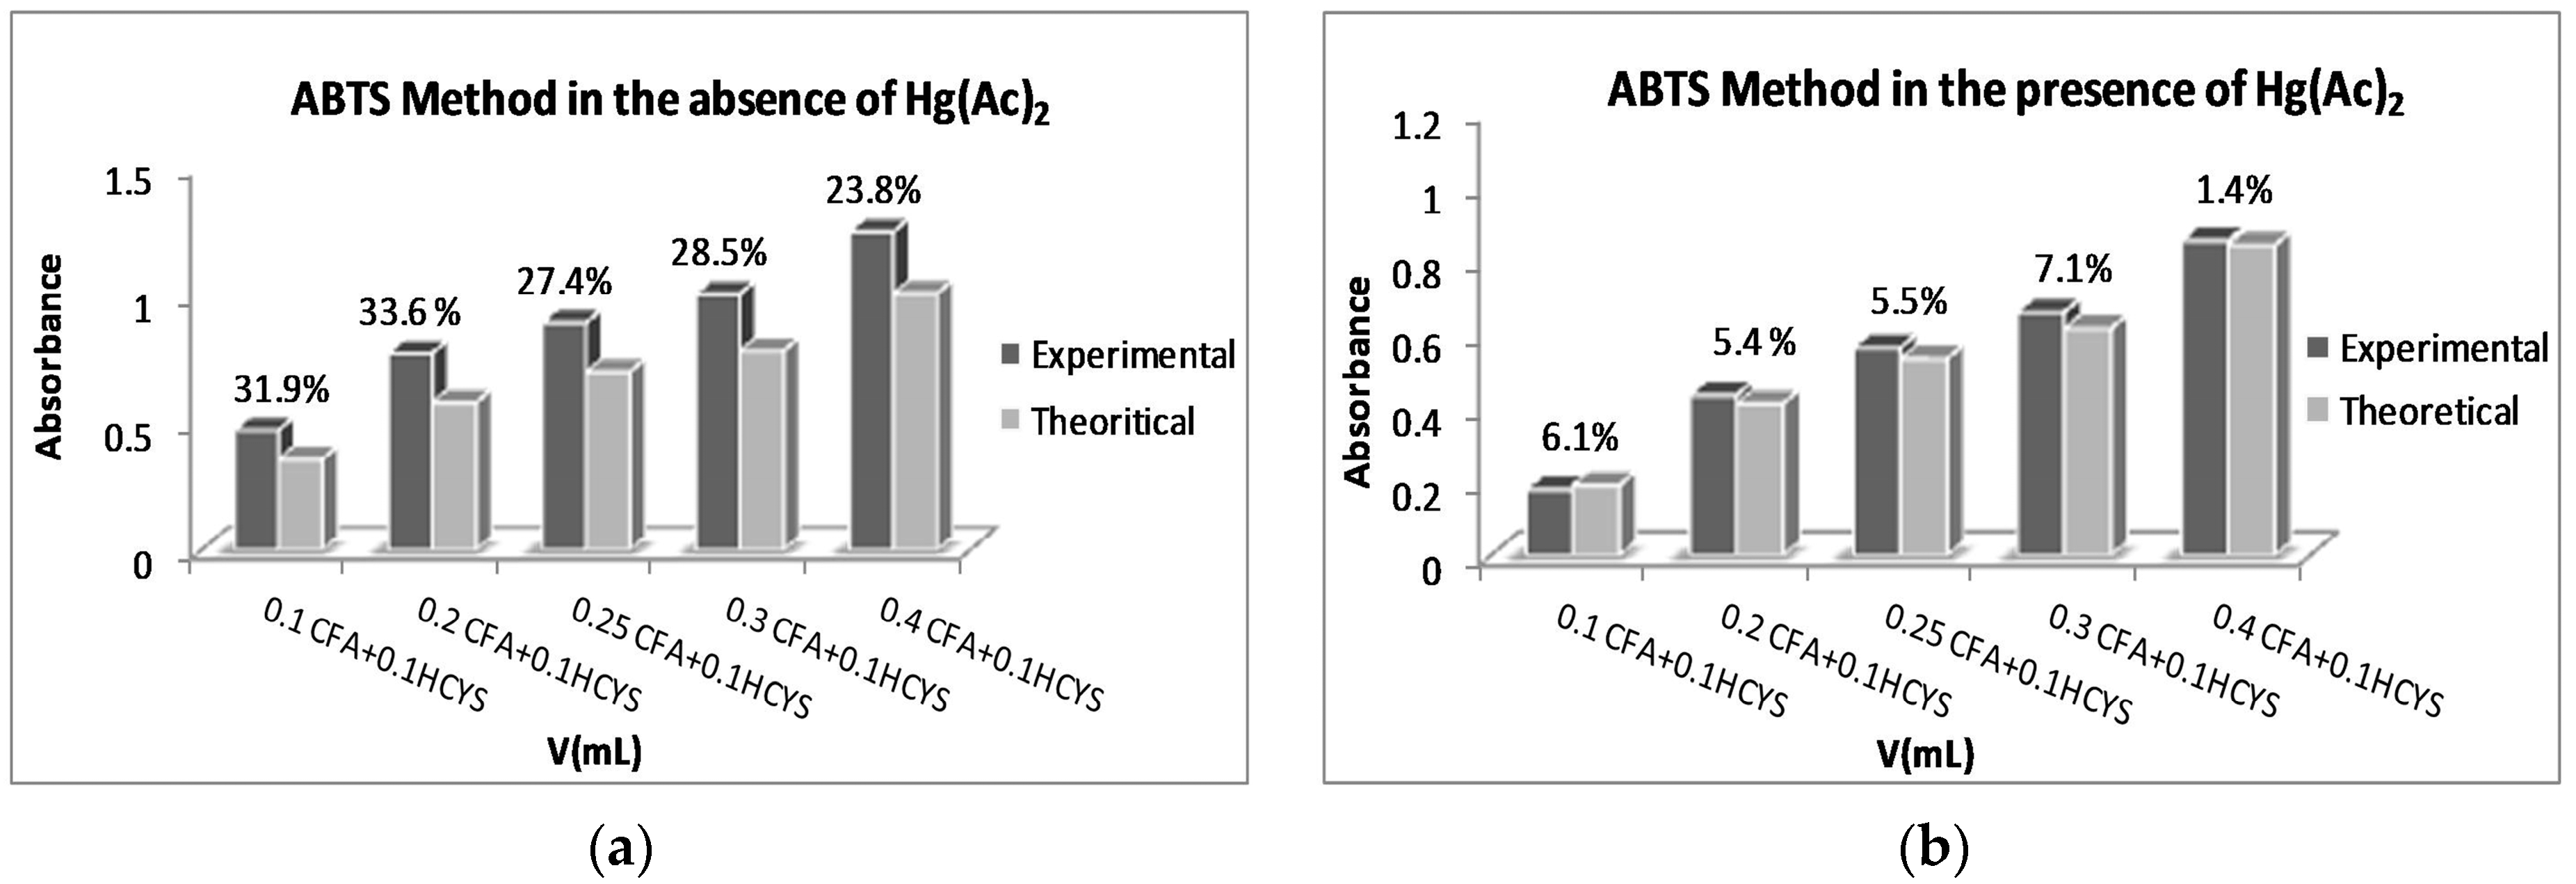
2.3. Optimization of the Amount of Hg(Ac)2 for the ABTS/TEAC Method
2.4. Measurements with the ABTS/TEAC Method
2.5. ABTS/TEAC Method Experiments for Polyphenol–Protein Mixtures
2.6. Cupric Ion Reducing Antioxidant Capacity (CUPRAC) Method Experiments for Thiol-Polyphenol Mixtures
2.7. CUPRAC Determination of Polyphenols in Mixtures with Hg(Ac)2 Correction for Thiols
2.8. CUPRAC Method Experiments for Protein–Polyphenol Mixtures
3. Discussion
4. Materials and Methods
4.1. Instrumentation and Chemicals
4.2. Stock and Working Solutions
4.2.1. Antioxidant (AOx) Solutions
4.2.2. Bovine Serum Albumin (BSA) Solution
4.2.3. Casein Solution
4.2.4. Protein Dissolution Buffer (pH 6.8)
4.2.5. Egg White Protein Solution
4.2.6. Mercury(II) Acetate Solution
4.3. FRAP Method Reagents
4.4. ABTS Method Reagents
4.5. CUPRAC Method Reagents
4.6. FRAP Method
4.7. ABTS Method
4.8. ABTS Tests for Mixtures of Polyphenolic and Thiolic AOx Compounds
4.9. ABTS/TEAC Tests for Polyphenol–Protein Mixtures
4.10. CUPRAC Method
4.11. CUPRAC Measurements of Binary and Ternary Thiol-Phenol Mixtures
4.12. CUPRAC Measurements for Protein–Phenol Mixtures
5. Conclusions
Acknowledgments
Author Contributions
Conflicts of Interest
Abbreviations
| ET | Electron transfer |
| TAC | Total antioxidant capacity |
| ROS/RNS | Reactive oxygen/nitrogen species |
| AOx | Antioxidant |
| HSA | Human serum albumin |
| Hb | Hemoglobin |
| TEAC | Trolox equivalent antioxidant capacity |
| GSH | Glutathione |
| FRAP | Ferric reducing antioxidant power |
| ORAC | Oxygen Radical Absorbance Capacity |
| CUPRAC | Cupric ion reducing antioxidant capacity |
| ABTS | 2,2′-azinobis(3-ethylbenzothiazoline-6-sulfonic acid) diammonium salt |
| DPPH | 2,2-diphenyl-1-picryl-hydrazyl |
| HSAB | Hard and Soft Acids and Bases |
| GA | Gallic acid |
| CYS | Cysteine |
| HCYS | Homocysteine |
| NAC | N-acetyl-l-cysteine |
| CFA | Caffeic acid |
| CAT | Catechin |
| EC | Epicatechin |
| BSA | Bovine serum albumin |
| RS | Thiyl radical |
| TPTZ | 2,4,6-Tris(2-pyridyl)-S-triazine |
| PBS | Phosphate buffered saline |
| Nc | Neocuproine |
References
- Finley, J.W.; Kong, A.-N.; Hintze, K.J.; Jeffery, E.H.; Ji, L.L.; Lei, X.G. Antioxidants in foods: State of the science important to the food industry. J. Agric. Food Chem. 2011, 59, 6837–6846. [Google Scholar] [CrossRef] [PubMed]
- Scalbert, A.; Johnson, I.T.; Salmarsh, M. Polyphenols: Antioxidants and beyond. Am. J. Clin. Nutr. 2005, 81, 215S–217S. [Google Scholar] [PubMed]
- Ingold, K.U.; Pratt, D.A. Advances in radical-trapping antioxidant chemistry in the 21st century: A kinetics and mechanisms perspective. Chem. Rev. 2014, 114, 9022–9046. [Google Scholar] [CrossRef] [PubMed]
- Foti, M.C. Use and abuse of the DPPH radical. J. Agric. Food Chem. 2015, 63, 8765–8776. [Google Scholar] [CrossRef] [PubMed]
- Amorati, R.; Valgimigli, L. Advantages and limitations of common testing methods for antioxidants. Free Radic. Res. 2015, 49, 633–649. [Google Scholar] [CrossRef] [PubMed]
- Pinelo, M.; Manzocco, L.; Nuñez, M.J.; Nicoli, M.C. Interaction among Phenols in Food Fortification: Negative synergism on antioxidant capacity. J. Agric. Food Chem. 2004, 52, 1177–1180. [Google Scholar] [CrossRef] [PubMed]
- Wang, S.; Meckling, K.A.; Marcone, M.F.; Kakuda, Y.; Tsao, R. Synergistic, Additive, and Antagonistic Effects of Food Mixtures on Total Antioxidant Capacities. J. Agric. Food Chem. 2011, 59, 960–968. [Google Scholar] [CrossRef] [PubMed]
- Zafra-Stone, S.; Yasmin, T.; Bagchi, M.; Chatterjee, A.; Vinson, J.A.; Bagchi, D. Berry anthocyanins as novel antioxidants in human health and disease prevention. Mol. Nutr. Food Res. 2007, 51, 675–683. [Google Scholar] [CrossRef] [PubMed]
- Iacopini, P.; Baldi, M.; Storchi, P.; Sebastiani, L. Catechin, epicatechin, rutin and resveratrol in red grape: Content, in vitro antioxidant activity and interactions. J. Food Compos. Anal. 2008, 21, 589–598. [Google Scholar] [CrossRef]
- Fraga, C.G. Plant polyphenols: How to translate their in vitro antioxidant actions to in vivo conditions. IUMB Life 2007, 59, 308–315. [Google Scholar] [CrossRef] [PubMed]
- Niki, E.; Noguchi, N.; Tsuchihashi, H.; Gotoh, N. Interaction among vitamin C, vitamin E, and β-carotene. Am. J. Clin. Nutr. 1995, 62, 1322S–1326S. [Google Scholar] [PubMed]
- Gilani, G.S.; Cockell, K.A.; Sepehr, E. Effects of antinutritional factors on protein digestibility and amino acid availability in foods. J. AOAC Int. 2005, 88, 967–987. [Google Scholar] [PubMed]
- Feruzzi, M.G.; Bordenave, N.; Hamaker, B.R. Does flavor impact function? Potential consequence of polyphenol–protein interactions in delivery and bioactivity of flavan-3-ols from foods. Physiol. Behav. 2012, 107, 591–597. [Google Scholar] [CrossRef] [PubMed]
- Soares, S.; Mateus, N.; de Freitas, V. Interaction of different polyphenols with bovine serum albumin (BSA) and human salivary α-amylase (HSA) by fluorescence quenching. J. Agric. Food Chem. 2007, 55, 6726–6735. [Google Scholar] [CrossRef] [PubMed]
- Lu, Z.; Zhang, Y.; Liu, H.; Yuan, J.; Zheng, Z.; Zou, G. Transport of a cancer chemopreventive polyphenol, resveratrol: Interaction with serum albumin and hemoglobin. J. Fluoresc. 2007, 17, 580–587. [Google Scholar] [CrossRef] [PubMed]
- Dufour, C.; Dangles, O. Flavonoid–serum albumin complexation: Determination of binding constants and binding sites by fluorescence spectroscopy. BBA-Gen. Subject. 2005, 1721, 164–173. [Google Scholar] [CrossRef] [PubMed]
- Bohin, M.C.; Vincken, J.-P.; van der Hijden, H.T.W.M.; Gruppen, H. Efficacy of food proteins as carriers for flavonoids. J. Agric. Food Chem. 2012, 60, 4136–4143. [Google Scholar] [CrossRef] [PubMed]
- Ozdal, T.; Capanoglu, E.; Altay, F. A review on protein-phenolic interactions and associated changes. Food Res. Int. 2013, 51, 954–970. [Google Scholar] [CrossRef]
- Arts, M.J.T.J.; Haenen, G.R.M.M.; Wilms, L.C.; Beetstra, S.A.J.N.; Heijnen, C.G.M.; Voss, H.-P.; Bast, A. Interactions between flavonoids and proteins: Effect on the total antioxidant capacity. J. Agric. Food Chem. 2002, 50, 1184–1187. [Google Scholar] [CrossRef] [PubMed]
- Lorenz, M.; Jochmann, N.; von Krosigk, A.; Martus, P.; Baumann, G.; Stangl, K.; Stangl, V. Addition of milk prevents vascular protective effects of tea. Eur. Hearth J. 2007, 28, 219–223. [Google Scholar] [CrossRef] [PubMed]
- Gallo, M.; Vinci, G.; Graziani, G.; de Simone, C.; Ferranti, P. The interaction of cocoa polyphenols with milk proteins studied by proteomic techniques. Food Res. Int. 2013, 54, 406–415. [Google Scholar] [CrossRef]
- Fujimoto, A.; Masuda, T. Chemical interactions between polyphenols and cysteinyl thiol under radical oxidation conditions. J. Agric. Food Chem. 2012, 60, 5142–5151. [Google Scholar] [CrossRef] [PubMed]
- Boots, A.W.; Kubben, N.; Haenen, G.R.M.M.; Bast, A. Oxidized quercetin reacts with thiols rather than with ascorbate: Implication for quercetin supplementation. Biochem. Biophys. Res. Commun. 2003, 308, 560–565. [Google Scholar] [CrossRef]
- Awad, H.M.; Boersma, M.G.; Boeren, S.; van Bladeren, P.J.; Vervoort, J.; Rietjens, I.M.C.M. Quenching of quercetin quinone/quinone methides by different thiolate scavengers: Stability and reversibility of conjugate formation. Chem. Res. Toxicol. 2003, 16, 822–831. [Google Scholar] [CrossRef] [PubMed]
- Apak, R.; Özyürek, M.; Güçlü, K.; Çapanoğlu, E. Antioxidant activity/capacity measurement. 1. Classification, physicochemical principles, mechanisms, and electron transfer (ET)-based assays. J. Agric. Food Chem. 2016, 64, 997–1027. [Google Scholar] [CrossRef] [PubMed]
- Apak, R.; Güçlü, K.; Özyürek, M.; Çelik, S.E. Mechanism of antioxidant capacity assays and the CUPRAC (Cupric Ion Reducing Antioxidant Capacity) assay. Microchim. Acta 2008, 160, 413–419. [Google Scholar] [CrossRef]
- Natella, F.; Nardini, M.; di Felice, M.; Scaccini, C. Benzoic and cinnamic acid derivatives as antioxidants: Structure-activity relation. J. Agric. Food Chem. 1999, 47, 1453–1459. [Google Scholar] [CrossRef] [PubMed]
- Rice-Evans, C.A.; Miller, N.J.; Paganga, G. Structure-antioxidant activity relationship of flavonoids and phenolic acids. Free Radic. Biol. Med. 1996, 20, 933–956. [Google Scholar] [CrossRef]
- Benzie, I.F.F.; Strain, J.J. The Ferric Reducing Ability of Plasma (FRAP) as a Measure of “Antioxidant Power”: The FRAP Assay. Anal. Biochem. 1996, 239, 70–76. [Google Scholar] [CrossRef] [PubMed]
- Re, R.; Pellegrini, N.; Proteggente, A.; Pannala, A.; Yang, M.; Rice-Evans, C. Antioxidant activity applying an improved ABTS radical cation decolorization assay. Free Radic. Biol. Med. 1999, 26, 1231–1237. [Google Scholar] [CrossRef]
- Apak, R.; Güçlü, K.; Özyürek, M.; Karademir, S.E. Novel total antioxidant capacity index for dietary polyphenols and vitamins C and E, using their Cupric Ion Reducing Capability in the presence of neocuproine: CUPRAC Method. J. Agric. Food Chem. 2004, 52, 7970–7981. [Google Scholar] [CrossRef] [PubMed]
- Pearson, R.G. Hard and soft acids and bases, HSAB, part 1: Fundamental principles. J. Chem. Educ. 1968, 45, 581–587. [Google Scholar] [CrossRef]
- Ravichandran, M. Interactions between mercury and dissolved organic matter––A review. Chemosphere 2004, 55, 319–331. [Google Scholar] [CrossRef] [PubMed]
- Çekiç, S.D.; Başkan, K.S.; Tütem, E.; Apak, R. Modified cupric reducing antioxidant capacity (CUPRAC) assay for measuring the antioxidant capacities of thiol-containing proteins in the admixture with polyphenols. Talanta 2009, 79, 344–351. [Google Scholar] [CrossRef] [PubMed]
- Apak, R.; Güclü, K.; Ozyurek, M.; Karademir, S.E.; Altun, M. Total antioxidant capacity assay of human serum using copper(II)-neocuproine as chromogenic oxidant: The CUPRAC method. Free Radic. Res. 2005, 39, 949–961. [Google Scholar] [CrossRef] [PubMed]
- Karoui, H.; Hogg, N.; Frejaville, C.; Tordo, P.; Kalyanaraman, B. Characterization of sulfur-centered radical intermediates formed during the oxidation of thiols and sulfite by peroxynitrite. J. Biol. Chem. 1996, 271, 6000–6009. [Google Scholar] [PubMed]
- Bohning, J.J.; Weiss, K. The kinetics of the oxidation of 3-mercaptopropionic acid with potassium ferricyanide. J. Am. Chem. Soc. 1960, 82, 4724–4728. [Google Scholar] [CrossRef]
- Stahl, N.; Jencks, W.P. Hydrogen bonding between solutes in aqueous solution. J. Am. Chem. Soc. 1986, 108, 4196–4205. [Google Scholar] [CrossRef]
- Thapa, B.; Schlegel, H.B. Density functional theory calculation of pKa’s of thiols in aqueous solution using explicit water molecules and the polarizable continuum model. J. Phys. Chem. A 2016, 120, 5726–5735. [Google Scholar] [CrossRef] [PubMed]
- Pryor, W.A.; Church, D.F.; Govindan, C.K.; Crank, G. Oxidation of thiols by nitric oxide and nitrogen dioxide: Synthetic utility and toxicological implications. J. Org. Chem. 1982, 47, 156–159. [Google Scholar] [CrossRef]
- Bast, A.; Haenen, G.R.M.M. The toxicity of antioxidants and their metabolites. Environ. Toxicol. Pharm. 2002, 11, 251–258. [Google Scholar] [CrossRef]
- Penning, T.M.; Burczynski, M.E.; Hung, C.-F.; McCoull, K.D.; Palackal, N.T.; Tsuruda, L.S. Dihydrodiol dehydrogenases and polycyclic aromatic hydrocarbon activation: Generation of reactive and redox active O-quinones. Chem. Res. Toxicol. 1999, 12, 1–18. [Google Scholar] [CrossRef] [PubMed]
- Forman, H.J.; Maiorino, M.; Ursini, F. Signaling functions of reactive oxygen species. Biochemistry 2010, 49, 835–842. [Google Scholar] [CrossRef] [PubMed]
- Kemp, M.; Go, Y.-M.; Jones, D.P. Nonequilibrium thermodynamics of thiol/disulfide redox systems: A perspective on redox systems biology. Free Radic. Biol. Med. 2008, 44, 921–937. [Google Scholar] [CrossRef] [PubMed]
- Li, W.-W.; Heinze, J.; Haehnel, W. Site-specific binding of quinones to proteins through thiol addition and addition-elimination reactions. J. Am. Chem. Soc. 2005, 127, 6140–6141. [Google Scholar] [CrossRef] [PubMed]


| Sample | A(FRAP) 1 |
|---|---|
| Only GA | 0.3130 ± 0.016 |
| Only CYS | 0.0187 ± 0.019 |
| GA + CYS | 0.6455 ± 0.023 |
| GA + (1:0.5) CYS:Hg | 0.3865 ± 0.029 |
| GA + (1:1.0) CYS:Hg | 0.3149 ± 0.011 |
| GA + (1:2.5) CYS:Hg | 0.3226 ± 0.006 |
| GA + (1:5.0) CYS:Hg | 0.3656 ± 0.016 |
| Volume (V) (mL) of Mixture Components (AOx and/or Thiol) | Aexp 1 (in the Absence of Hg2+) | Aexp 1 (in the Presence of Hg2+) | Relative Error % (in the Absence of Hg2+) | Relative Error % (in the Presence of Hg2+) |
|---|---|---|---|---|
| 0.10 mL HCYS | 0.0016 ± 0.002 | - | - | - |
| 0.10 mL NAC | 0.1430 ± 0.010 | |||
| 0.05 mL GA | 0.1557 ± 0.001 | - | - | - |
| 0.10 mL GA | 0.2867 ± 0.016 | |||
| 0.20 mL GA | 0.6060 ±0.008 | |||
| 0.30 mL GA | 0.9551 ± 0.005 | |||
| 0.05 mL GA + 0.1 mL HCYS | 0.3865 ± 0.024 | 0.1695 ± 0.003 | 148.2 | 8.9 |
| 0.10 mL GA + 0.1 mL HCYS | 0.5307 ± 0.034 | 0.3039 ± 0.013 | 85.1 | 6.0 |
| 0.20 mL GA + 0.1 mL HCYS | 1.0427 ± 0.025 | 0.6314 ± 0.009 | 72.1 | 4.2 |
| 0.30 mL GA + 0.1 mL HCYS | 1.3319 ± 0.012 | 0.9636 ± 0.007 | 39.4 | 0.9 |
| 0.05 mL GA + 0.1 mL NAC | 0.5217 ± 0.012 | 0.1580 ± 0.007 | 74.7 | 1.5 |
| 0.10 mL GA + 0.1 mL NAC | 0.7309 ± 0.032 | 0.3092 ± 0.021 | 70.1 | 7.8 |
| 0.20 mL GA + 0.1 mL NAC | 1.0345 ± 0.014 | 0.6636 ± 0.009 | 38.1 | 9.5 |
| 0.30 mL GA + 0.1 mL NAC | 1.3758 ± 0.039 | 0.9709 ± 0.021 | 25.3 | 1.6 |
| Sample | A(ABTS/TEAC) |
|---|---|
| Ref. (without Hg) | 0.9306 |
| Ref. (1:1 Hg) | 0.9382 |
| Ref. (1:5 Hg) | 0.9277 |
| Ref. (1:10 Hg) | 0.9316 |
| Only CYS | 0.6967 |
| 1:1 CYS:Hg(II) | 0.8396 |
| 1:5 CYS:Hg(II) | 0.9146 |
| 1:10 CYS:Hg(II) | 0.9162 |
| V (mL) of AOx (Thiol, Catechin, or Mixture) | ∆Aexp. 1 (without Hg2+) | ∆Aexp. 1 (with Hg2+) | RE% (without Hg2+) | RE% (with Hg2+) |
|---|---|---|---|---|
| 0.10 mL HCYS | 0.2011 ± 0.026 | - | - | - |
| 0.10 mL NAC | 0.2825 ± 0.034 | - | - | - |
| 0.05 mL CAT | 0.0738 ± 0.013 | 0.0482 ± 0.026 | - | - |
| 0.10 mL CAT | 0.1243 ±0.019 | 0.1134 ± 0.018 | - | - |
| 0.15 mL CAT | 0.2099 ± 0.024 | 0.1791 ± 0.008 | - | - |
| 0.20 mL CAT | 0.2658 ± 0.015 | 0.2912 ± 0.013 | - | - |
| 0.25 mL CAT | 0.3856 ± 0.008 | 0.3970 ± 0.028 | - | - |
| HCYS + 0.05 mL CAT | 0.2958 ± 0.015 | 0.0530 ± 0.019 | 7.6 | 5.4 |
| HCYS + 0.10 mL CAT | 0.3864 ± 0.015 | 0.1216 ± 0.027 | 18.8 | 5.2 |
| HCYS + 0.15 mL CAT | 0.4528 ± 0.013 | 0.1939 ± 0.021 | 10.2 | 7.0 |
| HCYS + 0.20 mL CAT | 0.5434 ± 0.018 | 0.3004 ± 0.037 | 16.4 | 2.4 |
| HCYS + 0.25 mL CAT | 0.6475 ± 0.023 | 0.4027 ± 0.021 | 10.4 | 1.1 |
| NAC + 0.05 mL CAT | 0.3110 ± 0.015 | 0.0754 ± 0.034 | 12.7 | 6.6 |
| NAC + 0.10 mL CAT | 0.3528 ± 0.010 | 0.1430 ± 0.010 | 13.3 | 8.5 |
| NAC + 0.15 mL CAT | 0.3889 ± 0.027 | 0.1898 ± 0.021 | 21.0 | 0.2 |
| NAC + 0.20 mL CAT | 0.4693 ± 0.009 | 0.2553 ± 0.022 | 14.4 | 10.0 |
| NAC + 0.25 mL CAT | 0.5227 ± 0.047 | 0.3363 ± 0.023 | 21.8 | 6.6 |
| Sample | Aexp. 1 | Atheo | RE% |
|---|---|---|---|
| CYS | 0.3061 ± 0.011 | - | - |
| GSH | 0.3222 ± 0.008 | - | - |
| CAT | 0.2274 ± 0.018 | - | - |
| EC | 0.2826 ± 0.016 | - | - |
| CFA | 0.1924 ± 0.024 | - | - |
| GA | 0.3988 ± 0.030 | - | - |
| CYS + EC + GA | 0.9930 ± 0.037 | 0.9875 | 0.6 |
| CYS + CFA + CAT | 0.7468 ± 0.028 | 0.7259 | 2.9 |
| CYS + GA + CAT | 0.9548 ± 0.038 | 0.9323 | 2.4 |
| CYS + CFA + EC | 0.7848 ± 0.028 | 0.7811 | 0.5 |
| GSH + EC + GA | 1.0131 ± 0.021 | 1.0036 | 1.0 |
| GSH + CFA + CAT | 0.7690 ± 0.021 | 0.7420 | 3.5 |
| GSH + GA + CAT | 0.9872 ± 0.027 | 0.9484 | 4.1 |
| GSH + CFA + EC | 0.8324 ± 0.019 | 0.7972 | 4.4 |
© 2016 by the authors; licensee MDPI, Basel, Switzerland. This article is an open access article distributed under the terms and conditions of the Creative Commons Attribution (CC-BY) license (http://creativecommons.org/licenses/by/4.0/).
Share and Cite
Avan, A.N.; Demirci Çekiç, S.; Uzunboy, S.; Apak, R. Spectrophotometric Determination of Phenolic Antioxidants in the Presence of Thiols and Proteins. Int. J. Mol. Sci. 2016, 17, 1325. https://doi.org/10.3390/ijms17081325
Avan AN, Demirci Çekiç S, Uzunboy S, Apak R. Spectrophotometric Determination of Phenolic Antioxidants in the Presence of Thiols and Proteins. International Journal of Molecular Sciences. 2016; 17(8):1325. https://doi.org/10.3390/ijms17081325
Chicago/Turabian StyleAvan, Aslı Neslihan, Sema Demirci Çekiç, Seda Uzunboy, and Reşat Apak. 2016. "Spectrophotometric Determination of Phenolic Antioxidants in the Presence of Thiols and Proteins" International Journal of Molecular Sciences 17, no. 8: 1325. https://doi.org/10.3390/ijms17081325
APA StyleAvan, A. N., Demirci Çekiç, S., Uzunboy, S., & Apak, R. (2016). Spectrophotometric Determination of Phenolic Antioxidants in the Presence of Thiols and Proteins. International Journal of Molecular Sciences, 17(8), 1325. https://doi.org/10.3390/ijms17081325