
Gene Set−Based Integrative Analysis Revealing Two Distinct Functional Regulation Patterns in Four Common Subtypes of Epithelial Ovarian Cancer

 ,
, 

Abstract
:
1. Introduction
2. Results
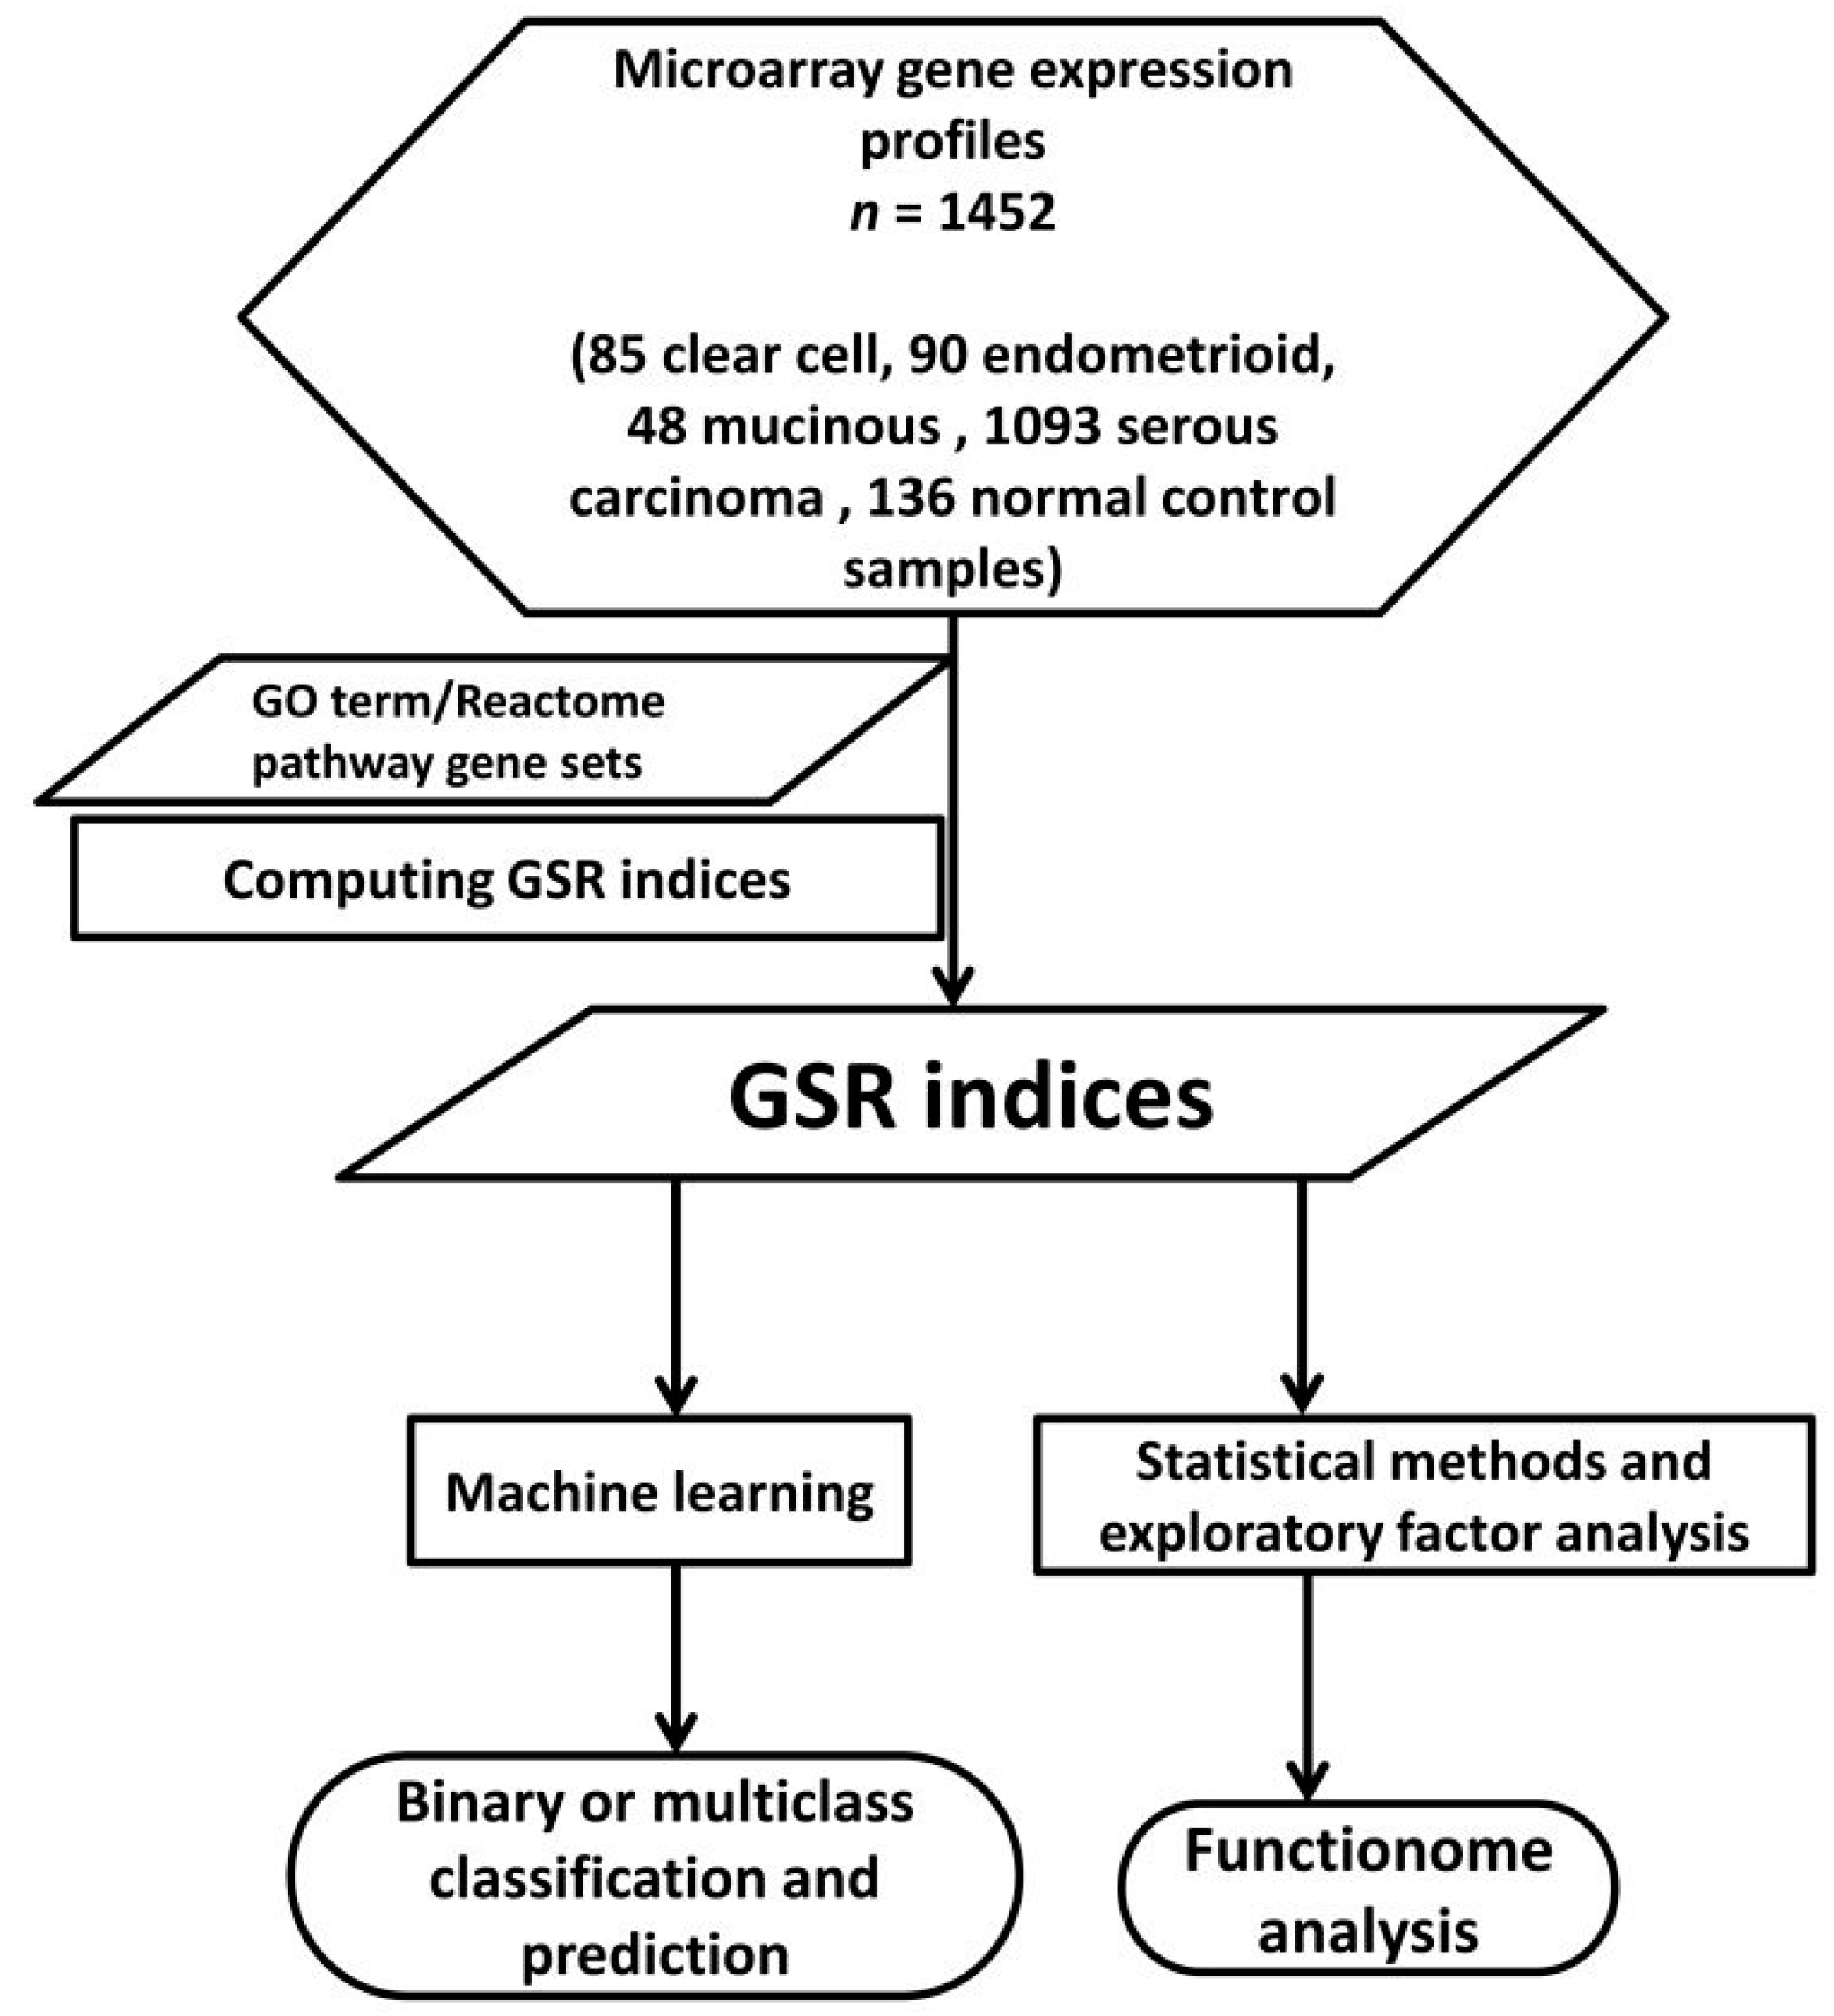
2.1. DNA Microarray Gene Expression Datasets and Gene Sets
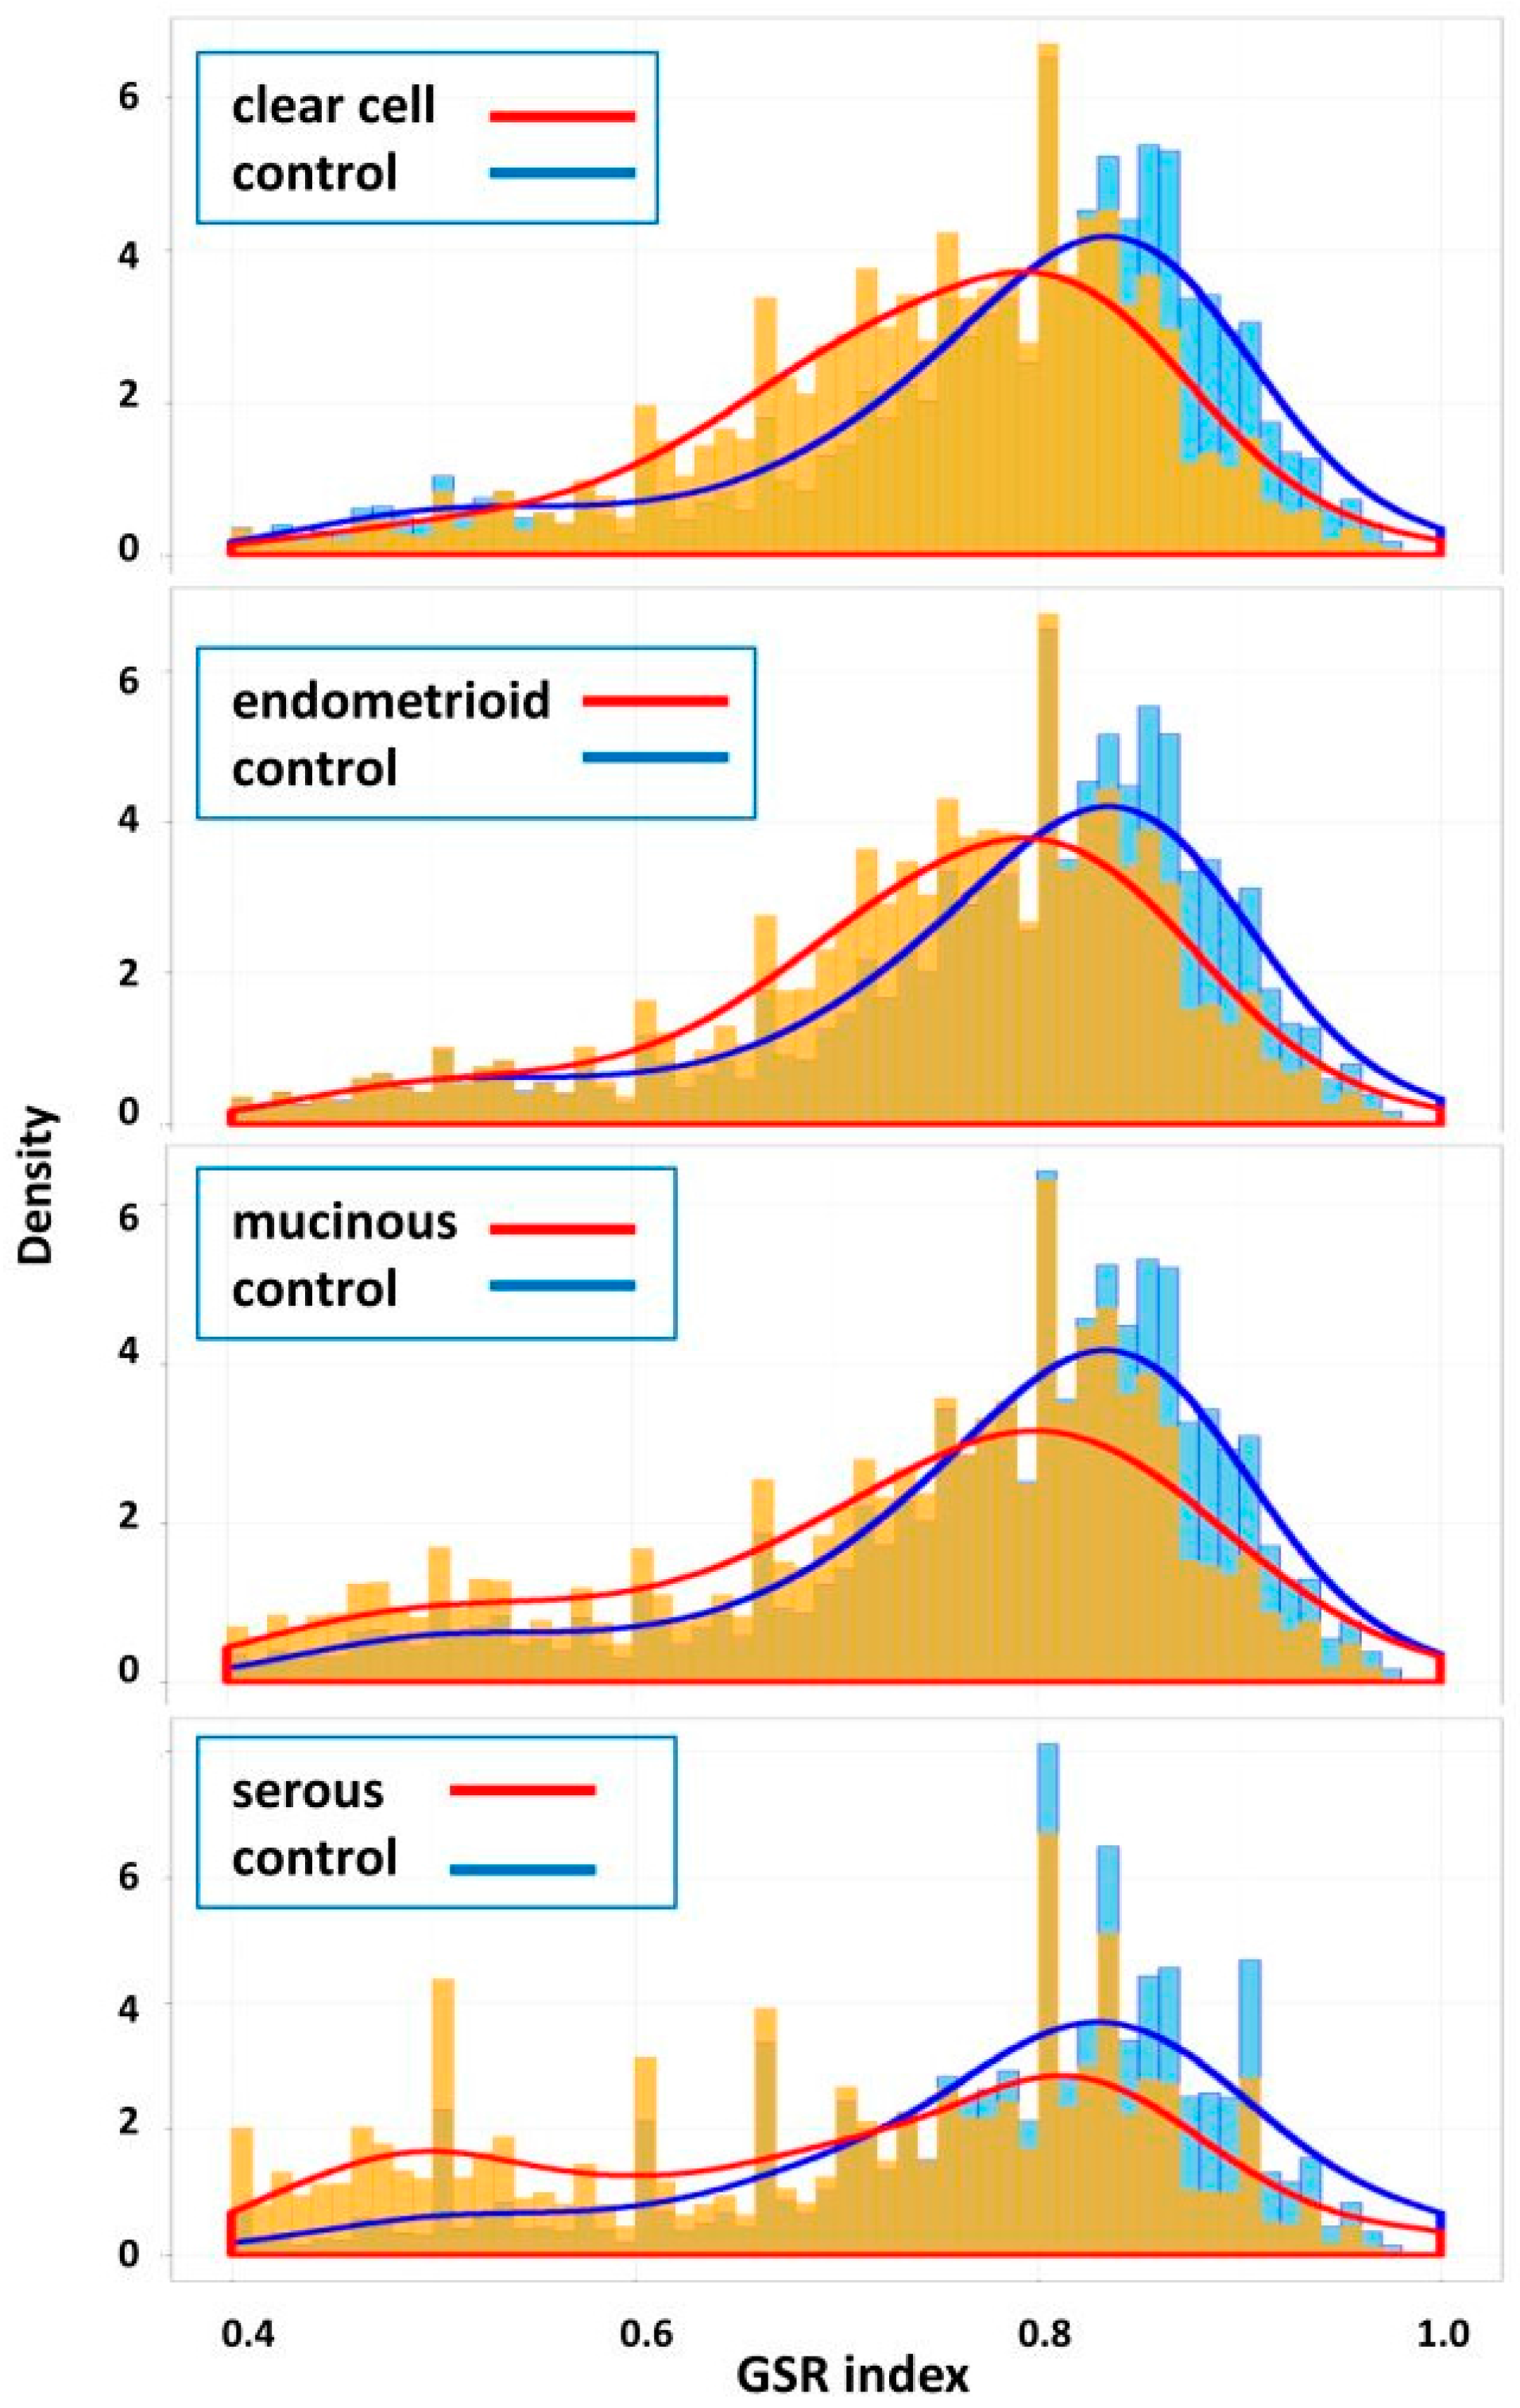
2.2. Means and Histograms of the GSR Indices of the Four Subtypes
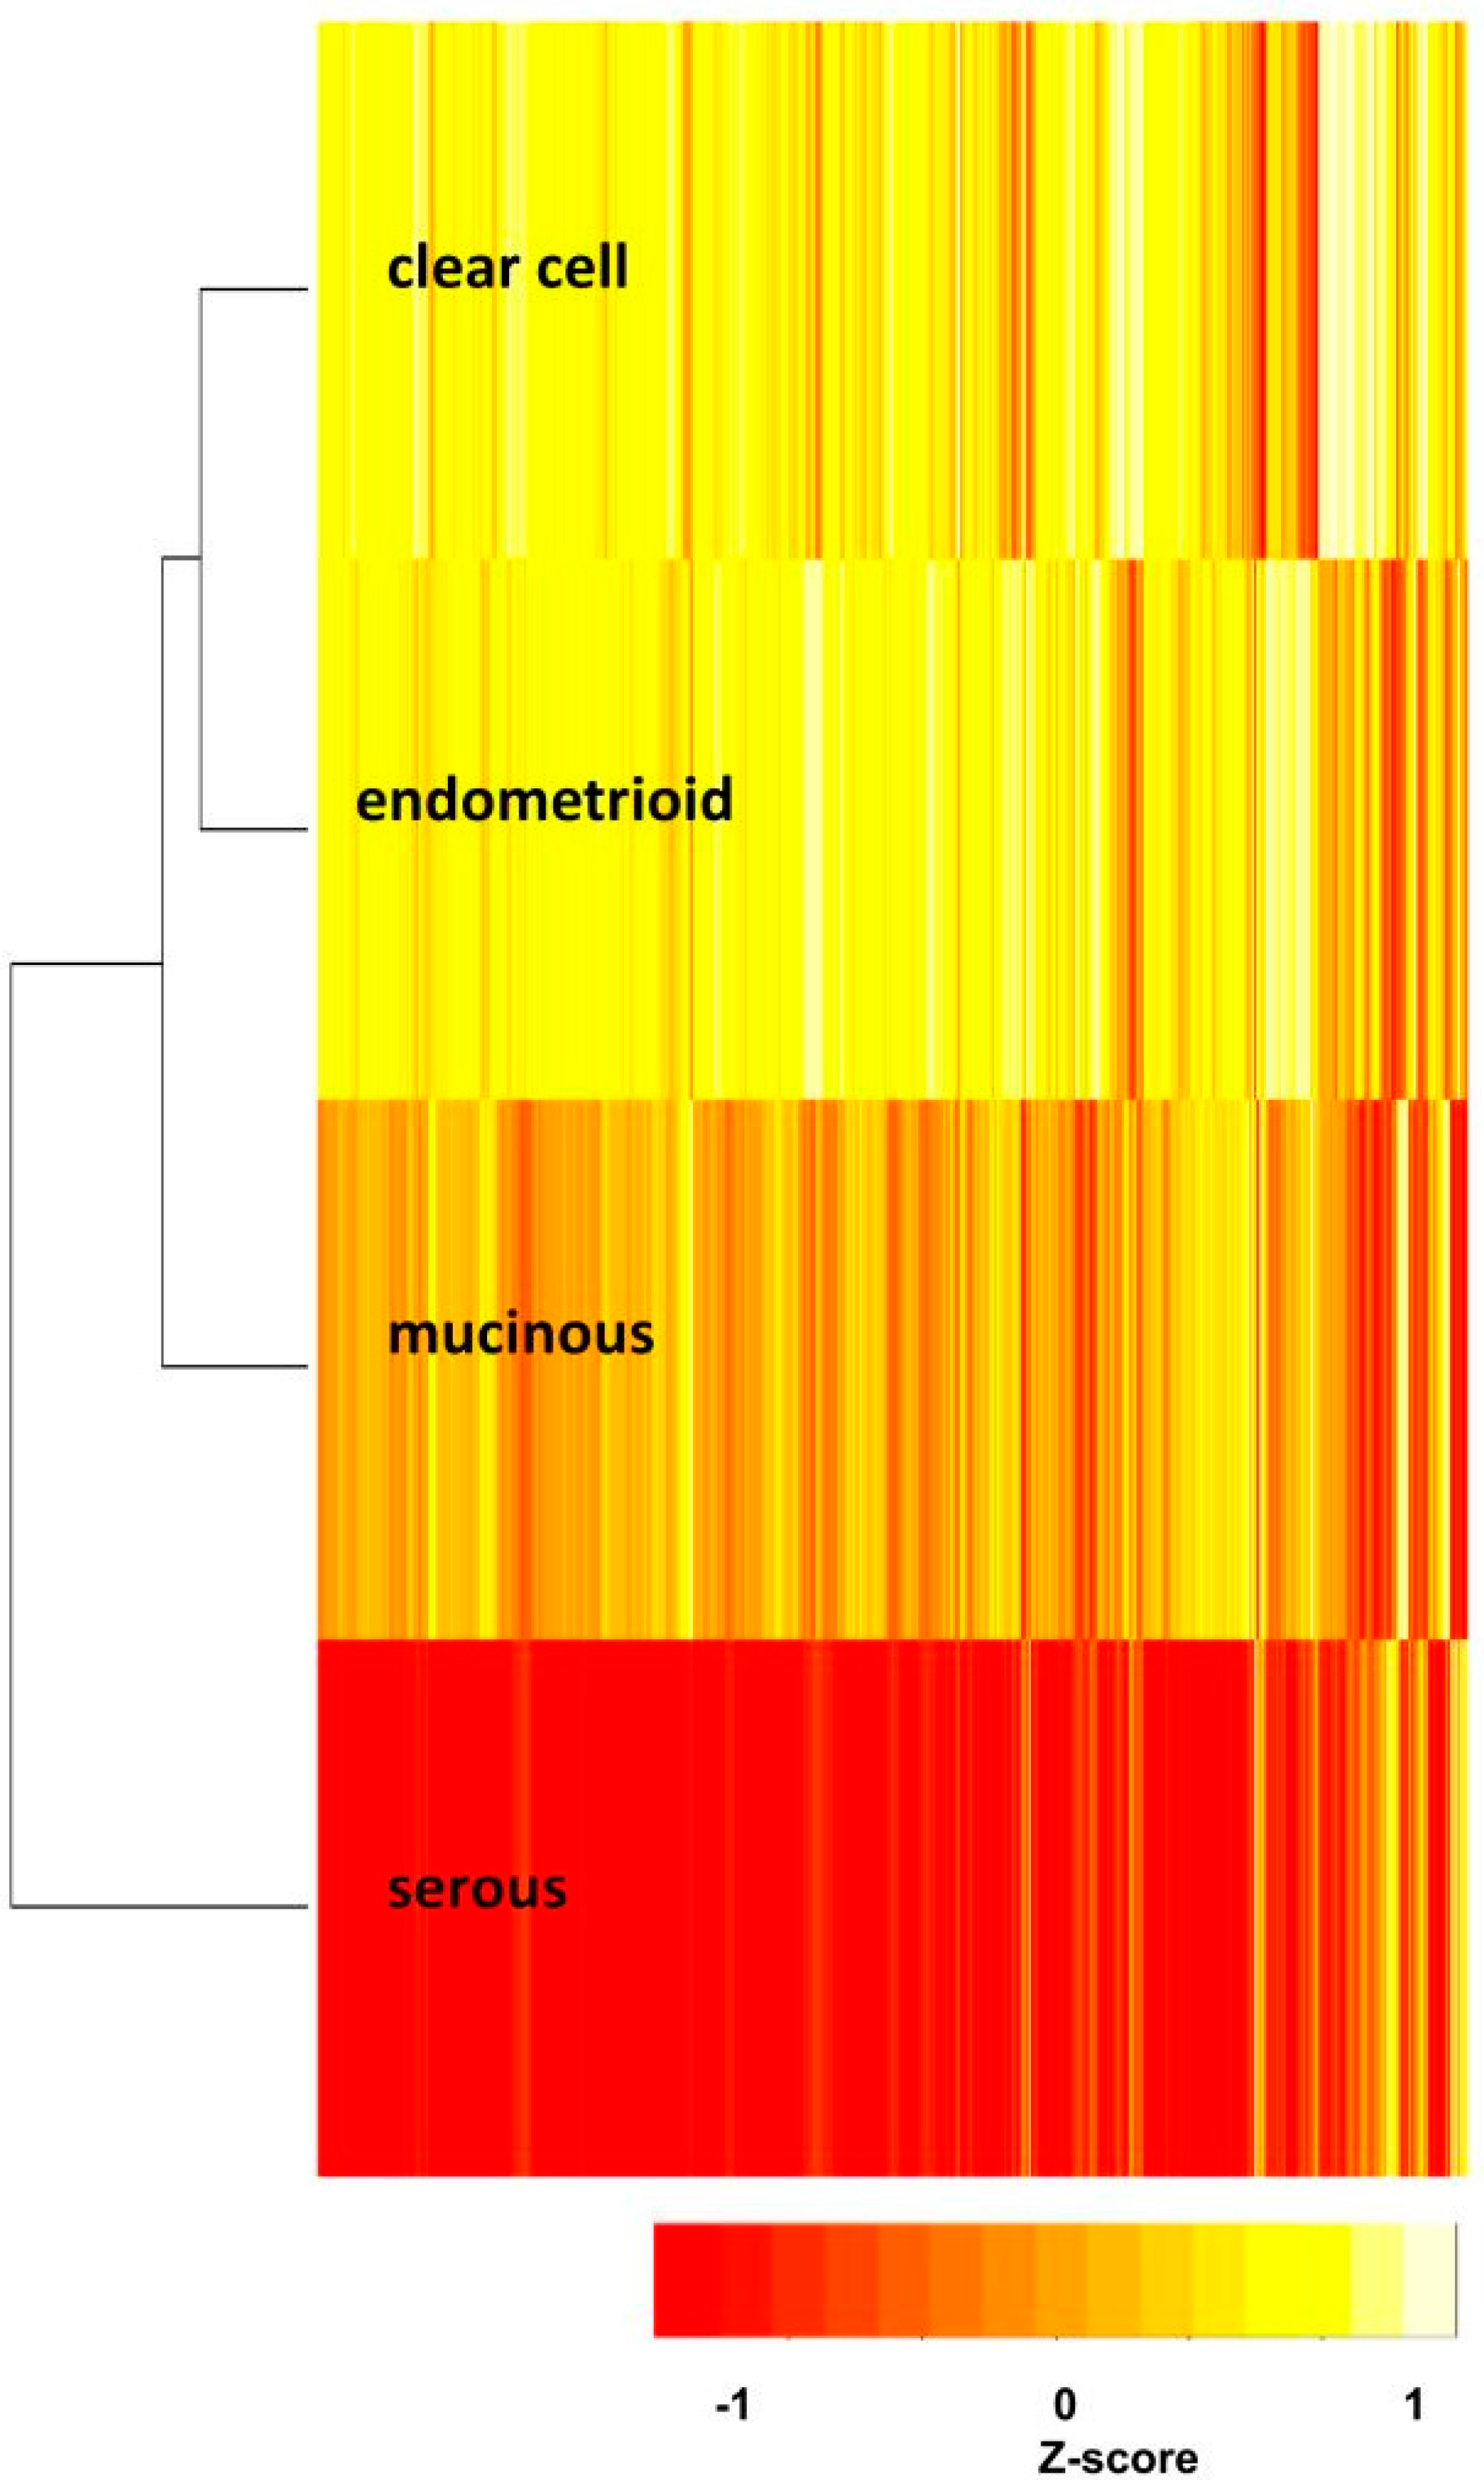
2.3. The Relationships of the Four Subtypes
2.4. Functional Regulation Patterns Classified and Predicted by Machine Learning
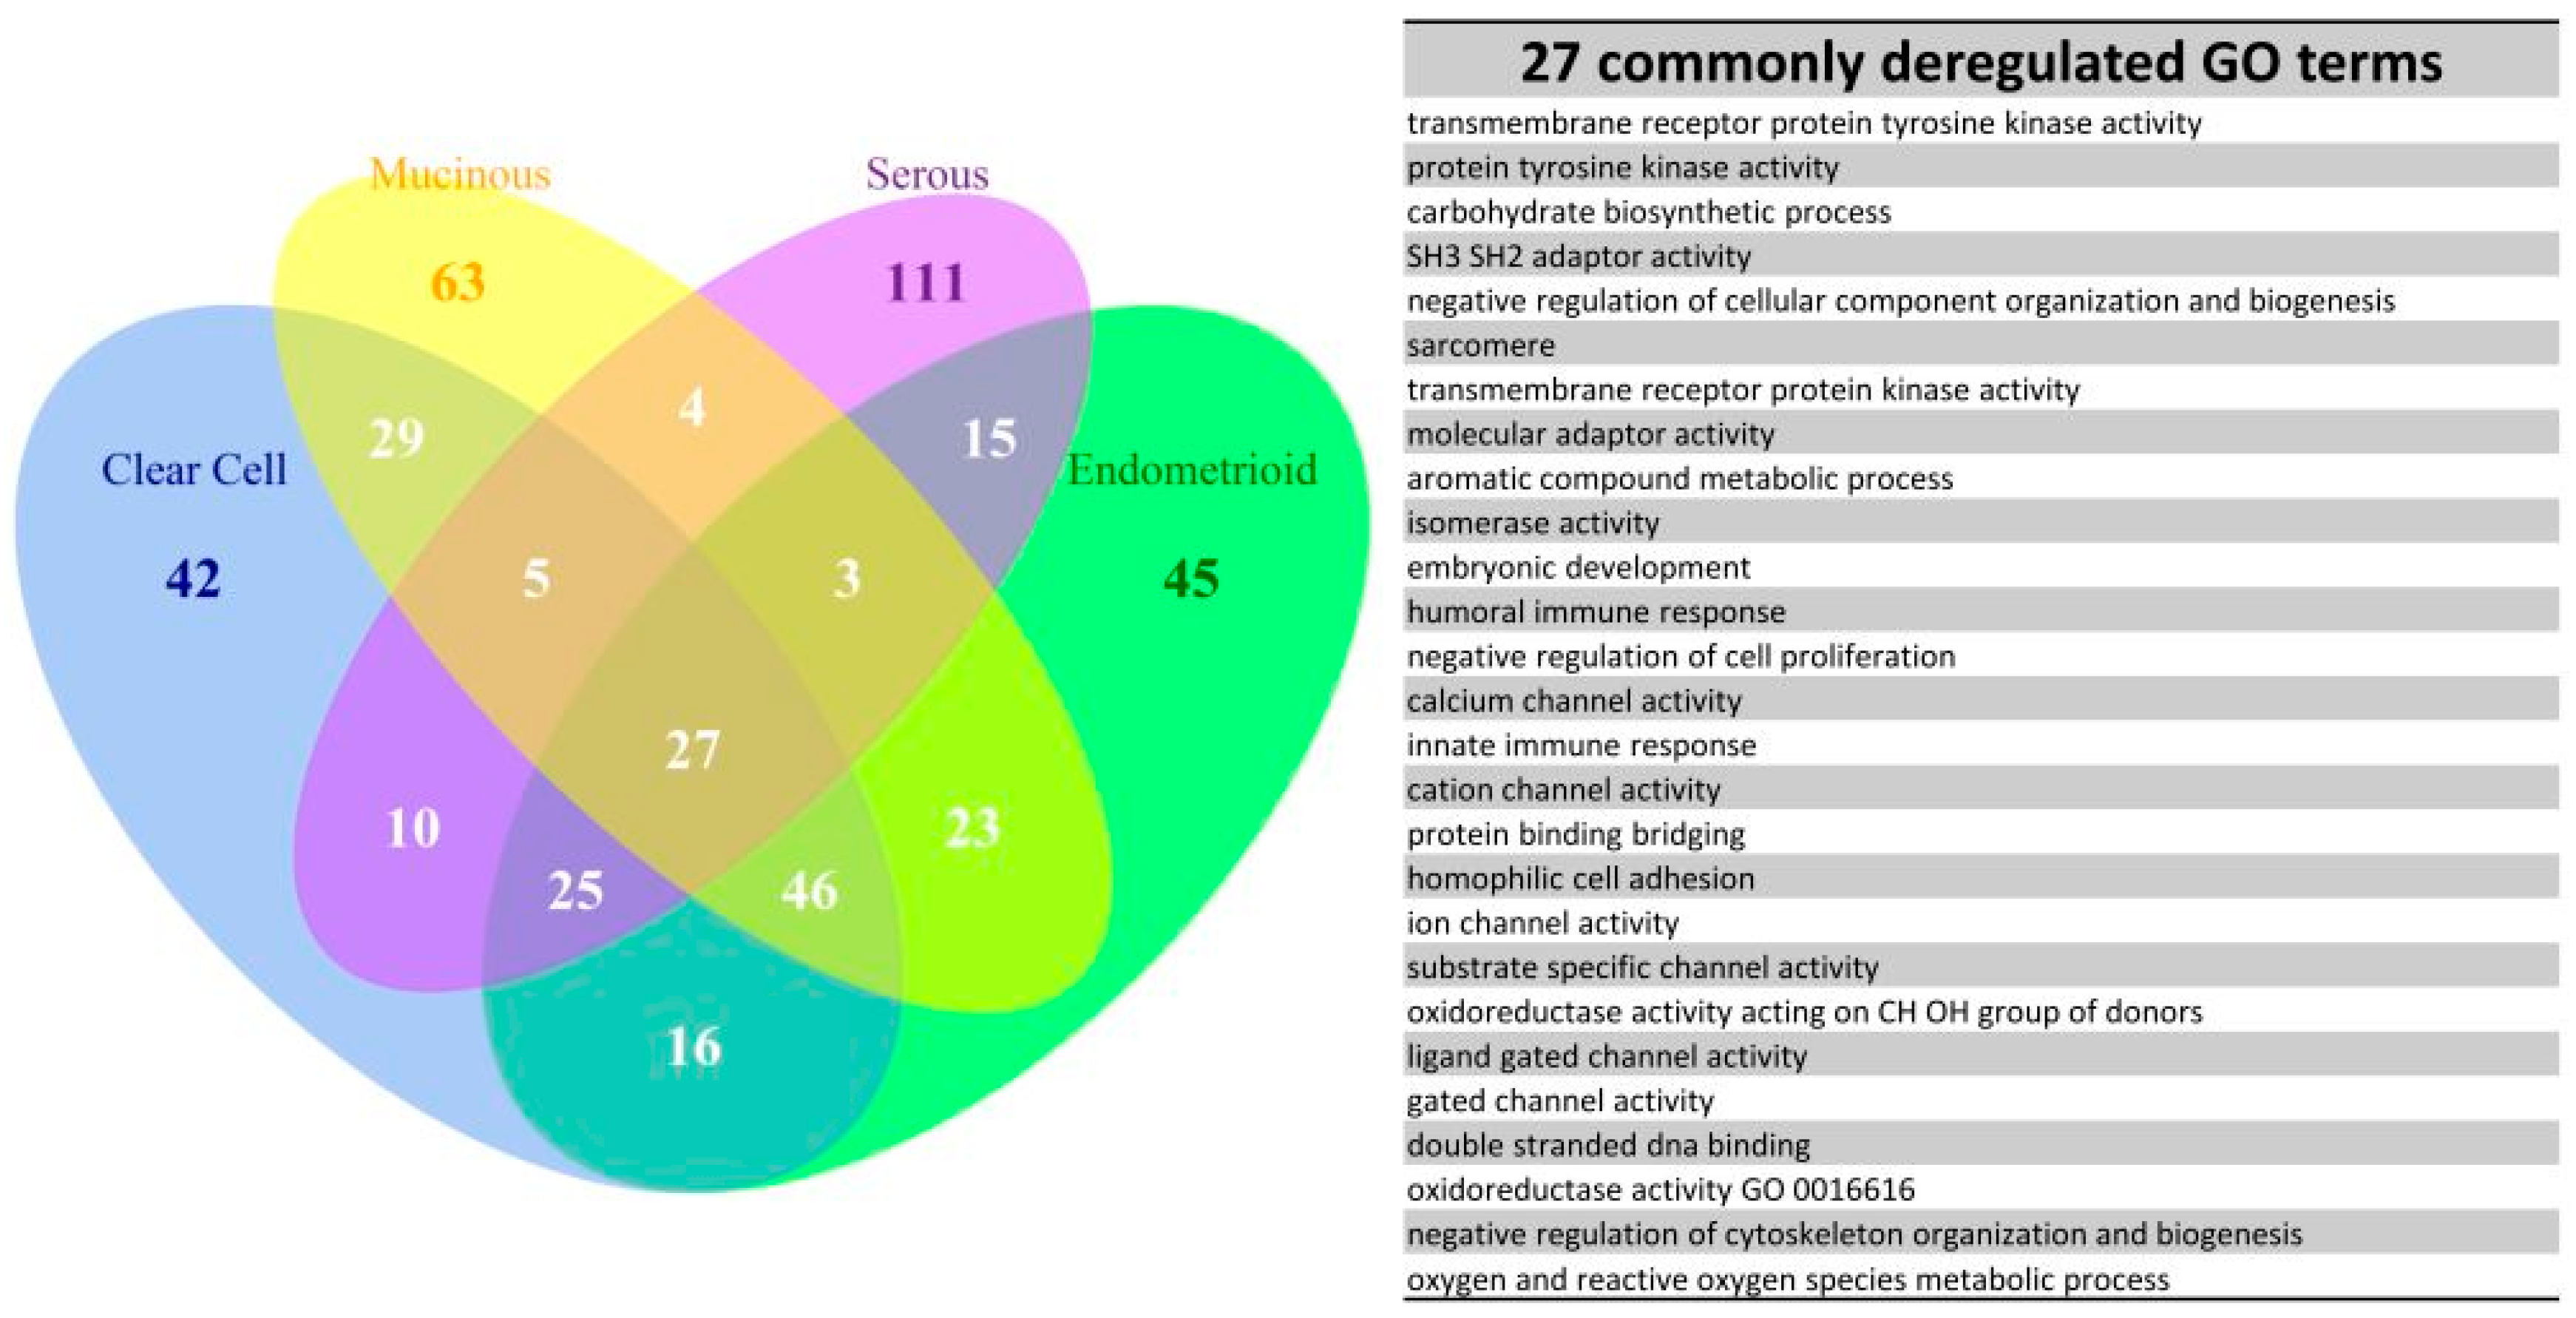
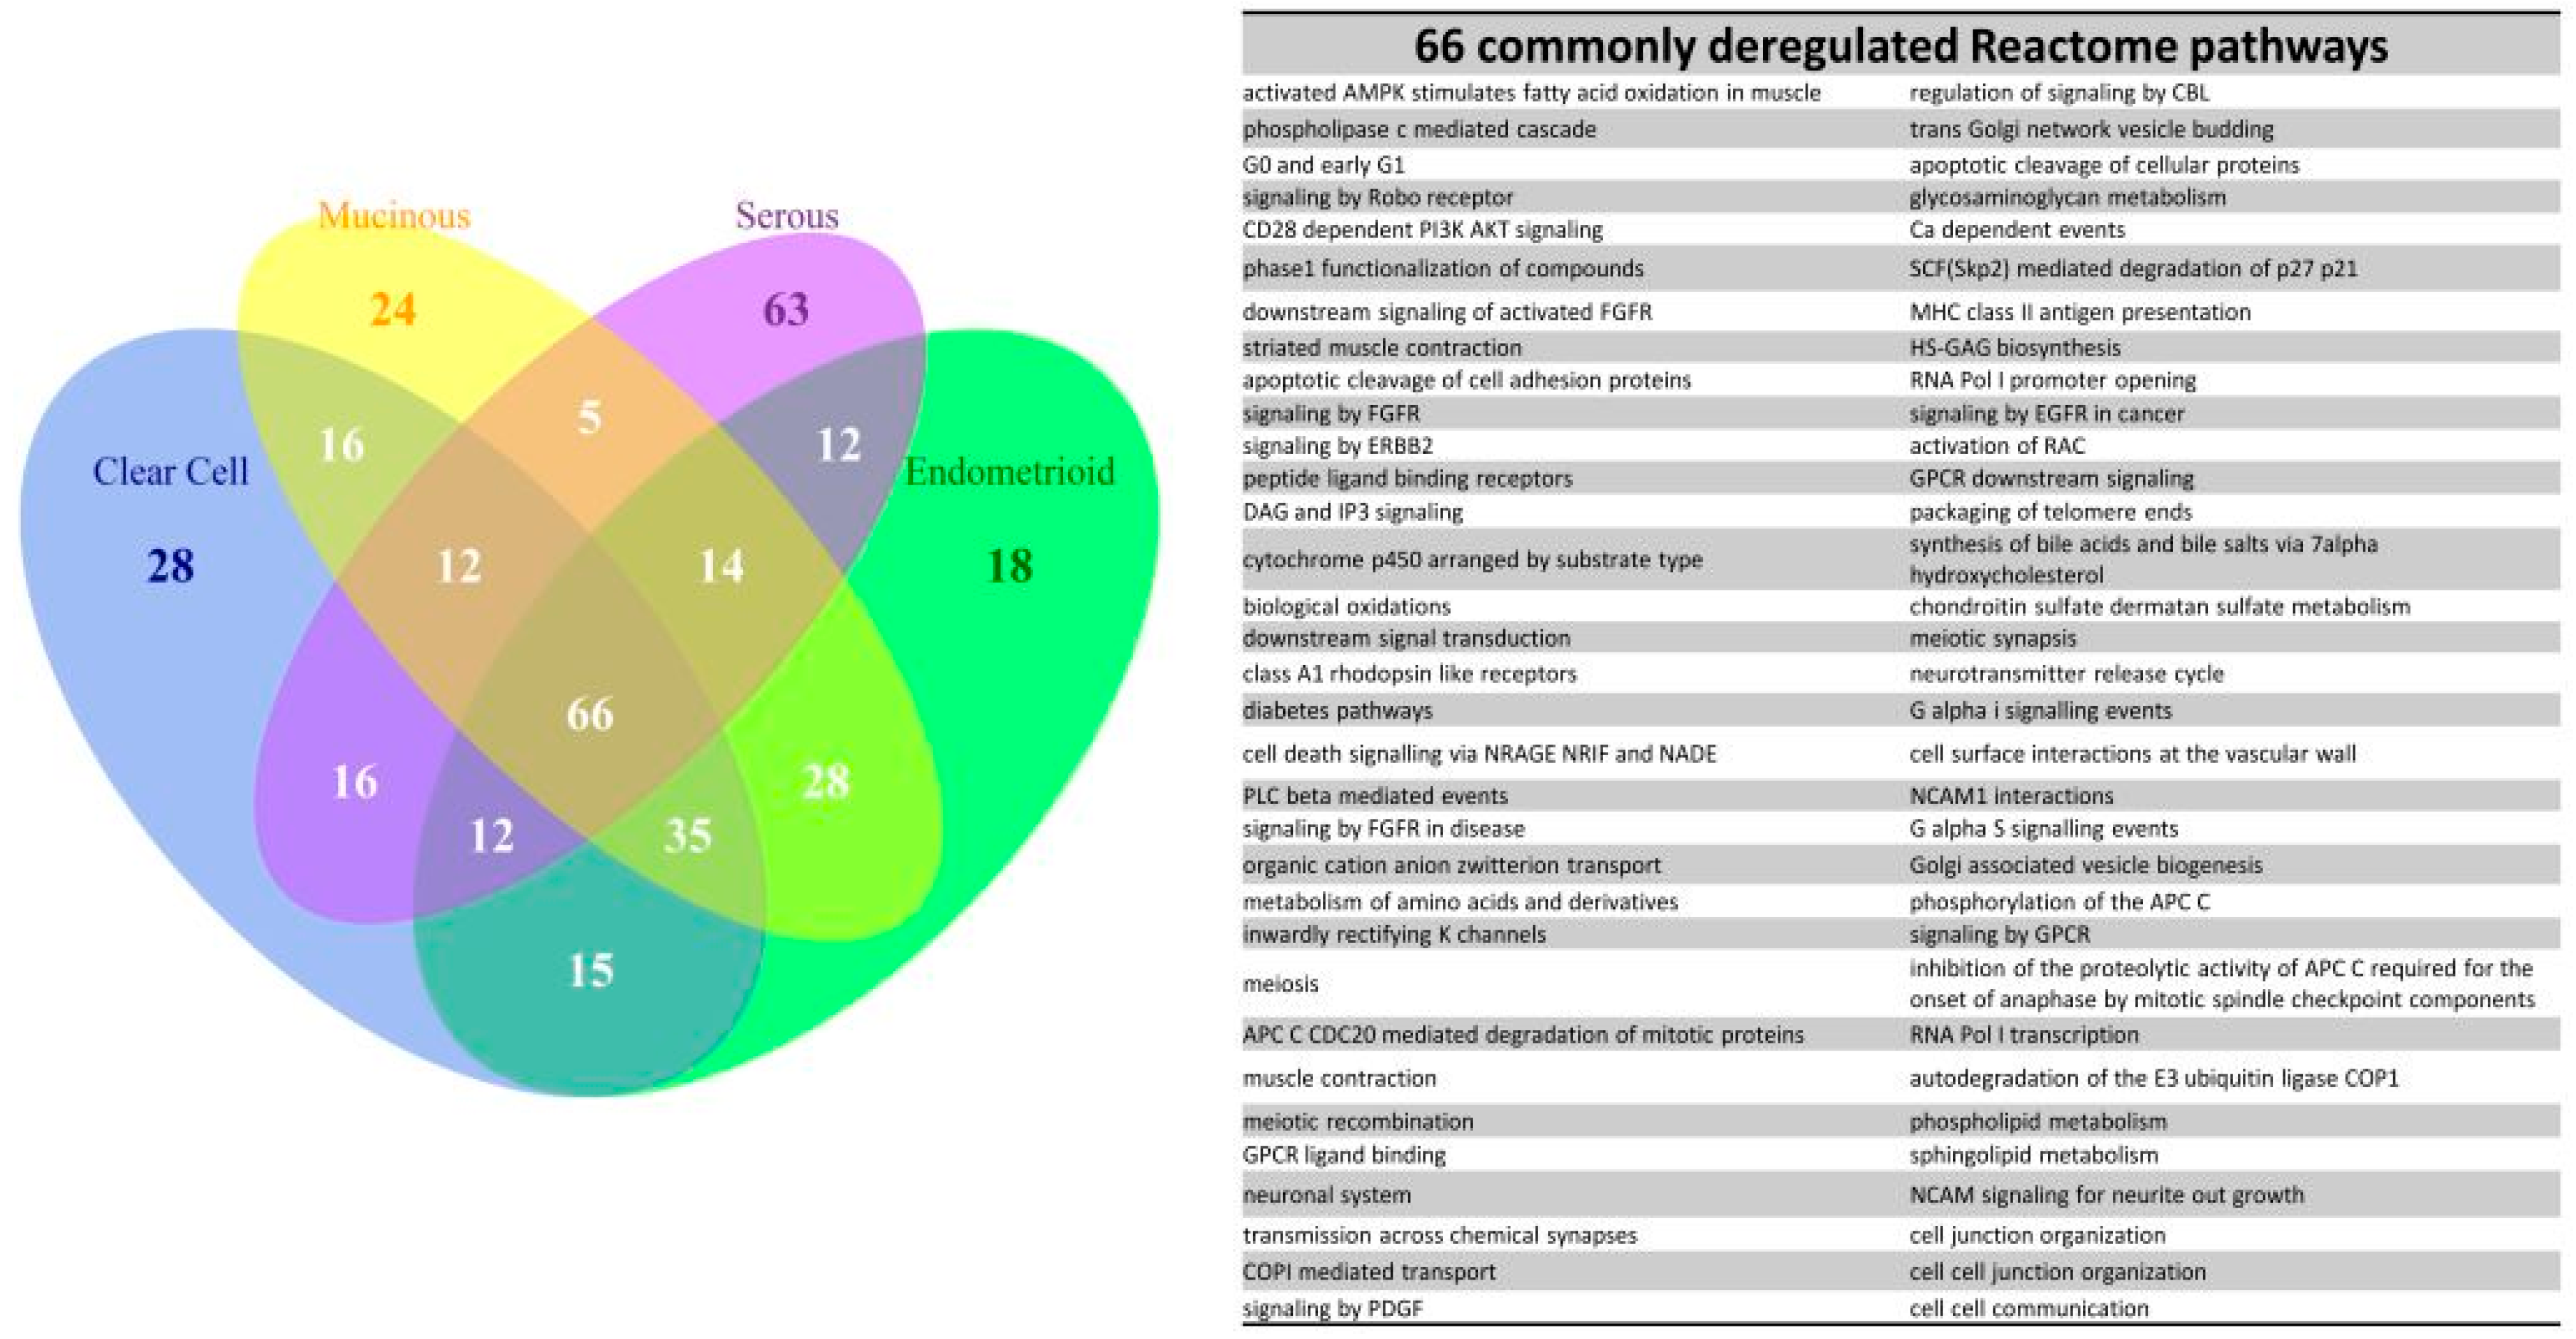
2.5. Deregulated GO Terms and Reactome Pathways of the Subtypes
2.6. The Commonly Deregulated GO Term and Reactome Pathway Gene Sets among the Four Subtypes
2.7. The Elements of Carcinogenesis Networks Discovered by Exploratory Factor Analysis
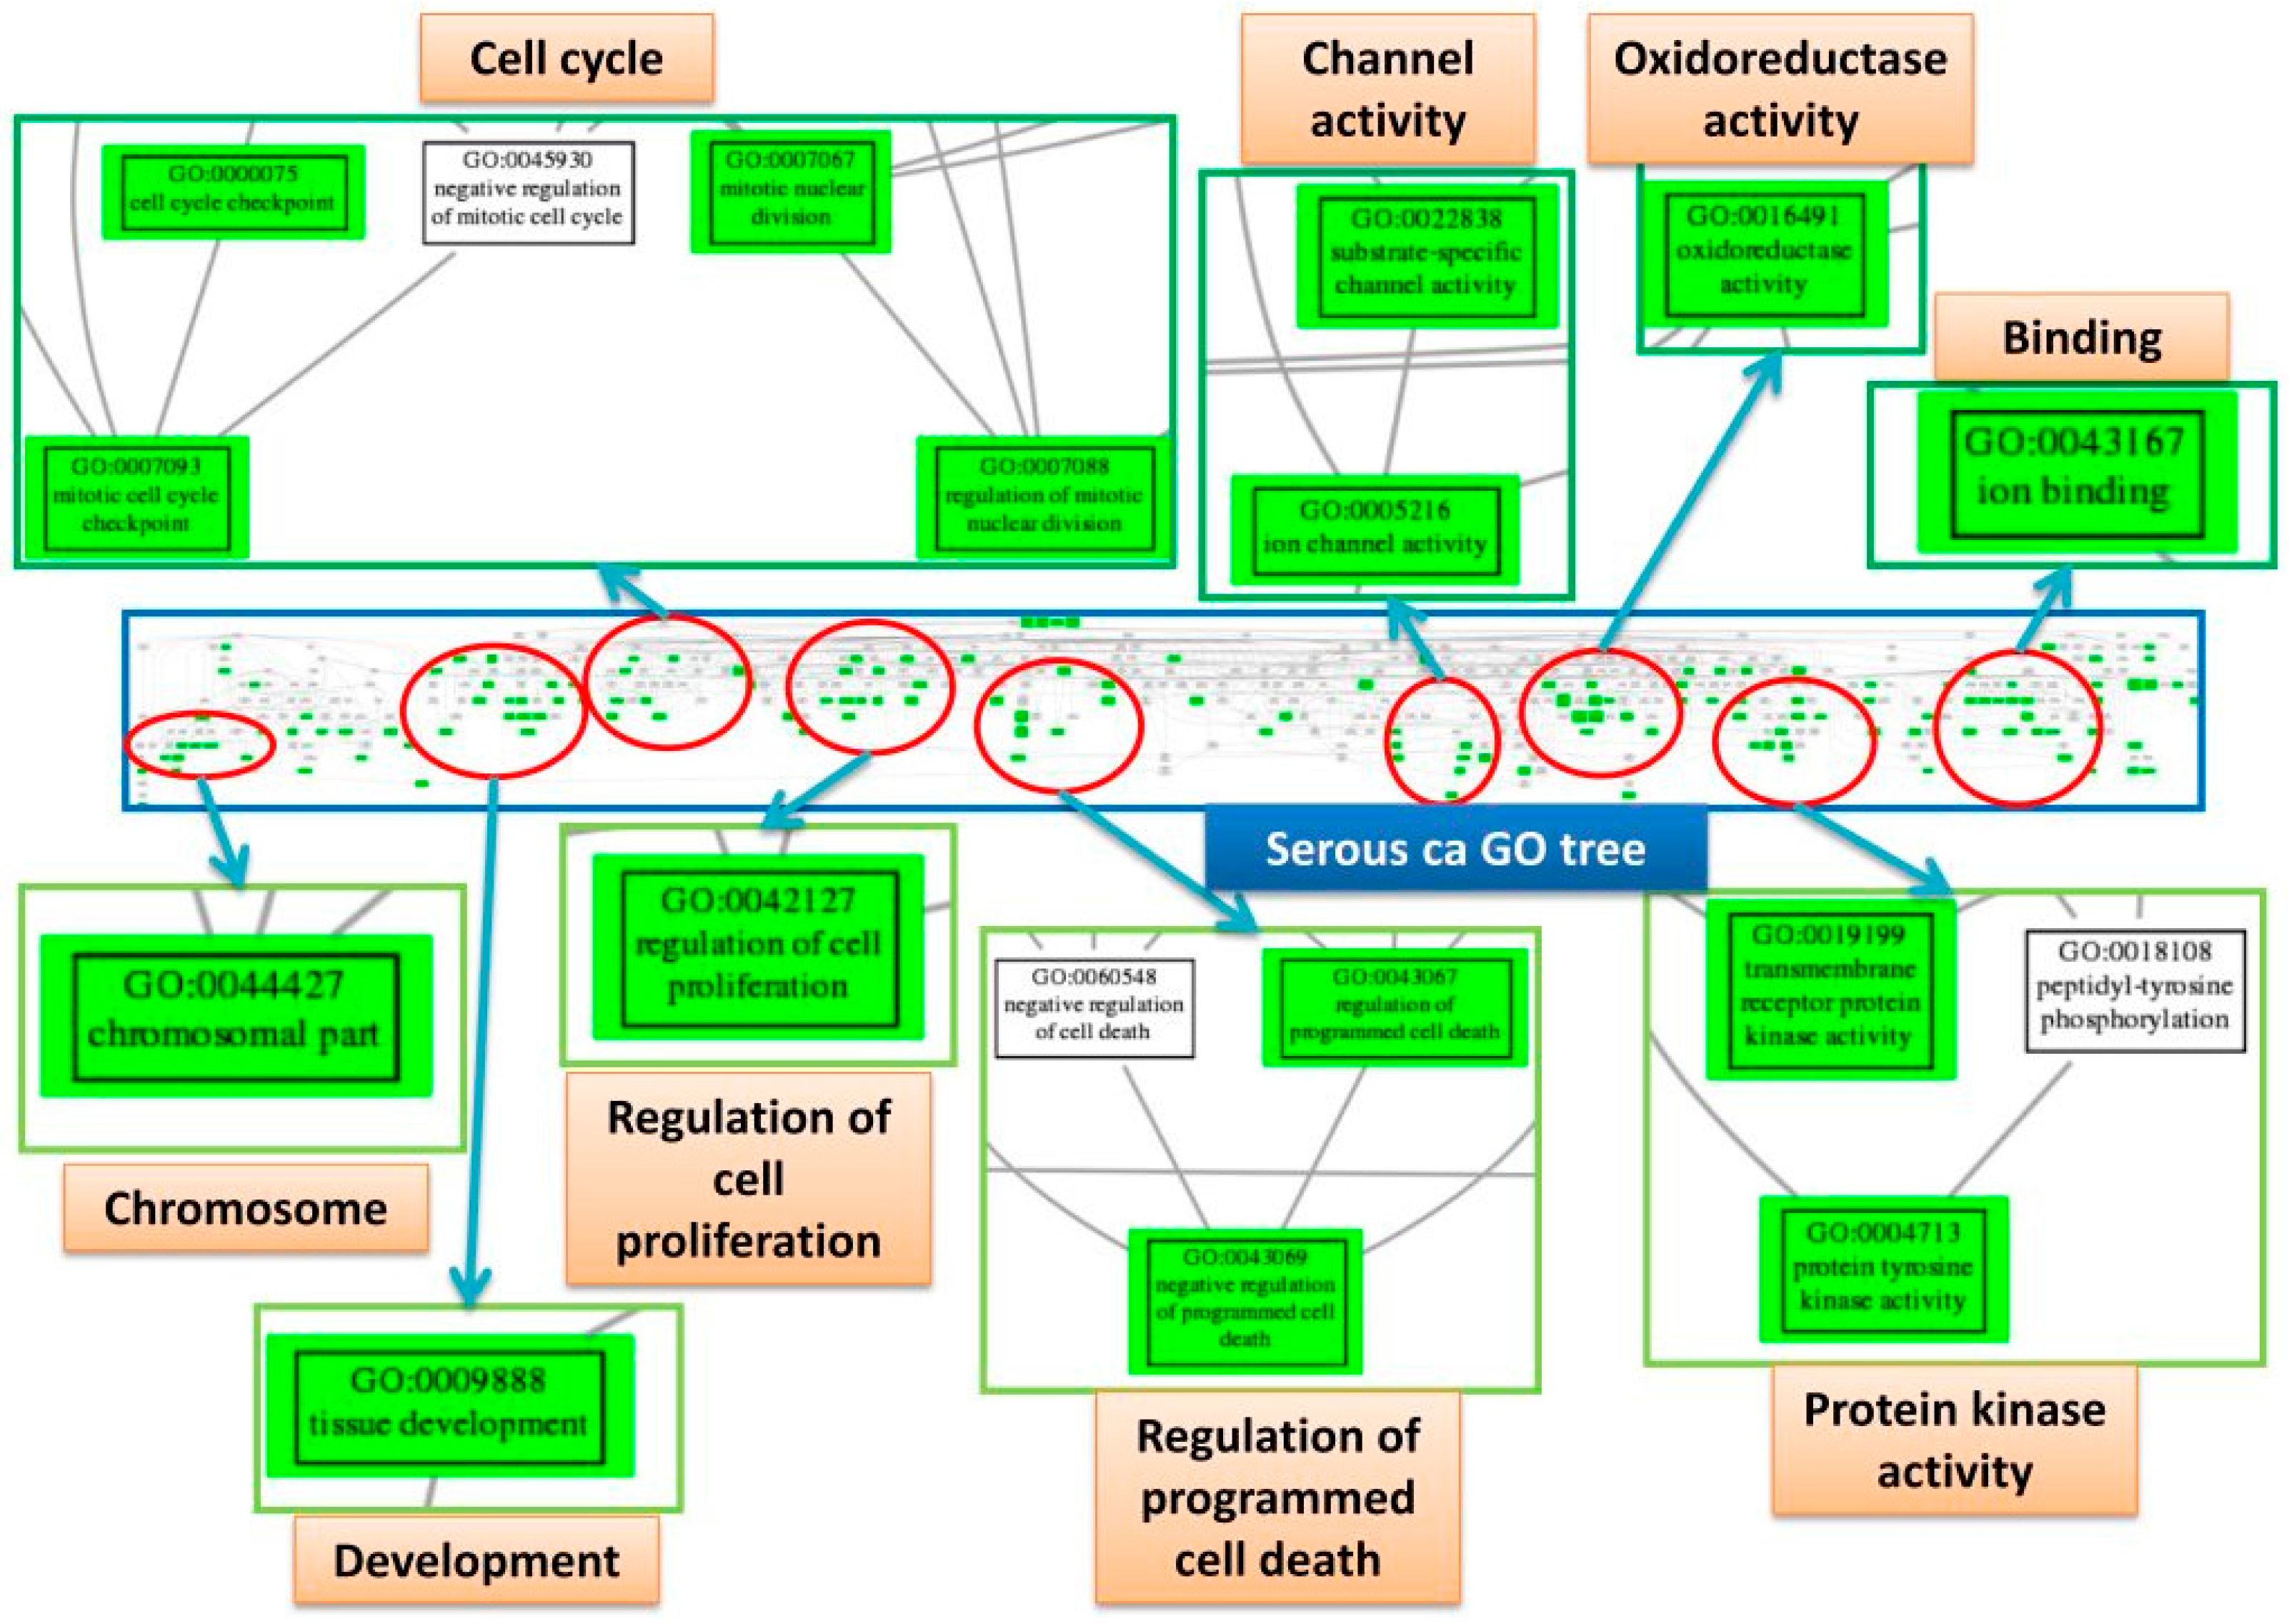
2.8. Trees of Deregulated GO Terms for the Four Subtypes
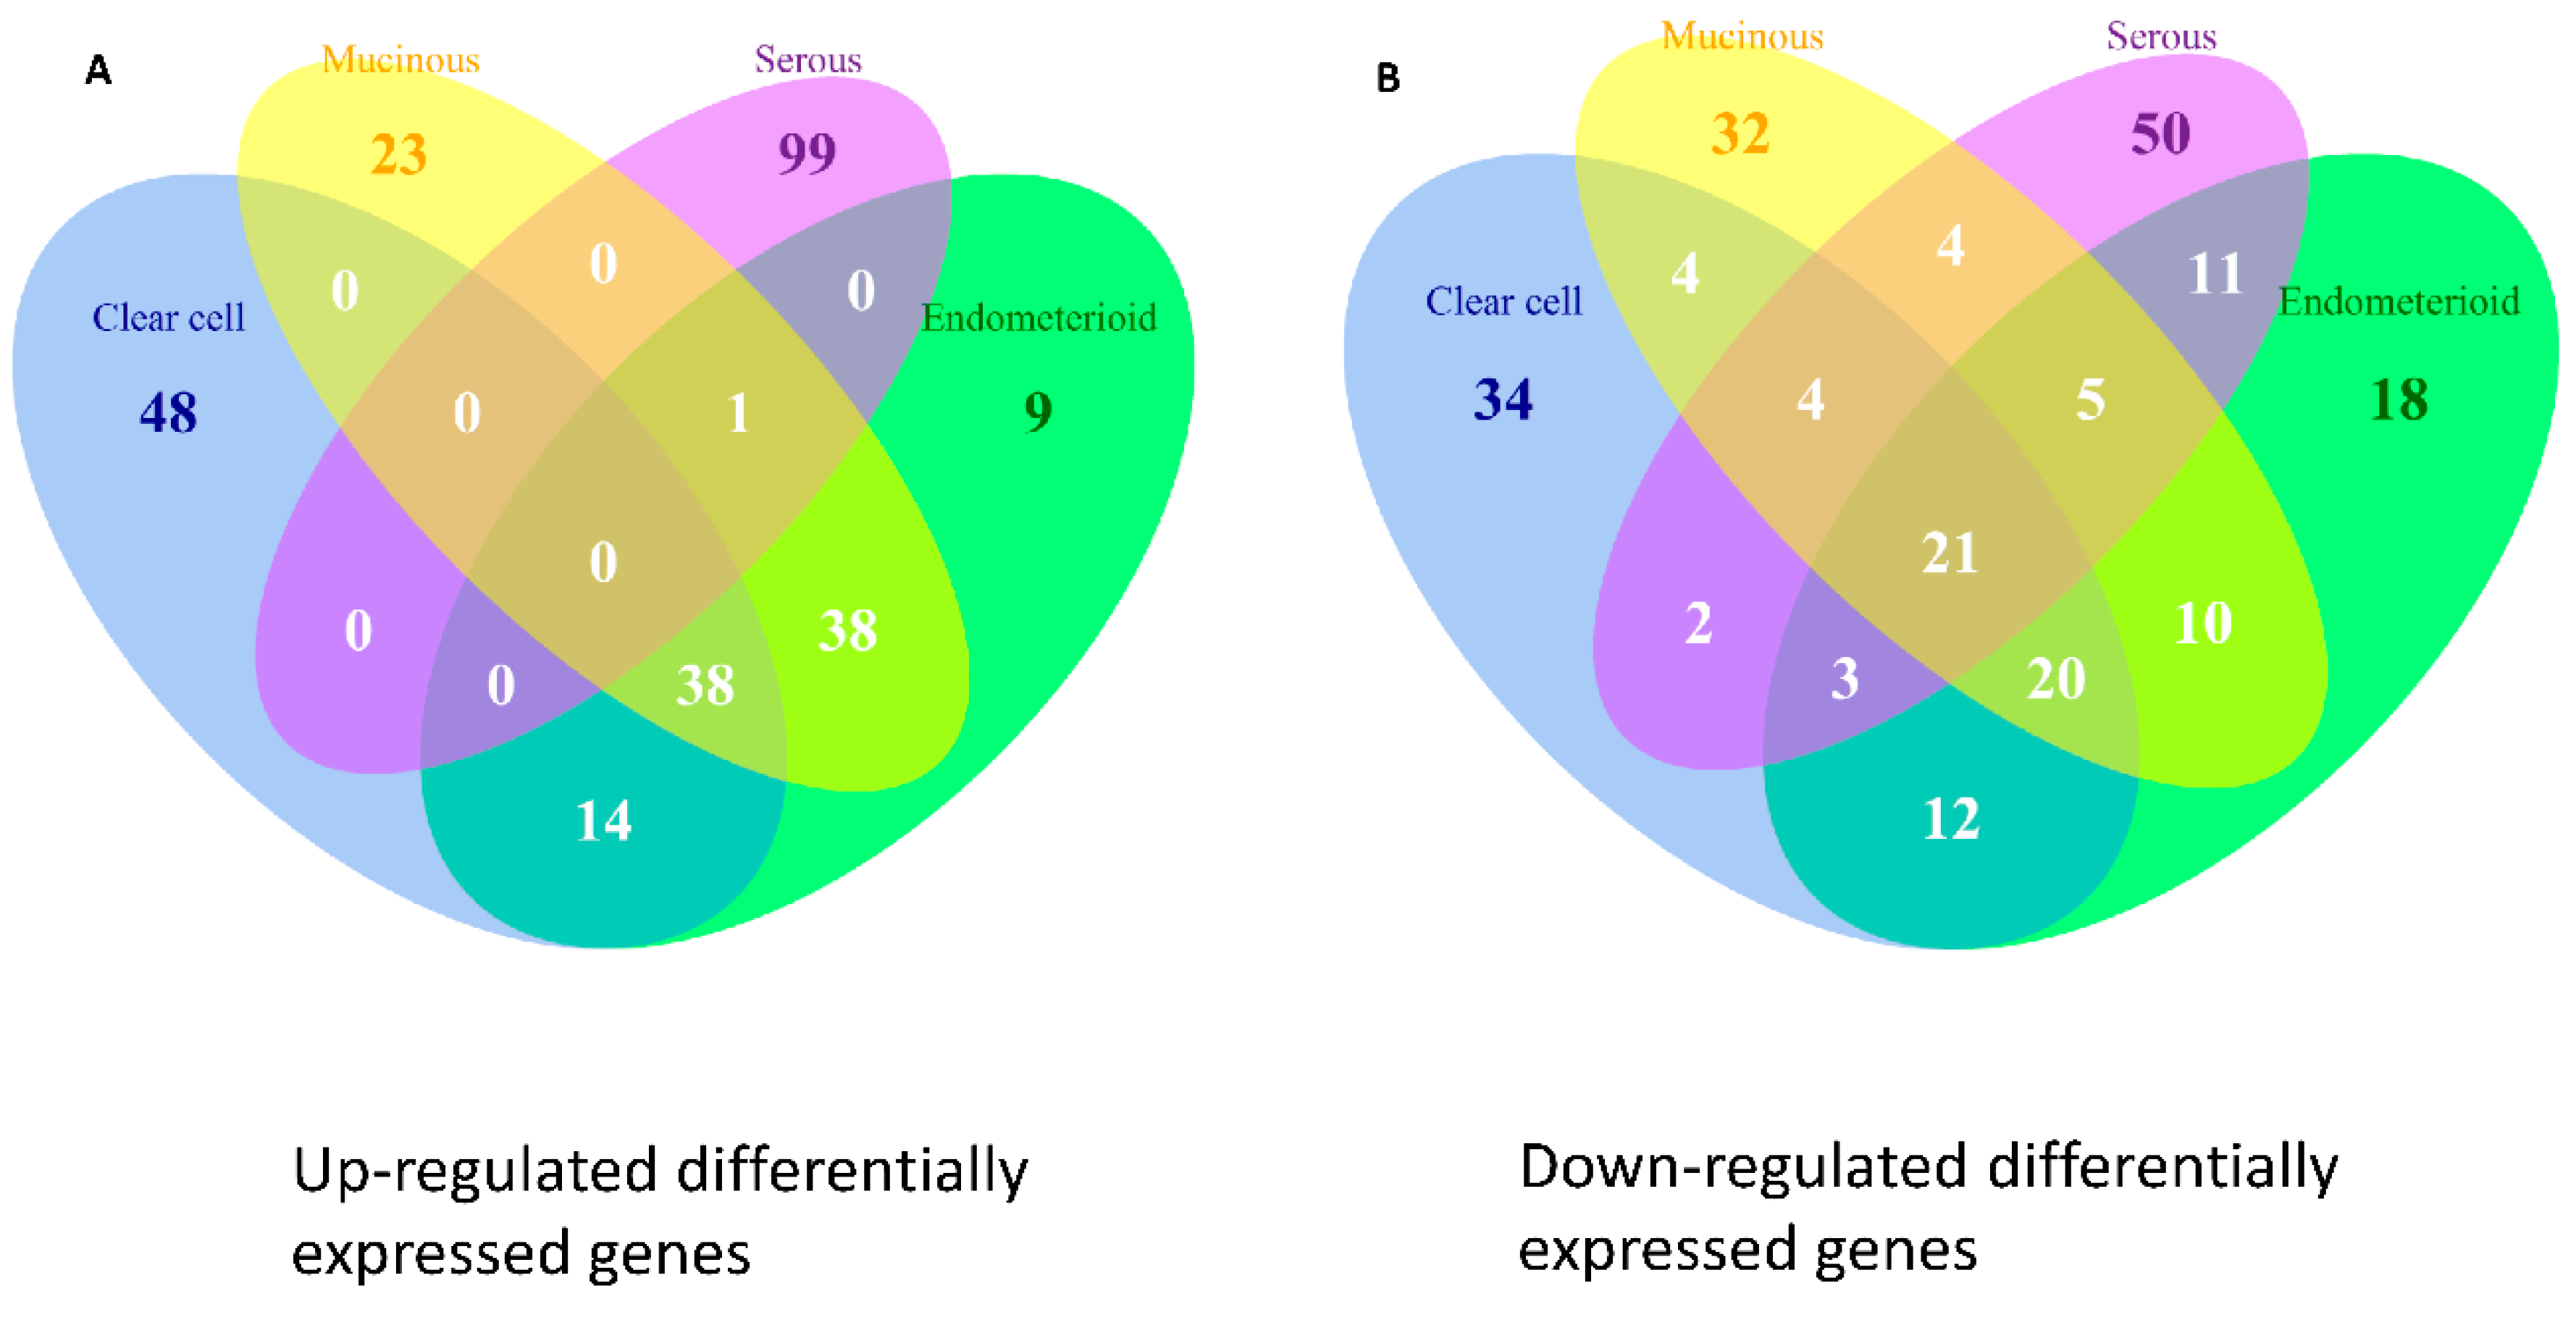
2.9. Differentially Expressed Genes in the Four Subtypes of EOC
3. Discussion
4. Materials and Methods
4.1. Computing GSR Indices by Modified Differential Rank Conservation Algorithm
4.2. Microarray Datasets Gene Set Definition and Data Processing
4.3. Statistical Analysis
4.4. Classification and Prediction by Machine Learning
4.5. Hierarchical Clustering Dendrogram and Heatmaps
4.6. Set Analysis
4.7. Exploratory Factor Analysis for the Deregulated GO Terms and Establishment of GO Trees
4.8. Detection of Differentially Expressed Genes in the Four Subtypes of EOC
5. Conclusions
Supplementary Materials
Acknowledgments
Author Contributions
Conflicts of Interest
Abbreviations
| EOC | Epithelial Ovarian Carcinoma |
| CCC | Clear Cell Carcinoma |
| EC | Endometrioid Carcinoma |
| MC | Mucinous Carcinoma |
| SC | Serous Carcinoma |
| GSR | Gene Set Regularity |
| DEG | Differentially Expressed Gene |
| DAG | Directed Acyclic Graph |
| GO | Gene Ontology |
| MSigDB | Molecular Signatures Database |
| EFA | Exploratory Factor Analysis |
| NCBI | National Center for Biotechnology Information |
| GEO | Gene Expression Omnibus |
| SD | Standard Deviation |
| SVM | Support Vector Machine |
| AUC | Area under Curve |
| GPCR | G Protein Coupled Receptor |
| HGNC | HUGO Gene Nomenclature Committee |
| DIRAC | Differential Rank Conservation, |
| RTK | Receptor Tyrosine Kinases |
| EGFR | Epidermal Growth Factor Receptor |
| CRAN | Comprehensive R Archive Network |
References
- Kurman, R.J.; Shih Ie, M. Pathogenesis of ovarian cancer: Lessons from morphology and molecular biology and their clinical implications. Int. J. Gynecol. Pathol. 2008, 27, 151–160. [Google Scholar] [CrossRef] [PubMed]
- Cho, K.R.; Shih Ie, M. Ovarian cancer. Annu. Rev. Pathol. 2009, 4, 287–313. [Google Scholar] [CrossRef] [PubMed]
- Eddy, J.A.; Hood, L.; Price, N.D.; Geman, D. Identifying tightly regulated and variably expressed networks by Differential Rank Conservation (DIRAC). PLoS Comput. Biol. 2010, 6, e1000792. [Google Scholar] [CrossRef] [PubMed]
- Ashburner, M.; Ball, C.A.; Blake, J.A.; Botstein, D.; Butler, H.; Cherry, J.M.; Davis, A.P.; Dolinski, K.; Dwight, S.S.; Eppig, J.T.; et al. Gene ontology: Tool for the unification of biology. Nat. Genet. 2000, 25, 25–29. [Google Scholar] [CrossRef] [PubMed]
- Milacic, M.; Haw, R.; Rothfels, K.; Wu, G.; Croft, D.; Hermjakob, H.; D'Eustachio, P.; Stein, L. Annotating cancer variants and anti-cancer therapeutics in reactome. Cancers (Basel) 2012, 4, 1180–1211. [Google Scholar] [CrossRef] [PubMed]
- Subramanian, A.; Tamayo, P.; Mootha, V.K.; Mukherjee, S.; Ebert, B.L.; Gillette, M.A.; Paulovich, A.; Pomeroy, S.L.; Golub, T.R.; Lander, E.S.; et al. Gene set enrichment analysis: A knowledge-based approach for interpreting genome-wide expression profiles. Proc. Natl. Acad. Sci. USA 2005, 102, 15545–15550. [Google Scholar] [CrossRef] [PubMed]
- Chang, C.M.; Chuang, C.M.; Wang, M.L.; Yang, M.J.; Chang, C.C.; Yen, M.S.; Chiou, S.H. Gene set-based functionome analysis of pathogenesis in epithelial ovarian serous carcinoma and the molecular features in different FIGO stages. Int. J. Mol. Sci. 2016, 17, 886–909. [Google Scholar] [CrossRef] [PubMed]
- Cortes, C.; Vapnik, V. Support-vector networks. Mach. Learn. 1995, 20, 273–297. [Google Scholar] [CrossRef]
- AmiGO 2. Available online: http://amigo2.berkeleybop.org/amigo (accessed on 9 January 2016).
- Reactome Pathway Browser. Available online: http://www.reactome.org/PathwayBrowser/ (accessed on 9 January 2016).
- Frede, J.; Fraser, S.P.; Oskay-Ozcelik, G.; Hong, Y.; Ioana Braicu, E.; Sehouli, J.; Gabra, H.; Djamgoz, M.B. Ovarian cancer: Ion channel and aquaporin expression as novel targets of clinical potential. Eur. J. Cancer 2013, 49, 2331–2344. [Google Scholar] [CrossRef] [PubMed]
- Yin, B.W.; Lloyd, K.O. Molecular cloning of the CA125 ovarian cancer antigen: Identification as a new mucin, MUC16. J. Biol. Chem. 2001, 276, 27371–27375. [Google Scholar] [CrossRef] [PubMed]
- Jiang, X.; Morland, S.J.; Hitchcock, A.; Thomas, E.J.; Campbell, I.G. Allelotyping of endometriosis with adjacent ovarian carcinoma reveals evidence of a common lineage. Cancer Res. 1998, 58, 1707–1712. [Google Scholar] [PubMed]
- Wiegand, K.C.; Shah, S.P.; Al-Agha, O.M.; Zhao, Y.; Tse, K.; Zeng, T.; Senz, J.; McConechy, M.K.; Anglesio, M.S.; Kalloger, S.E.; et al. ARID1A mutations in endometriosis-associated ovarian carcinomas. N. Engl. J. Med. 2010, 363, 1532–1543. [Google Scholar] [CrossRef] [PubMed]
- Meng, A.X.; Jalali, F.; Cuddihy, A.; Chan, N.; Bindra, R.S.; Glazer, P.M.; Bristow, R.G. Hypoxia down-regulates DNA double strand break repair gene expression in prostate cancer cells. Radiother. Oncol. 2005, 76, 168–176. [Google Scholar] [CrossRef] [PubMed]
- Hashiguchi, Y.; Tsuda, H.; Inoue, T.; Berkowitz, R.S.; Mok, S.C. PTEN expression in clear cell adenocarcinoma of the ovary. Gynecol. Oncol. 2006, 101, 71–75. [Google Scholar] [CrossRef] [PubMed]
- Kuo, K.T.; Mao, T.L.; Jones, S.; Veras, E.; Ayhan, A.; Wang, T.L.; Glas, R.; Slamon, D.; Velculescu, V.E.; Kuman, R.J.; et al. Frequent activating mutations of PIK3CA in ovarian clear cell carcinoma. Am. J. Pathol. 2009, 174, 1597–1601. [Google Scholar] [CrossRef] [PubMed]
- Tan, D.S.; Iravani, M.; McCluggage, W.G.; Lambros, M.B.; Milanezi, F.; Mackay, A.; Gourley, C.; Geyer, F.C.; Vatcheva, R.; Millar, J.; et al. Genomic analysis reveals the molecular heterogeneity of ovarian clear cell carcinomas. Clin. Cancer Res. 2011, 17, 1521–1534. [Google Scholar] [CrossRef] [PubMed]
- Hu, L.; Hofmann, J.; Lu, Y.; Mills, G.B.; Jaffe, R.B. Inhibition of phosphatidylinositol 3′-kinase increases efficacy of paclitaxel in in vitro and in vivo ovarian cancer models. Cancer Res. 2002, 62, 1087–1092. [Google Scholar] [PubMed]
- Leary, J.A.; Edwards, B.G.; Houghton, C.R.; Kefford, R.F.; Friedlander, M.L. Amplification of HER-2/neu oncogene in human ovarian cancer. Int. J. Gynecol. Cancer 1992, 2, 291–294. [Google Scholar] [CrossRef] [PubMed]
- Tanner, B.; Hasenclever, D.; Stern, K.; Schormann, W.; Bezler, M.; Hermes, M.; Brulport, M.; Bauer, A.; Schiffer, I.B.; Gebhard, S.; et al. ErbB-3 predicts survival in ovarian cancer. J. Clin. Oncol. 2006, 24, 4317–4323. [Google Scholar] [CrossRef] [PubMed]
- Alexandros, K.; Alexandros, S.; Kurt, H.; Achim, Z. Kernlab—An S4 package for kernel methods in R. journal of statistical software. J. Stat. Softw. 2004, 11, 1–20. [Google Scholar]
- Robin, X.; Turck, N.; Hainard, A.; Tiberti, N.; Lisacek, F.; Sanchez, J.C.; Muller, M. pROC: An open-source package for R and S+ to analyze and compare ROC curves. BMC Bioinform. 2011, 12, 77–85. [Google Scholar] [CrossRef] [PubMed]
- Schroder, M.S.; Gusenleitner, D.; Quackenbush, J.; Culhane, A.C.; Haibe-Kains, B. RamiGO: An R/Bioconductor package providing an AmiGO visualize interface. Bioinformatics 2013, 29, 666–668. [Google Scholar] [CrossRef] [PubMed]


| EOC Subtype | Sample | Control | Total | Sample Mean (SD) | Control Mean (SD) | p Value * |
|---|---|---|---|---|---|---|
| Clear cell | 85 | 136 | 221 | 0.7438 (0.1171) | 0.7727 (0.1329) | <0.001 |
| Endometrioid | 90 | 136 | 226 | 0.7434 (0.1260) | 0.7731 (0.1326) | <0.001 |
| Mucinous | 48 | 136 | 184 | 0.7174 (0.1531) | 0.7724 (0.1334) | <0.001 |
| Serous | 1093 | 136 | 1229 | 0.6694 (0.1997) | 0.7697 (0.1589) | <0.001 |
| EOC Subtype | Sensitivity (SD) | Specificity (SD) | Accuracy (SD) | AUC |
|---|---|---|---|---|
| Clear Cell | 1.0000 (0.0000) | 1.0000 (0.0000) | 1.0000 (0.0000) | 1.0000 |
| Endometrioid | 0.9724 (0.0463) | 1.0000 (0.0000) | 0.9888 (0.0188) | 0.9868 |
| Mucinous | 0.9582 (0.0559) | 1.0000 (0.0000) | 0.9818 (0.0139) | 0.9805 |
| Serous | 0.9930 (0.0004) | 0.9680 (0.0269) | 0.9902 (0.0004) | 0.9807 |
| Multiclass | NA | NA | 0.9555 (0.0112) | NA |
| Clear Cell | Endometrioid | Mucinous | Serous |
|---|---|---|---|
| Cofactor Transport | Cofactor Transporter Activity | Aldo Keto Reductase Activity | Protein Tyrosine Activity |
| Inositol or Phosphatidylinositol Phosphatase Activity | Secretin Like Receptor Activity | Secretin Like Receptor Activity | Oxidoreductase Activity Acting on The Aldehyde or OXO Group of Donors |
| Rho Guanyl Nucleotide Exchange Factor Activity | Carbohydrate Biosynthetic Process | Vitamin Transport | Homophilic Cell Adhesion |
| Small Conjugating Protein Binding | Regulation of Viral Reproduction | Rho Guanyl Nucleotide Exchange Factor Activity | Regulation of Actin Filament Length |
| Ubiquitin Binding | Calcium Independent Cell Adhesion | Small Conjugating Protein Binding | Regulation of Actin Polymerization and or Depolymerization |
| Regulation of Viral Reproduction | Coenzyme Binding | Ubiquitin Binding | Regulation of Cellular Component Size |
| Vitamin Transport | Sulfotransferase Activity | Calcium Channel Activity | Vitamin Metabolic Process |
| Steroid Hormone Receptor Binding | Inositol or Phosphatidylinositol Phosphatase Activity | Negative Regulation of Immune System Process | Spindle Pole |
| Histone Deacetylase Binding | Calcium Channel Activity | Carbohydrate Biosynthetic Process | Negative Regulation of Cellular Component Organization and Biogenesis |
| Oxidoreductase Activity Acting on the CH NH Group of Donors | Cofactor Binding | Inositol or Phosphatidylinositol Phosphatase Activity | Spindle |
| Transmembrane Receptor Protein Tyrosine Kinase Activity | Transferase Activity Transferring Sulfur Containing Groups | Neuropeptide Binding | Innate Immune Response |
| Protein Tyrosine Kinase Activity | Oxidoreductase Activity Acting on The Aldehyde or OXO Group of Donors | Neuropeptide Receptor Activity | Negative Regulation of Cell Proliferation |
| Insoluble Fraction | Vitamin Transport | Transmembrane Receptor Protein Tyrosine Kinase Activity | Regulation of Organelle Organization and Biogenesis |
| Carbohydrate Biosynthetic Process | Transmembrane Receptor Protein Tyrosine Kinase Activity | Innate Immune Response | Single Stranded DNA Binding |
| Ras Guanyl Nucleotide Exchange Factor Activity | Rho Guanyl Nucleotide Exchange Factor Activity | Cofactor Transporter Activity | Oxidoreductase Activity Acting on The Aldehyde or OXO Group of Donorsnad or Nadp As Acceptor |
| Clear Cell | Endometrioid | Mucinous | Serous |
|---|---|---|---|
| Downregulation of ERBB2 ERBB3 Signaling | Downregulation of ERBB2 ERBB3 Signaling | Organic Cation Anion Zwitterion Transport | Ca Dependent Events |
| Negative Regulation of the PI3K AKT Network | CD28 Dependent PI3K AKT Signaling | Downregulation of ERBB2 ERBB3 Signaling | DARPP 32 Events |
| Activated AMPK Stimulates Fatty Acid Oxidation in Muscle | Organic Cation Anion Zwitterion Transport | Olfactory Signaling Pathway | Signaling by Robo Receptor |
| PERK Regulated Gene Expression | Nef Mediated Downregulation of MHC Class I Complex Cell Surface Expression | Digestion of Dietary Carbohydrate | Plc Beta Mediated Events |
| Ethanol Oxidation | GABA Synthesis Release Reuptake and Degradation | PI3K Events in ERBB2 Signaling | COPI Mediated Transport |
| Phospholipase C Mediated Cascade | Negative Regulation of the PI3K AKT Network | Regulation of Insulin Like Growth Factor Igf Activity by Insulin Like Growth Factor Binding Proteins Igfbps | Sphingolipid De Novo Biosynthesis |
| Regulation of Rheb Gtpase Activity By AMPK | Inhibition of The Proteolytic Activity of APC C Required for The Onset of Anaphase By Mitotic Spindle Checkpoint Components | Regulated Proteolysis of P75NTR | DAG and IP3 Signaling |
| PI3K Cascade | NCAM1 Interactions | Activated AMPK Stimulates Fatty Acid Oxidation in Muscle | NCAM1 Interactions |
| Beta Defensins | GPVI Mediated Activation Cascade | Nef Mediated Downregulation Of MHC Class I Complex Cell Surface Expression | G0 and Early G1 |
| FGFR Ligand Binding and Activation | Phosphorylation of The APC C | Peptide Ligand Binding Receptors | Gα Z Signalling Events |
| Common Pathway | Termination of O Glycan Biosynthesis | Class A1 Rhodopsin Like Receptors | MHC Class II Antigen Presentation |
| Activation of Genes by ATF4 | Regulation of Rheb Gtpase Activity by AMPK | Intrinsic Pathway | Signaling by PDGF |
| GPVI Mediated Activation Cascade | Activated Ampk Stimulates Fatty Acid Oxidation in Muscle | CD28 Dependent PI3K AKT Signaling | HS GAG Biosynthesis |
| PI3K Cascade | Conversion From APC C CDC20 to APC C Cdh1 in Late Anaphase | Endogenous Sterols | Chondroitin Sulfate Dermatan Sulfate Metabolism |
| Insulin Receptor Signalling Cascade | APC C CDC20 Mediated Degradation of Cyclin B | Formation of Fibrin Clot Clotting Cascade | Abacavir Transport and Metabolism |
| Clear Cell | Endometrioid | Mucinous | Serous | |||||||||||||
|---|---|---|---|---|---|---|---|---|---|---|---|---|---|---|---|---|
| Down-Regulation | Up-Regulation | Down-Regulation | Up-Regulation | Down-Regulation | Up-Regulation | Down-Regulation | Up-Regulation | |||||||||
| Ranking | Gene | p Value | Gene | p Value | Gene | p Value | Gene | p Value | Gene | p Value | Gene | p Value | Gene | p Value | Gene | p Value |
| 1 | EIF3F | 7.35 × 10−109 | TOMM7 | 1.67 × 10−118 | EIF3F | 8.76 × 10−114 | TOMM7 | 9.66 × 10−107 | EIF3F | 2.22 × 10−101 | RPL23 | 7.94 × 10−88 | AOX1 | 3.51 × 10−133 | C14orf2 | 8.15 × 10−78 |
| 2 | RPL21 | 9.70 × 10−89 | RPL24 | 1.23 × 10−109 | RPS13 | 9.13 × 10−98 | RPL34 | 1.96 × 10−96 | TOMM7 | 7.54 × 10−94 | PLS3 | 6.95 × 10−86 | EIF3F | 2.00 × 10−132 | COX6B1 | 2.59 × 10−66 |
| 3 | PRNP | 1.88 × 10−81 | RPS13 | 9.31 × 10−102 | RPS11 | 5.65 × 10−95 | RPL23 | 3.91 × 10−95 | RPL34 | 2.75 × 10−89 | FHL2 | 5.95 × 10−82 | DFNA5 | 1.26 × 10−128 | TRIAP1 | 3.44 × 10−65 |
| 4 | RPL13 | 4.78 × 10−80 | EIF3L | 1.52 × 10−101 | RPL27 | 2.10 × 10−93 | ALDH9A1 | 5.65 × 10−95 | RPS13 | 1.60 × 10−84 | ALDH9A1 | 6.07 × 10−82 | PTGIS | 6.85 × 10−125 | RBX1 | 9.37 × 10−63 |
| 5 | CAV1 | 3.04 × 10−78 | RPS11 | 1.71 × 10−98 | DFNA5 | 4.74 × 10−92 | PLS3 | 1.30 × 10−94 | RPS11 | 2.85 × 10−83 | RPS27L | 8.49 × 10−80 | TSPAN5 | 7.08 × 10−124 | CGRRF1 | 1.25 × 10−61 |
| 6 | DFNA5 | 1.76 × 10−76 | ITM2B | 6.57 × 10−98 | RPL39 | 1.64 × 10−89 | ITM2B | 6.36 × 10−94 | RPS15 | 7.86 × 10−82 | SEC31A | 8.73 × 10−80 | BAMBI | 2.13 × 10−108 | LSM6 | 6.16 × 10−60 |
| 7 | RPS28 | 4.73 × 10−74 | RPL27 | 7.35 × 10−98 | RPL41 | 1.38 × 10−86 | RPS15 | 3.67 × 10−93 | RPL27 | 2.31 × 10−80 | RRAGA | 2.54 × 10−78 | SPOCK1 | 2.13 × 10−108 | COX5A | 1.71 × 10−59 |
| 8 | CALD1 | 3.06 × 10−70 | RPL17 | 5.33 × 10−97 | SGK1 | 1.71 × 10−85 | RPL36AL | 2.03 × 10−90 | DFNA5 | 2.26 × 10−79 | YPEL5 | 3.86 × 10−78 | GFPT2 | 8.91 × 10−107 | TIMM8B | 1.54 × 10−58 |
| 9 | PMP22 | 5.06 × 10−69 | RPS15 | 2.73 × 10−94 | RPLP2 | 6.38 × 10−85 | RPL32 | 1.64 × 10−89 | RPL32 | 1.61 × 10−77 | RPL36 | 2.04 × 10−77 | C21orf62 | 1.35 × 10−106 | SNX6 | 1.62 × 10−58 |
| 10 | TPM1 | 8.35 × 10−69 | RPL5 | 2.97 × 10−92 | PRNP | 3.01 × 10−84 | LAPTM4A | 1.91 × 10−88 | RPL39 | 1.61 × 10−77 | RPL36AL | 4.12 × 10−77 | FLRT2 | 5.29 × 10−104 | IER3IP1 | 1.88 × 10−58 |
| 11 | RPL10 | 1.07 × 10−67 | PLS3 | 1.17 × 10−91 | CAV1 | 5.20 × 10−84 | SRP14 | 5.89 × 10−88 | PRNP | 3.65 × 10−77 | LAPTM4A | 1.20 × 10−76 | NDN | 2.35 × 10−103 | MGST2 | 2.04 × 10−57 |
| 12 | PTGIS | 1.60 × 10−66 | RPS3A | 1.42 × 10−91 | UROD | 1.72 × 10−82 | RPL36 | 1.43 × 10−87 | SGK1 | 5.08 × 10−77 | ANXA5 | 4.42 × 10−76 | GPRASP1 | 5.93 × 10−103 | METTL5 | 2.38 × 10−57 |
| 13 | DCN | 1.88 × 10−66 | RPL39 | 7.65 × 10−91 | RPS28 | 3.11 × 10−81 | RPL6 | 2.48 × 10−86 | RPL30 | 2.92 × 10−75 | DSTN | 5.00 × 10−74 | IGFBP6 | 3.90 × 10−102 | MRPS14 | 3.94 × 10−57 |
| 14 | NDN | 1.02 × 10−65 | RPS27L | 7.68 × 10−90 | PMP22 | 4.40 × 10−81 | RPL30 | 2.59 × 10−86 | PMP22 | 3.66 × 10−74 | OAT | 5.21 × 10−74 | RPS11 | 6.71 × 10−101 | JMJD6 | 1.32 × 10−56 |
| 15 | HNRNPA1L2 | 3.57 × 10−64 | RPL23 | 9.84 × 10−90 | TIMP2 | 5.47 × 10−81 | GABARAP | 8.47 × 10−86 | RPL6 | 7.61 × 10−74 | CD99 | 2.58 × 10−73 | ZFPM2 | 4.41 × 10−96 | NOP10 | 1.41 × 10−56 |
| 16 | SH3BP4 | 1.22 × 10−63 | RPL36AL | 1.60 × 10−89 | PTGIS | 1.43 × 10−76 | OAT | 7.37 × 10−85 | UROD | 2.92 × 10−73 | DPYSL2 | 4.47 × 10−73 | RPS18 | 7.65 × 10−95 | NFU1 | 1.52 × 10−56 |
| 17 | RPS14 | 1.31 × 10−63 | RPL34 | 1.98 × 10−89 | NDN | 2.18 × 10−76 | LTA4H | 1.92 × 10−84 | RPLP2 | 9.80 × 10−72 | CAMLG | 4.55 × 10−73 | ME1 | 9.97 × 10−94 | PIGP | 1.81 × 10−56 |
| 18 | FHL1 | 6.68 × 10−63 | ALDH9A1 | 2.31 × 10−89 | GFPT2 | 1.20 × 10−73 | FHL2 | 2.74 × 10−84 | RPL41 | 1.66 × 10−71 | GABARAPL2 | 5.06 × 10−73 | RPL27A | 1.68 × 10−93 | ITGB3BP | 2.15 × 10−55 |
| 19 | HUWE1 | 7.18 × 10−63 | RPL3 | 6.82 × 10−89 | VCL | 2.20 × 10−73 | UBB | 2.83 × 10−84 | RPL15 | 3.77 × 10−70 | FAU | 7.09 × 10−73 | SERPINE2 | 5.58 × 10−93 | RNF139 | 2.65 × 10−55 |
| 20 | SERPINE2 | 9.91 × 10−63 | RPL36 | 1.59 × 10−88 | AMIGO2 | 1.07 × 10−72 | RRAGA | 6.11 × 10−84 | RPS28 | 1.07 × 10−69 | SRP14 | 1.13 × 10−72 | UROD | 4.27 × 10−92 | C19orf53 | 5.82 × 10−55 |
| 21 | TACC1 | 3.81 × 10−62 | RPL30 | 2.93 × 10−88 | LXN | 4.59 × 10−72 | CD99 | 1.95 × 10−83 | UBB | 2.99 × 10−69 | ST13 | 3.83 × 10−72 | TRPC1 | 5.36 × 10−92 | SEC22B | 1.08 × 10−54 |
| 22 | LXN | 7.86 × 10−62 | RPL6 | 9.56 × 10−88 | MEIS2 | 3.01 × 10−71 | RPS24 | 3.55 × 10−83 | RPS27A | 8.25 × 10−69 | TCEAL4 | 5.30 × 10−72 | AMIGO2 | 7.52 × 10−92 | DDIT3 | 2.08 × 10−54 |
| 23 | IL6ST | 1.08 × 10−61 | RPL32 | 1.05 × 10−86 | CRIM1 | 7.32 × 10−70 | ST13 | 3.57 × 10−83 | RPL10A | 9.99 × 10−69 | HTRA1 | 9.66 × 10−72 | ERH | 1.00 × 10−91 | NOSIP | 8.18 × 10−54 |
| 24 | ZFPM2 | 6.36 × 10−61 | RPL31 | 3.52 × 10−86 | TACC1 | 1.50 × 10−69 | SEC31A | 5.38 × 10−83 | RPS27 | 1.85 × 10−68 | NDUFA4 | 9.80 × 10−72 | DAPK1 | 2.40 × 10−91 | ELP4 | 1.23 × 10−53 |
| 25 | VAPA | 5.06 × 10−60 | RPS16 | 5.06 × 10−86 | ZFP36L1 | 3.10 × 10−69 | DPYSL2 | 1.33 × 10−82 | NDN | 2.75 × 10−68 | FTO | 1.31 × 10−71 | PMP22 | 5.50 × 10−90 | ATP5G1 | 1.33 × 10−53 |
| 26 | MEIS2 | 9.44 × 10−60 | TPT1 | 6.28 × 10−86 | SGCE | 1.02 × 10−68 | YPEL5 | 2.76 × 10−82 | RPS18 | 2.91 × 10−68 | RPS24 | 1.71 × 10−71 | VCL | 1.15 × 10−89 | C14orf1 | 5.69 × 10−53 |
| 27 | C1S | 3.56 × 10−59 | ACTG1 | 8.08 × 10−86 | IGFBP6 | 1.69 × 10−68 | FAU | 3.91 × 10−82 | ZFAND5 | 1.68 × 10−67 | GABARAP | 3.74 × 10−71 | DIRAS3 | 1.56 × 10−89 | SDC4 | 4.24 × 10−52 |
| 28 | BAMBI | 6.54 × 10−59 | SNX3 | 9.76 × 10−86 | ZFPM2 | 2.99 × 10−68 | RPS27L | 7.11 × 10−82 | RPL27A | 1.83 × 10−67 | REEP5 | 9.51 × 10−71 | PRKCDBP | 6.25 × 10−89 | PDCD10 | 8.22 × 10−52 |
| 29 | CDH11 | 8.97 × 10−59 | CCNI | 1.18 × 10−85 | SERPINE2 | 6.46 × 10−68 | CAMLG | 2.19 × 10−81 | AMIGO2 | 3.98 × 10−66 | GNB2L1 | 3.48 × 10−69 | PDGFD | 1.10 × 10−88 | CCDC25 | 1.87 × 10−51 |
| 30 | PDGFRA | 4.98 × 10−58 | RPL13A | 4.88 × 10−85 | GSTM3 | 1.76 × 10−67 | RPL10A | 5.37 × 10−81 | PTGIS | 1.35 × 10−64 | LTA4H | 3.48 × 10−69 | CLIP4 | 1.39 × 10−88 | NOC3L | 3.10 × 10−51 |
| 31 | CYBRD1 | 1.07 × 10−57 | RPS20 | 2.26 × 10−84 | PDGFRA | 7.06 × 10−67 | DSTN | 1.02 × 10−80 | C1S | 1.02 × 10−63 | ERH | 5.04 × 10−69 | RPL23 | 1.39 × 10−88 | SDHD | 4.27 × 10−51 |
| 32 | IGFBP6 | 2.72 × 10−57 | BTF3 | 2.72 × 10−84 | PLSCR4 | 7.22 × 10−67 | RPL15 | 1.02 × 10−80 | GFPT2 | 4.97 × 10−63 | TMSB4X | 4.82 × 10−68 | PLS3 | 2.25 × 10−88 | FAM96B | 4.47 × 10−51 |
| 33 | ZMIZ1 | 3.24 × 10−57 | COX7C | 4.34 × 10−84 | CYBRD1 | 1.44 × 10−66 | RPS18 | 1.82 × 10−80 | VCL | 5.06 × 10−63 | HNRNPK | 4.82 × 10−68 | PAPSS2 | 5.82 × 10−88 | DCTPP1 | 8.65 × 10−51 |
| 34 | 7−Sep | 3.73 × 10−57 | RPS12 | 5.08 × 10−84 | ARMCX1 | 3.81 × 10−66 | GABARAPL2 | 1.88 × 10−80 | SGCE | 5.98 × 10−63 | CRTAP | 1.22 × 10−67 | ST3GAL5 | 1.39 × 10−87 | MRPS35 | 1.26 × 10−50 |
| 35 | PLSCR4 | 1.04 × 10−56 | SRP14 | 6.84 × 10−84 | DAPK1 | 9.42 × 10−66 | ANXA5 | 3.65 × 10−80 | ATP5A1 | 3.58 × 10−62 | PALLD | 1.75 × 10−67 | CAMLG | 8.01 × 10−86 | PPP1CB | 1.46 × 10−50 |
| 36 | CAPN2 | 2.02 × 10−56 | RPL41 | 1.45 × 10−83 | ZCCHC24 | 1.10 × 10−65 | ERH | 4.10 × 10−80 | ZFP36L1 | 5.62 × 10−62 | TMSB10 | 1.88 × 10−67 | CALB2 | 2.38 × 10−85 | ATIC | 1.88 × 10−50 |
| 37 | FLRT2 | 5.76 × 10−56 | CAMLG | 1.84 × 10−83 | AOX1 | 1.15 × 10−65 | TCEAL4 | 4.44 × 10−80 | BNIP3 | 1.95 × 10−61 | LEPROT | 1.74 × 10−66 | HOXC6 | 6.53 × 10−85 | MRPS33 | 3.69 × 10−50 |
| 38 | GFPT2 | 8.87 × 10−56 | FAU | 2.07 × 10−83 | DDR2 | 2.29 × 10−65 | HTRA1 | 5.70 × 10−80 | BAMBI | 4.34 × 10−61 | MORF4L1 | 2.29 × 10−66 | NT5E | 1.07 × 10−84 | RAB32 | 4.09 × 10−50 |
| 39 | DDR2 | 1.19 × 10−55 | ATP5L | 2.53 × 10−83 | IFFO1 | 4.57 × 10−65 | TMSB4X | 1.69 × 10−79 | SERPINE2 | 2.87 × 10−60 | ADH5 | 2.72 × 10−66 | LXN | 3.09 × 10−84 | MYL6B | 4.23 × 10−50 |
| 40 | RGL1 | 1.89 × 10−55 | RPS4X | 6.11 × 10−83 | FLRT2 | 5.39 × 10−65 | REEP5 | 1.99 × 10−79 | TUBA1A | 4.49 × 10−60 | UBA52 | 4.35 × 10−66 | GALC | 4.12 × 10−84 | EIF2S1 | 4.48 × 10−50 |
| 41 | DAB2 | 4.93 × 10−55 | RPSA | 9.43 × 10−83 | PAPSS2 | 1.43 × 10−64 | RPS27 | 2.52 × 10−79 | RGL1 | 2.40 × 10−59 | PNRC2 | 4.35 × 10−66 | SGK1 | 4.67 × 10−84 | SGCB | 5.45 × 10−50 |
| 42 | NR3C1 | 7.53 × 10−55 | GNB2L1 | 9.98 × 10−83 | PRKCDBP | 1.59 × 10−64 | UBA52 | 3.26 × 10−79 | CCT8 | 4.12 × 10−59 | EID1 | 5.10 × 10−66 | ALDH1A3 | 7.40 × 10−84 | SNAPC5 | 5.62 × 10−50 |
| 43 | ZCCHC24 | 7.58 × 10−55 | ATP6V0E1 | 1.35 × 10−82 | PROS1 | 1.62 × 10−64 | NPTN | 3.81 × 10−79 | CYBRD1 | 7.82 × 10−59 | NPTN | 5.13 × 10−66 | PLSCR4 | 9.27 × 10−84 | ZZZ3 | 1.37 × 10−49 |
| 44 | PROS1 | 1.57 × 10−54 | RPL18 | 1.91 × 10−82 | FZD7 | 1.87 × 10−64 | RPL27A | 1.30 × 10−78 | ZFPM2 | 1.02 × 10−58 | RPS26 | 6.74 × 10−66 | VGLL3 | 2.60 × 10−83 | PSMB3 | 1.99 × 10−49 |
| 45 | FSTL1 | 2.49 × 10−54 | RPS24 | 3.78 × 10−82 | IGFBP5 | 8.03 × 10−64 | TMSB10 | 2.07 × 10−78 | PLSCR4 | 1.89 × 10−58 | SLC25A3 | 1.77 × 10−65 | COX7A2 | 2.94 × 10−83 | CISD1 | 2.63 × 10−49 |
| 46 | MYLK | 2.80 × 10−54 | EEF1G | 1.88 × 10−81 | RGS2 | 1.71 × 10−63 | SLC25A3 | 2.80 × 10−78 | DYRK1A | 4.52 × 10−58 | EIF3E | 1.81 × 10−65 | ALDH9A1 | 5.65 × 10−83 | RTN3 | 2.71 × 10−49 |
| 47 | ARMCX1 | 3.45 × 10−54 | RRAGA | 6.51 × 10−81 | TSPAN5 | 1.73 × 10−63 | HNRNPK | 7.96 × 10−78 | FZD7 | 5.61 × 10−58 | TAX1BP3 | 5.34 × 10−65 | FHL2 | 6.12 × 10−82 | TMED3 | 3.49 × 10−49 |
| 48 | FZD7 | 4.01 × 10−54 | RPL35A | 1.11 × 10−80 | BAMBI | 1.81 × 10−63 | GNB2L1 | 9.58 × 10−78 | CAPN2 | 6.35 × 10−58 | LDHA | 6.73 × 10−65 | CYBRD1 | 7.23 × 10−82 | CCDC59 | 6.01 × 10−49 |
| 49 | IGFBP5 | 6.73 × 10−54 | RPS17 | 2.28 × 10−80 | CLIP4 | 1.15 × 10−62 | MYL6 | 1.30 × 10−77 | FLRT2 | 7.64 × 10−58 | MYL6 | 7.78 × 10−65 | SEMA3C | 1.20 × 10−81 | POLR2L | 6.23 × 10−49 |
| 50 | GAS1 | 9.23 × 10−54 | CIRBP | 2.72 × 10−80 | HOXC6 | 3.29 × 10−62 | FTO | 1.54 × 10−77 | IGFBP6 | 1.30 × 10−57 | HSP90AA1 | 8.80 × 10−65 | ATP10D | 3.70 × 10−81 | FAM53C | 8.50 × 10−49 |
| 51 | SEMA3C | 9.50 × 10−54 | TMSB4X | 3.69 × 10−80 | TGFB1I1 | 3.77 × 10−62 | RPS26 | 1.74 × 10−77 | ARMCX1 | 2.18 × 10−57 | KLHDC2 | 9.40 × 10−65 | DPYSL2 | 3.70 × 10−81 | GOLPH3L | 9.76 × 10−49 |
| 52 | TXNRD1 | 1.12 × 10−53 | RPL10A | 6.66 × 10−80 | OPTN | 4.04 × 10−62 | NDUFA4 | 3.72 × 10−77 | TSPAN5 | 2.64 × 10−57 | ISCU | 1.04 × 10−64 | FOXO1 | 4.60 × 10−81 | NDUFA13 | 1.14 × 10−48 |
| 53 | RNASE4 | 1.60 × 10−53 | FHL2 | 7.39 × 10−80 | APPBP2 | 8.30 × 10−62 | HSP90AA1 | 3.93 × 10−77 | SDC2 | 2.86 × 10−57 | PDLIM1 | 2.09 × 10−64 | DSTN | 8.10 × 10−81 | DUSP22 | 1.27 × 10−48 |
| 54 | TSPAN5 | 1.76 × 10−53 | ANXA5 | 1.04 × 10−79 | ST3GAL5 | 1.31 × 10−61 | EIF3E | 5.34 × 10−77 | SEMA3C | 3.16 × 10−57 | SPCS1 | 2.52 × 10−64 | TIMP2 | 2.78 × 10−80 | BET1 | 1.32 × 10−48 |
| 55 | CFH | 2.76 × 10−53 | NDUFA4 | 2.66 × 10−79 | CLDN11 | 1.79 × 10−61 | ADH5 | 7.61 × 10−77 | DDR2 | 5.10 × 10−57 | SPARC | 4.80 × 10−64 | ANXA5 | 3.30 × 10−80 | SEH1L | 1.35 × 10−48 |
| 56 | ALCAM | 5.43 × 10−53 | SGK1 | 3.86 × 10−79 | FBN1 | 5.06 × 10−61 | SPCS1 | 9.99 × 10−77 | ZCCHC24 | 6.92 × 10−57 | LXN | 5.79 × 10−64 | DNAJB9 | 8.77 × 10−80 | AMD1 | 1.46 × 10−48 |
| 57 | PRKCDBP | 1.19 × 10−52 | EEF1A1 | 4.61 × 10−79 | TCEAL2 | 1.17 × 10−60 | MORF4L1 | 1.87 × 10−76 | IGFBP5 | 9.53 × 10−57 | ATF4 | 7.07 × 10−64 | GHR | 9.71 × 10−80 | RALB | 1.66 × 10−48 |
| 58 | CLIP4 | 2.90 × 10−52 | RPS27 | 6.26 × 10−79 | HEG1 | 2.94 × 10−60 | MTCH1 | 2.18 × 10−76 | PRKCDBP | 3.43 × 10−56 | UXT | 7.96 × 10−64 | HTRA1 | 1.43 × 10−79 | PLEKHA1 | 2.10 × 10−48 |
| 59 | ANTXR1 | 3.16 × 10−52 | OAT | 1.18 × 10−78 | RBPMS | 6.53 × 10−60 | RPS27A | 2.98 × 10−76 | IFFO1 | 1.12 × 10−55 | SEPW1 | 8.64 × 10−64 | SDC2 | 1.81 × 10−79 | KIAA1598 | 2.21 × 10−48 |
| 60 | GALC | 3.85 × 10−52 | YPEL5 | 2.06 × 10−78 | AKT3 | 7.43 × 10−60 | SEC11A | 3.00 × 10−76 | SPOCK1 | 2.09 × 10−55 | COX7A2 | 1.60 × 10−63 | COX6C | 2.02 × 10−79 | GGCT | 2.51 × 10−48 |
| 61 | EMP3 | 4.13 × 10−52 | FTL | 2.31 × 10−78 | SPOCK1 | 9.65 × 10−60 | LDHA | 3.43 × 10−76 | CFH | 3.82 × 10−55 | BTG1 | 1.61 × 10−63 | FTO | 2.75 × 10−79 | MAGOH | 3.31 × 10−48 |
| 62 | IFFO1 | 6.17 × 10−52 | RPS6 | 2.52 × 10−78 | CFH | 1.72 × 10−59 | FTH1 | 7.91 × 10−76 | STAT2 | 7.79 × 10−55 | PGM1 | 1.68 × 10−63 | NDUFA1 | 3.17 × 10−79 | TBPL1 | 3.54 × 10−48 |
| 63 | HOXC6 | 8.97 × 10−52 | RPS18 | 1.35 × 10−77 | RAB8B | 7.02 × 10−59 | ISCU | 1.02 × 10−75 | CLIC4 | 9.47 × 10−55 | COX6C | 2.69 × 10−63 | IKBKAP | 3.31 × 10−79 | TSPAN31 | 3.79 × 10−48 |
| 64 | SPOCK1 | 1.39 × 10−51 | RPL27A | 1.61 × 10−77 | BNC2 | 1.21 × 10−58 | EID1 | 1.46 × 10−75 | ANTXR1 | 1.22 × 10−54 | UQCRQ | 3.22 × 10−63 | LRRC49 | 4.20 × 10−79 | BTN3A2 | 5.37 × 10−48 |
| 65 | AOX1 | 2.07 × 10−51 | RPS27A | 1.68 × 10−77 | GLT8D2 | 1.95 × 10−58 | TAX1BP3 | 1.69 × 10−75 | GALC | 1.43 × 10−54 | FTH1 | 3.25 × 10−63 | TCF21 | 8.18 × 10−79 | MEA1 | 6.93 × 10−48 |
| 66 | B3GNT1 | 2.28 × 10−51 | UBC | 1.68 × 10−77 | PDGFD | 2.76 × 10−58 | COX7A2 | 3.20 × 10−75 | ZMIZ1 | 1.55 × 10−54 | NPC2 | 3.31 × 10−63 | AFF1 | 9.76 × 10−79 | NUP37 | 8.14 × 10−48 |
| 67 | RGS2 | 2.28 × 10−51 | GABARAPL2 | 1.90 × 10−77 | EMP3 | 4.25 × 10−58 | CCNG1 | 4.06 × 10−75 | SERPING1 | 2.10 × 10−54 | DYNLL1 | 4.32 × 10−63 | FSTL1 | 1.62 × 10−78 | NXN | 1.07 × 10−47 |
| 68 | BNC2 | 3.57 × 10−51 | LTA4H | 2.69 × 10−77 | MYLK | 1.01 × 10−57 | ATF4 | 4.81 × 10−75 | PLSCR3 | 3.49 × 10−54 | RWDD1 | 5.98 × 10−63 | ADH5 | 2.40 × 10−78 | ADNP2 | 1.08 × 10−47 |
| 69 | ST3GAL5 | 8.15 × 10−51 | C6orf48 | 3.35 × 10−77 | TRPC1 | 1.35 × 10−57 | PGAM1 | 9.94 × 10−75 | CLIP4 | 4.46 × 10−54 | YWHAQ | 5.98 × 10−63 | RPL36 | 4.09 × 10−78 | EDEM1 | 1.39 × 10−47 |
| 70 | AHNAK | 9.52 × 10−51 | EIF3E | 3.47 × 10−77 | OLFML1 | 1.86 × 10−57 | PARK7 | 1.36 × 10−74 | CLDN11 | 5.46 × 10−54 | SKP1 | 8.57 × 10−63 | GBE1 | 7.94 × 10−78 | S100A6 | 1.66 × 10−47 |
| 71 | TIPARP | 9.98 × 10−51 | ST13 | 1.04 × 10−76 | COL16A1 | 2.92 × 10−57 | PGM1 | 1.91 × 10−74 | FYCO1 | 6.09 × 10−54 | CTNNAL1 | 9.54 × 10−63 | CUL3 | 8.09 × 10−78 | FIS1 | 1.69 × 10−47 |
| 72 | FBN1 | 3.72 × 10−50 | ESD | 1.25 × 10−76 | ATP10D | 6.19 × 10−57 | LEPROT | 4.87 × 10−74 | MYLK | 1.86 × 10−53 | LAMP1 | 1.09 × 10−62 | FGF2 | 2.12 × 10−77 | RAB11FIP2 | 2.00 × 10−47 |
| 73 | TCEAL2 | 5.69 × 10−50 | UBA52 | 2.38 × 10−76 | MAGEH1 | 6.93 × 10−57 | NPC2 | 6.09 × 10−74 | RNF38 | 2.24 × 10−53 | IMPDH2 | 1.30 × 10−62 | RRAGA | 2.76 × 10−77 | PPP1R8 | 2.10 × 10−47 |
| 74 | SEPP1 | 1.54 × 10−49 | MYL6 | 2.51 × 10−76 | NAP1L3 | 8.78 × 10−57 | RAC1 | 6.70 × 10−74 | ST3GAL5 | 3.61 × 10−53 | STX12 | 1.31 × 10−62 | REEP1 | 3.46 × 10−77 | NIPA2 | 2.37 × 10−47 |
| 75 | TCF7L2 | 2.39 × 10−49 | TIMP2 | 3.11 × 10−76 | CAV2 | 5.95 × 10−56 | PALLD | 8.77 × 10−74 | TGFB1I1 | 4.12 × 10−53 | NDUFA1 | 1.37 × 10−62 | HAS1 | 5.77 × 10−77 | PNPO | 2.38 × 10−47 |
| 76 | AKT3 | 2.56 × 10−49 | UBB | 4.48 × 10−76 | PDGFRL | 5.01 × 10−55 | PNRC2 | 9.95 × 10−74 | TCEAL2 | 7.67 × 10−53 | RNF11 | 1.40 × 10−62 | RPL37 | 1.03 × 10−76 | UBE2L6 | 2.77 × 10−47 |
| 77 | CLDN11 | 2.84 × 10−49 | COX6C | 5.01 × 10−76 | TGFBR2 | 5.55 × 10−55 | SKP1 | 1.64 × 10−73 | RBPMS | 7.72 × 10−53 | SEC11A | 1.45 × 10−62 | JAM3 | 1.16 × 10−76 | ENY2 | 3.05 × 10−47 |
| 78 | NFIB | 2.88 × 10−49 | TMSB10 | 7.86 × 10−76 | GPR137B | 6.65 × 10−55 | COX6C | 2.24 × 10−73 | SULF1 | 8.83 × 10−53 | LSM14A | 1.75 × 10−62 | RGL1 | 3.20 × 10−76 | RBMX2 | 3.26 × 10−47 |
| 79 | PDGFD | 3.10 × 10−49 | UROD | 7.86 × 10−76 | SULF1 | 7.43 × 10−55 | TM2D3 | 2.24 × 10−73 | AOX1 | 1.82 × 10−52 | SCARB2 | 1.89 × 10−62 | KLF2 | 4.96 × 10−76 | NME4 | 4.03 × 10−47 |
| 80 | RAB8B | 7.57 × 10−49 | PCNP | 1.79 × 10−75 | G0S2 | 7.82 × 10−55 | PSAP | 2.57 × 10−73 | FOXJ3 | 2.84 × 10−52 | TERF2IP | 1.89 × 10−62 | LDHA | 5.59 × 10−76 | TSN | 5.05 × 10−47 |
| 81 | HEG1 | 9.15 × 10−49 | DSTN | 3.82 × 10−75 | ALDH1A3 | 8.41 × 10−55 | NDUFA1 | 2.75 × 10−73 | ZNF532 | 3.61 × 10−52 | CRIM1 | 3.23 × 10−62 | RAP1B | 6.45 × 10−76 | KPNA6 | 7.18 × 10−47 |
| 82 | MAGEH1 | 4.66 × 10−48 | RPL23A | 4.49 × 10−75 | PROCR | 1.25 × 10−54 | DYNLL1 | 2.83 × 10−73 | FBN1 | 4.29 × 10−52 | RASA1 | 3.64 × 10−62 | VLDLR | 1.40 × 10−75 | COMMD8 | 8.03 × 10−47 |
| 83 | GLT8D2 | 4.95 × 10−48 | HSPA8 | 1.46 × 10−74 | ANTXR1 | 3.39 × 10−54 | CYB5R3 | 3.30 × 10−73 | HEG1 | 1.58 × 10−51 | LEPROTL1 | 4.46 × 10−62 | TFPI | 2.30 × 10−75 | ASH1L | 8.67 × 10−47 |
| 84 | NT5E | 5.68 × 10−48 | HSP90AA1 | 1.76 × 10−74 | ALDH1A2 | 3.79 × 10−54 | KLHDC2 | 5.79 × 10−73 | TNS3 | 1.99 × 10−51 | TCF25 | 4.54 × 10−62 | EHBP1 | 2.43 × 10−75 | PEX11B | 8.82 × 10−47 |
| 85 | MAST4 | 1.08 × 10−47 | ANP32B | 1.97 × 10−74 | PRKAR2B | 4.07 × 10−54 | LAMP1 | 6.47 × 10−73 | BNC2 | 3.07 × 10−51 | CCNG1 | 4.73 × 10−62 | GPR176 | 2.50 × 10−75 | MKKS | 1.13 × 10−46 |
| 86 | PTPRO | 1.13 × 10−47 | HINT1 | 3.85 × 10−74 | CBX7 | 4.38 × 10−54 | MXI1 | 7.22 × 10−73 | MAP4 | 3.93 × 10−51 | MXI1 | 5.81 × 10−62 | RPS26 | 3.55 × 10−75 | DUSP11 | 1.22 × 10−46 |
| 87 | ZBED5 | 3.98 × 10−47 | YWHAQ | 5.81 × 10−74 | MCC | 4.49 × 10−54 | ATP5J | 1.12 × 10−72 | AKT3 | 4.95 × 10−51 | PSAP | 8.88 × 10−62 | CAPN2 | 3.59 × 10−75 | ZMYND11 | 1.31 × 10−46 |
| 88 | KLF2 | 6.13 × 10−47 | EIF1 | 7.34 × 10−74 | BEX1 | 1.01 × 10−53 | RPL35 | 1.27 × 10−72 | ROBO1 | 6.39 × 10−51 | RPL35 | 9.78 × 10−62 | EMP3 | 4.30 × 10−75 | GCSH | 1.39 × 10−46 |
| 89 | OLFML1 | 7.40 × 10−47 | RAC1 | 1.06 × 10−73 | GPRASP1 | 1.21 × 10−53 | YWHAQ | 1.76 × 10−72 | ARL3 | 7.05 × 10−51 | MTCH1 | 1.06 × 10−61 | SEC11A | 4.40 × 10−75 | MED7 | 1.41 × 10−46 |
| 90 | RGS4 | 9.61 × 10−47 | RPS26 | 1.22 × 10−73 | RGS4 | 1.41 × 10−53 | UQCRQ | 1.94 × 10−72 | CTSK | 1.11 × 10−50 | RPL8 | 1.08 × 10−61 | MSRB2 | 4.95 × 10−75 | C1orf54 | 1.48 × 10−46 |
| 91 | ROBO1 | 1.00 × 10−46 | SLC25A3 | 1.33 × 10−73 | TBL1X | 1.52 × 10−53 | NEK7 | 2.39 × 10−72 | MYH10 | 1.67 × 10−50 | C14orf2 | 1.29 × 10−61 | YPEL5 | 4.98 × 10−75 | TSPO | 1.55 × 10−46 |
| 92 | BEX1 | 2.45 × 10−46 | TCEAL4 | 1.35 × 10−73 | STAT2 | 2.18 × 10−53 | RPL37 | 2.57 × 10−72 | EMP3 | 1.94 × 10−50 | ARF4 | 1.34 × 10−61 | MCC | 7.04 × 10−75 | ACVR2A | 1.62 × 10−46 |
| 93 | SULF1 | 2.81 × 10−46 | RPS2 | 1.76 × 10−73 | IKBKAP | 2.43 × 10−53 | CTNNAL1 | 3.40 × 10−72 | MAGEH1 | 2.11 × 10−50 | SH3BGRL | 1.58 × 10−61 | CAV2 | 9.72 × 10−75 | GRSF1 | 1.96 × 10−46 |
| 94 | FBXL7 | 2.96 × 10−46 | RPLP2 | 1.77 × 10−73 | NT5E | 6.01 × 10−53 | PTGES3 | 8.90 × 10−72 | SALL2 | 2.54 × 10−50 | MEIS2 | 1.60 × 10−61 | TBC1D4 | 9.72 × 10−75 | POLR2H | 2.27 × 10−46 |
| 95 | PROCR | 8.86 × 10−46 | DPYSL2 | 2.09 × 10−73 | PSD3 | 6.66 × 10−53 | UXT | 9.38 × 10−72 | RHOQ | 2.56 × 10−50 | AFF1 | 1.88 × 10−61 | SLC25A3 | 1.19 × 10−74 | THYN1 | 2.31 × 10−46 |
| 96 | ABCA8 | 9.09 × 10−46 | REEP5 | 2.23 × 10−73 | PTRF | 8.14 × 10−53 | LSM14A | 9.94 × 10−72 | BEX1 | 5.32 × 10−50 | PNMA1 | 2.20 × 10−61 | LEPROTL1 | 1.42 × 10−74 | UBE2V2 | 3.01 × 10−46 |
| 97 | SALL2 | 9.31 × 10−46 | MTCH1 | 2.59 × 10−73 | PMM1 | 1.29 × 10−52 | RPL8 | 1.09 × 10−71 | SMARCA1 | 6.06 × 10−50 | VAMP3 | 2.62 × 10−61 | APPBP2 | 1.54 × 10−74 | HMGCL | 3.30 × 10−46 |
| 98 | NAP1L3 | 9.44 × 10−46 | LEPROT | 3.68 × 10−73 | GNAI1 | 7.00 × 10−52 | ZFAND5 | 1.17 × 10−71 | LDOC1 | 1.94 × 10−49 | RPL37 | 3.27 × 10−61 | MAPRE2 | 1.69 × 10−74 | CSRP2 | 3.34 × 10−46 |
| 99 | DKK3 | 1.89 × 10−45 | UQCRQ | 4.99 × 10−73 | LAMA4 | 8.23 × 10−52 | NCOA4 | 1.33 × 10−71 | PDGFD | 2.13 × 10−49 | TIMP1 | 3.27 × 10−61 | SPCS1 | 2.22 × 10−74 | GPN3 | 3.68 × 10−46 |
| 100 | ANXA6 | 2.16 × 10−45 | SEC31A | 5.53 × 10−73 | ATP8B2 | 1.94 × 10−51 | C14orf2 | 1.58 × 10−71 | CTSF | 2.31 × 10−49 | PTGES3 | 5.14 × 10−61 | TUBA1A | 3.27 × 10−74 | YIPF1 | 3.70 × 10−46 |
© 2016 by the authors; licensee MDPI, Basel, Switzerland. This article is an open access article distributed under the terms and conditions of the Creative Commons Attribution (CC-BY) license (http://creativecommons.org/licenses/by/4.0/).
Share and Cite
Chang, C.-M.; Chuang, C.-M.; Wang, M.-L.; Yang, Y.-P.; Chuang, J.-H.; Yang, M.-J.; Yen, M.-S.; Chiou, S.-H.; Chang, C.-C. Gene Set−Based Integrative Analysis Revealing Two Distinct Functional Regulation Patterns in Four Common Subtypes of Epithelial Ovarian Cancer. Int. J. Mol. Sci. 2016, 17, 1272. https://doi.org/10.3390/ijms17081272
Chang C-M, Chuang C-M, Wang M-L, Yang Y-P, Chuang J-H, Yang M-J, Yen M-S, Chiou S-H, Chang C-C. Gene Set−Based Integrative Analysis Revealing Two Distinct Functional Regulation Patterns in Four Common Subtypes of Epithelial Ovarian Cancer. International Journal of Molecular Sciences. 2016; 17(8):1272. https://doi.org/10.3390/ijms17081272
Chicago/Turabian StyleChang, Chia-Ming, Chi-Mu Chuang, Mong-Lien Wang, Yi-Ping Yang, Jen-Hua Chuang, Ming-Jie Yang, Ming-Shyen Yen, Shih-Hwa Chiou, and Cheng-Chang Chang. 2016. "Gene Set−Based Integrative Analysis Revealing Two Distinct Functional Regulation Patterns in Four Common Subtypes of Epithelial Ovarian Cancer" International Journal of Molecular Sciences 17, no. 8: 1272. https://doi.org/10.3390/ijms17081272
APA StyleChang, C.-M., Chuang, C.-M., Wang, M.-L., Yang, Y.-P., Chuang, J.-H., Yang, M.-J., Yen, M.-S., Chiou, S.-H., & Chang, C.-C. (2016). Gene Set−Based Integrative Analysis Revealing Two Distinct Functional Regulation Patterns in Four Common Subtypes of Epithelial Ovarian Cancer. International Journal of Molecular Sciences, 17(8), 1272. https://doi.org/10.3390/ijms17081272