
A Mixture of Extracts of Kochia scoparia and Rosa multiflora with PPAR α/γ Dual Agonistic Effects Prevents Photoaging in Hairless Mice


Abstract
:
1. Introduction
2. Results
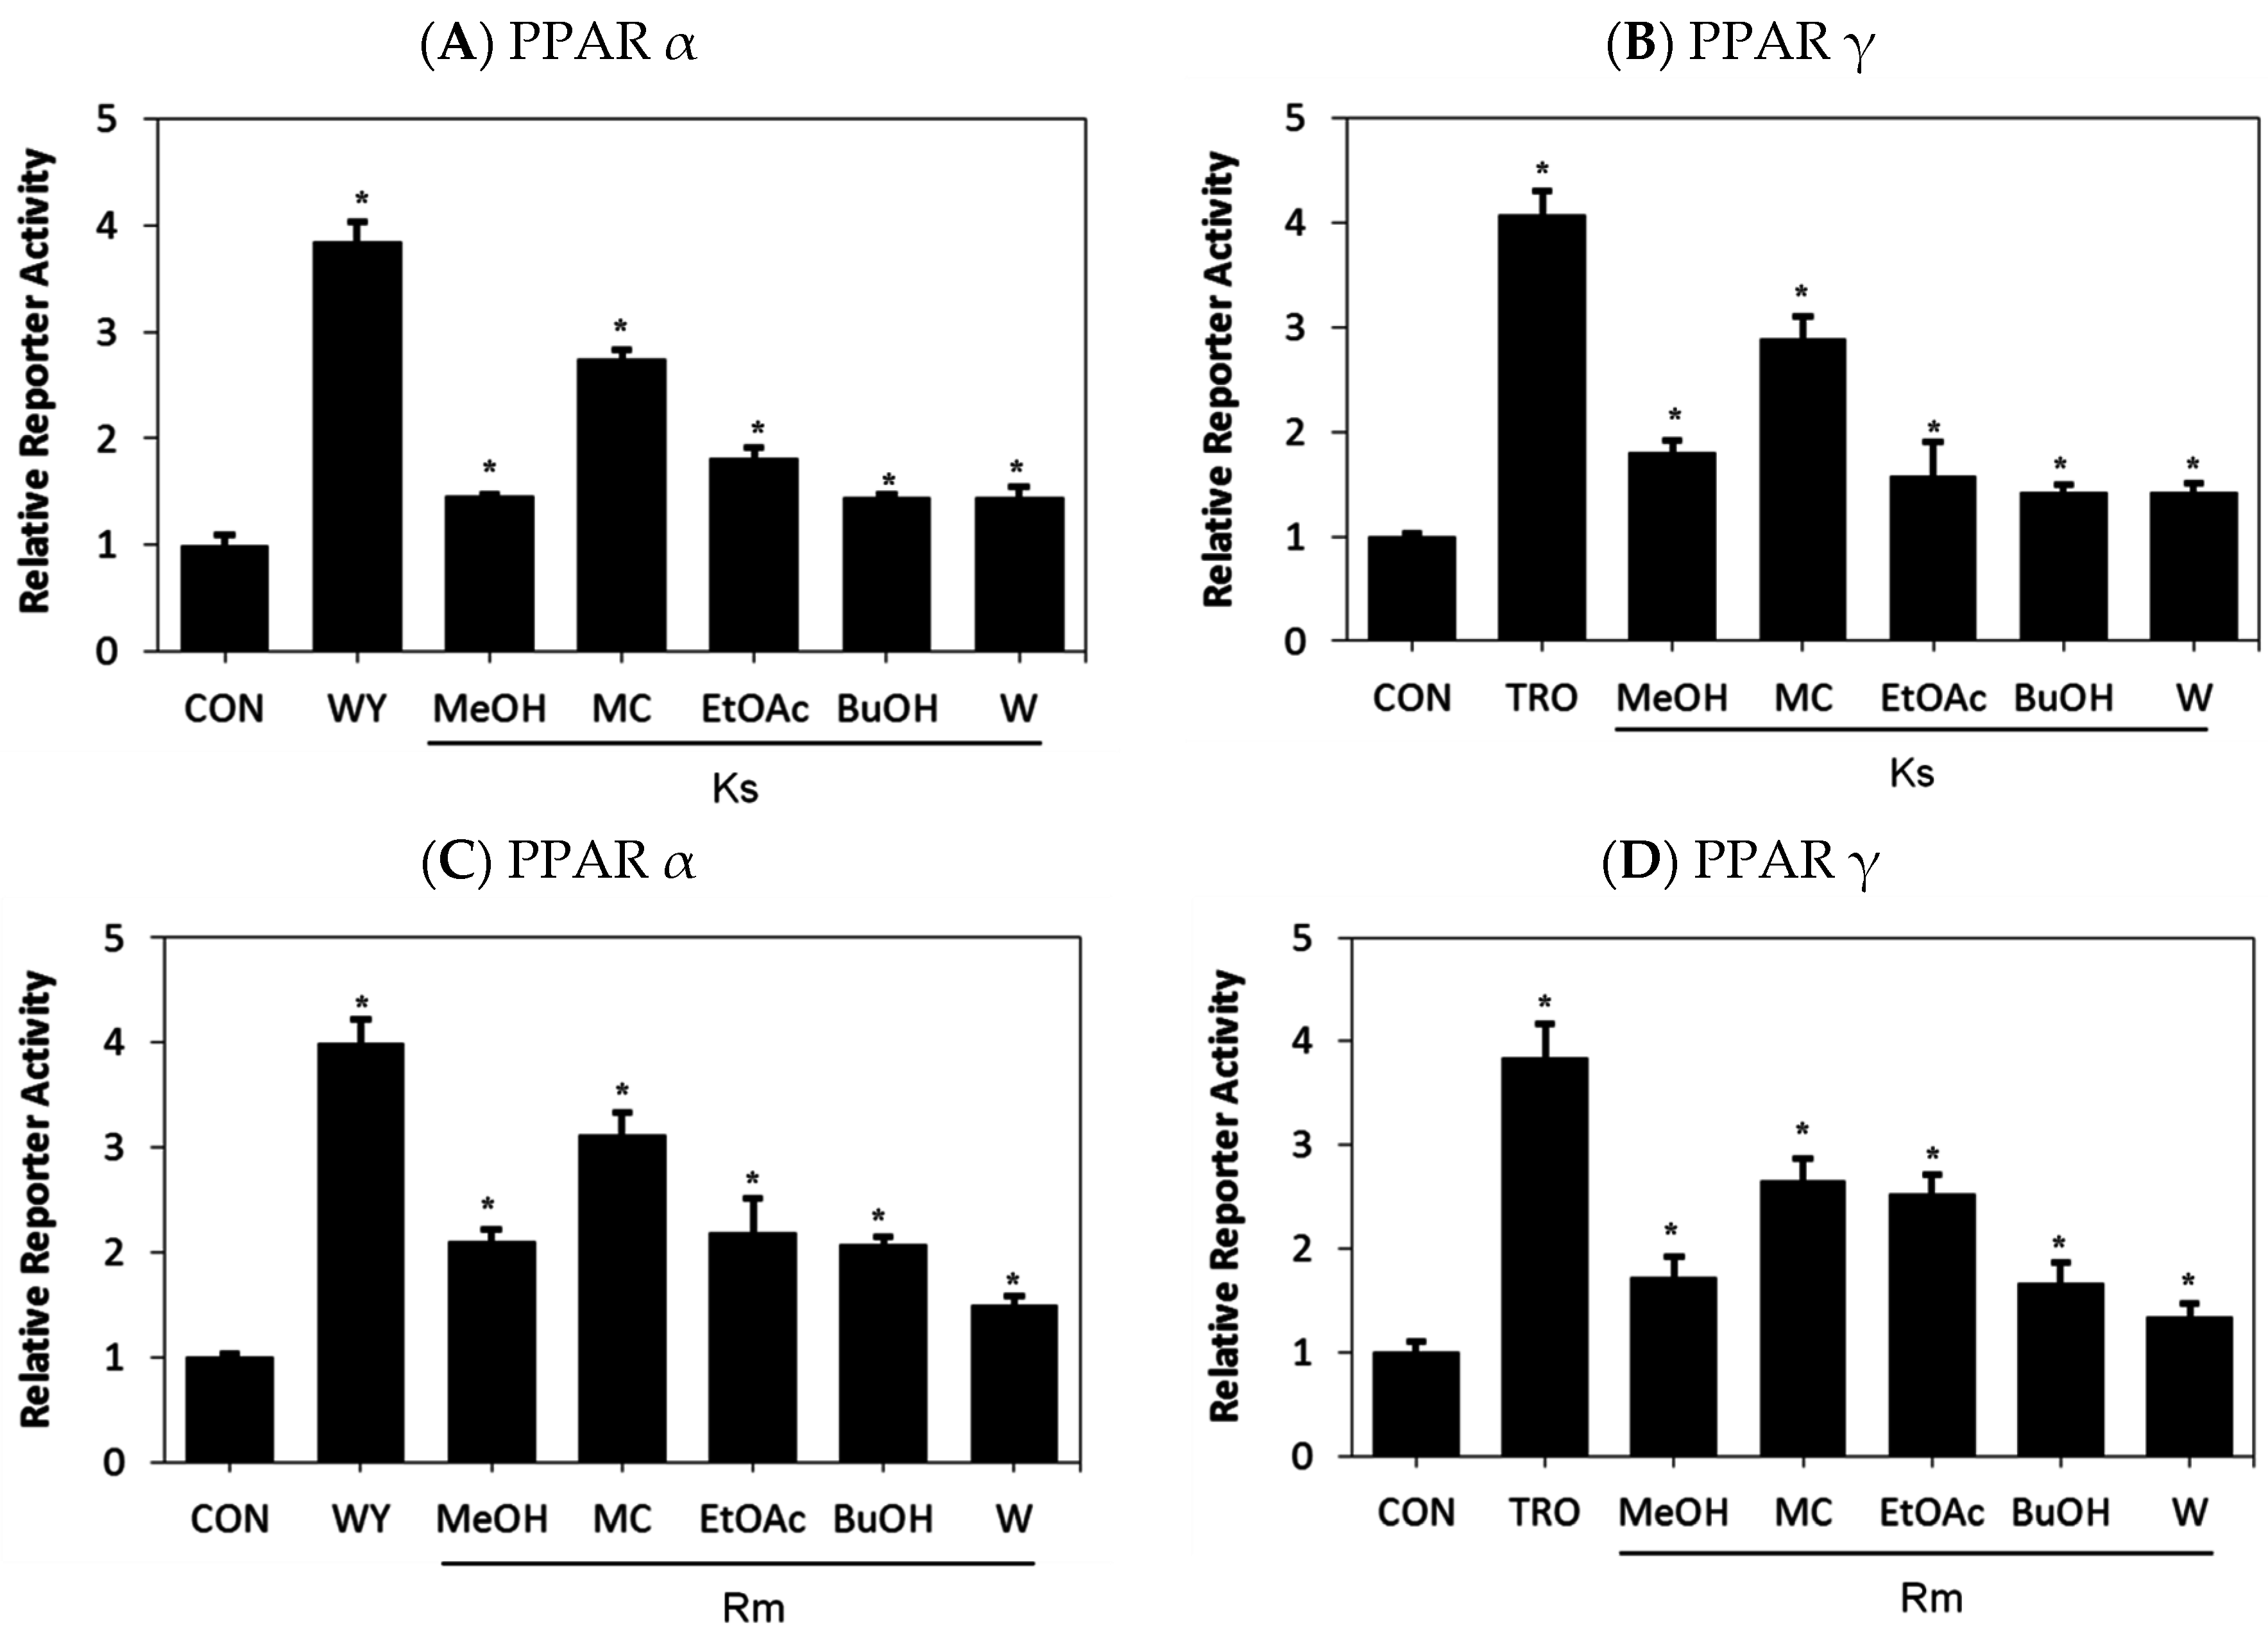
2.1. Dual Activation of PPAR α/γ Transcriptional Activity by Kochia scoparia (Ks) and Rosa multiflora (Rm)
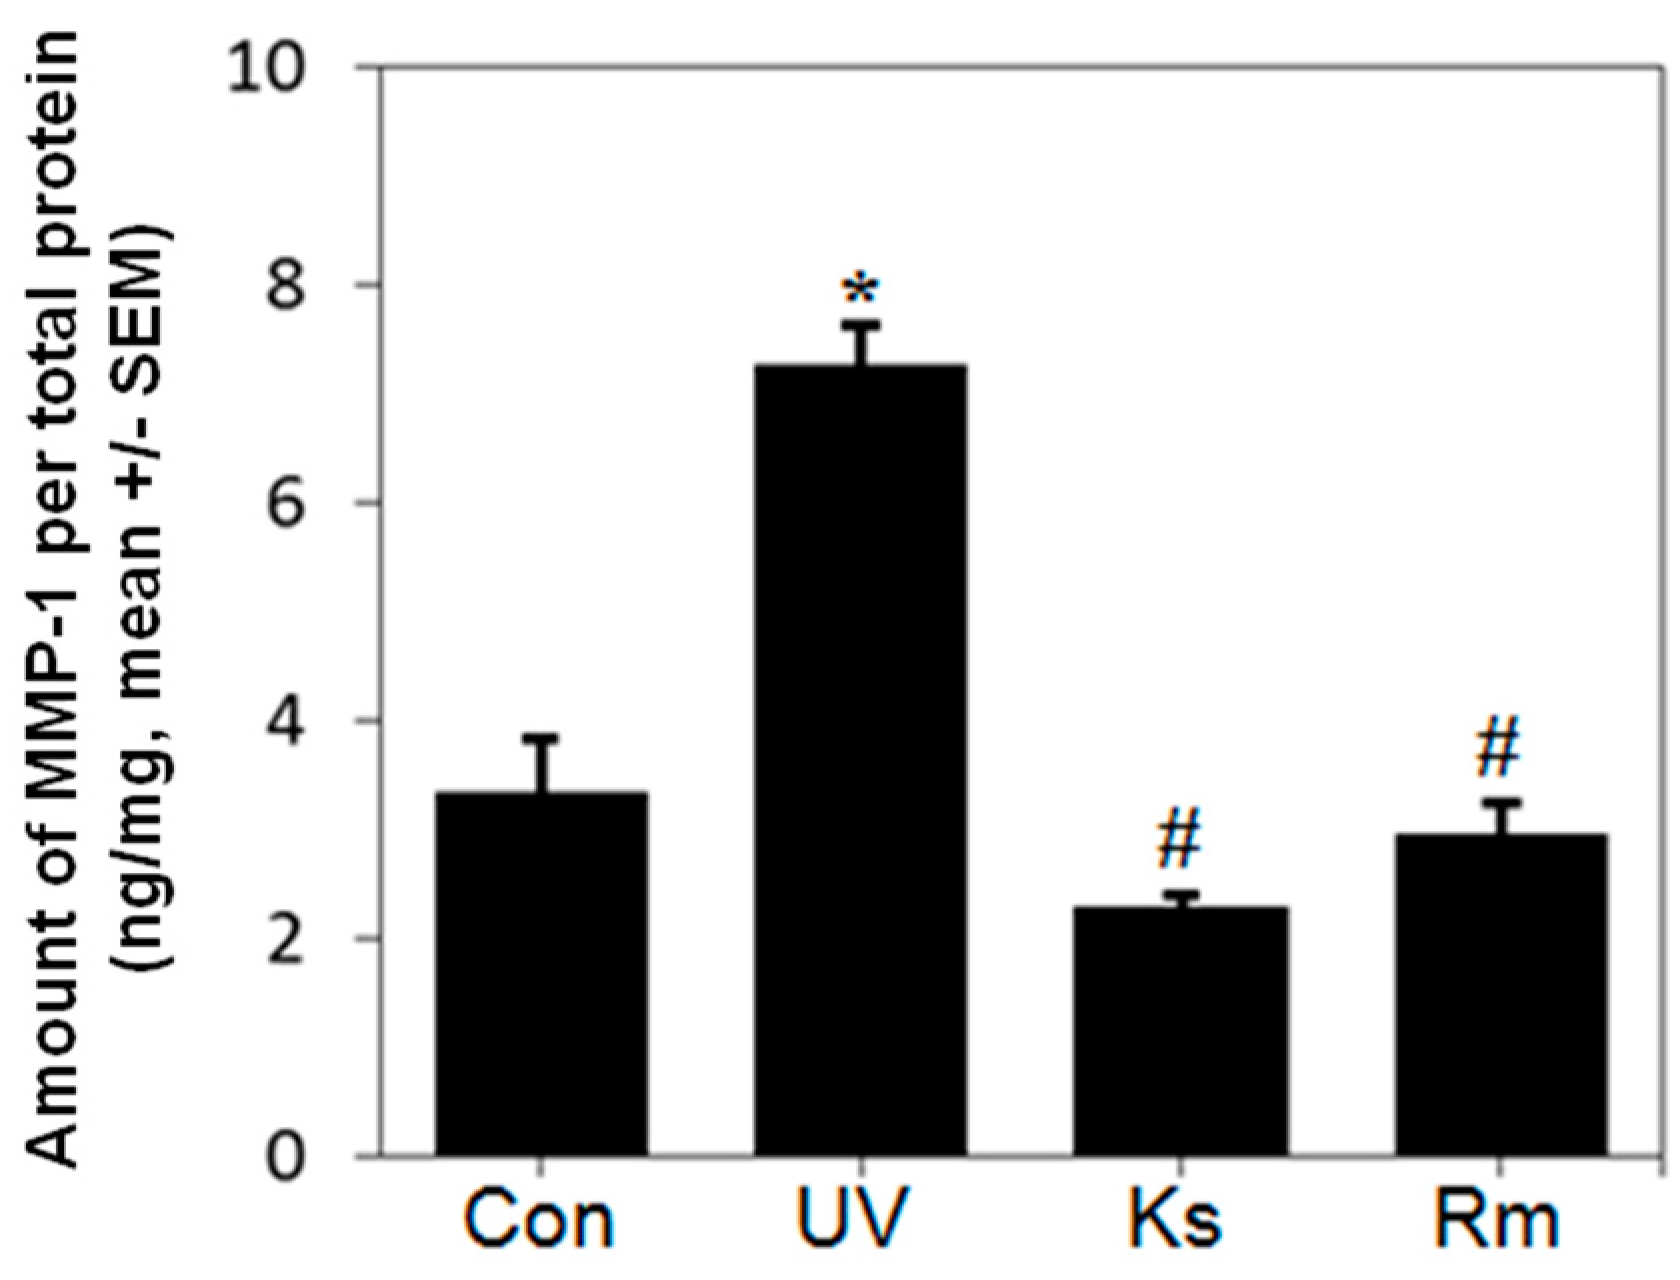
2.2. Kochia scoparia (Ks) and Rosa multiflora (Rm) Inhibit UVB-Induced MMP-1 Expression
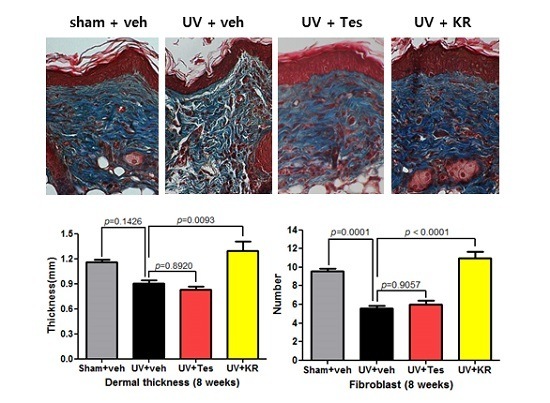
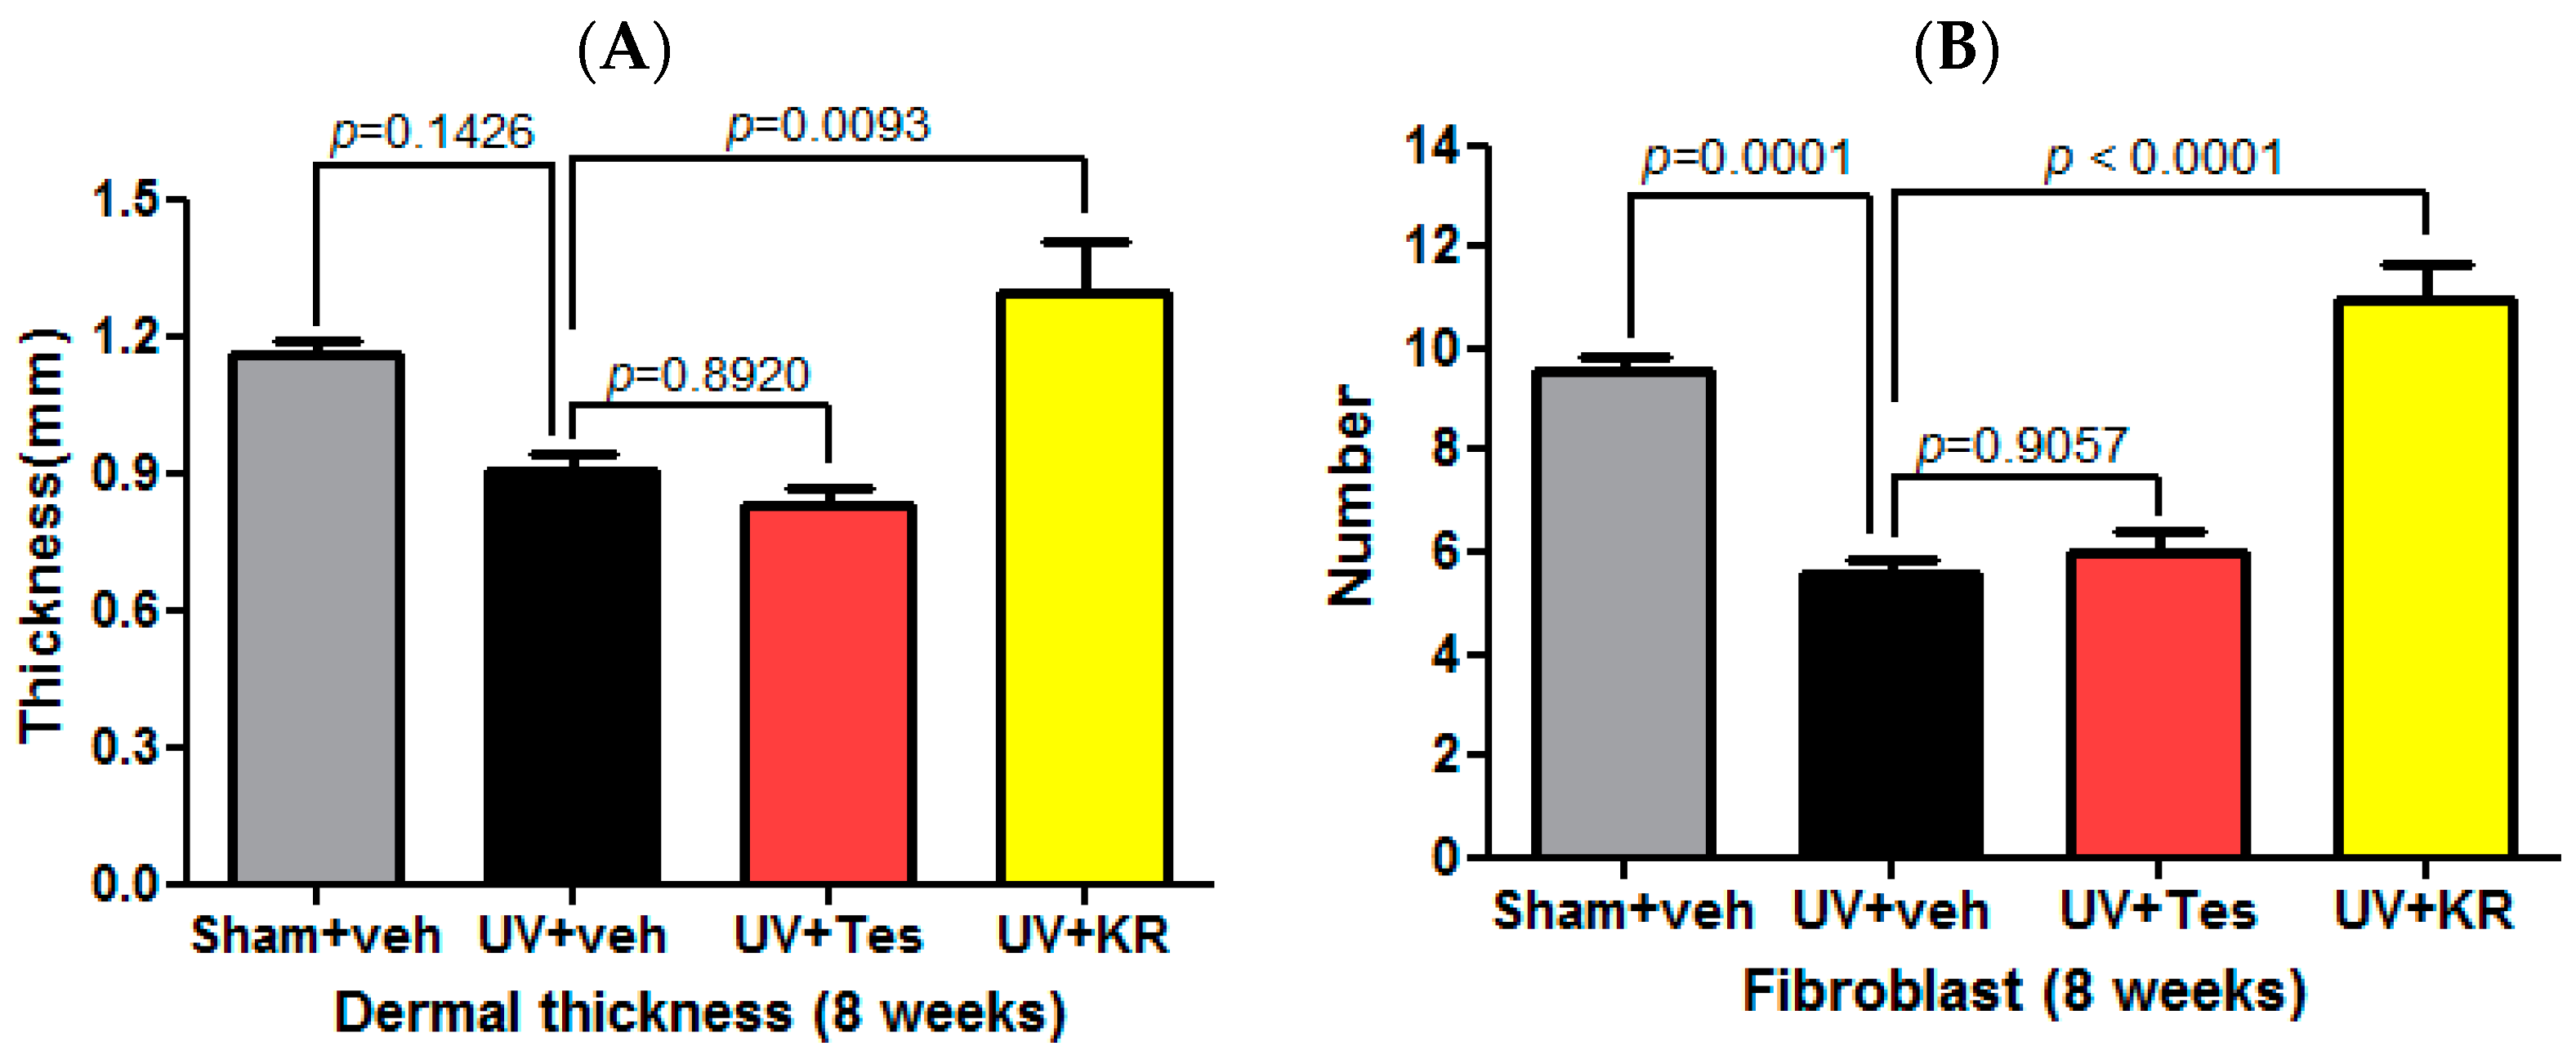
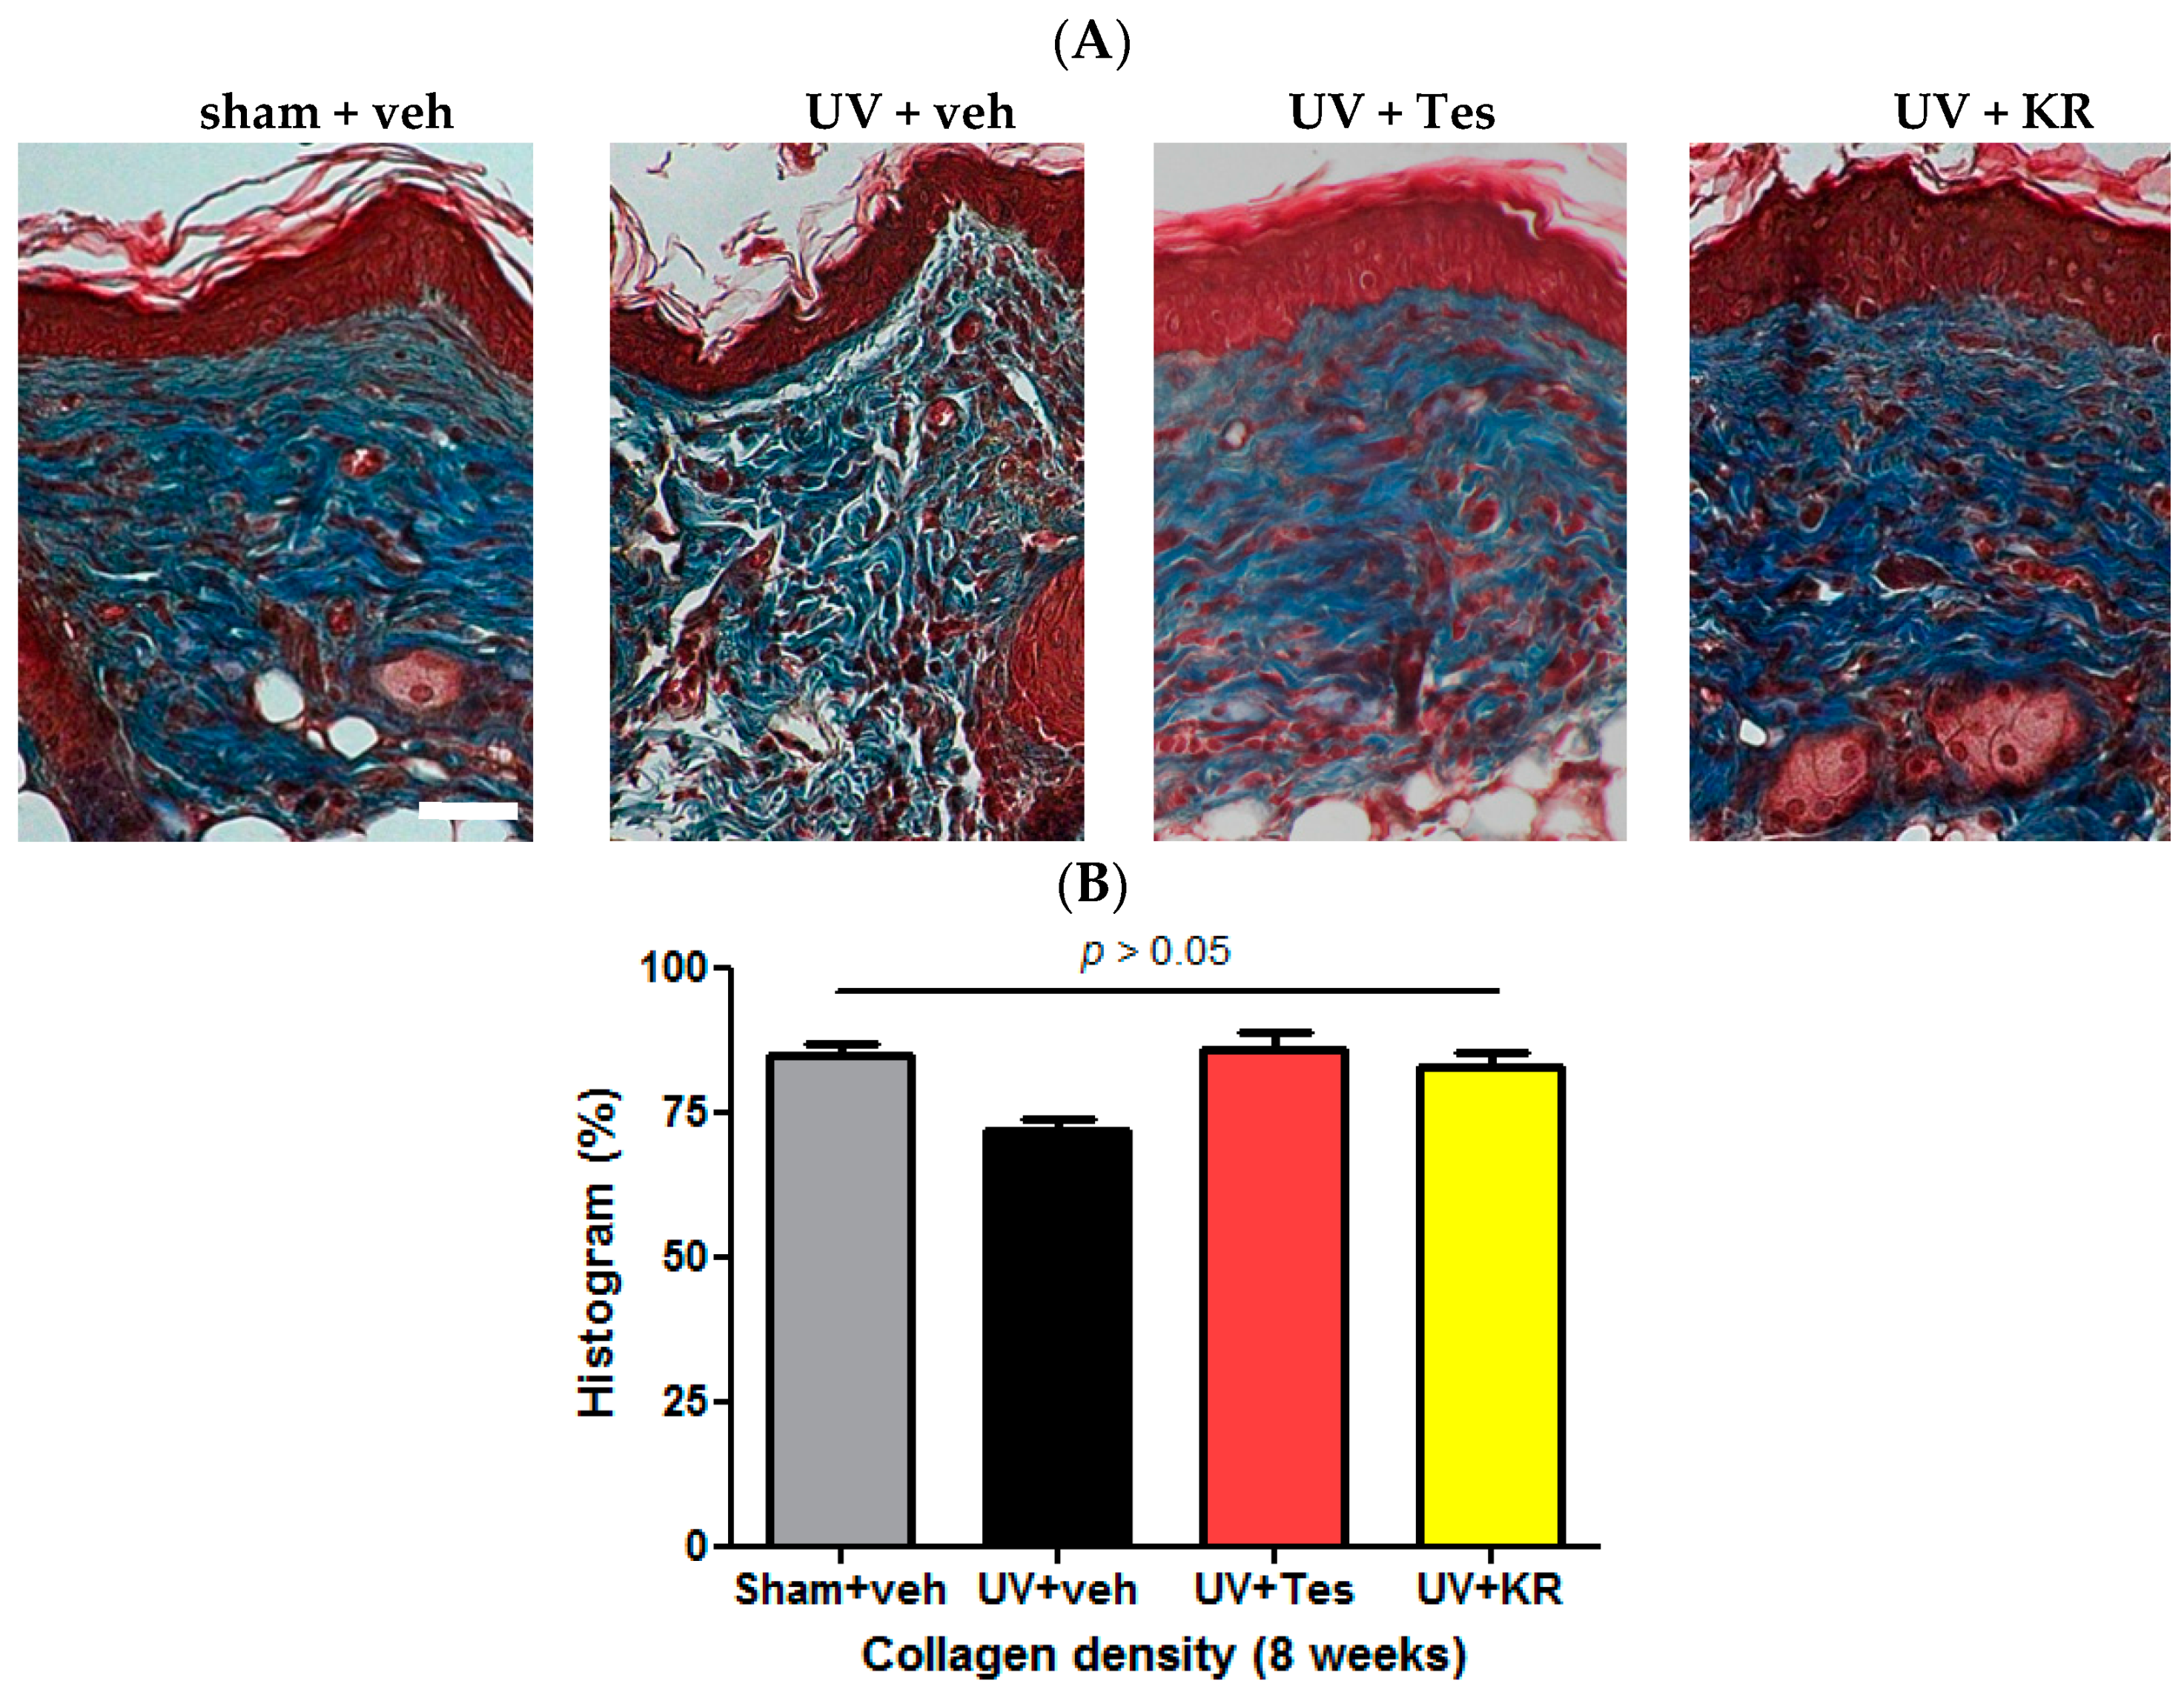
2.3. Dermal Effect of a Mixture of Extracts of Kochia scoparia and Rosa multiflora (KR) in Photoaging Murine Skin
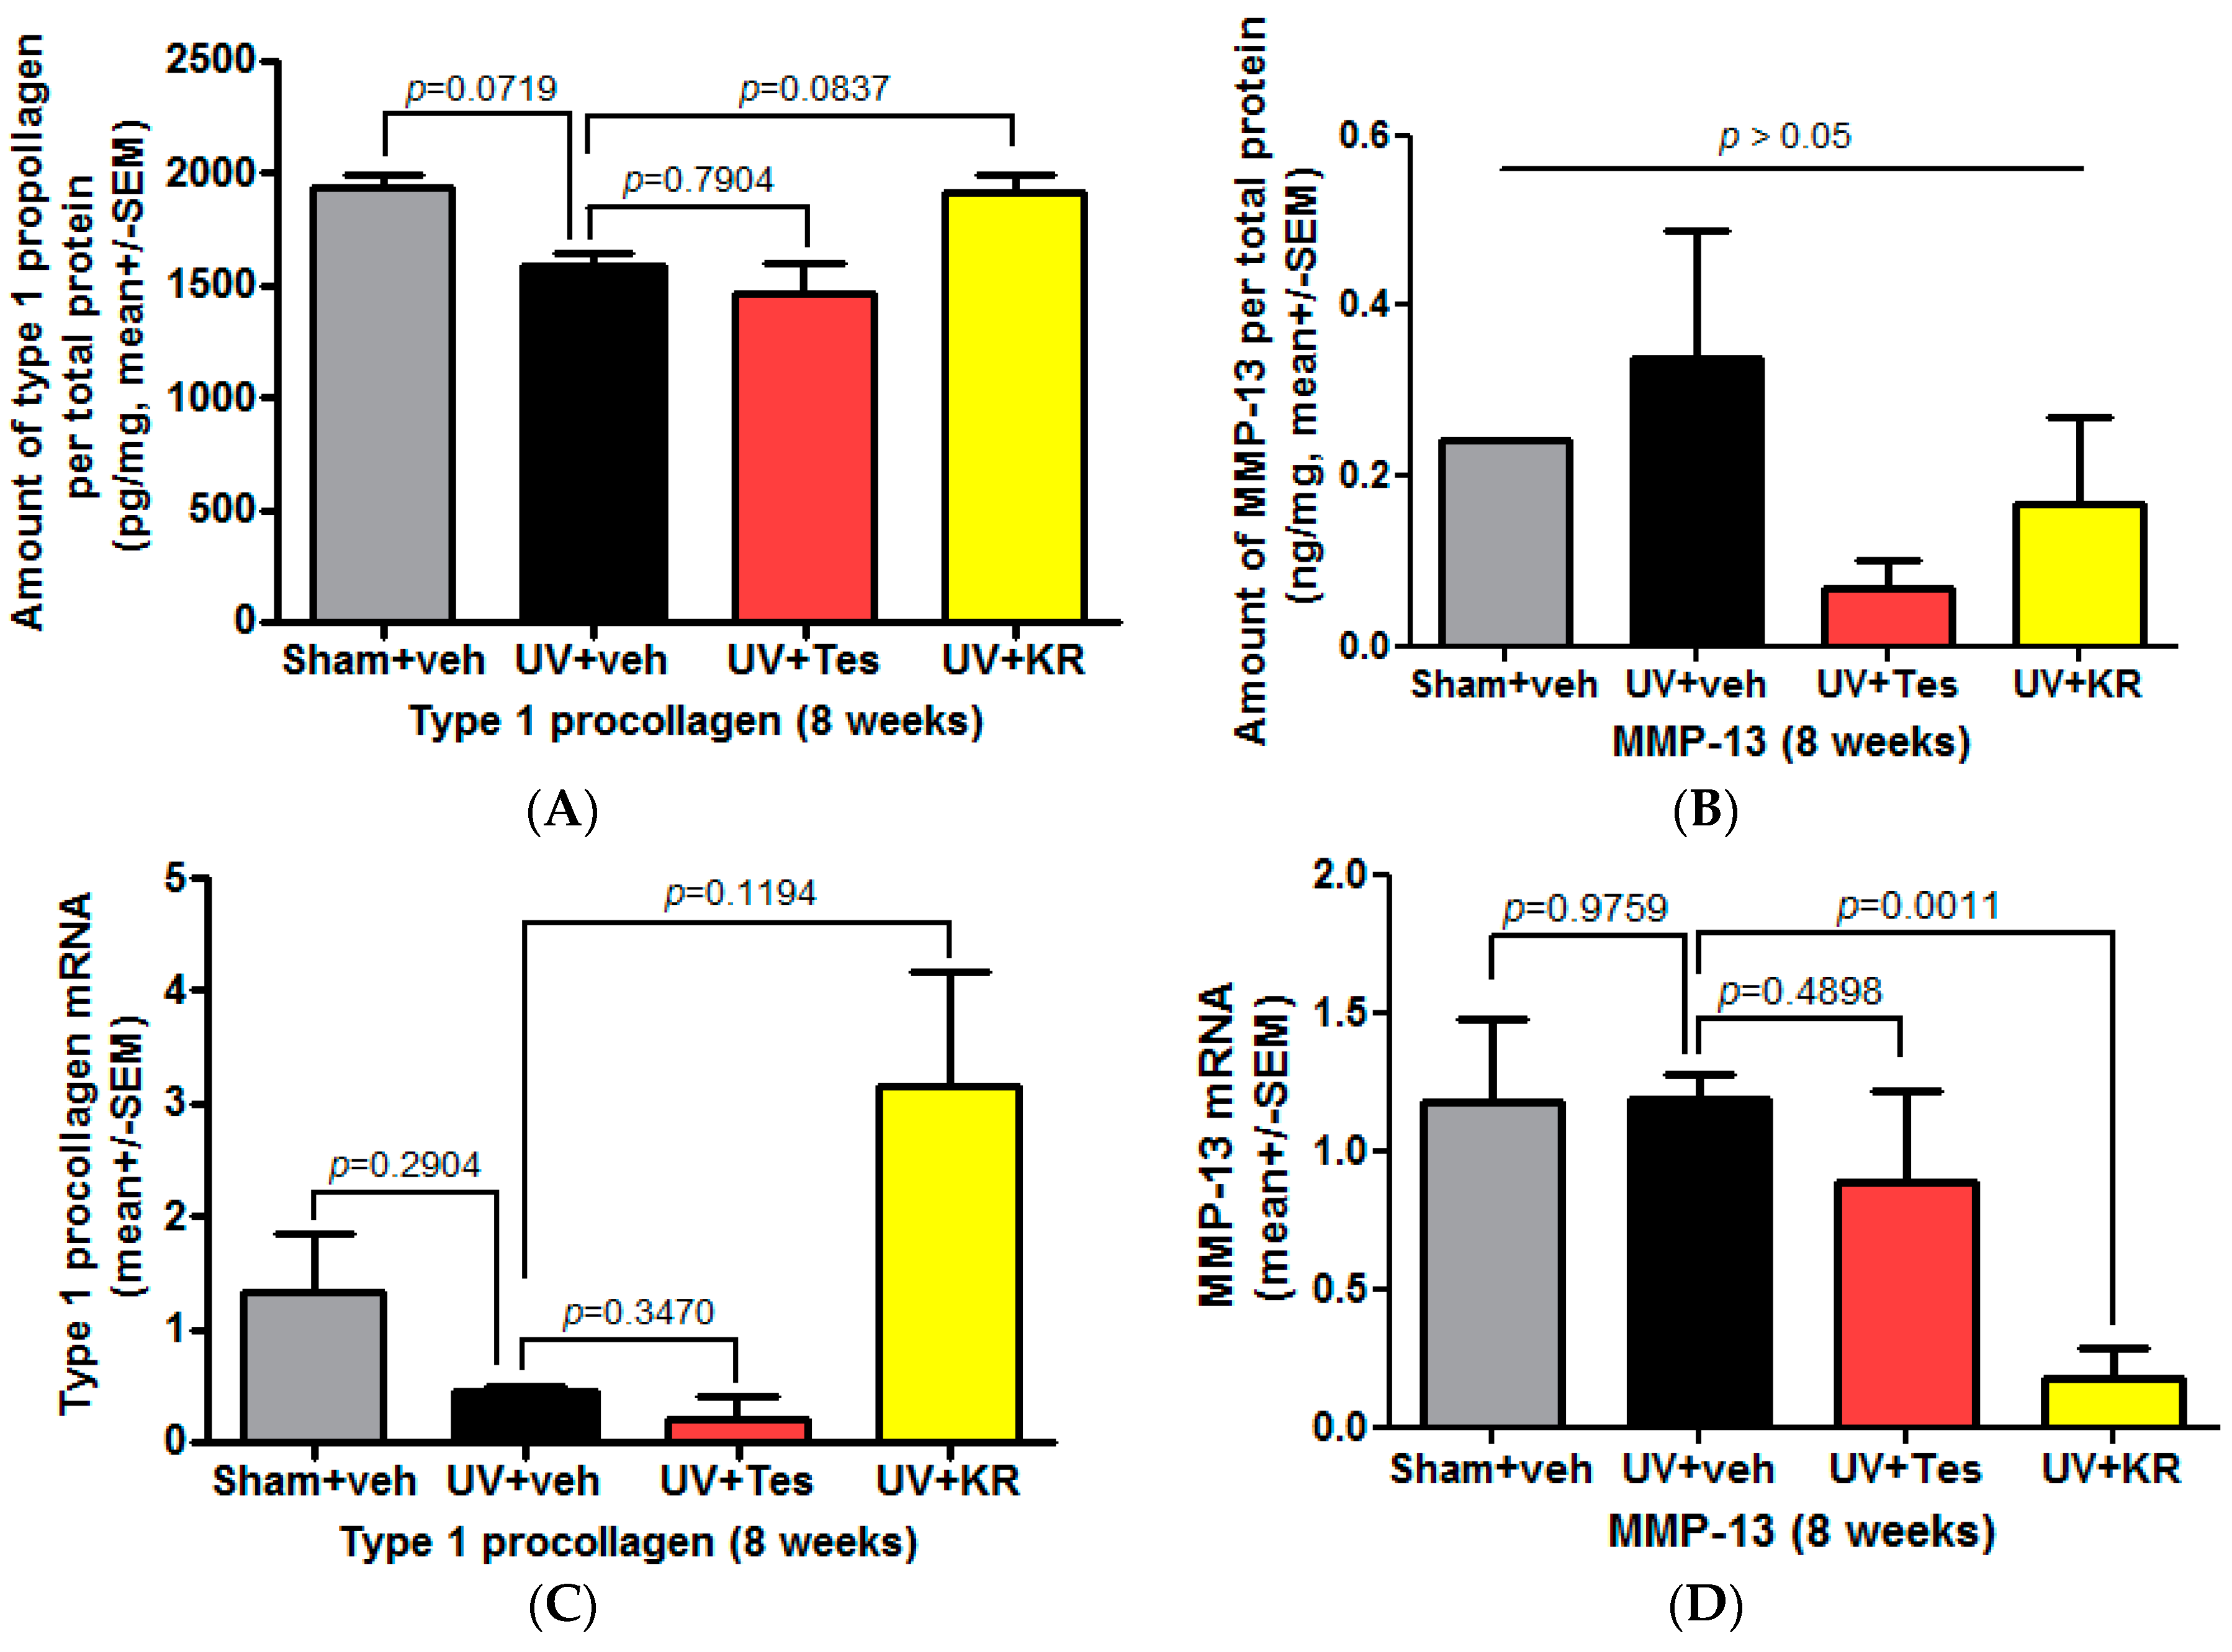
2.4. Dermal Effects of KR in Photoaging Skin Were Explained by an Increase in Procollagen 1 Expression, Induced by TGF-β, and a Decrease in MMP-13 Expression
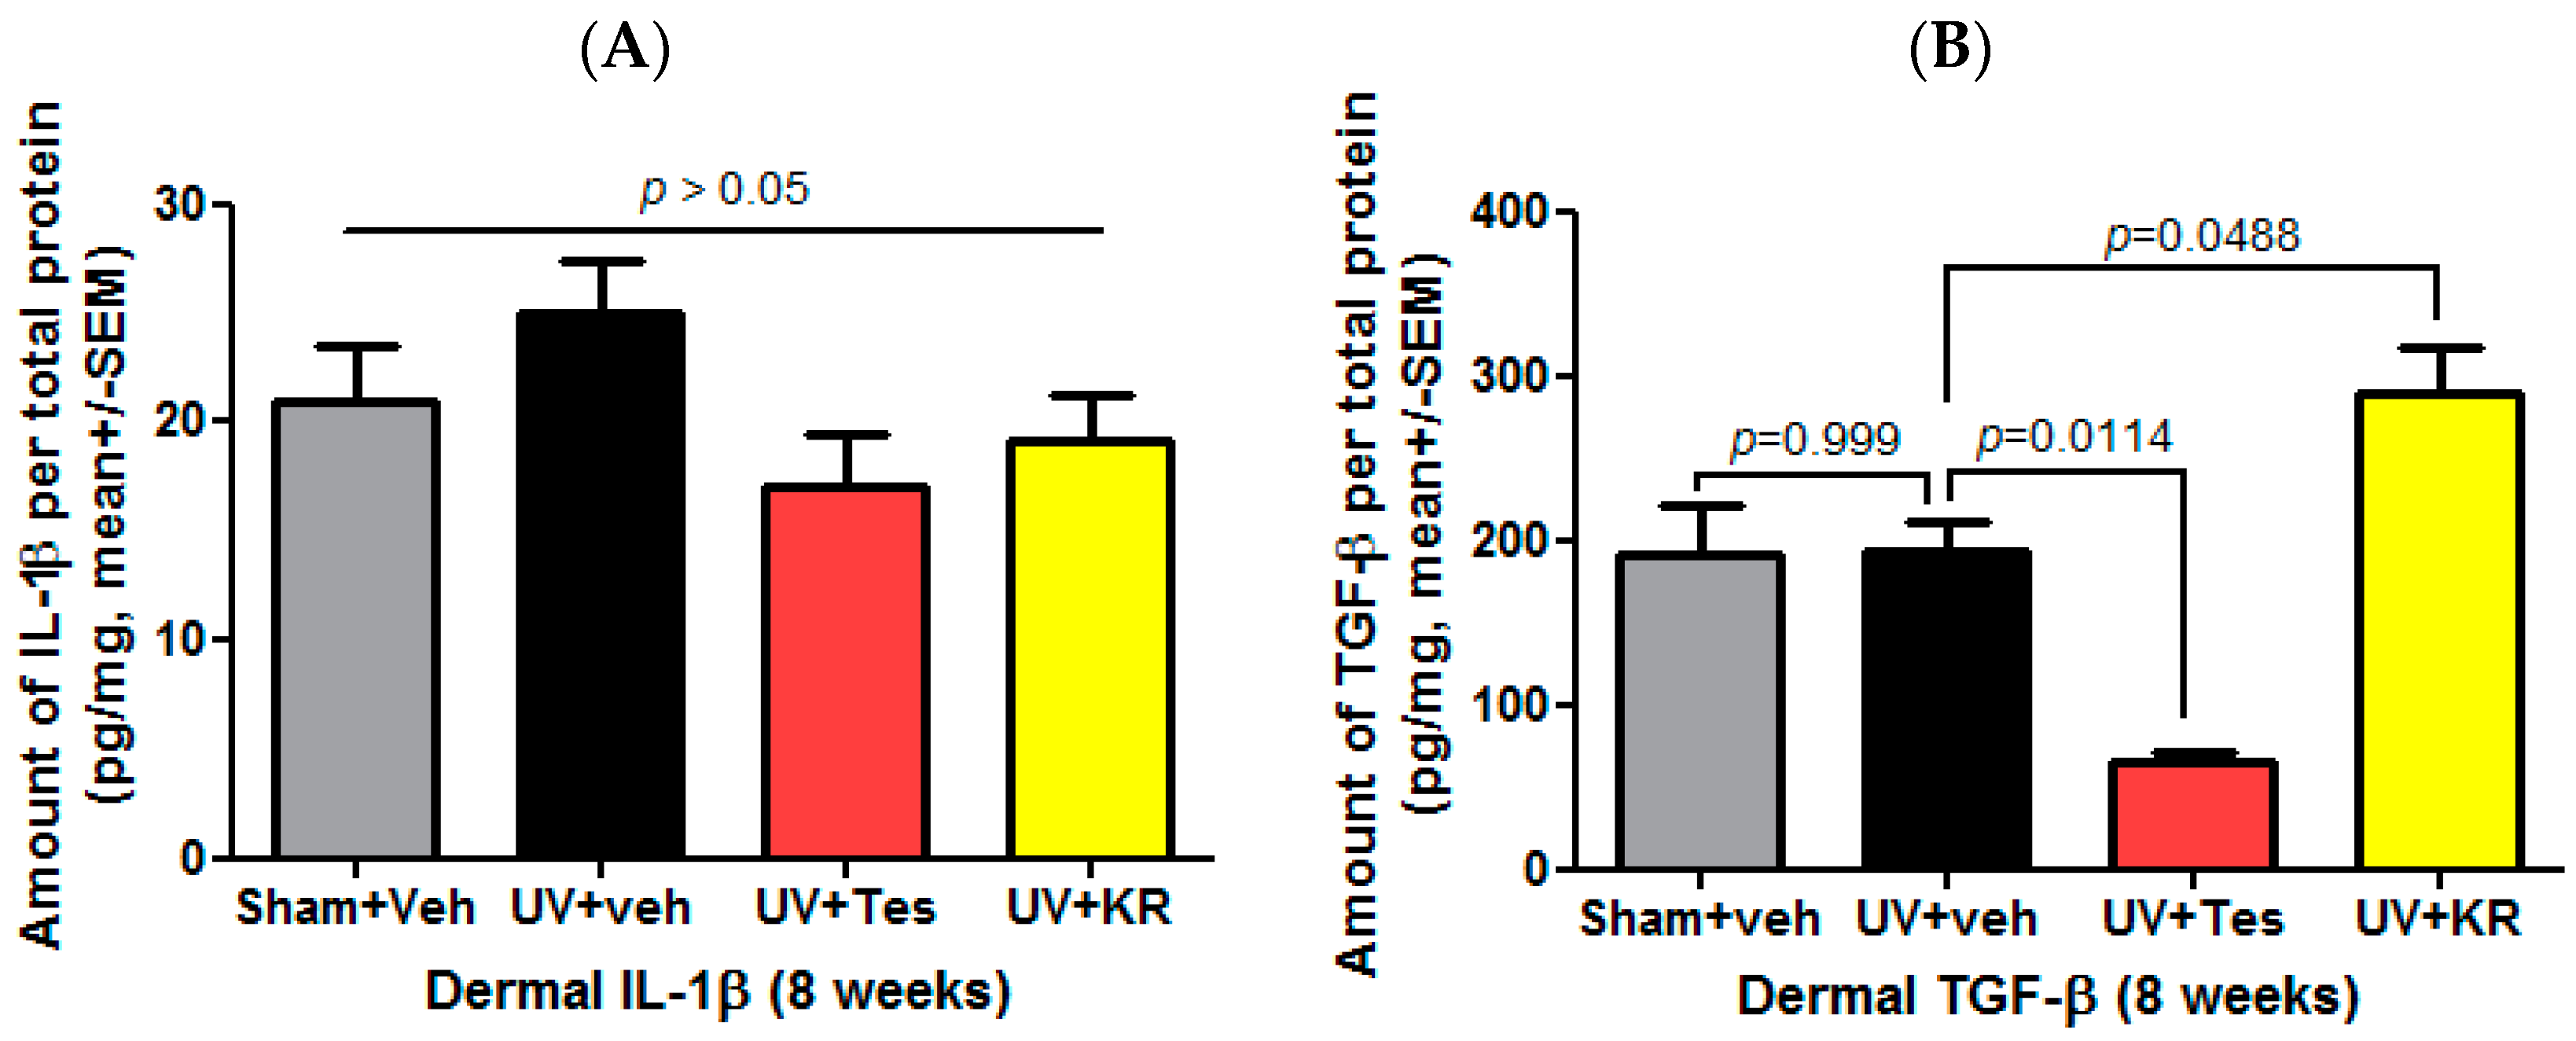
2.5. A Mixture of Extracts of Kochia scoparia and Rosa multiflora (KR) Increased the Expression of Dermal TGF-β in Photo-Aging Murine Skin
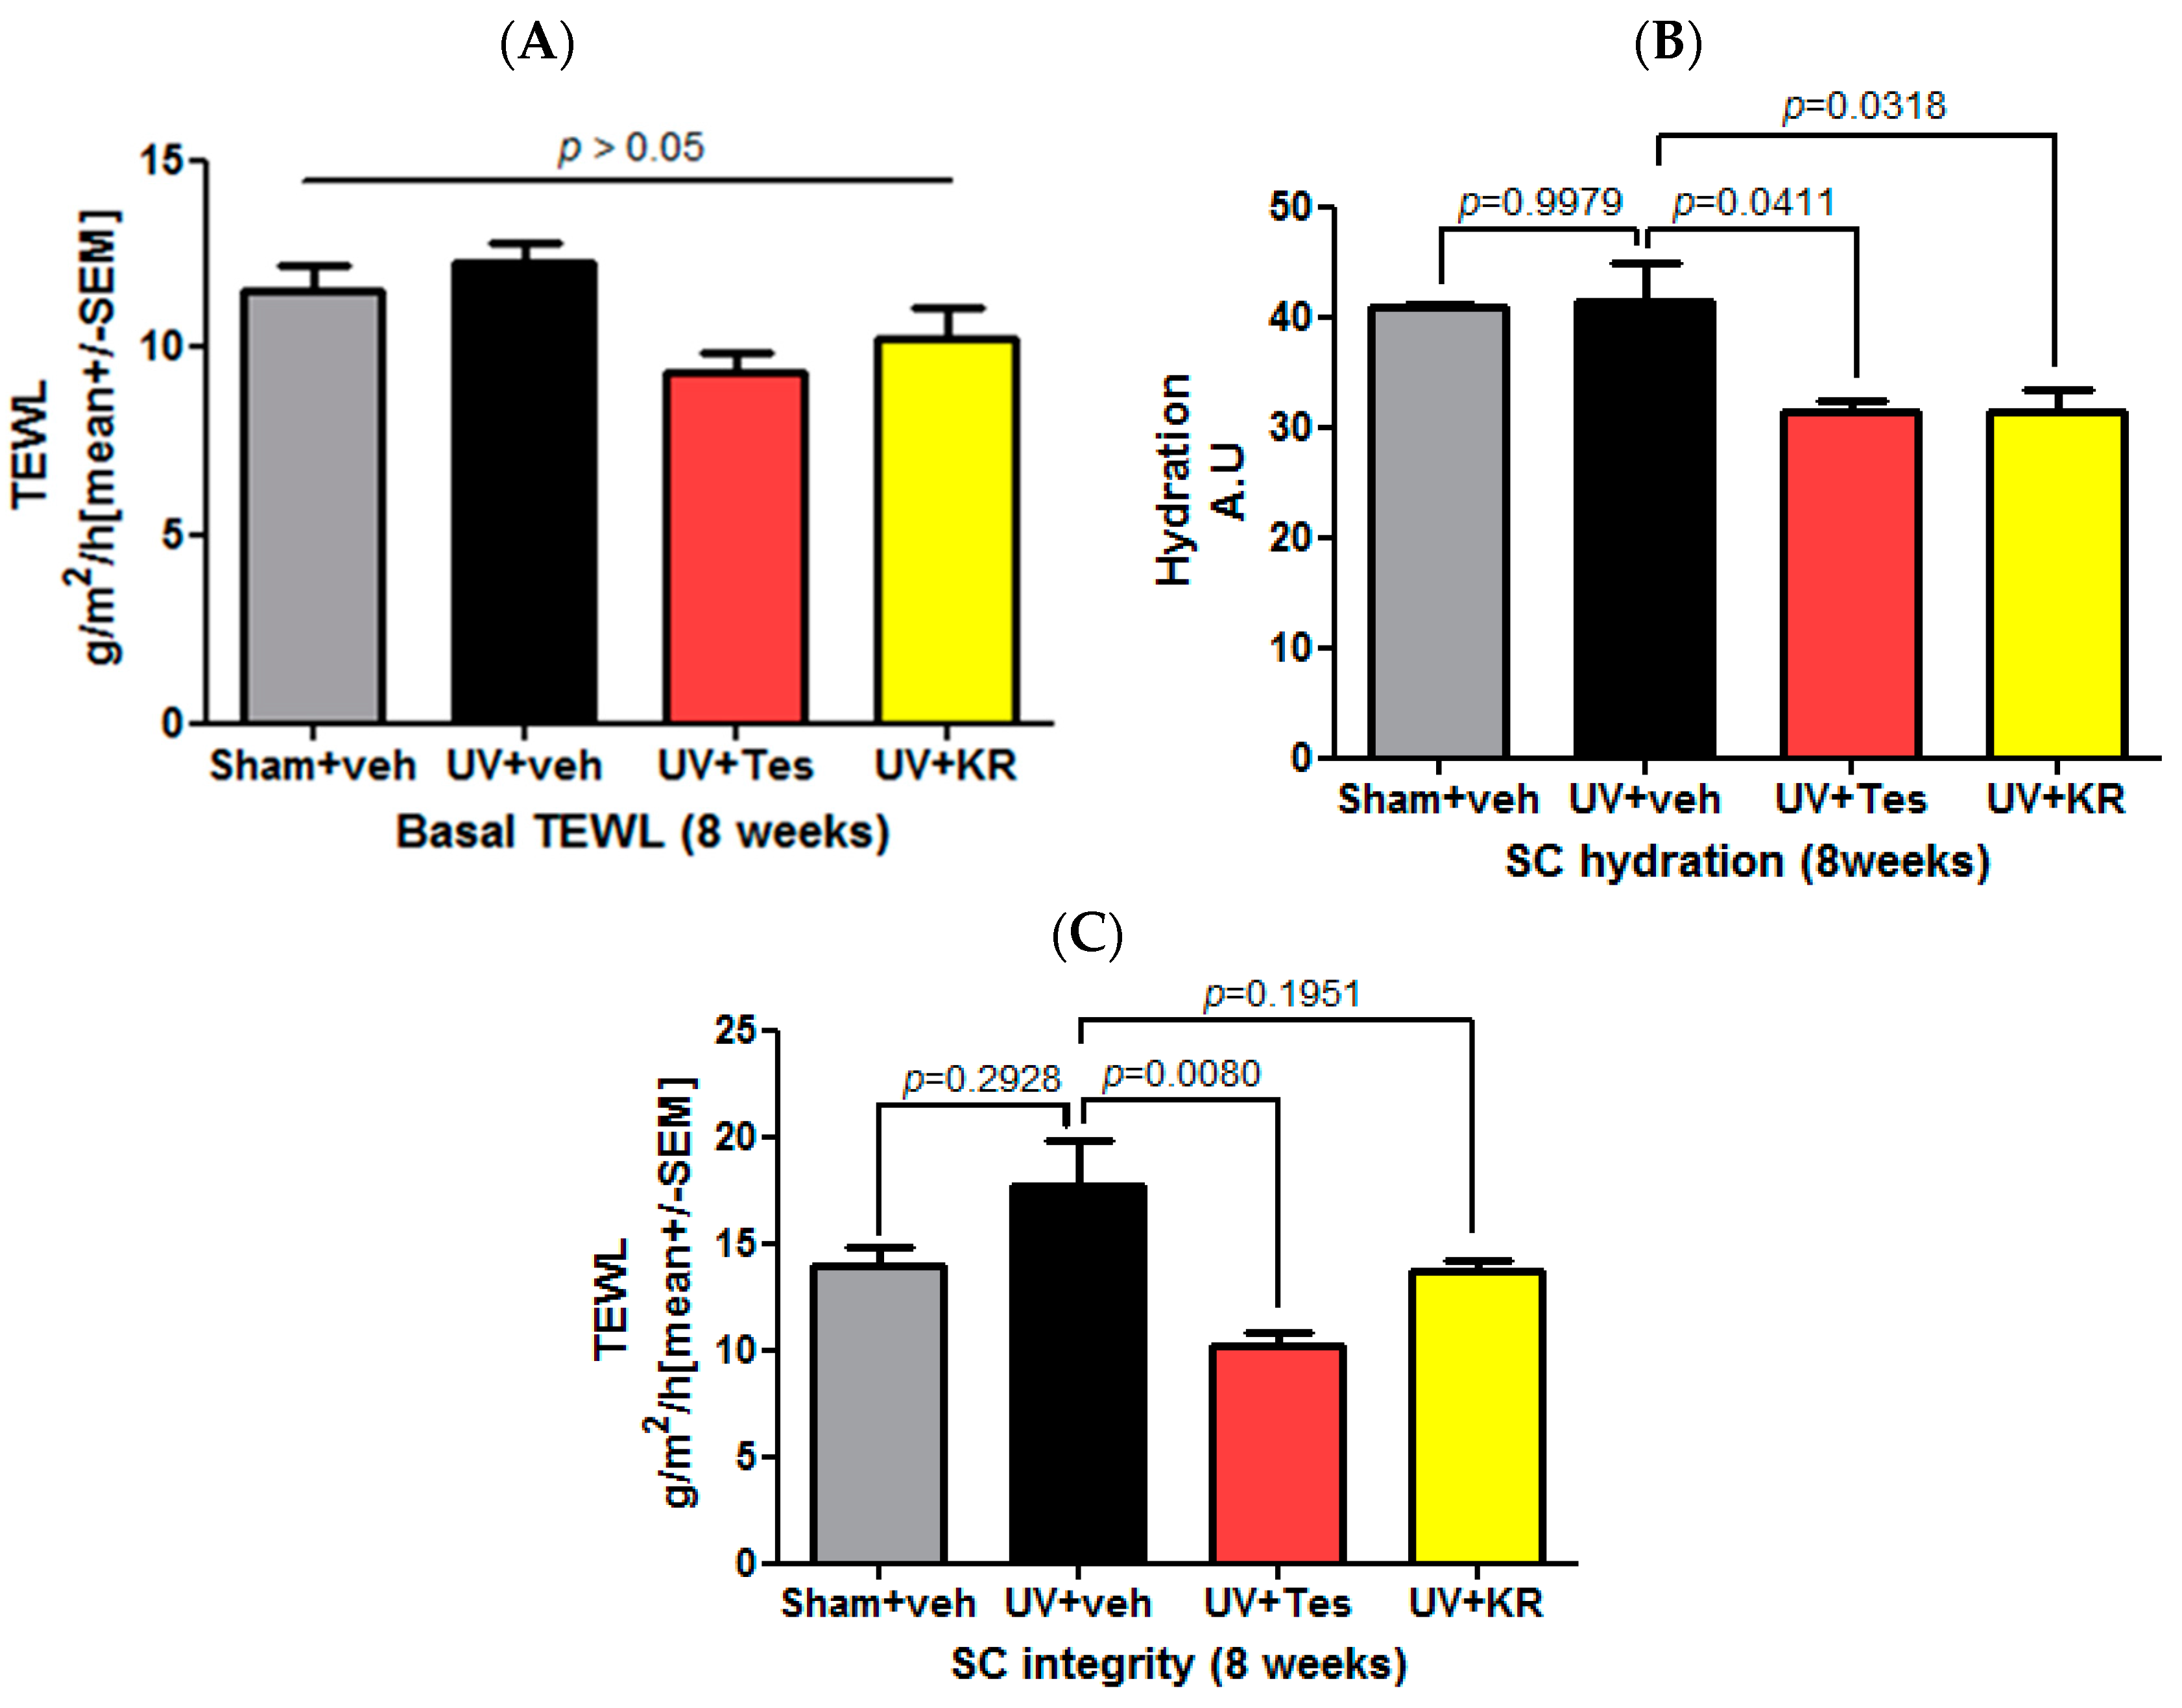
2.6. A Mixture of Extracts of Kochia scoparia and Rosa multiflora (KR) Did Not Affect Basal Transepidermal Water Loss (TEWL) and Stratum Corneum (SC) Integrity, But Did Decrease SC Hydration in Photoaging Murine Skin
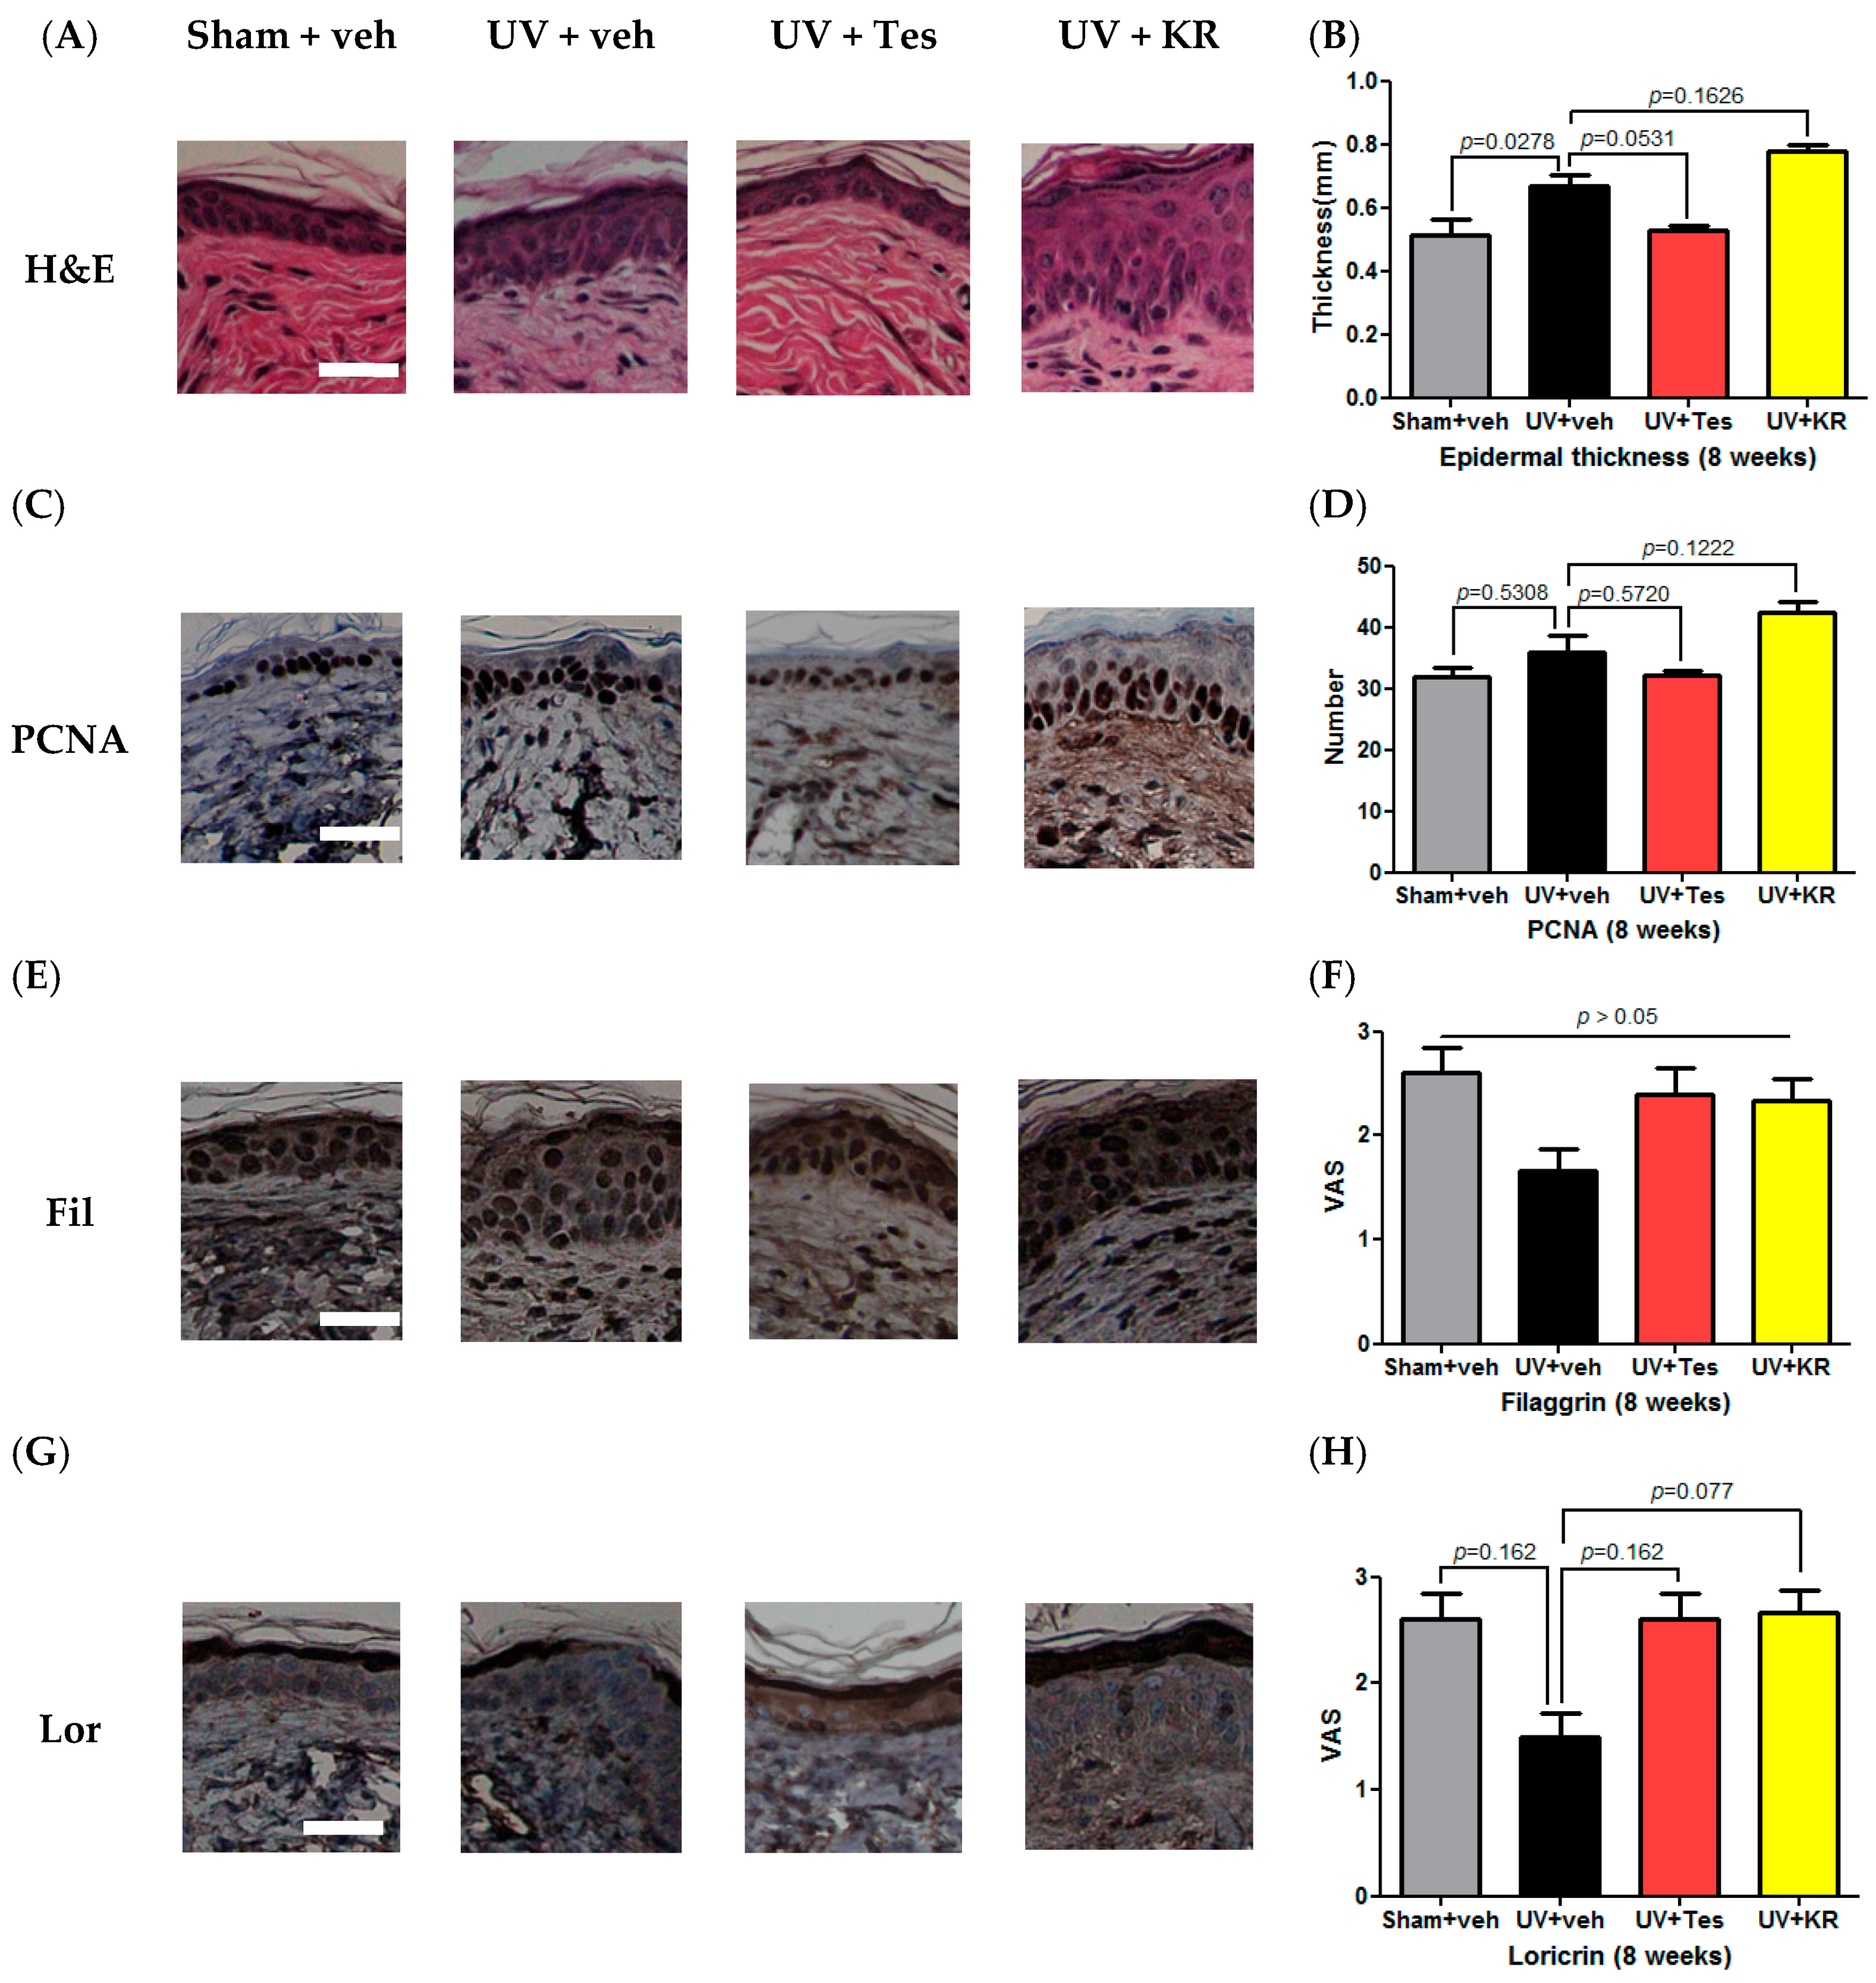
2.7. A Mixture of Extracts of Kochia scopiaria and Rosa multiflora (KR) Did Not Change the Increase in Epidermal Proliferation in Photoaging Skin, Nor Did it Affect Epidermal Differentiation in Photoaging Skin
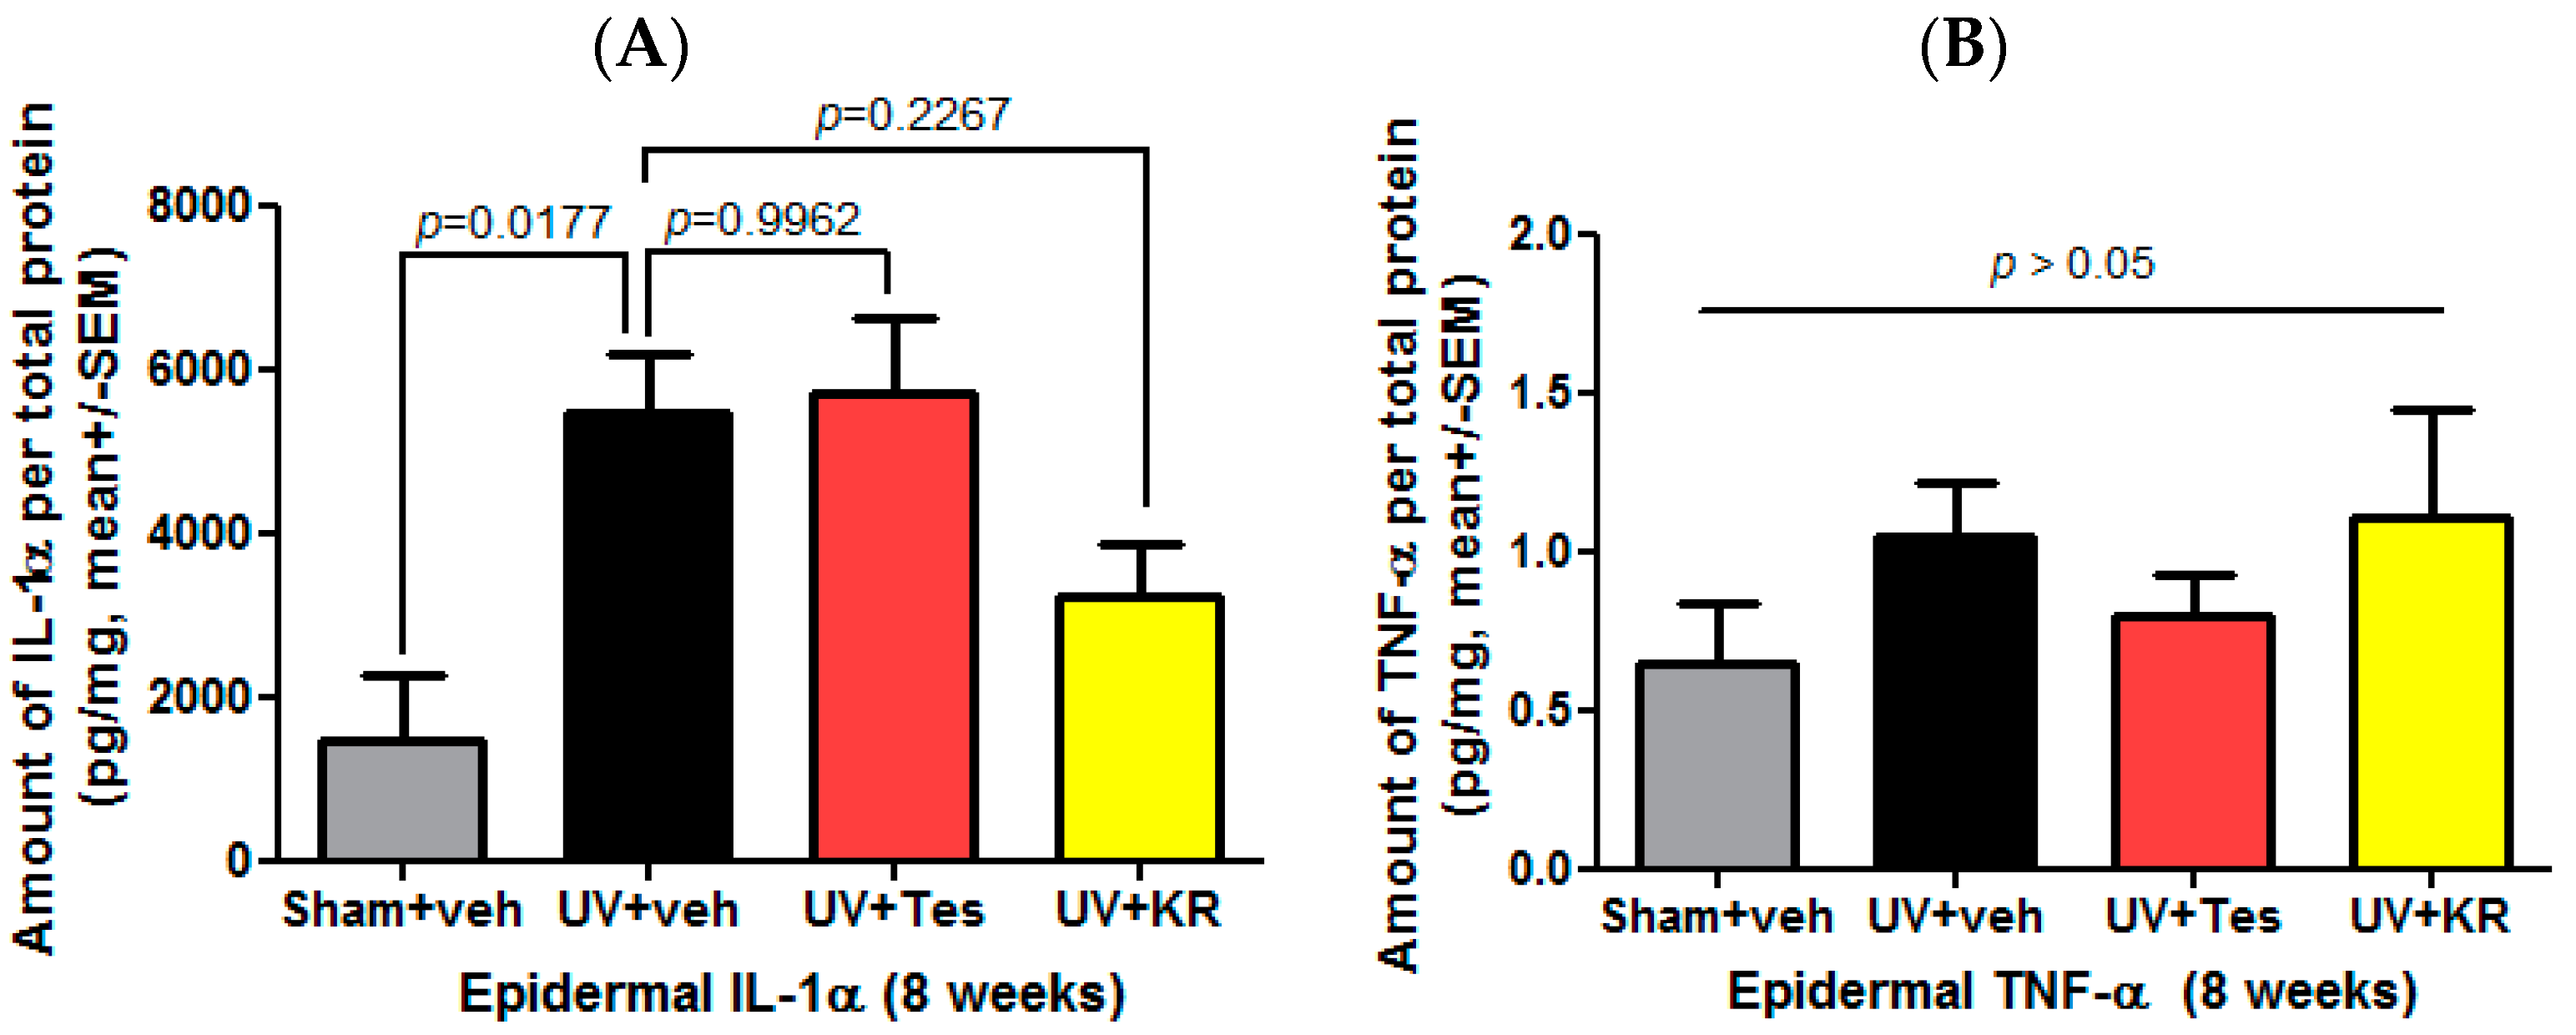
2.8. A Mixture of Extracts of Kochia scoparia and Rosa multiflora (KR) Decreased the Expression of Epidermal IL-1α in Photoaging Murine Skin
3. Discussion
4. Materials and Methods
4.1. Plant Materials and Their Extraction
4.2. Cell-Based Transactivation Assay
4.3. UVB Irradiation and Enzyme-Linked Immunosorbent Assay (ELISA)
4.4. Animal Model for Photoaging Skin
4.5. Topical Treatment with a Mixture of the Extracts of Kochia scoparia and Rosa multiflora (KR)
4.6. Evaluation of Skin Barrier Function
4.7. Tissue Preparation and Microscopic Measurement
4.8. Immunohistochemistry for Epidermal Differentiation and Proliferation Markers
4.9. Quantification of Procollagen Type 1 and Matrix Metalloproteinase-13 (MMP-13) Expression by Enzyme-Linked Immunosorbent Assay (ELISA) Analysis
4.10. Total RNA Preparation and cDNA Synthesis Using Murine Skin
4.11. Quantitative PCR Analysis of Gene Expression
4.12. Cytokine Assays
4.13. Statistics
Acknowledgments
Author Contributions
Conflicts of Interest
Abbreviations
| PPAR | peroxisome proliferator activated receptor |
| KR | a mixture of extracts of Kochia scoparia and Rosa multiflora |
| UV | ultraviolet |
| TEWL | transepidermal water loss |
| SC | stratum corneum |
| FDA | Food and Drug Administration |
| AD | atopic dermatitis |
| TIMP | tissue inhibitor of metalloprotease |
References
- Kohl, E.; Steinbauer, J.; Landthaler, M.; Szeimies, R.M. Skin ageing. J. Eur. Acad. Dermatol. Venereol. 2011, 25, 873–884. [Google Scholar] [CrossRef] [PubMed]
- Khavkin, J.; Ellis, D.A. Aging skin: Histology, physiology, and pathology. Facial Plast. Surg. Clin. N. Am. 2011, 19, 229–234. [Google Scholar] [CrossRef] [PubMed]
- Gilchrest, B.A. Photoaging. J. Investig. Dermatol. 2013, 133, E2–E6. [Google Scholar] [CrossRef] [PubMed]
- Ganceviciene, R.; Liakou, A.I.; Theodoridis, A.; Makrantonaki, E.; Zouboulis, C.C. Skin anti-aging strategies. Dermato Endocrinol. 2012, 4, 308–319. [Google Scholar] [CrossRef] [PubMed]
- Ramos-e-Silva, M.; Celem, L.R.; Ramos-e-Silva, S.; Fucci-da-Costa, A.P. Anti-aging cosmetics: Facts and controversies. Clin. Dermatol. 2013, 31, 750–758. [Google Scholar] [CrossRef] [PubMed]
- Zelcer, N.; Tontonoz, P. Liver X receptors as integrators of metabolic and inflammatory signaling. J. Clin. Investig. 2006, 116, 607–614. [Google Scholar] [CrossRef] [PubMed]
- Sonoda, J.; Pei, L.; Evans, R.M. Nuclear receptors: Decoding metabolic disease. FEBS Lett. 2008, 582, 2–9. [Google Scholar] [CrossRef] [PubMed]
- Schmuth, M.; Jiang, Y.J.; Dubrac, S.; Elias, P.M.; Feingold, K.R. Thematic review series: Skin lipids. Peroxisome proliferator-activated receptors and liver X receptors in epidermal biology. J. Lipid Res. 2008, 49, 499–509. [Google Scholar] [CrossRef] [PubMed]
- Hanley, K.; Jiang, Y.; Crumrine, D.; Bass, N.M.; Appel, R.; Elias, P.M.; Williams, M.L.; Feingold, K.R. Activators of the nuclear hormone receptors PPAR alpha and FXR accelerate the development of the fetal epidermal permeability barrier. J. Clin. Investig. 1997, 100, 705–712. [Google Scholar] [CrossRef] [PubMed]
- Fluhr, J.W.; Crumrine, D.; Mao-Qiang, M.; Moskowitz, D.G.; Elias, P.M.; Feingold, K.R. Topical liver X receptor activators accelerate postnatal acidification of stratum corneum and improve function in the neonate. J. Investig. Dermatol. 2005, 125, 1206–1214. [Google Scholar] [CrossRef] [PubMed]
- Fluhr, J.W.; Man, M.Q.; Hachem, J.P.; Crumrine, D.; Mauro, T.M.; Elias, P.M.; Feingold, K.R. Topical peroxisome proliferator activated receptor activators accelerate postnatal stratum corneum acidification. J. Investig. Dermatol. 2009, 129, 365–374. [Google Scholar] [CrossRef] [PubMed]
- Man, M.Q.; Choi, E.H.; Schmuth, M.; Crumrine, D.; Uchida, Y.; Elias, P.M.; Holleran, W.M.; Feingold, K.R. Basis for improved permeability barrier homeostasis induced by PPAR and LXR activators: Liposensors stimulate lipid synthesis, lamellar body secretion, and post-secretory lipid processing. J. Investig. Dermatol. 2006, 126, 386–392. [Google Scholar] [CrossRef] [PubMed]
- Chiba, T.; Takeuchi, S.; Esaki, H.; Yamamura, K.; Kurihara, Y.; Moroi, Y.; Furue, M. Topical application of PPARα (but not β/δ or γ) suppresses atopic dermatitis in NC/Nga mice. Allergy 2012, 67, 936–942. [Google Scholar] [CrossRef] [PubMed]
- Hatano, Y.; Elias, P.M.; Crumrine, D.; Feingold, K.R.; Katagiri, K.; Fujiwara, S. Efficacy of combined peroxisome proliferator-activated receptor α ligand and glucocorticoid therapy in a murine model of atopic dermatitis. J. Investig. Dermatol. 2011, 131, 1845–1852. [Google Scholar] [CrossRef] [PubMed]
- Zhang, G.Y.; Cheng, T.; Zheng, M.H.; Yi, C.G.; Pan, H.; Li, Z.J.; Chen, X.L.; Yu, Q.; Jiang, L.F.; Zhou, F.Y.; et al. Peroxisome proliferator-activated receptor-γ (PPAR-γ) agonist inhibits transforming growth factor-β1 and matrix production in human dermal fibroblasts. J. Plast. Reconstr. Aesthet. Surg. 2010, 63, 1209–1216. [Google Scholar] [CrossRef] [PubMed]
- Poleni, P.E.; Etienne, S.; Velot, E.; Netter, P.; Bianchi, A. Activation of PPARs α, β/δ, and γ Impairs TGF-β1-Induced collagens’ production and modulates the TIMP-1/MMPs balance in three-dimensional cultured chondrocytes. PPAR Res. 2010, 2010, 635912. [Google Scholar] [CrossRef] [PubMed]
- Kim, J.K.; Mun, S.; Kim, M.S.; Kim, M.B.; Sa, B.K.; Hwang, J.K. 5,7-Dimethoxyflavone, an activator of PPAR α/γ, inhibits UVB-induced MMP expression in human skin fibroblast cells. Exp. Dermatol. 2012, 21, 211–216. [Google Scholar] [CrossRef] [PubMed]
- Han, H.Y.; Lee, H.E.; Kim, H.J.; Jeong, S.H.; Kim, J.H.; Kim, H.; Ryu, M.H. Kochia scoparia induces apoptosis of oral cancer cells in vitro and in heterotopic tumors. J. Ethnopharmacol. 2016, 192, 431–441. [Google Scholar] [CrossRef] [PubMed]
- Guo, D.; Xu, L.; Cao, X.; Guo, Y.; Ye, Y.; Chan, C.O.; Mok, D.K.; Yu, Z.; Chen, S. Anti-inflammatory activities and mechanisms of action of the petroleum ether fraction of Rosa multiflora Thunb. hips. J. Ethnopharmacol. 2011, 138, 717–722. [Google Scholar] [CrossRef] [PubMed]
- Jung, M.; Lee, S.; Park, H.Y.; Youm, J.K.; Jeong, S.; Bae, J.; Kwon, M.J.; Park, B.D.; Lee, S.H.; Choi, E.H. Anti-ageing effects of a new synthetic sphingolipid (K6EAA-L12) on aged murine skin. Exp. Dermatol. 2011, 20, 314–319. [Google Scholar] [CrossRef] [PubMed]
- Park, H.Y.; Youm, J.K.; Kwon, M.J.; Park, B.D.; Lee, S.H.; Choi, E.H. K6PC5, a novel sphingosine kinase activator, improves long-term ultraviolet light-exposed aged murine skin. Exp. Dermatol. 2008, 17, 829–836. [Google Scholar] [CrossRef] [PubMed]
- Fisher, G.J.; Datta, S.C.; Talwar, H.S.; Wang, Z.Q.; Varani, J.; Kang, S.; Voorhees, J.J. Molecular basis of sun-induced premature skin ageing and retinoid antagonism. Nature 1996, 379, 335–339. [Google Scholar] [CrossRef] [PubMed]
- Wlaschek, M.; Tantcheva-Poór, I.; Naderi, L.; Ma, W.; Schneider, L.A.; Razi-Wolf, Z.; Schüller, J.; Scharffetter-Kochanek, K. Solar UV irradiation and dermal photoaging. J. Photochem. Photobiol. B 2001, 63, 41–51. [Google Scholar] [CrossRef]
- Rabe, J.H.; Mamelak, A.J.; McElgunn, P.J.; Morison, W.L.; Sauder, D.N. Photoaging: Mechanisms and repair. J. Am. Acad. Dermatol. 2006, 55, 1–19. [Google Scholar] [CrossRef] [PubMed]
- Scharffetter-Kochanek, K.; Brenneisen, P.; Wenk, J.; Herrmann, G.; Ma, W.; Kuhr, L.; Meewes, C.; Wlaschek, M. Photoaging of the skin from phenotype to mechanisms. Exp. Gerontol. 2000, 35, 307–316. [Google Scholar] [CrossRef]
- Yaar, M.; Gilchrest, B.A. Photoageing: Mechanism, prevention and therapy. Br. J. Dermatol. 2007, 157, 874–887. [Google Scholar] [CrossRef] [PubMed]
- Choi, E.H.; Man, M.Q.; Xu, P.; Xin, S.; Liu, Z.; Crumrine, D.A.; Jiang, Y.J.; Fluhr, J.W.; Feingold, K.R.; Elias, P.M.; et al. Stratum corneum acidification is impaired in moderately aged human and murine skin. J. Investig. Dermatol. 2007, 127, 2847–2856. [Google Scholar] [CrossRef] [PubMed]
- Briot, A.; Deraison, C.; Lacroix, M.; Bonnart, C.; Robin, A.; Besson, C.; Dubus, P.; Hovnanian, A. Kallikrein 5 induce atopic dermatitis-like lesions through PAR2-mediated thymic stromal lymphopoietin expression in Netherton syndrome. Exp. Med. 2009, 206, 1135–1147. [Google Scholar] [CrossRef] [PubMed]
- Jung, M.; Choi, J.; Lee, S.A.; Kim, H.; Hwang, J.; Choi, E.H. Pyrrolidone carboxylic acid levels or caspase-14 expression in the corneocytes of lesional skin correlates with clinical severity, skin barrier function and lesional inflammation in atopic dermatitis. J. Dermatol. Sci. 2014, 76, 231–239. [Google Scholar] [CrossRef] [PubMed]
- Singh, M.; Griffiths, C.E. The use of retinoids in the treatment of photoaging. Dermatol. Ther. 2006, 19, 297–305. [Google Scholar] [CrossRef] [PubMed]
- Varani, J.; Warner, R.L.; Gharaee-Kermani, M.; Phan, S.H.; Kang, S.; Chung, J.H.; Wang, Z.Q.; Datta, S.C.; Fisher, G.J.; Voorhees, J.J. Vitamin A antagonizes decreased cell growth and elevated collagen-degrading matrix metalloproteinases and stimulates collagen accumulation in naturally aged human skin. J. Investig. Dermatol. 2000, 114, 480–486. [Google Scholar] [CrossRef] [PubMed]
- Kang, S.; Duell, E.A.; Fisher, G.J.; Datta, S.C.; Wang, Z.Q.; Reddy, A.P.; Tavakkol, A.; Yi, J.Y.; Griffiths, C.E.; Elder, J.T. Application of retinol to human skin in vivo induces epidermal hyperplasia and cellular retinoid binding proteins characteristic of retinoic acid but without measurable retinoic acid levels or irritation. J. Investig. Dermatol. 1995, 105, 549–556. [Google Scholar] [CrossRef] [PubMed]
- Lee, H.J.; Yoon, N.Y.; Lee, N.R.; Jung, M.; Kim, D.H.; Choi, E.H. Topical acidic cream prevents the development of atopic dermatitis- and asthma-like lesions in murine model. Exp. Dermatol. 2014, 23, 736–741. [Google Scholar] [CrossRef] [PubMed]
- Park, H.Y.; Kim, J.H.; Jung, M.; Chung, C.H.; Hasham, R.; Park, C.S.; Choi, E.H. A long-standing hyperglycaemic condition impairs skin barrier by accelerating skin ageing process. Exp. Dermatol. 2011, 20, 969–974. [Google Scholar] [CrossRef] [PubMed]
- Lee, H.J.; Jung, M.; Kim, J.H.; Yoon, N.Y.; Choi, E.H. The effect of adipose-derived stem cell-cultured media on oxazolone treated atopic dermatitis-like murine model. Ann. Dermatol. 2012, 24, 181–188. [Google Scholar] [CrossRef] [PubMed]


© 2016 by the authors; licensee MDPI, Basel, Switzerland. This article is an open access article distributed under the terms and conditions of the Creative Commons Attribution (CC-BY) license (http://creativecommons.org/licenses/by/4.0/).
Share and Cite
Jeon, H.; Kim, D.H.; Nho, Y.-H.; Park, J.-E.; Kim, S.-N.; Choi, E.H. A Mixture of Extracts of Kochia scoparia and Rosa multiflora with PPAR α/γ Dual Agonistic Effects Prevents Photoaging in Hairless Mice. Int. J. Mol. Sci. 2016, 17, 1919. https://doi.org/10.3390/ijms17111919
Jeon H, Kim DH, Nho Y-H, Park J-E, Kim S-N, Choi EH. A Mixture of Extracts of Kochia scoparia and Rosa multiflora with PPAR α/γ Dual Agonistic Effects Prevents Photoaging in Hairless Mice. International Journal of Molecular Sciences. 2016; 17(11):1919. https://doi.org/10.3390/ijms17111919
Chicago/Turabian StyleJeon, Hyerin, Dong Hye Kim, Youn-Hwa Nho, Ji-Eun Park, Su-Nam Kim, and Eung Ho Choi. 2016. "A Mixture of Extracts of Kochia scoparia and Rosa multiflora with PPAR α/γ Dual Agonistic Effects Prevents Photoaging in Hairless Mice" International Journal of Molecular Sciences 17, no. 11: 1919. https://doi.org/10.3390/ijms17111919
APA StyleJeon, H., Kim, D. H., Nho, Y.-H., Park, J.-E., Kim, S.-N., & Choi, E. H. (2016). A Mixture of Extracts of Kochia scoparia and Rosa multiflora with PPAR α/γ Dual Agonistic Effects Prevents Photoaging in Hairless Mice. International Journal of Molecular Sciences, 17(11), 1919. https://doi.org/10.3390/ijms17111919