
Adding Sarcosine to Antipsychotic Treatment in Patients with Stable Schizophrenia Changes the Concentrations of Neuronal and Glial Metabolites in the Left Dorsolateral Prefrontal Cortex

 ,
,
Abstract
:
1. Introduction
2. Results and Discussion

| Compared Ratios | Baseline | After 6 Months | Baseline vs. after 6 Months | Baseline vs. after 6 Months | ||||
|---|---|---|---|---|---|---|---|---|
| Sarcosine (Mean ± SD) | Placebo (Mean ± SD) | p-Level | Sarcosine (Mean ± SD) | Placebo (Mean ± SD) | p-Level | Sarcosine p-Level | Placebo p-Level | |
| NAA/Cr | 1.50 (0.65) | 1.61 (0.55) | >0.05 | 1.77 (0.30) | 1.69 (0.27) | >0.05 | 0.0171 | 0.0468 |
| Cho/Cr | 0.75 (0.24) | 0.72 (0.38) | >0.05 | 0.72 (0.15) | 0.83 (0.51) | >0.05 | >0.05 | >0.05 |
| mI/Cr | 0.28 (0.13) | 0.26 (0.11) | >0.05 | 0.38 (0.13) | 0.28 (0.09) | 0.0310 | 0.0309 | >0.05 |
| Glx/Cr | 1.10 (0.76) | 0.94 (0.30) | >0.05 | 0.77 (0.29) | 0.80 (0.29) | >0.05 | >0.05 | >0.05 |
| NAA/Cho | 2.23 (1.12) | 2.08 (0.72) | >0.05 | 2.61 (0.69) | 1.93 (0.58) | 0.0061 | 0.0468 | >0.05 |
| mI/Cho | 0.43 (0.16) | 0.46 (0.64) | >0.05 | 0.71 (0.25) | 0.49 (0.19) | 0.0075 | 0.0064 | >0.05 |
| Glx/Cho | 0.99 (0.66) | 0.81 (0.20) | >0.05 | 0.99 (0.13) | 1.01 (0.34) | >0.05 | >0.05 | >0.05 |

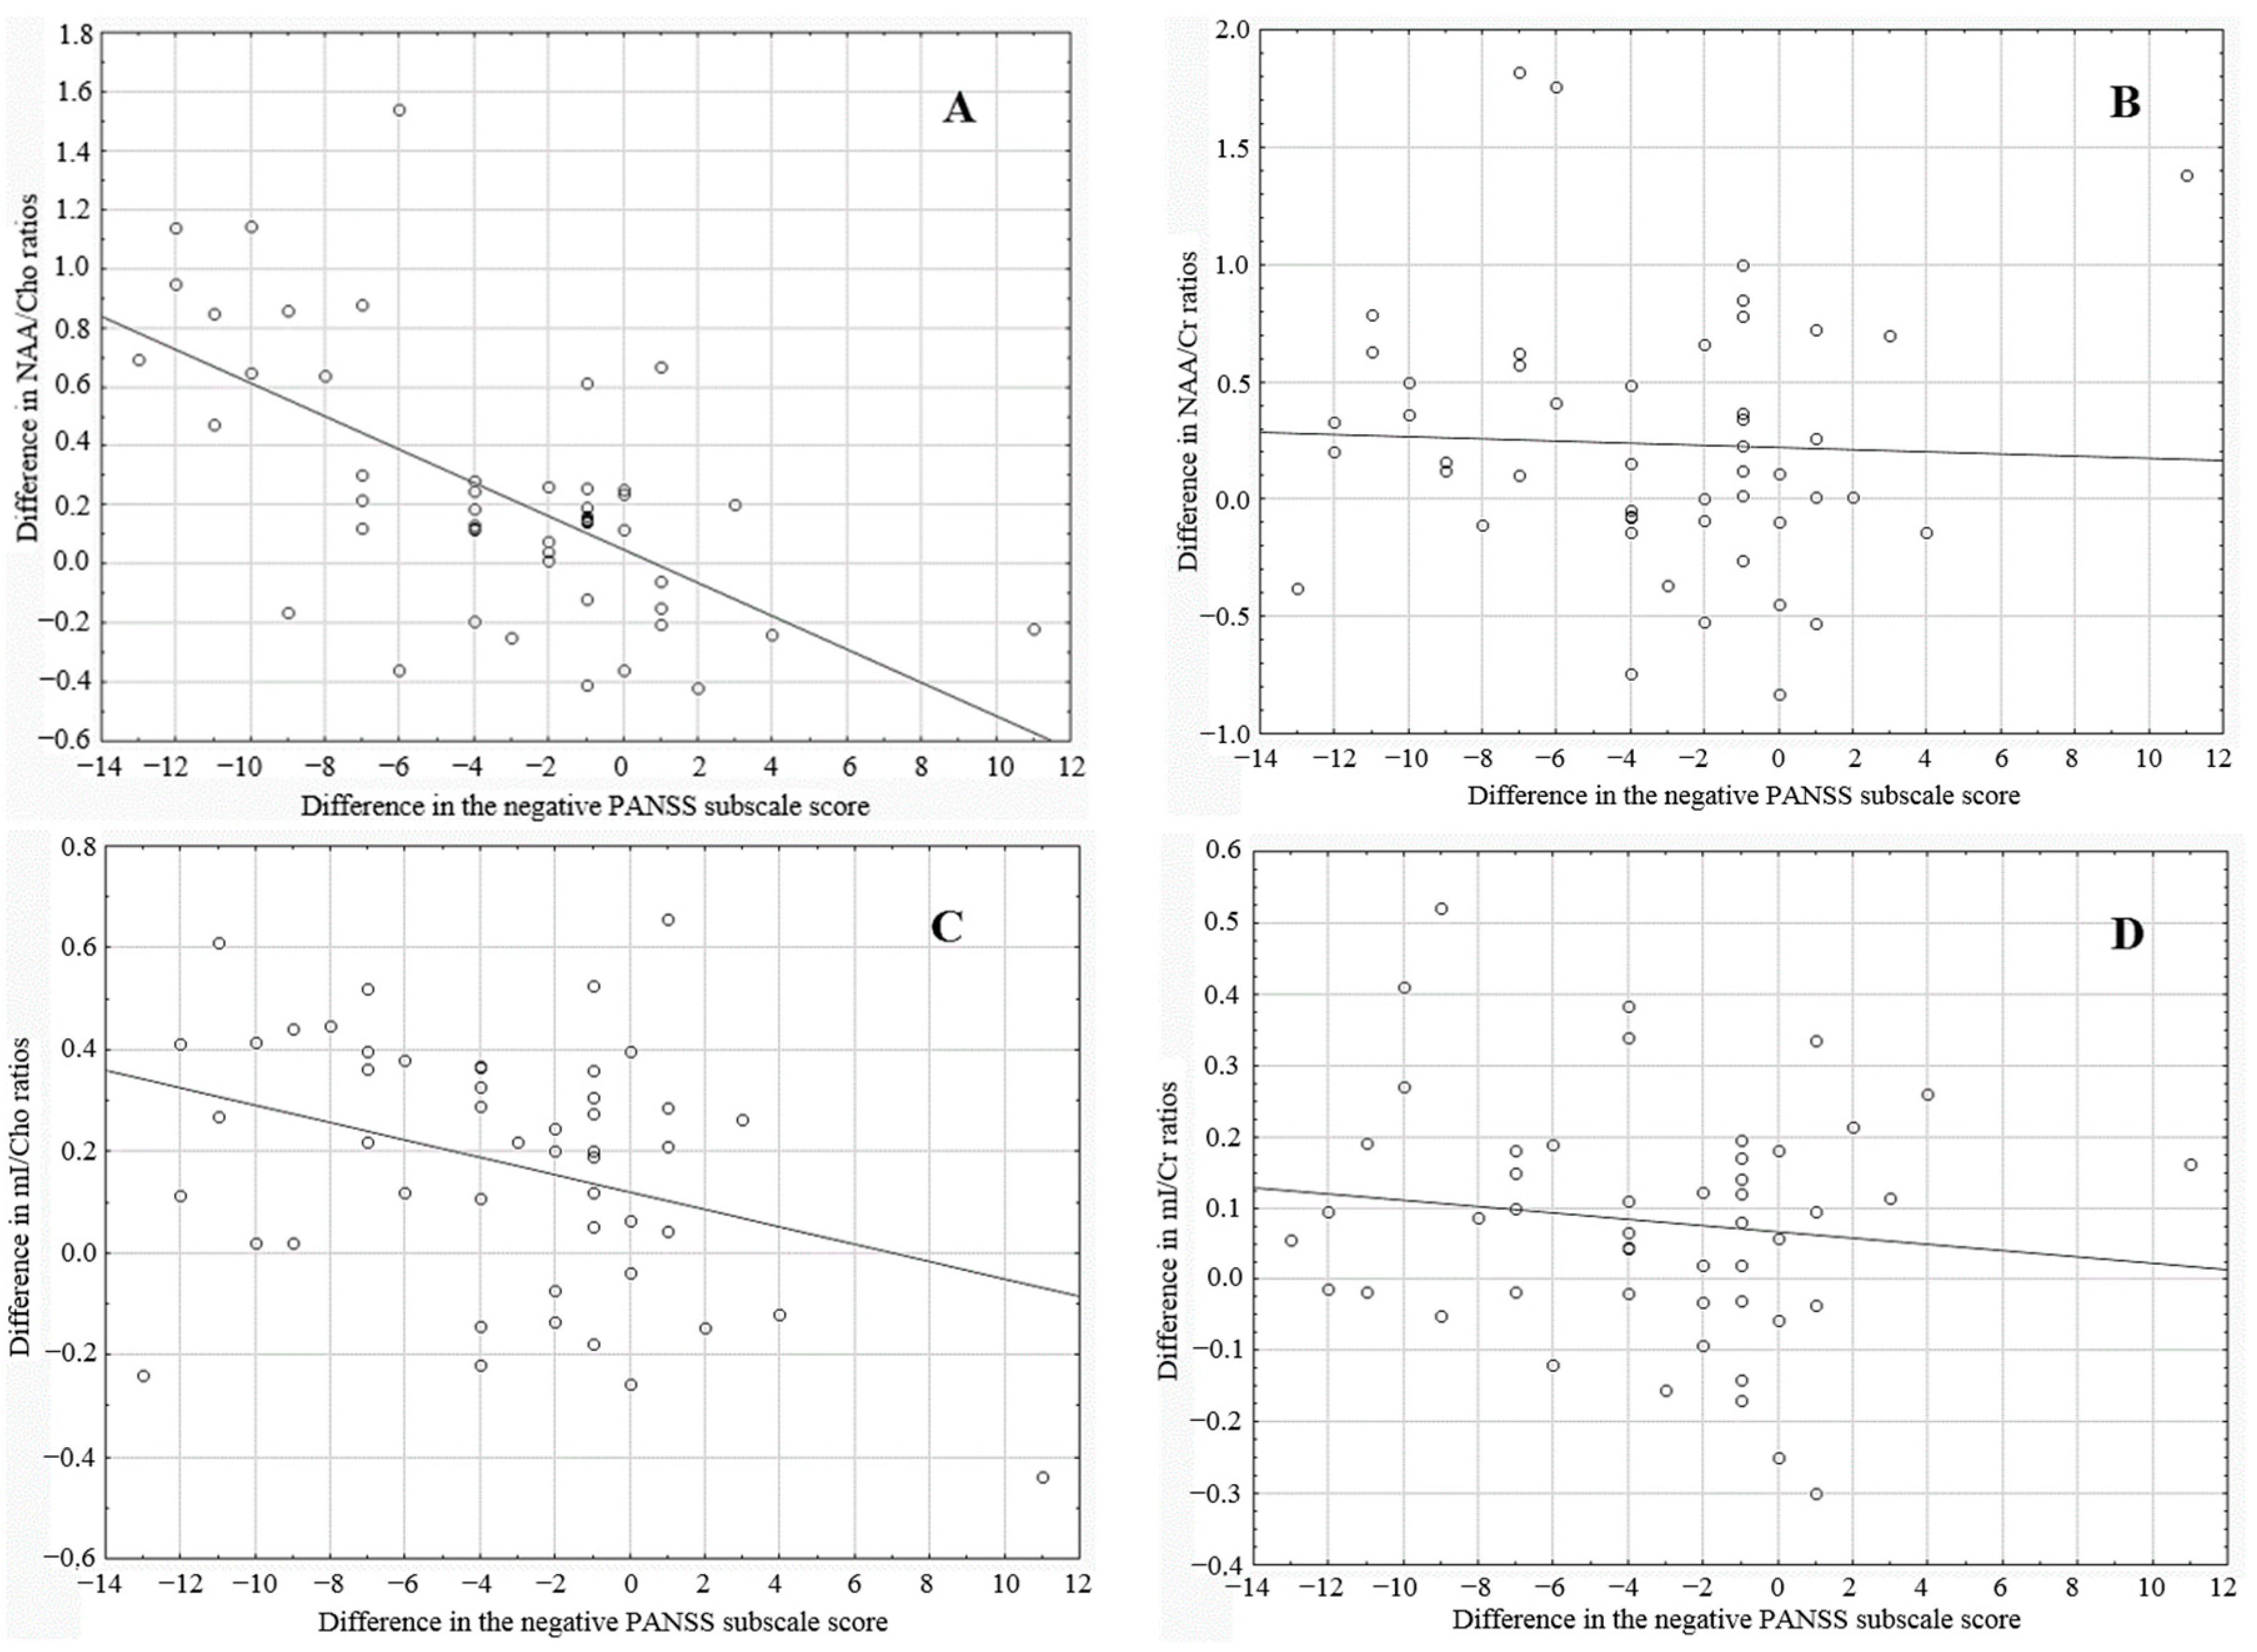
| Differences in Metabolite Ratios Correlated with the PANSS Negative Subscale Score | Spearman’s Correlation Coefficient | p-Value |
|---|---|---|
| NAA/Cr | −0.130768 | >0.05 |
| Cho/Cr | −0.200251 | >0.05 |
| mI/Cr | −0.089075 | >0.05 |
| Glx/Cr | 0.630062 | >0.05 |
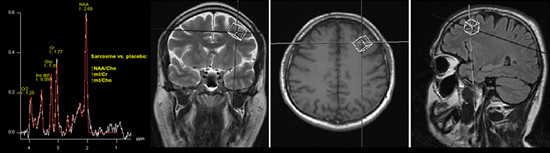
| NAA/Cho | −0.562891 | 0.000026 |
| mI/Cho | −0.288039 | 0.044752 |
| Glx/Cho | −0.200251 | >0.05 |
2.1. NAA (N-Acetylaspartate)
2.2. Glx (Complex of Glutamate, Glutamine and GABA)
2.3. mI (myo-Inositol)
2.4. Limitations of the Study
3. Experimental Section
| Features | Group | p-Value | ||
|---|---|---|---|---|
| Sarcosine (n = 25) | Placebo (n = 25) | |||
| Gender | Female | 14 | 12 | >0.05 |
| Male | 11 | 13 | ||
| Age (mean) | 36.5 | 40 | >0.05 | |
| Mean number of hospitalizations | 5 | 4 | >0.05 | |
| Mean duration of the illness (years) | 12.3 | 13.2 | >0.05 | |
| Mean timespan of education per patient | 14.2 | 14.4 | >0.05 | |
| Antipsychotic treatment (DDD) | 1.94 | 1.97 | >0.05 | |
| Antidepressive treatment (DDD) | 0.58 | 0.6 | >0.05 | |
| PANSS total (±SD) | 71.4 ± 14 | 73.3 ± 13 | >0.05 | |
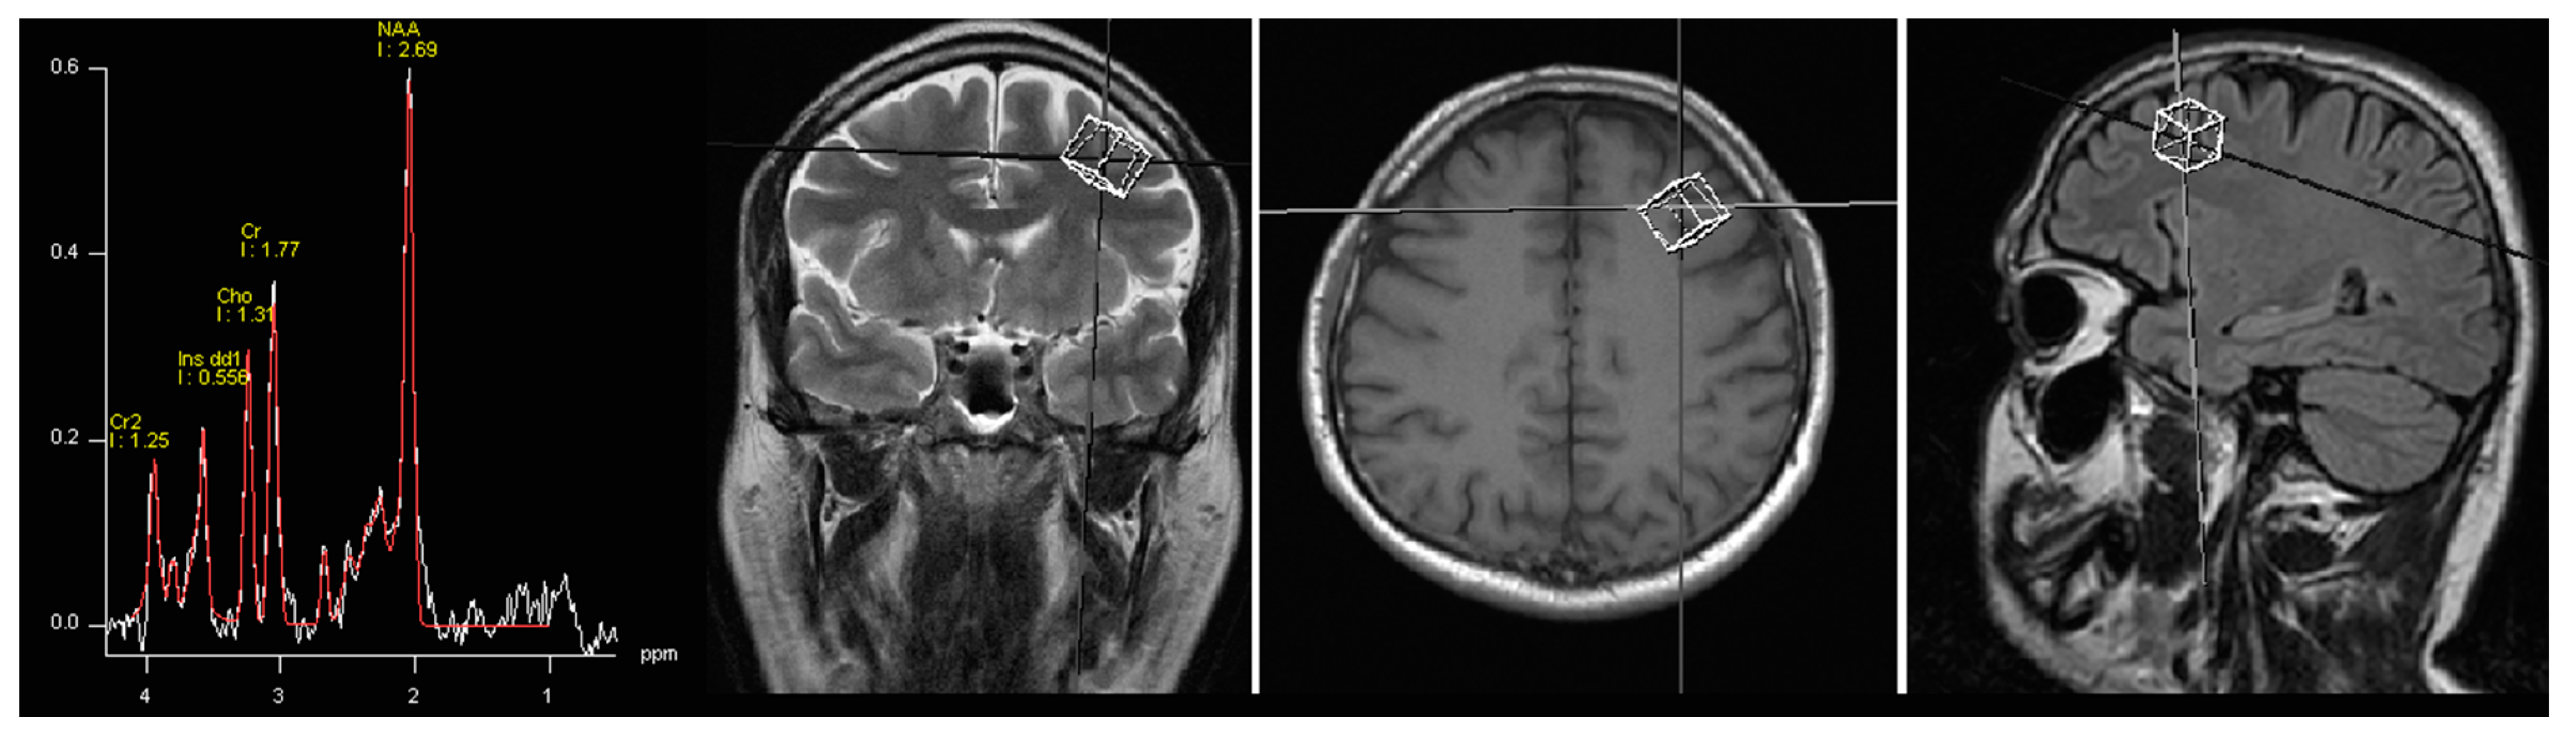
3.1. Spectroscopy

3.2. Statistical Analysis
4. Conclusions
Acknowledgments
Author Contributions
Conflicts of Interest
References
- McGrath, J.; Saha, S.; Chant, D.; Welham, J. Schizophrenia: A concise overview of incidence, prevalence, and mortality. Epidemiol. Rev. 2008, 30, 67–76. [Google Scholar] [CrossRef] [PubMed]
- Lewis, D.A.; Lieberman, J.A. Catching up on schizophrenia: Natural history and neurobiology. Neuron 2000, 28, 325–334. [Google Scholar] [CrossRef]
- Wahlberg, K.E.; Wynne, L.C.; Hakko, H.; Laksy, K.; Moring, J.; Miettunen, J.; Tienari, P. Interaction of genetic risk and adoptive parent communication deviance: Longitudinal prediction of adoptee psychiatric disorders. Psychol. Med. 2004, 34, 1531–1541. [Google Scholar] [CrossRef] [PubMed]
- Potkin, S.G.; Turner, J.A.; Brown, G.G.; McCarthy, G.; Greve, D.N.; Glover, G.H.; Manoach, D.S.; Belger, A.; Diaz, M.; Wible, C.G.; et al. Working memory and DLPFC inefficiency in schizophrenia: the FBIRN study. Schizophr. Bull. 2009, 35, 19–31. [Google Scholar] [CrossRef] [PubMed]
- Morgane, P.J.; Galler, J.R.; Mokler, D.J. A review of systems and networks of the limbic forebrain/limbic midbrain. Prog. Neurobiol. 2005, 75, 143–160. [Google Scholar] [CrossRef] [PubMed]
- Mattson, D.T.; Berk, M.; Lucas, M.D. A neuropsychological study of prefrontal lobe function in the positive and negative subtypes of schizophrenia. J. Genet. Psychol. 1997, 158, 487–494. [Google Scholar] [CrossRef] [PubMed][Green Version]
- Alvarez, J.A.; Emory, E. Executive function and the frontal lobes: A meta-analytic review. Neuropsychol. Rev. 2006, 16, 17–42. [Google Scholar] [CrossRef] [PubMed]
- Etkin, A.; Gyurak, A.; O’Hara, R. A neurobiological approach to the cognitive deficits of psychiatric disorders. Dialogues Clin. Neurosci. 2013, 15, 419–429. [Google Scholar] [PubMed]
- Green, M.F.; Kern, R.S.; Heaton, R.K. Longitudinal studies of cognition and functional outcome in schizophrenia: Implications for MATRICS. Schizophr. Res. 2004, 72, 41–51. [Google Scholar] [CrossRef] [PubMed]
- Carlsson, A.; Waters, N.; Waters, S.; Carlsson, M.L. Network interactions in schizophrenia—Therapeutic implications. Brain Res. Rev. 2000, 31, 342–349. [Google Scholar] [CrossRef]
- Coyle, J.T. The glutamatergic dysfunction hypothesis for schizophrenia. Harv. Rev. Psychiatry 1996, 3, 241–253. [Google Scholar] [CrossRef] [PubMed]
- Olney, J.W.; Newcomer, J.W.; Farber, N.B. NMDA receptor hypofunction model of schizophrenia. J. Psychiatr. Res. 1999, 33, 523–533. [Google Scholar] [CrossRef]
- Kantrowitz, J.; Javitt, D.C. Glutamatergic transmission in schizophrenia: From basic research to clinical practice. Curr. Opin. Psychiatry 2012, 25, 96–102. [Google Scholar] [CrossRef] [PubMed]
- Tsai, G.; Lane, H.Y.; Yang, P.; Chong, M.Y.; Lange, N. Glycine transporter I inhibitor, N-methylglycine (sarcosine), added to antipsychotics for the treatment of schizophrenia. Biol. Psychiatry 2004, 55, 452–456. [Google Scholar] [CrossRef] [PubMed]
- Lane, H.Y.; Chang, Y.C.; Liu, Y.C.; Chiu, C.C.; Tsai, G.E. Sarcosine or d-serine add-on treatment for acute exacerbation of schizophrenia: A randomized, double-blind, placebo-controlled study. Arch. Gen. Psychiatry 2005, 62, 1196–1204. [Google Scholar] [CrossRef] [PubMed]
- Lane, H.Y.; Lin, C.H.; Huang, Y.J.; Liao, C.H.; Chang, Y.C.; Tsai, G.E. A randomized, double-blind, placebo-controlled comparison study of sarcosine (N-methylglycine) and d-serine add-on treatment for schizophrenia. Int. J. Neuropsychopharmacol. 2010, 13, 451–460. [Google Scholar] [CrossRef] [PubMed]
- Amiaz, R.; Kent, I.; Rubinstein, K.; Sela, B.A.; Javitt, D.; Weiser, M. Safety, tolerability and pharmacokinetics of open label sarcosine added on to anti-psychotic treatment in schizophrenia–preliminary study. Isr. J. Psychiatry Relat. Sci. 2015, 52, 12–15. [Google Scholar] [PubMed]
- Singh, S.P.; Singh, V. Meta-analysis of the efficacy of adjunctive NMDA receptor modulators in chronic schizophrenia. CNS Drugs 2011, 25, 859–885. [Google Scholar] [CrossRef] [PubMed]
- Lane, H.Y.; Huang, C.L.; Wu, P.L.; Liu, Y.C.; Chang, Y.C.; Lin, P.Y.; Chen, P.W.; Tsai, G. Glycine transporter I inhibitor, N-methylglycine (sarcosine), added to clozapine for the treatment of schizophrenia. Biol. Psychiatry 2006, 60, 645–649. [Google Scholar] [CrossRef] [PubMed]
- Lane, H.Y.; Liu, Y.C.; Huang, C.L.; Chang, Y.C.; Liau, C.H.; Perng, C.H.; Tsai, G.E. Sarcosine (N-methylglycine) treatment for acute schizophrenia: A randomized, double-blind study. Biol. Psychiatry 2008, 63, 9–12. [Google Scholar] [CrossRef] [PubMed]
- Steen, R.G.; Hamer, R.M.; Lieberman, J.A. Measurement of brain metabolites by 1H magnetic resonance spectroscopy in patients with schizophrenia: A systematic review and meta-analysis. Neuropsychopharmacology 2005, 30, 1949–1962. [Google Scholar] [CrossRef] [PubMed]
- Brugger, S.; Davis, J.M.; Leucht, S.; Stone, J.M. Proton magnetic resonance spectroscopy and illness stage in schizophrenia—A systematic review and meta-analysis. Biol. Psychiatry 2011, 69, 495–503. [Google Scholar] [CrossRef] [PubMed]
- Kraguljac, N.V.; Reid, M.; White, D.; Jones, R.; den Hollander, J.; Lowman, D.; Lahti, A.C. Neurometabolites in schizophrenia and bipolar disorder—A systematic review and meta-analysis. Psychiatry Res. 2012, 203, 111–125. [Google Scholar] [CrossRef] [PubMed]
- Marsman, A.; van den Heuvel, M.P.; Klomp, D.W.; Kahn, R.S.; Luijten, P.R.; Hulshoff Pol, H.E. Glutamate in schizophrenia: A focused review and meta-analysis of ¹H-MRS studies. Schizophr. Bull. 2013, 39, 120–129. [Google Scholar] [CrossRef] [PubMed]
- Moffett, J.R.; Ross, B.; Arun, P.; Madhavarao, C.N.; Namboodiri, A.M. N-acetylaspartate in the CNS: From neurodiagnostics to neurobiology. Prog. Neurobiol. 2007, 81, 89–131. [Google Scholar] [CrossRef] [PubMed]
- Meyerhoff, D.J.; MacKay, S.; Bachman, L.; Poole, N.; Dillon, W.P.; Weiner, M.W.; Fein, G. Reduced brain N-acetylaspartate suggests neuronal loss in cognitively impaired human immunodeficiency virus-seropositive individuals: In vivo 1H magnetic resonance spectroscopic imaging. Neurology 1993, 43, 509–515. [Google Scholar] [CrossRef] [PubMed]
- Sager, T.N.; Topp, S.; Torup, L.; Hanson, L.G.; Egestad, B.; Moller, A. Evaluation of CA1 damage using single-voxel 1H-MRS and un-biased stereology: Can non-invasive measures of N-acetyl-asparate following global ischemia be used as a reliable measure of neuronal damage? Brain Res. 2001, 892, 166–175. [Google Scholar] [CrossRef]
- Bustillo, J.R.; Rowland, L.M.; Jung, R.; Brooks, W.M.; Qualls, C.; Hammond, R.; Hart, B.; Lauriello, J. Proton magnetic resonance spectroscopy during initial treatment with antipsychotic medication in schizophrenia. Neuropsychopharmacology 2008, 33, 2456–2466. [Google Scholar] [CrossRef] [PubMed]
- Mondino, M.; Brunelin, J.; Saoud, M. N-acetyl-aspartate level is decreased in the prefrontal cortex in subjects at-risk for schizophrenia. Front. Psychiatry 2013, 4, 99. [Google Scholar] [CrossRef] [PubMed]
- Fukuzako, H.; Kodama, S.; Fukuzako, T.; Yamada, K.; Doi, W.; Sato, D.; Takigawa, M. Subtype-associated metabolite differences in the temporal lobe in schizophrenia detected by proton magnetic resonance spectroscopy. Psychiatry Res. 1999, 92, 45–56. [Google Scholar] [CrossRef]
- Fukuzako, H. Heritability heightens brain metabolite differences in schizophrenia. J. Neuropsychiatry Clin. Neurosci. 2000, 12, 95–97. [Google Scholar] [CrossRef] [PubMed]
- Bartha, R.; Williamson, P.C.; Drost, D.J.; Malla, A.; Carr, T.J.; Cortese, L.; Canaran, G.; Rylett, R.J.; Neufeld, R.W. Measurement of glutamate and glutamine in the medial prefrontal cortex of never-treated schizophrenic patients and healthy controls by proton resonance spectroscopy. Arch. Gen. Psychiatry 1997, 54, 959–965. [Google Scholar] [CrossRef] [PubMed]
- Bartha, R.; Al-Semaan, Y.M.; Williamson, P.C.; Drost, D.J.; Malla, A.K.; Carr, T.J.; Densmore, M.; Canaran, G.; Neufeld, R.W. A short echo proton magnetic resonance spectroscopy study of the left mesial-temporal lobe in first-onset schizophrenic patients. Biol. Psychiatry 1999, 45, 1403–1411. [Google Scholar] [CrossRef]
- Bertolino, A.; Callicott, J.H.; Mattay, V.S.; Weidenhammer, K.M.; Rakow, R.; Egan, M.F.; Weinberger, D.R. The effect of treatment with antipsychotic drugs on brain N-acetylaspartate measures in patients with schizophrenia. Biol. Psychiatry 2001, 49, 39–46. [Google Scholar] [CrossRef]
- Bustillo, J.R.; Lauriello, J.; Rowland, L.M.; Thomson, L.M.; Petropoulos, H.; Hammond, R.; Hart, B.; Brooks, W.M. Longitudinal follow-up of neurochemical changes during the first year of antipsychotic treatment in schizophrenia patients with minimal previous medication exposure. Schizophr. Res. 2002, 58, 313–321. [Google Scholar] [CrossRef]
- Fannon, D.; Simmons, A.; Tennakoon, L.; O’Céallaigh, S.; Sumich, A.; Doku, V.; Shew, C.; Sharma, T. Selective deficit of hippocampal N-acetylaspartate in antipsychotic-naive patients with schizophrenia. Biol. Psychiatry 2003, 54, 587–598. [Google Scholar] [CrossRef]
- Callicot, J.H.; Bertolino, A.; Egan, M.F.; Egan, M.F.; Mattay, V.S.; Langheim, F.J.; Weinberger, D.R. Selective relationship between prefrontal N-acetylaspartate measures and negative symptoms in schizophrenia. Am. J. Psychiatry 2000, 157, 1646–1651. [Google Scholar] [CrossRef]
- Delamillieure, P.; Fernandez, J.; Constans, J.M.; Brazo, P.; Benali, K.; Abadie, P.; Vasse, T.; Thibaut, F.; Courthéoux, P.; Petit, M.; et al. Proton magnetic resonance spectroscopy of the medial prefrontal cortex in patients with deficit schizophrenia: Preliminary report. Am. J. Psychiatry 2000, 157, 641–643. [Google Scholar] [CrossRef] [PubMed]
- Tanaka, Y.; Obata, T.; Sassa, T.; Yoshitome, E.; Asai, Y.; Ikehira, H.; Suhara, T.; Okubo, Y.; Nishikawa, T. Quantitative magnetic resonance spectroscopy of schizophrenia: Relationship between decreased N-acetylaspartate and frontal lobe dysfunction. Psychiatry Clin. Neurosci. 2006, 60, 365–372. [Google Scholar] [CrossRef] [PubMed]
- Yamasue, H.C.; Fukui, T.; Fukuda, R.; Yamada, H.; Yamasaki, S.; Kuroki, N.; Abe, O.; Kasai, K.; Tsujii, K.; Iwanami, A.; et al. 1H-MR spectroscopy and gray matter volume of the anterior cingulate cortex in schizophrenia. Neuroreport 2002, 13, 2133–2137. [Google Scholar] [CrossRef]
- Szulc, A.; Galińska, B.; Tarasów, E.; Dzienis, W.; Kubas, B.; Konarzewska, B.; Walecki, J.; Alathiaki, A.S.; Czernikiewicz, A. The effect of risperidone on metabolite measures in the frontal lobe, temporal lobe, and thalamus in schizophrenic patients: A proton magnetic resonance spectroscopy (1H MRS). Pharmacopsychiatry 2005, 38, 214–219. [Google Scholar] [CrossRef]
- Braus, D.F.; Ende, G.; Weber-Fahr, W.; Demirakca, T.; Tost, H.; Henn, F.A. Functioning and neuronal viability of the anterior cingulate neurons following antipsychotic treatment: MR-spectroscopic imaging in chronic schizophrenia. Eur. Neuropsychopharmacol. 2002, 12, 145–152. [Google Scholar] [CrossRef]
- Braus, D.F.; Ende, G.; Weber-Fahr, W.; Demirakca, T.; Henn, F.A. Favorable effect on neuronal viability in the anterior cingulate gyrus due to long-term treatment with atypical antipsychotics: An MRSI study. Pharmacopsychiatry 2001, 34, 251–253. [Google Scholar] [CrossRef] [PubMed]
- Szulc, A.; Galińska, B.; Tarasów, E.; Kubas, B.; Dzienis, W.; Konarzewska, B.; Poplawska, R.; Tomczak, A.A.; Czernikiewicz, A.; Walecki, J. N-acetylaspartate (NAA) levels in selected areas of the brain in patients with chronic schizophrenia treated with typical and atypical neuroleptics: A proton magnetic resonance spectroscopy (1H-MRS) study. Med. Sci. Monit. 2007, 13, 17–22. [Google Scholar] [PubMed]
- Moreno, A.; Ross, B.D.; Bluml, S. Direct determination of the N-acetyl-l-aspartate synthesis rate in the human brain by 13C MRS and [1-13C] glucose infusion. J. Neurochem. 2001, 77, 347–350. [Google Scholar] [CrossRef] [PubMed]
- Szulc, A.; Konarzewska, B.; Galińska-Skok, B.; Łazarczyk, J.; Waszkiewicz, N.; Tarasów, E.; Milewski, R.; Walecki, J. Proton magnetic resonance spectroscopy measures related to short-term symptomatic outcome in chronic schizophrenia. Neurosci. Lett. 2013, 547, 37–41. [Google Scholar] [CrossRef] [PubMed]
- Lisman, J.E.; Coyle, J.T.; Green, R.W.; Javitt, D.C.; Benes, F.M.; Heckers, S.; Grace, A.A. Circuit-based framework for understanding neurotransmitter and risk gene interactions in schizophrenia. Trends Neurosci. 2008, 31, 234–242. [Google Scholar] [CrossRef] [PubMed]
- Bitanihirwe, B.K.; Lim, M.P.; Kelley, J.F.; Kaneko, T.; Woo, T.U. Glutamatergic deficits and parvalbumin-containing inhibitory neurons in the prefrontal cortex in schizophrenia. BMC Psychiatry 2009, 9, 71. [Google Scholar] [CrossRef] [PubMed]
- Fox, M.D.; Raichle, M.E. Spontaneous fluctuations in brain activity observed with functional magnetic resonance imaging. Nat. Neurosci. Rev. 2007, 8, 700–711. [Google Scholar] [CrossRef] [PubMed]
- Gonzalez-Burgos, G.; Lewis, D.A. NMDA receptor hypofunction, parvalbumin-positive neurons, and cortical γ oscillations in schizophrenia. Schizophr. Bull. 2012, 38, 950–957. [Google Scholar] [CrossRef] [PubMed]
- Carlén, M.; Meletis, K.; Siegle, J.H.; Cardin, J.A.; Futai, K.; Vierling-Claassen, D.; Rühlmann, C.; Jones, S.R.; Deisseroth, K.; Sheng, M.; et al. A critical role for NMDA receptors in parvalbumin interneurons for γ rhythm induction and behavior. Mol. Psychiatry 2012, 17, 537–548. [Google Scholar] [CrossRef] [PubMed]
- Kocsis, B. Differential role of NR2A and NR2B subunits in N-methyl-d-aspartate receptor antagonist-induced aberrant cortical γ oscillations. Biol. Psychiatry 2012, 71, 987–995. [Google Scholar] [CrossRef] [PubMed]
- Fornito, A.; Harrison, B.J.; Zalesky, A.; Simons, J.S. Competitive and cooperative dynamics of large-scale brain functional networks supporting recollection. Proc. Natl. Acad. Sci. USA 2012, 109, 12788–12793. [Google Scholar] [CrossRef] [PubMed]
- Garrity, A.G.; Pearlson, G.D.; McKiernan, K.; Lloyd, D.; Kiehl, K.A.; Calhoun, V.D. Aberrant “default mode” functional connectivity in schizophrenia. Am. J. Psychiatry 2007, 164, 450–457. [Google Scholar] [CrossRef] [PubMed]
- Landin-Romero, R.; McKenna, P.J.; Salgado-Pineda, P.; Sarró, S.; Aguirre, C.; Sarri, C.; Compte, A.; Bosque, C.; Blanch, J.; Salvador, R.; et al. Failure of deactivation in the default mode network: A trait marker for schizophrenia? Psychol. Med. 2015, 45, 1315–1325. [Google Scholar] [CrossRef] [PubMed]
- Cohen, S.M.; Tsien, R.W.; Goff, D.C.; Halassa, M.M. The impact of NMDA receptor hypofunction on GABAergic neurons in the pathophysiology of schizophrenia. Schizophr. Res. 2015. [Google Scholar] [CrossRef] [PubMed]
- Meda, S.A.; Ruaño, G.; Windemuth, A.; O’Neil, K.; Berwise, C.; Dunn, S.M.; Boccaccio, L.E.; Narayanan, B.; Kocherla, M.; Sprooten, E.; et al. Multivariate analysis reveals genetic associations of the resting default mode network in psychotic bipolar disorder and schizophrenia. Proc. Natl. Acad. Sci. USA 2014, 111, E2066–E2075. [Google Scholar] [CrossRef] [PubMed]
- Dodell-Feder, D.; Delisi, L.E.; Hooker, C.I. The relationship between default mode network connectivity and social functioning in individuals at familial high-risk for schizophrenia. Schizophr. Res. 2014, 156, 87–95. [Google Scholar] [CrossRef] [PubMed]
- Poels, E.M.P.; Kegeles, L.S.; Kantrowitz, J.T.; Javitt, D.C.; Lieberman, J.A.; Abi-Dargham, A.; Girgis, R.R. Glutamatergic abnormalities in schizophrenia: A review of proton MRS findings. Schizophr. Res. 2014, 152, 325–332. [Google Scholar] [CrossRef] [PubMed]
- Kegeles, L.S.; Mao, X.; Stanford, A.D.; Girgis, R.; Ojeil, N.; Xu, X.; Gil, R.; Slifstein, M.; Abi-Dargham, A.; Lisanby, S.H.; et al. Elevated prefrontal cortex γ-aminobutyric acid and glutamate-glutamine levels in schizophrenia measured in vivo with proton magnetic resonance spectroscopy. Arch. Gen. Psychiatry 2012, 69, 449–459. [Google Scholar] [PubMed]
- Stanley, J.A.; Williamson, P.C.; Drost, D.J.; Rylett, R.J.; Carr, T.J.; Malla, A.; Thompson, R.T. An in vivo proton magnetic resonance spectroscopy study of schizophrenia patients. Schizophr. Bull. 1996, 22, 597–609. [Google Scholar] [CrossRef] [PubMed]
- Goto, N.; Yoshimura, R.; Kakeda, S.; Nishimura, J.; Moriya, J.; Hayashi, K.; Katsuki, A.; Hori, H.; Umene-Nakano, W.; Ikenouchi-Sugita, A.; et al. Six-month treatment with atypical antipsychotic drugs decreased frontal-lobe levels of glutamate plus glutamine in early-stage first-episode schizophrenia. Neuropsychiatr. Dis. Treat. 2012, 8, 119–122. [Google Scholar] [PubMed]
- Szulc, A.; Galińska, B.; Tarasów, E.; Waszkiewicz, N.; Konarzewska, B.; Poplawska, R.; Bibułowicz, D.; Simonienko, K.; Walecki, J. Proton magnetic resonance spectroscopy study of brain metabolite changes after antipsychotic treatment. Pharmacopsychiatry 2011, 44, 148–157. [Google Scholar] [CrossRef] [PubMed]
- Stone, J.; Dietrich, C.; Edden, R.; Mehta, M.A.; de Simoni, S.; Reed, L.J.; Krystal, J.H.; Nutt, D.; Barker, G.J. Ketamine effects on brain GABA and glutamate levels with 1H-MRS: Relationship to ketamine-induced psychopathology. Mol. Psychiatry 2012, 17, 664–665. [Google Scholar] [CrossRef] [PubMed]
- Rowland, L.M.; Bustillo, J.R.; Mullins, P.G.; Jung, R.E.; Lenroot, R.; Landgraf, E.; Barrow, R.; Yeo, R.; Lauriello, J.; Brooks, W.M. Effects of ketamine on anterior cingulate glutamate metabolism in healthy humans: A 4-T proton MRS study. Am. J. Psychiatry 2005, 162, 394–396. [Google Scholar] [CrossRef] [PubMed]
- Ohrmann, P.; Siegmund, A.; Suslow, T.; Spitzberg, K.; Kersting, A.; Arolt, V.; Heindel, W.; Pfleiderer, B. Evidence for glutamatergic neuronal dysfunction in the prefrontal cortex in chronic but not in first-episode patients with schizophrenia: A proton magnetic resonance spectroscopy study. Schizophr. Res. 2005, 73, 153–157. [Google Scholar] [CrossRef] [PubMed]
- Yoo, S.Y.; Yeon, S.; Choi, C.H.; Kang, D.H.; Lee, J.M.; Shin, N.Y.; Jung, W.H.; Choi, J.S.; Jang, D.P.; Kwon, J.S. Proton magnetic resonance spectroscopy in subjects with high genetic risk of schizophrenia: Investigation of anterior cingulate, dorsolateral prefrontal cortex and thalamus. Schizophr. Res. 2009, 111, 86–93. [Google Scholar] [CrossRef] [PubMed]
- Szulc, A.; Galińska-Skok, B.; Tarasów, E.; Konarzewska, B.; Waszkiewicz, N.; Hykiel, R.; Walecki, J. Clinical and cognitive correlates of the proton magnetic resonance spectroscopy measures in chronic schizophrenia. Med. Sci. Monit. 2012, 18, CR390–CR398. [Google Scholar] [CrossRef]
- Bustillo, J.R. Use of proton magnetic resonance spectroscopy in the treatment of psychiatric disorders: A critical update. Dialogues Clin. Neurosci. 2013, 15, 329–337. [Google Scholar] [PubMed]
- Wood, S.J.; Berger, G.E.; Wellard, R.M.; Proffitt, T.; McConchie, M.; Velakoulis, D.; McGorry, P.D.; Pantelis, C. A 1H-MRS investigation of the medial temporal lobe in antipsychotic-naive and early-treated first episode psychosis. Schizophr. Res. 2008, 102, 163–170. [Google Scholar] [CrossRef] [PubMed]
- Moraga-Amaro, R.; Jerez-Baraona, J.M.; Simon, F.; Stehberg, J. Role of astrocytes in memory and psychiatric disorders. J. Physiol. Paris 2014, 108, 240–251. [Google Scholar] [CrossRef] [PubMed]
- Marsman, A.; Mandl, R.C.W.; Klomp, D.W.J.; Bohlken, M.M.; Boer, V.O.; Andreychenko, A.; Cahn, W.; Kahn, R.S.; Luijten, P.R.; Hulshoff Pol, H.E. GABA and glutamate in schizophrenia: A 7 T 1H-MRS study. NeuroImage Clin. 2014, 6, 398–407. [Google Scholar] [CrossRef] [PubMed]
- Schwerk, A.; Alves, F.D.; Pouwels, P.J.; van Amelsvoort, T. Metabolic alterations associated with schizophrenia: A critical evaluation of proton magnetic resonance spectroscopy studies. J. Neurochem. 2014, 128, 1–87. [Google Scholar] [CrossRef] [PubMed]
- Singh, S.P.; Singh, V.; Kar, N.; Chan, K. Efficacy of antidepressants in treating the negative symptoms of chronic schizophrenia: Meta-analysis. Br. J. Psychiatry 2010, 197, 174–179. [Google Scholar] [CrossRef] [PubMed]
- Kay, S.R.; Fiszbein, A.; Opfer, L.A. The positive and negative syndrome scale (PANSS) for schizophrenia. Schizophr. Bull. 1987, 13, 261–276. [Google Scholar] [CrossRef] [PubMed]
© 2015 by the authors; licensee MDPI, Basel, Switzerland. This article is an open access article distributed under the terms and conditions of the Creative Commons Attribution license (http://creativecommons.org/licenses/by/4.0/).
Share and Cite
Strzelecki, D.; Podgórski, M.; Kałużyńska, O.; Stefańczyk, L.; Kotlicka-Antczak, M.; Gmitrowicz, A.; Grzelak, P. Adding Sarcosine to Antipsychotic Treatment in Patients with Stable Schizophrenia Changes the Concentrations of Neuronal and Glial Metabolites in the Left Dorsolateral Prefrontal Cortex. Int. J. Mol. Sci. 2015, 16, 24475-24489. https://doi.org/10.3390/ijms161024475
Strzelecki D, Podgórski M, Kałużyńska O, Stefańczyk L, Kotlicka-Antczak M, Gmitrowicz A, Grzelak P. Adding Sarcosine to Antipsychotic Treatment in Patients with Stable Schizophrenia Changes the Concentrations of Neuronal and Glial Metabolites in the Left Dorsolateral Prefrontal Cortex. International Journal of Molecular Sciences. 2015; 16(10):24475-24489. https://doi.org/10.3390/ijms161024475
Chicago/Turabian StyleStrzelecki, Dominik, Michał Podgórski, Olga Kałużyńska, Ludomir Stefańczyk, Magdalena Kotlicka-Antczak, Agnieszka Gmitrowicz, and Piotr Grzelak. 2015. "Adding Sarcosine to Antipsychotic Treatment in Patients with Stable Schizophrenia Changes the Concentrations of Neuronal and Glial Metabolites in the Left Dorsolateral Prefrontal Cortex" International Journal of Molecular Sciences 16, no. 10: 24475-24489. https://doi.org/10.3390/ijms161024475
APA StyleStrzelecki, D., Podgórski, M., Kałużyńska, O., Stefańczyk, L., Kotlicka-Antczak, M., Gmitrowicz, A., & Grzelak, P. (2015). Adding Sarcosine to Antipsychotic Treatment in Patients with Stable Schizophrenia Changes the Concentrations of Neuronal and Glial Metabolites in the Left Dorsolateral Prefrontal Cortex. International Journal of Molecular Sciences, 16(10), 24475-24489. https://doi.org/10.3390/ijms161024475