
Enhanced Bio-Ethanol Production from Industrial Potato Waste by Statistical Medium Optimization


Abstract
:
1. Introduction
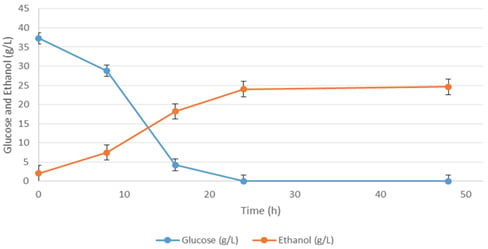
2. Results
2.1. Effects of Medium Components on Ethanol Production

| Variable | Lower Level | High Level | Reference |
|---|---|---|---|
| Yeast Extract (g/L) | 0.5 | 5 | [22] |
| Malt Extract (g/L) | 2 | 20 | [23] |
| (NH4)2SO4 (g/L) | 2 | 6 | [8] |
| MgSO4·7H2O (g/L) | 0.2 | 2 | [24] |
| KH2PO4 (g/L) | 0.5 | 3 | [8] |
| CaCO3 (g/L) | 0.2 | 2 | [25] |
| FeSO4·7H2O (g/L) | 0.01 | 0.1 | [26] |
| CaCl2·2H2O (g/L) | 0.3 | 3 | [26] |
| Medium Number | Yeast Extract (g/L) | Malt Extract (g/L) | MgSO4·7H2O (g/L) | (NH4)2SO4 (g/L) | KH2PO4 (g/L) | CaCO3 (g/L) | FeSO4·7H2O (g/L) | CaCl2·2H2O (g/L) | Ethanol (g/L) |
|---|---|---|---|---|---|---|---|---|---|
| 1 | 5 | 20 | 2 | 2 | 3 | 2 | 0.01 | 3 | 33.5 |
| 2 | 0.5 | 2 | 0.2 | 6 | 3 | 2 | 0.01 | 3 | 5.05 |
| 3 | 0.5 | 20 | 2 | 6 | 0.5 | 2 | 0.1 | 0.3 | 36.85 |
| 4 | 0.5 | 20 | 0.2 | 2 | 0.5 | 2 | 0.1 | 3 | 15.9 |
| 5 | 5 | 2 | 2 | 6 | 0.5 | 2 | 0.01 | 0.3 | 31.45 |
| 6 | 5 | 2 | 2 | 2 | 0.5 | 0.2 | 0.1 | 3 | 36.8 |
| 7 | 0.5 | 2 | 2 | 6 | 3 | 0.2 | 0.1 | 3 | 8.36 |
| 8 | 5 | 20 | 0.2 | 6 | 3 | 0.2 | 0.1 | 0.3 | 31.95 |
| 9 | 5 | 20 | 0.2 | 6 | 0.5 | 0.2 | 0.01 | 3 | 30.45 |
| 10 | 0.5 | 20 | 2 | 2 | 3 | 0.2 | 0.01 | 0.3 | 29.8 |
| 11 | 5 | 2 | 0.2 | 2 | 3 | 2 | 0.1 | 0.3 | 31.2 |
| 12 | 0.5 | 2 | 0.2 | 2 | 0.5 | 0.2 | 0.01 | 0.3 | 14.15 |
| Variables | Main Effect | β-Coefficients | f-Value | p-Value |
|---|---|---|---|---|
| Yeast Extract (g/L) | 14.206 | 7.103 | 71.87 | 0.000 |
| Malt Extract (g/L) | 8.573 | 4.286 | 26.17 | 0.000 |
| (NH4)2SO4 (g/L) | −2.873 | −1.436 | 2.94 | 0.109 |
| MgSO4·7H2O (g/L) | 8.009 | 4.004 | 22.84 | 0.000 |
| KH2PO4 (g/L) | −4.289 | −2.144 | 6.55 | 0.023 |
| CaCO3 (g/L) | 0.407 | 0.203 | 0.06 | 0.811 |
| FeSO4·7H2O (g/L) | 2.776 | 1.388 | 2.74 | 0.120 |
| CaCl2·2H2O (g/L) | −7.556 | −3.778 | 20.33 | 0.000 |
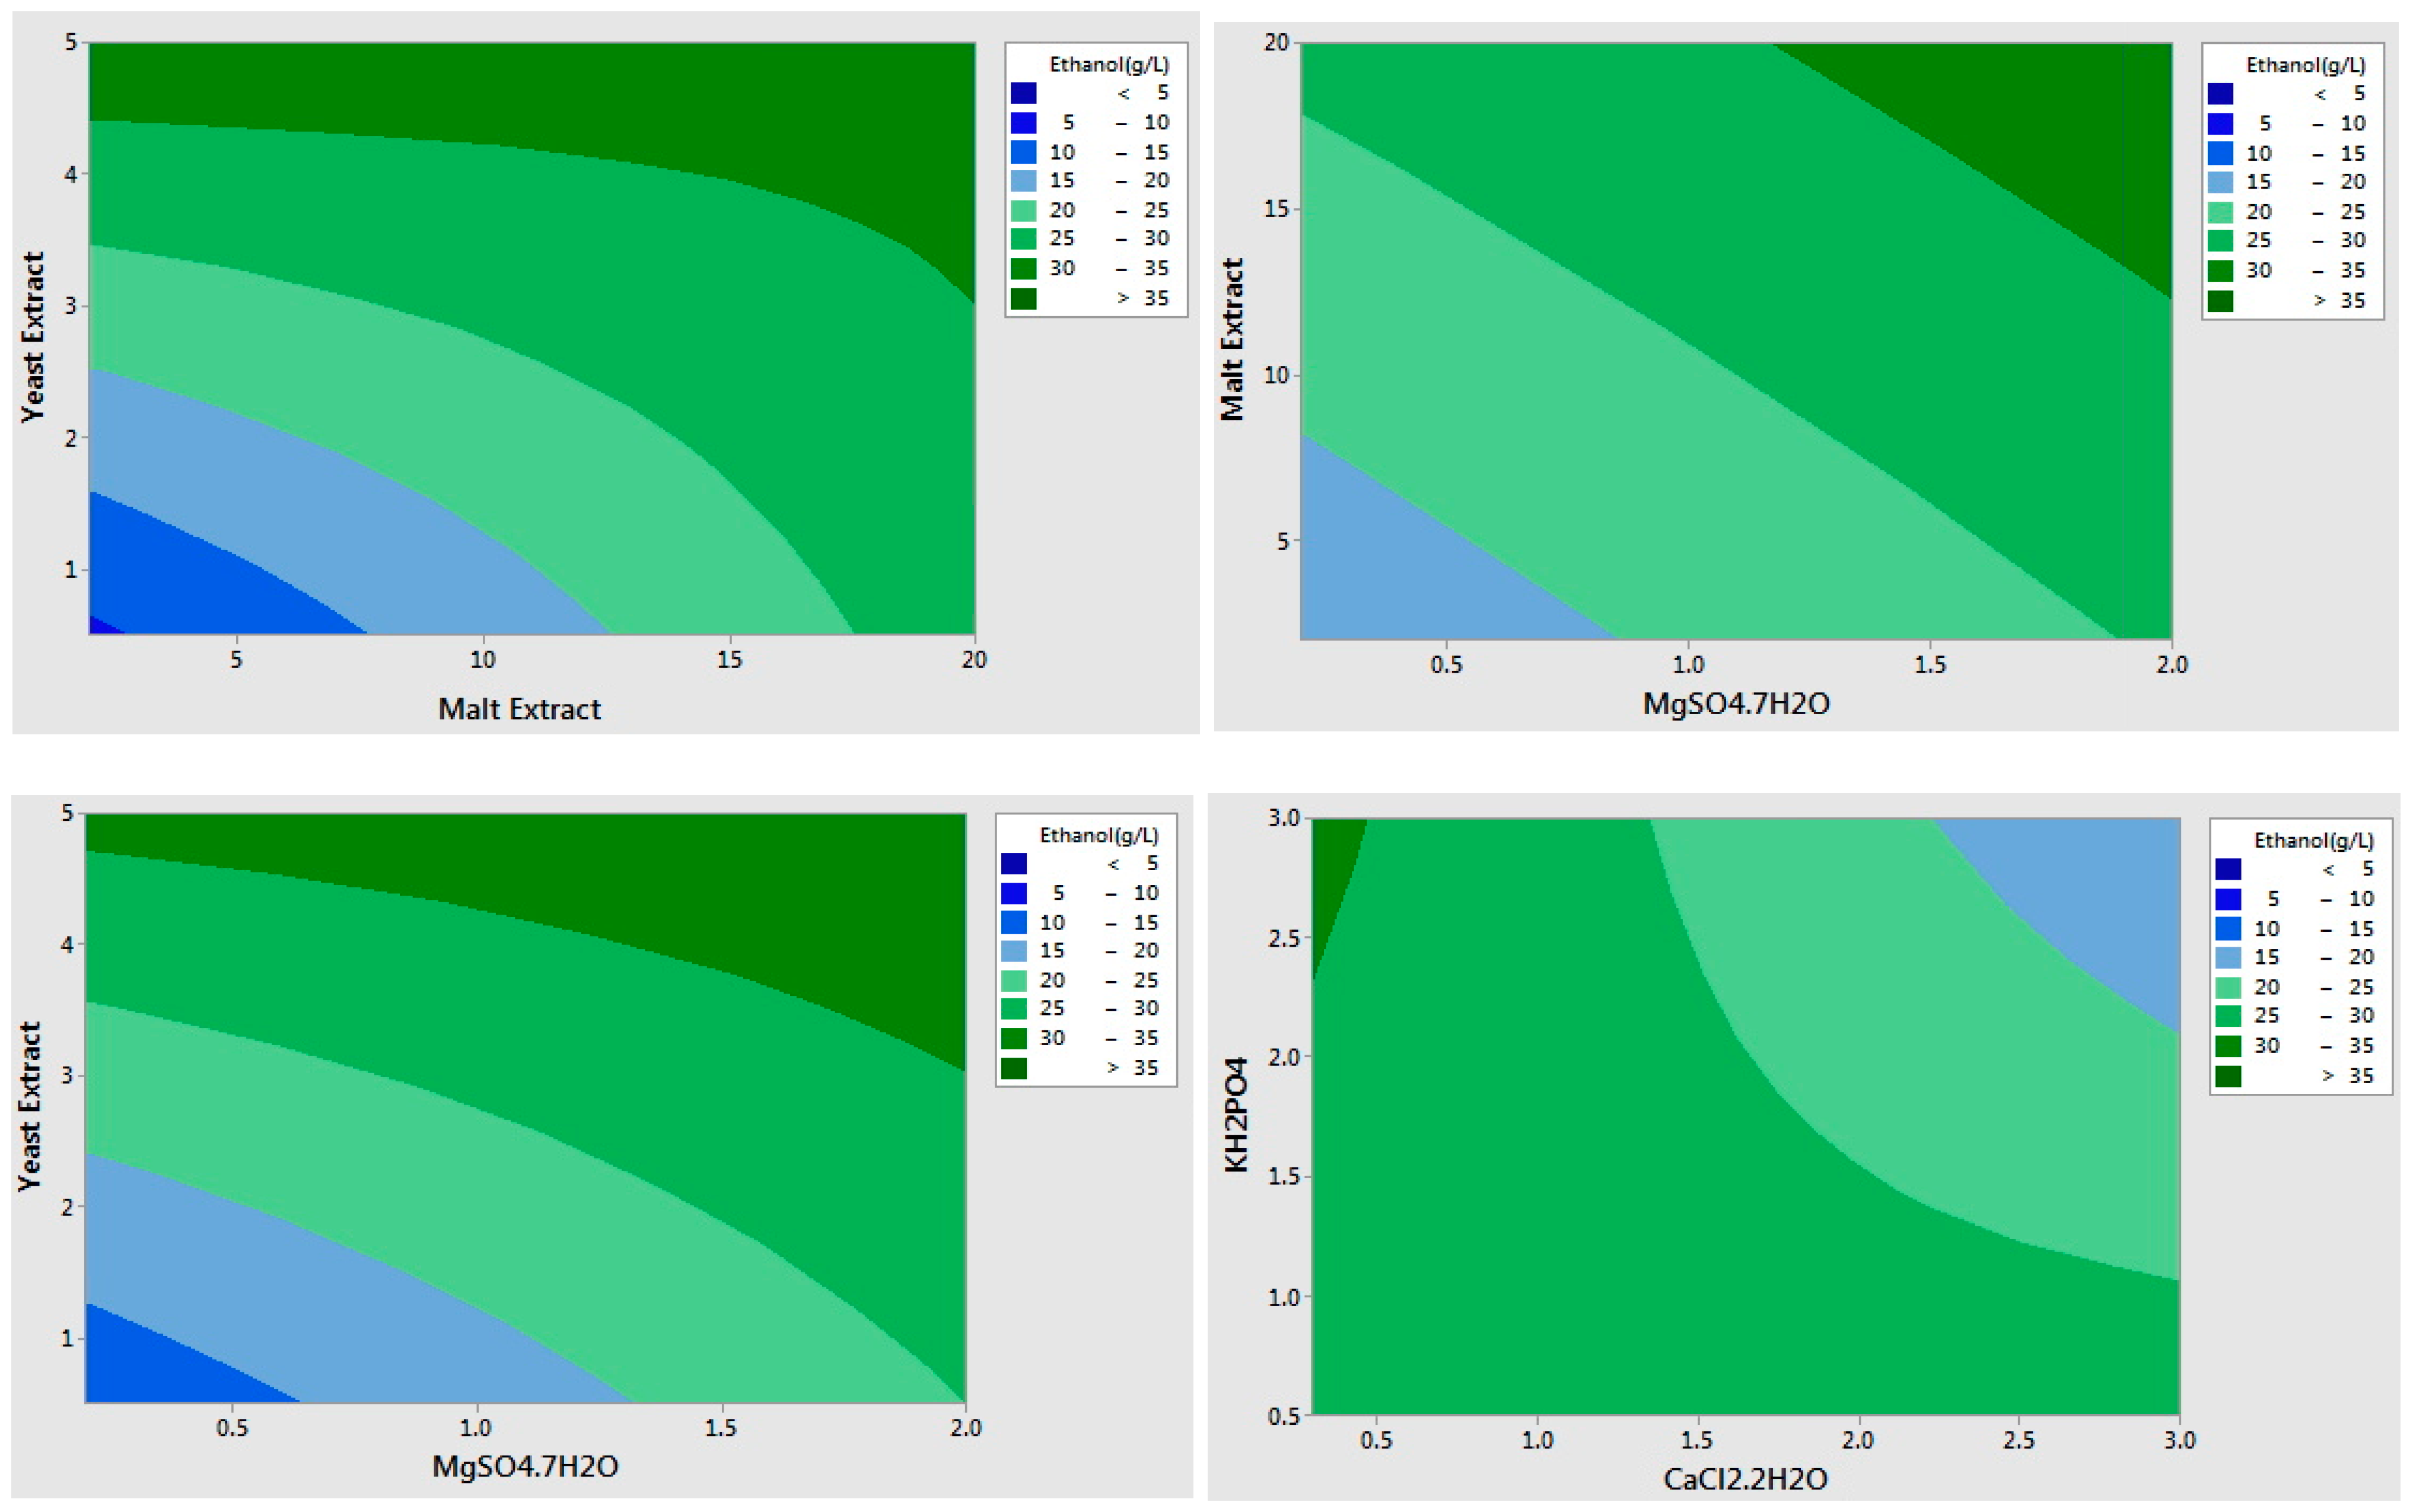
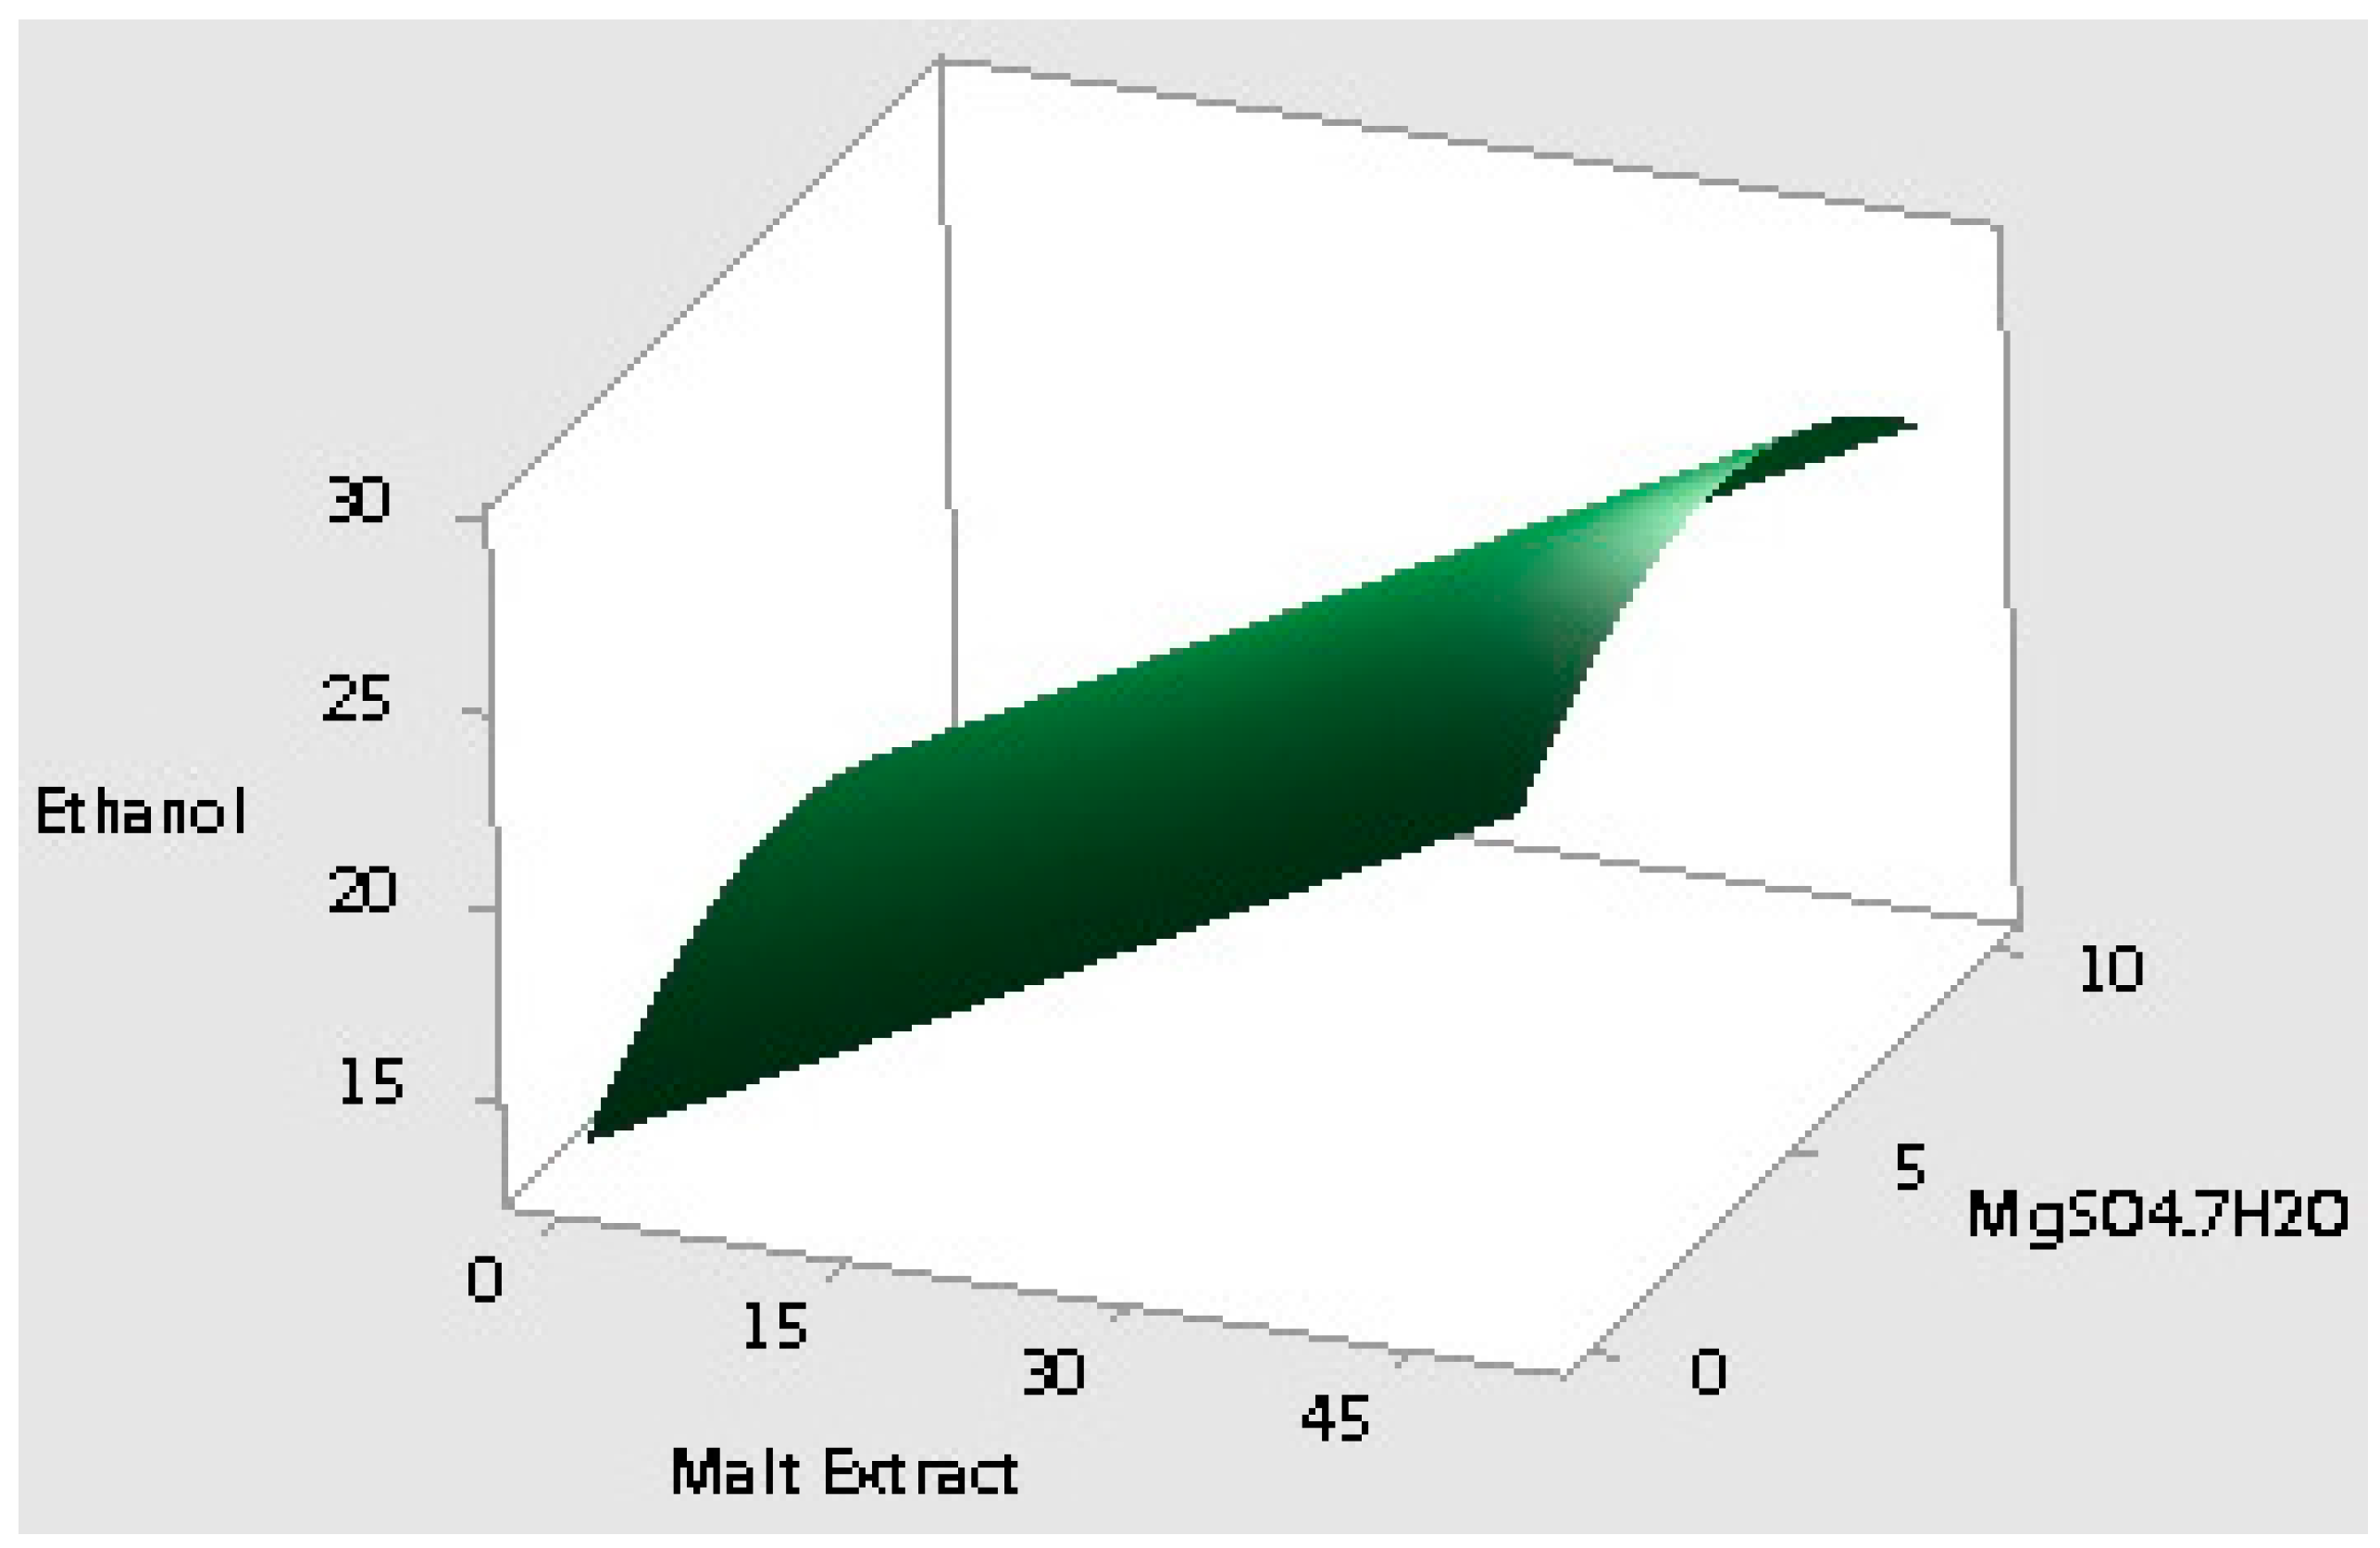
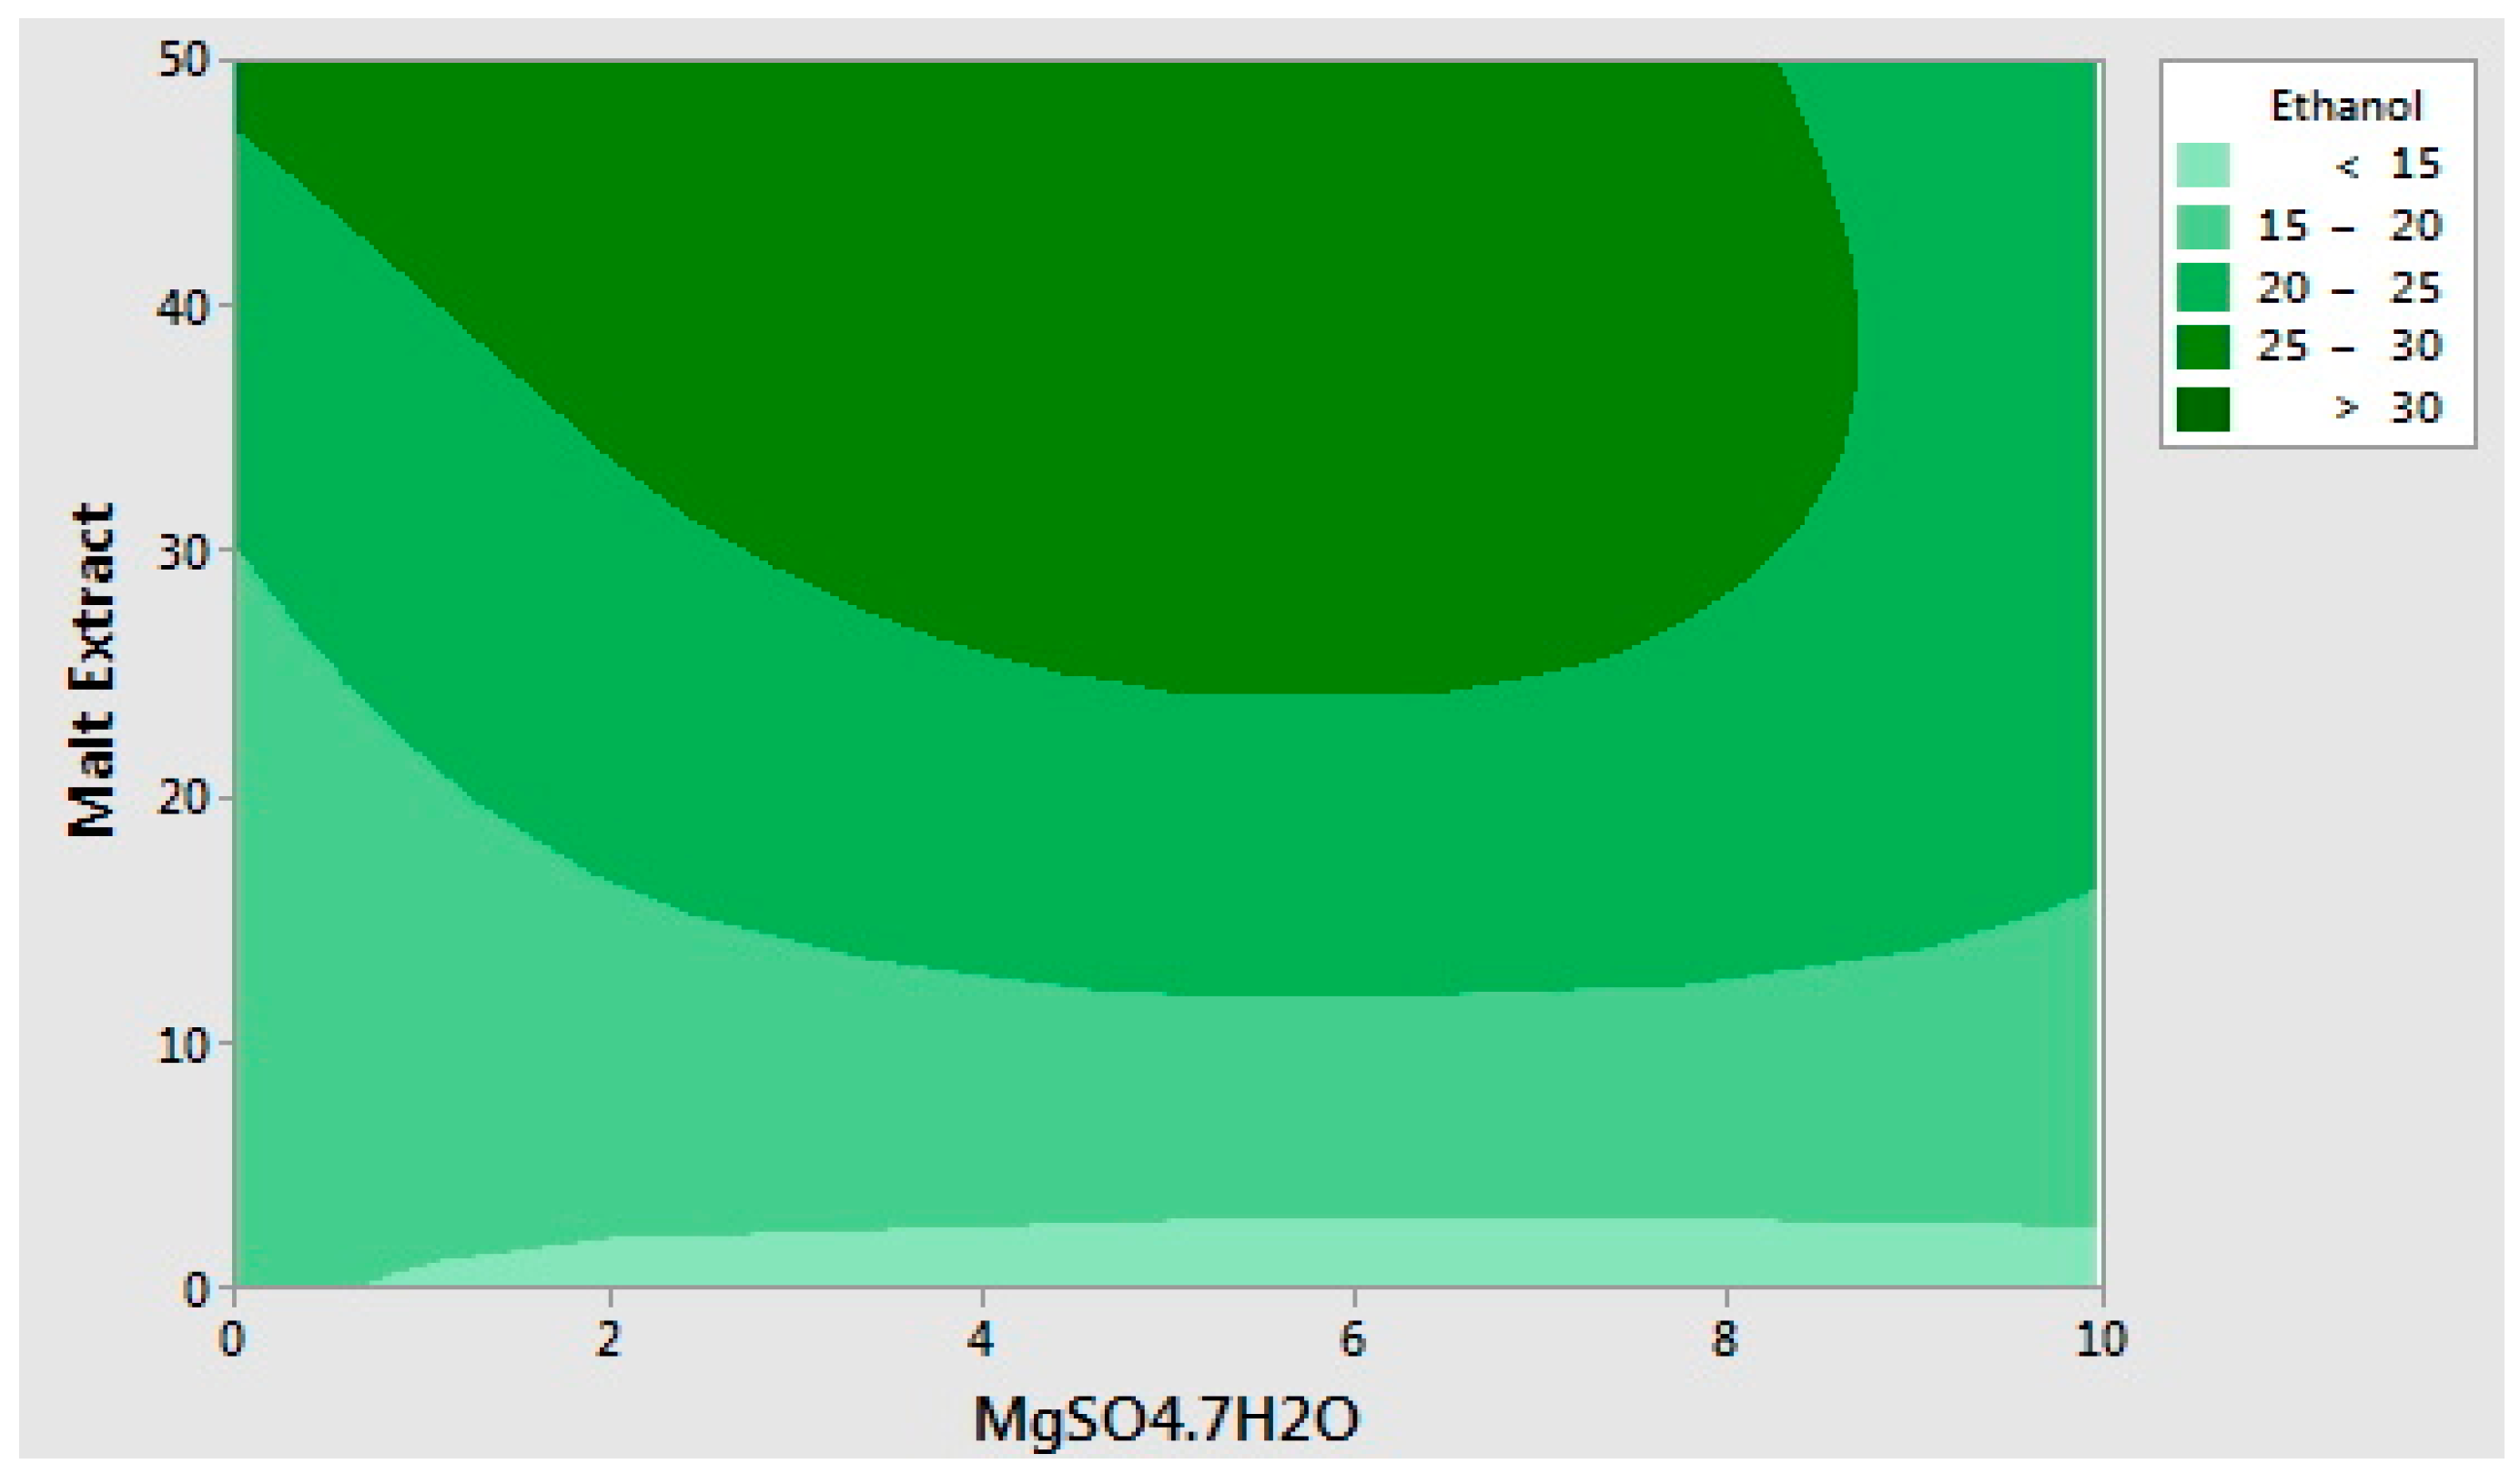
2.2. Optimization of the Selected Medium Components Using Response Surface Methodology
| Run Order | Yeast Extract (g/L) | Malt Extract (g/L) | MgSO4·7H2O (g/L) | Ethanol (g/L) | Cell Population (log CFU/mL) |
|---|---|---|---|---|---|
| 1 | 25 | 25 | 10 | 22.95 | 7.14 |
| 2 | 12.5 | 50 | 0 | 26.01 | 7.15 |
| 3 | 0 | 0 | 5 | 13.77 | 6.02 |
| 4 | 12.5 | 25 | 5 | 22.37 | 7.19 |
| 5 | 25 | 50 | 5 | 26.21 | 7.13 |
| 6 | 12.5 | 25 | 5 | 24.71 | 7.26 |
| 7 | 0 | 25 | 0 | 18.83 | 6.82 |
| 8 | 25 | 25 | 0 | 18.85 | 7.00 |
| 9 | 0 | 25 | 10 | 20.50 | 7.16 |
| 10 | 12.5 | 25 | 5 | 28.59 | 5.95 |
| 11 | 12.5 | 0 | 0 | 15.41 | 6.10 |
| 12 | 25 | 0 | 5 | 12.93 | 6.02 |
| 13 | 12.5 | 50 | 10 | 20.57 | 7.05 |
| 14 | 12.5 | 0 | 10 | 13.86 | 6.19 |
| 15 | 0 | 50 | 5 | 32.52 | 7.07 |

| Media | Ingredient Name | Ingredient Concentration (g/L) | Ethanol (g/L) |
|---|---|---|---|
| Basal | Waste potato mash | 40.4 (dry weight) | 11.63 |
| Basal Plackett-Burman validation media | Waste potato mash | 40.4 (dry weight) | 17.03 |
| Yeast Extract | 5 | ||
| Malt Extract | 20 | ||
| MgSO4·7H2O | 2 | ||
| Response Surface validation media | Waste potato mash | 40.4 (dry weight) | 24.6 |
| Yeast Extract | 0 | ||
| Malt Extract | 50 | ||
| MgSO4·7H2O | 4.84 |
3. Discussion
4. Experimental Section
4.1. Microorganisms and Inoculum Preparation
4.2. Industrial Waste Potato Mash
4.3. Hydrolysis of Starch
4.4. Experimental Design
4.4.1. Plackett-Burman Design
4.4.2. Response Surface Methodology
4.5. Analysis
4.5.1. Ethanol and Glucose
4.5.2. Microbial Cell Population
4.5.3. Dry Weight Analysis
5. Conclusions
Acknowledgments
Author Contributions
Conflicts of Interest
References
- Renewable Fuels Association, Ethanol Industry Outlook 2008–2014 reports. Available online: www.ethanolrfa.org/pages/annual-industry-outlook (accessed on 16 June 2015).
- Ho, D.P.; Ngo, H.H.; Guo, W. A mini review on renewable sources for biofuel. Bioresour. Technol. 2014, 169, 742–749. [Google Scholar] [CrossRef] [PubMed]
- Hashem, M.; Darwish, S.M.I. Production of bioethanol and associated by-products from potato starch residue stream by Saccharomyces cerevisiae. Biomass Bioenergy 2010, 34, 953–959. [Google Scholar] [CrossRef]
- Gassara, F.; Brar, S.K.; Tyagi, R.D.; Verma, M.; Surampalli, R.Y. Screening of agro-industrial wastes to produce ligninolytic enzymes by Phanerochaete chrysosporium. Biochem. Eng. J. 2010, 49, 388–394. [Google Scholar] [CrossRef]
- Charmley, E.; Nelson, D.; Zvomuya, F. Nutrient cycling in the vegetable processing industry: Utilization of potato by-products. Can. J. Soil Sci. 2006, 86, 621–629. [Google Scholar] [CrossRef]
- Oda, Y.; Saito, K.; Yamauchi, H.; Mori, M. Lactic acid fermentation of potato pulp by the fungus Rhizopus oryzae. Curr. Microbiol. 2002, 45, 1–4. [Google Scholar] [CrossRef] [PubMed]
- Liimatainen, H.; Kuokkanen, T.; Kääriäinen, J. Development of bio-ethanol production from waste potatoes. In Proceedings of the Waste Minimization and Resources Use Optimization Conference, Oulu, Finland, 10 June 2004; Pongrácz, E., Ed.; Oulu University Press: University of Oulu, Oulu, Finland, 2004; pp. 123–129. [Google Scholar]
- Arapoglou, D.; Varzakas, T.; Vlyssides, A.; Israilides, C. Ethanol production from potato peel waste (PPW). Waste Manag. 2010, 30, 1898–1902. [Google Scholar] [CrossRef] [PubMed]
- Fadel, M. Alcohol Production From Potato Industry Starchy Waste. Egypt. J. Microbiol. 2000, 35, 273–287. [Google Scholar]
- Huang, L.P.; Jin, B.; Lant, P.; Zhou, J. Simultaneous saccharification and fermentation of potato starch wastewater to lactic acid by Rhizopus oryzae and Rhizopus arrhizus. Biochem. Eng. J. 2005, 23, 265–276. [Google Scholar] [CrossRef]
- Barnett, C.; Smith, A.; Scanlon, B.; Israilides, C.J. Pullulan production by Aureobasidium pullulans growing on hydrolysed potato starch waste. Carbohydr. Polym. 1999, 38, 203–209. [Google Scholar] [CrossRef]
- Uncu, O.N.; Cekmecelioglu, D. Cost-effective approach to ethanol production and optimization by response surface methodology. Waste Manag. 2011, 31, 636–643. [Google Scholar] [CrossRef] [PubMed]
- Yan, S.; Li, J.; Chen, X.; Wu, J.; Wang, P.; Ye, J.; Yao, J. Enzymatical hydrolysis of food waste and ethanol production from the hydrolysate. Renew. Energy 2011, 36, 1259–1265. [Google Scholar] [CrossRef]
- Oberoi, H.S.; Vadlani, P.V.; Saida, L.; Bansal, S.; Hughes, J.D. Ethanol production from banana peels using statistically optimized simultaneous saccharification and fermentation process. Waste Manag. 2011, 31, 1576–1584. [Google Scholar] [CrossRef] [PubMed]
- Turhan, I.; Bialka, K.L.; Demirci, A.; Karhan, M. Ethanol production from carob extract by using Saccharomyces cerevisiae. Bioresour. Technol. 2010, 101, 5290–5296. [Google Scholar] [CrossRef] [PubMed]
- Tanaka, K.; Hilary, Z.D.; Ishizaki, A. Investigation of the utility of pineapple juice and pineapple waste material as low-cost substrate for ethanol fermentation by Zymomonas mobilis. J. Biosci. Bioeng. 1999, 87, 642–646. [Google Scholar] [CrossRef]
- Georgieva, T.I.; Ahring, B.K. Potential of agroindustrial waste from olive oil industry for fuel ethanol production. Biotechnol. J. 2007, 2, 1547–1555. [Google Scholar] [CrossRef] [PubMed]
- Rani, P.; Sharma, S.; Garg, F.C.; Raj, K.; Wati, L. Ethanol Production from Potato Flour by Saccharomyces cerevisiae. Indian J. Sci. Technol. 2010, 3, 733–736. [Google Scholar]
- Izmirlioglu, G.; Demirci, A. Ethanol Production from Waste Potato Mash by Using Saccharomyces Cerevisiae. Appl. Sci. 2012, 2, 738–753. [Google Scholar] [CrossRef]
- Plackett, R.L.; Burman, J.P. Design of optimum multifactorial experiments. Biometrika 1946, 33, 305–325. [Google Scholar] [CrossRef]
- Box, G.E.P.; Behnken, D. Some new three level designs for the study of quantative variables. Technometrics 1960, 2, 455–475. [Google Scholar] [CrossRef]
- Demirci, A.; Pometto, A.L.; Ho, K.L. Ethanol production by Saccharomyces cerevisiae in biofilm reactors. J. Ind. Microbiol. Biotechnol. 1997, 19, 299–304. [Google Scholar]
- Chan-u-Tit, P.; Laopaiboon, L.; Jaisil, P.; Laopaiboon, P. High level ethanol production by nitrogen and osmoprotectant supplementation under very high gravity fermentation conditions. Energies 2013, 6, 884–899. [Google Scholar] [CrossRef]
- Dombek, K.M.; Ingram, L.O. Magnesium limitation and its role in apparent toxicity of ethanol during yeast fermentation. Appl. Environ. Microbiol. 1986, 52, 975–981. [Google Scholar] [PubMed]
- Abouzied, M.M.; Reddy, C.A. Direct fermentation of potato starch to ethanol by cocultures of Aspergillus niger and Saccharomyces cerevisiae. Appl. Environ. Microbiol. 1986, 52, 1055–1059. [Google Scholar] [PubMed]
- Pereira, F.B.; Guimarães, P.M.R.; Teixeira, J.A.; Domingues, L. Optimization of low-cost medium for very high gravity ethanol fermentations by Saccharomyces cerevisiae using statistical experimental designs. Bioresour. Technol. 2010, 101, 7856–7863. [Google Scholar] [CrossRef] [PubMed]
- Storage and Processing of Roots and Tubers in the Tropics. Available online: http://www.fao.org/docrep/x5415e/x5415e00.htm#Contents (accessed on 27 June 2015).
- Bafrncová, P.; Šmogrovičová, D.; Sláviková, I.; Pátková, J.; Dömény, Z. Improvement of very high gravity ethanol fermentation by media supplementation using Saccharomyces cerevisiae. Biotechnol. Lett. 1999, 21, 337–341. [Google Scholar] [CrossRef]
- Godard, P.; Urrestarazu, A.; Vissers, S.; Kontos, K.; Bontempi, G.; van Helden, J.; André, B. Effect of 21 different nitrogen sources on global gene expression in the yeast Saccharomyces cerevisiae. Mol. Cell. Biol. 2007, 27, 3065–3086. [Google Scholar] [CrossRef] [PubMed]
- Lampitt, L.H. Nitrogen Metabolism in Saccharomyces cerevisiae. Biochem. J. 1919, 13, 459–486. [Google Scholar] [CrossRef] [PubMed]
- Albers, E.; Larsson, C.; Lidén, G.; Niklasson, C.; Gustafsson, L. Influence of the nitrogen source on Saccharomyces cerevisiae anaerobic growth and product formation. Appl. Environ. Microbiol. 1996, 62, 3187–3195. [Google Scholar] [PubMed]
- Laopaiboon, L.; Nuanpeng, S.; Srinophakun, P.; Klanrit, P.; Laopaiboon, P. Ethanol production from sweet sorghum juice using very high gravity technology: Effects of carbon and nitrogen supplementations. Bioresour. Technol. 2009, 100, 4176–4182. [Google Scholar] [CrossRef] [PubMed]
- Thomas, K.C.; Ingeldew, W.M. Production of 21% (v/v) ethanol by fermentation of very high gravity (VHG) wheat mashes. J. Ind. Microbiol. 1992, 10, 61–68. [Google Scholar] [CrossRef]
- Hong, Y.S.; Yoon, H.H. Ethanol production from food residues. Biomass Bioenergy 2011, 35, 3271–3275. [Google Scholar] [CrossRef]
- Le Tourneau, D. Potato Composition: Carbohydrate Components of the Potato Tuber. J. Agric. Food Chem. 1956, 4, 543–545. [Google Scholar] [CrossRef]
- Vilanova, M.; Ugliano, M.; Varela, C.; Siebert, T.; Pretorius, I.S.; Henschke, P.A. Assimilable nitrogen utilisation and production of volatile and non-volatile compounds in chemically defined medium by Saccharomyces cerevisiae wine yeasts. Appl. Microbiol. Biotechnol. 2007, 77, 145–157. [Google Scholar] [CrossRef] [PubMed]
- O’Rourke, T. Malt specifications & brewing performance. Brew. Int. 2002, 2, 27–30. [Google Scholar]
© 2015 by the authors; licensee MDPI, Basel, Switzerland. This article is an open access article distributed under the terms and conditions of the Creative Commons Attribution license (http://creativecommons.org/licenses/by/4.0/).
Share and Cite
Izmirlioglu, G.; Demirci, A. Enhanced Bio-Ethanol Production from Industrial Potato Waste by Statistical Medium Optimization. Int. J. Mol. Sci. 2015, 16, 24490-24505. https://doi.org/10.3390/ijms161024490
Izmirlioglu G, Demirci A. Enhanced Bio-Ethanol Production from Industrial Potato Waste by Statistical Medium Optimization. International Journal of Molecular Sciences. 2015; 16(10):24490-24505. https://doi.org/10.3390/ijms161024490
Chicago/Turabian StyleIzmirlioglu, Gulten, and Ali Demirci. 2015. "Enhanced Bio-Ethanol Production from Industrial Potato Waste by Statistical Medium Optimization" International Journal of Molecular Sciences 16, no. 10: 24490-24505. https://doi.org/10.3390/ijms161024490
APA StyleIzmirlioglu, G., & Demirci, A. (2015). Enhanced Bio-Ethanol Production from Industrial Potato Waste by Statistical Medium Optimization. International Journal of Molecular Sciences, 16(10), 24490-24505. https://doi.org/10.3390/ijms161024490