
Molecular Targeting of the Oncoprotein PLK1 in Pediatric Acute Myeloid Leukemia: RO3280, a Novel PLK1 Inhibitor, Induces Apoptosis in Leukemia Cells

Abstract
:1. Introduction
2. Results and Discussion
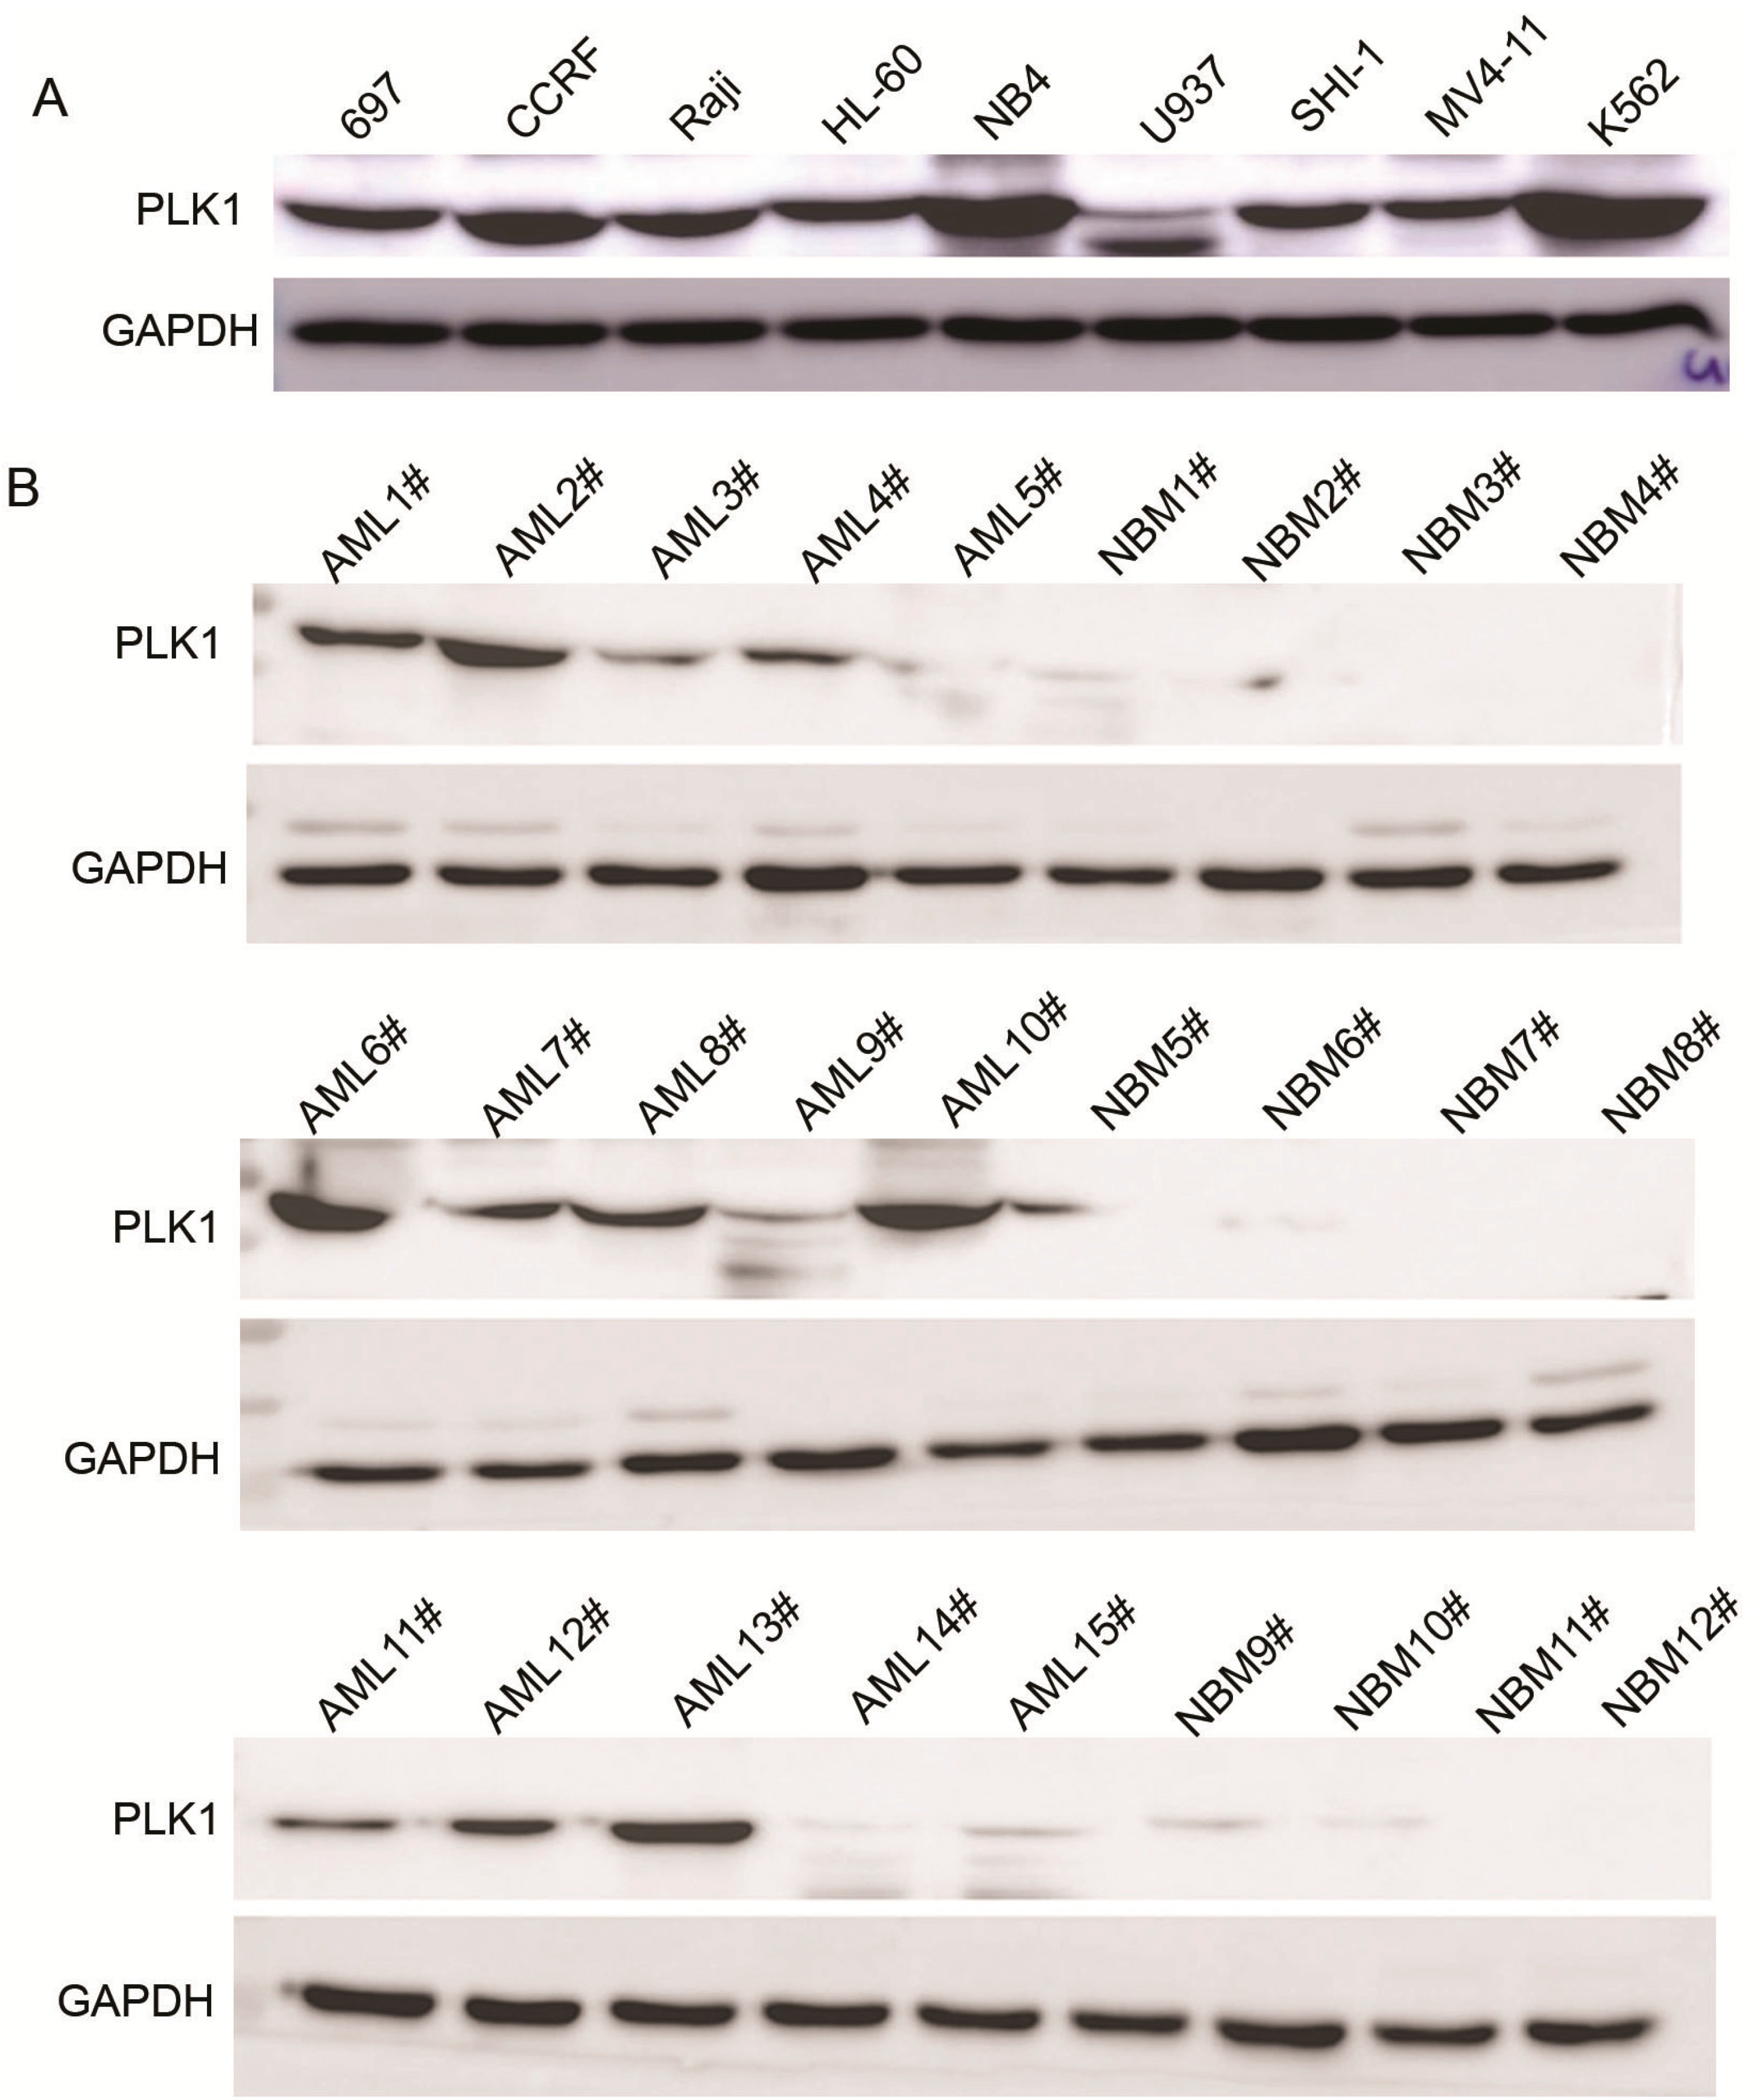
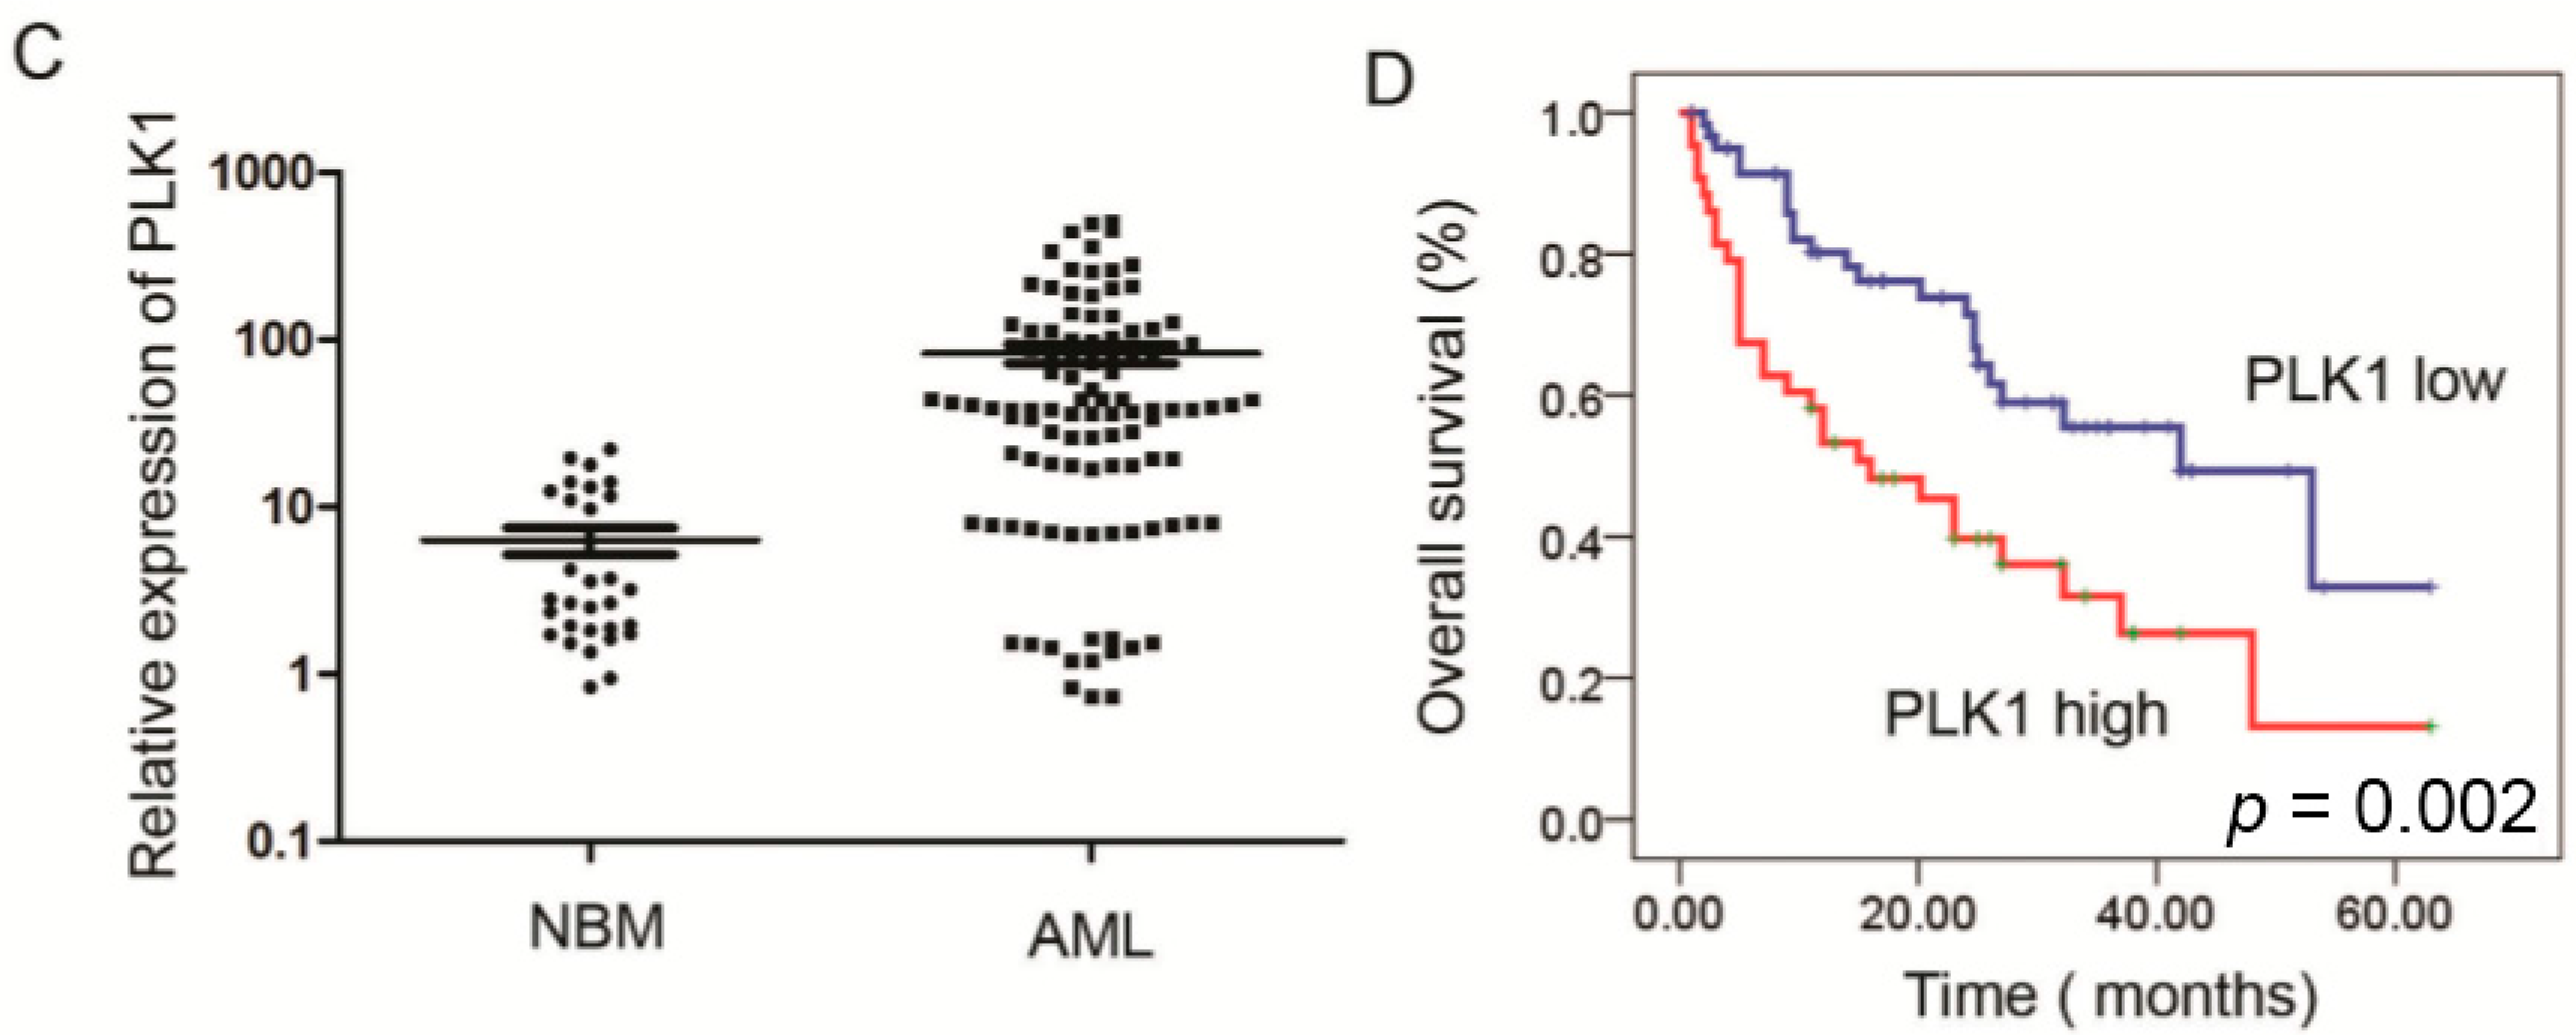
2.1. Expression of PLK1 Is Upregulated in AML Cells and Pediatric AML Patients


| Clinical Variables | No. of Patients | PLK1 Expression (n) | p | |
|---|---|---|---|---|
| Low | High | |||
| Gender | ||||
| Male | 42 | 27 | 15 | 0.373 |
| Female | 63 | 35 | 28 | |
| Age (year) | ||||
| <6 | 60 | 35 | 25 | 0.864 |
| ≥6 | 45 | 27 | 18 | |
| Leukocyte (/μL) | ||||
| >10,000 | 61 | 37 | 24 | 0.693 |
| ≤10,000 | 44 | 25 | 19 | |
| FAB | ||||
| M1–M6 | 93 | 59 | 34 | 0.011 |
| M7 | 12 | 3 | 9 | |
| Cytogenetics | ||||
| Favorable | 50 | 28 | 22 | 0.160 |
| Intermediate | 27 | 20 | 7 | |
| Unfavorable | 28 | 14 | 14 | |
| MRD | ||||
| <0.25% | 49 | 36 | 13 | 0.005 |
| ≥0.25% | 56 | 26 | 30 | |
| Variable | No. of Patients | Over Survival | p |
|---|---|---|---|
| Median ± SE | |||
| Cytogenetics | |||
| Favorable | 50 | 46.664 ± 3.717 | <0.001 |
| Intermediate | 27 | 29.220 ± 3.188 | |
| Unfavorable | 28 | 11.161 ± 1.827 | |
| FAB | |||
| M1–M6 | 93 | 36.113 ± 2.885 | <0.001 |
| M7 | 12 | 8.542 ± 1.820 | |
| Leukocyte (/μL) | |||
| >10,000 | 61 | 30.220 ± 2.974 | 0.803 |
| ≤10,000 | 44 | 33.631 ± 4.063 | |
| MRD | |||
| <0.25% | 49 | 53.627 ± 3.151 | <0.001 |
| ≥0.25% | 56 | 18.893 ± 2.425 | |
| PLK1 expression | |||
| Low (<12.420) | 62 | 39.319 ± 3.539 | 0.002 |
| High (≥12.420) | 43 | 24.054 ± 3.709 | |
| Variable | Odds Ratio | EXP (B) 95% CI | p |
|---|---|---|---|
| Cytogenetics | |||
| Favorable vs. Intermediate and Unfavorable | 6.164 | 2.477 (1.210–5.068) | 0.013 |
| MRD | |||
| <0.25% vs. ≥0.25% | 14.084 | 5.176 (2.193–12.214) | 0.000 |
| Leukocyte (/uL) | |||
| >10,000 vs. ≤10,000 | 0.200 | 1.138 (0.646–2.055) | 0.655 |
| FAB classification | |||
| M7 vs. M1–M6 | 7.148 | 2.683 (1.301–5.533) | 0.008 |
| PLK1 Expression | |||
| Low vs. High | 4.195 | 1.806 (1.026–3.179) | 0.041 |
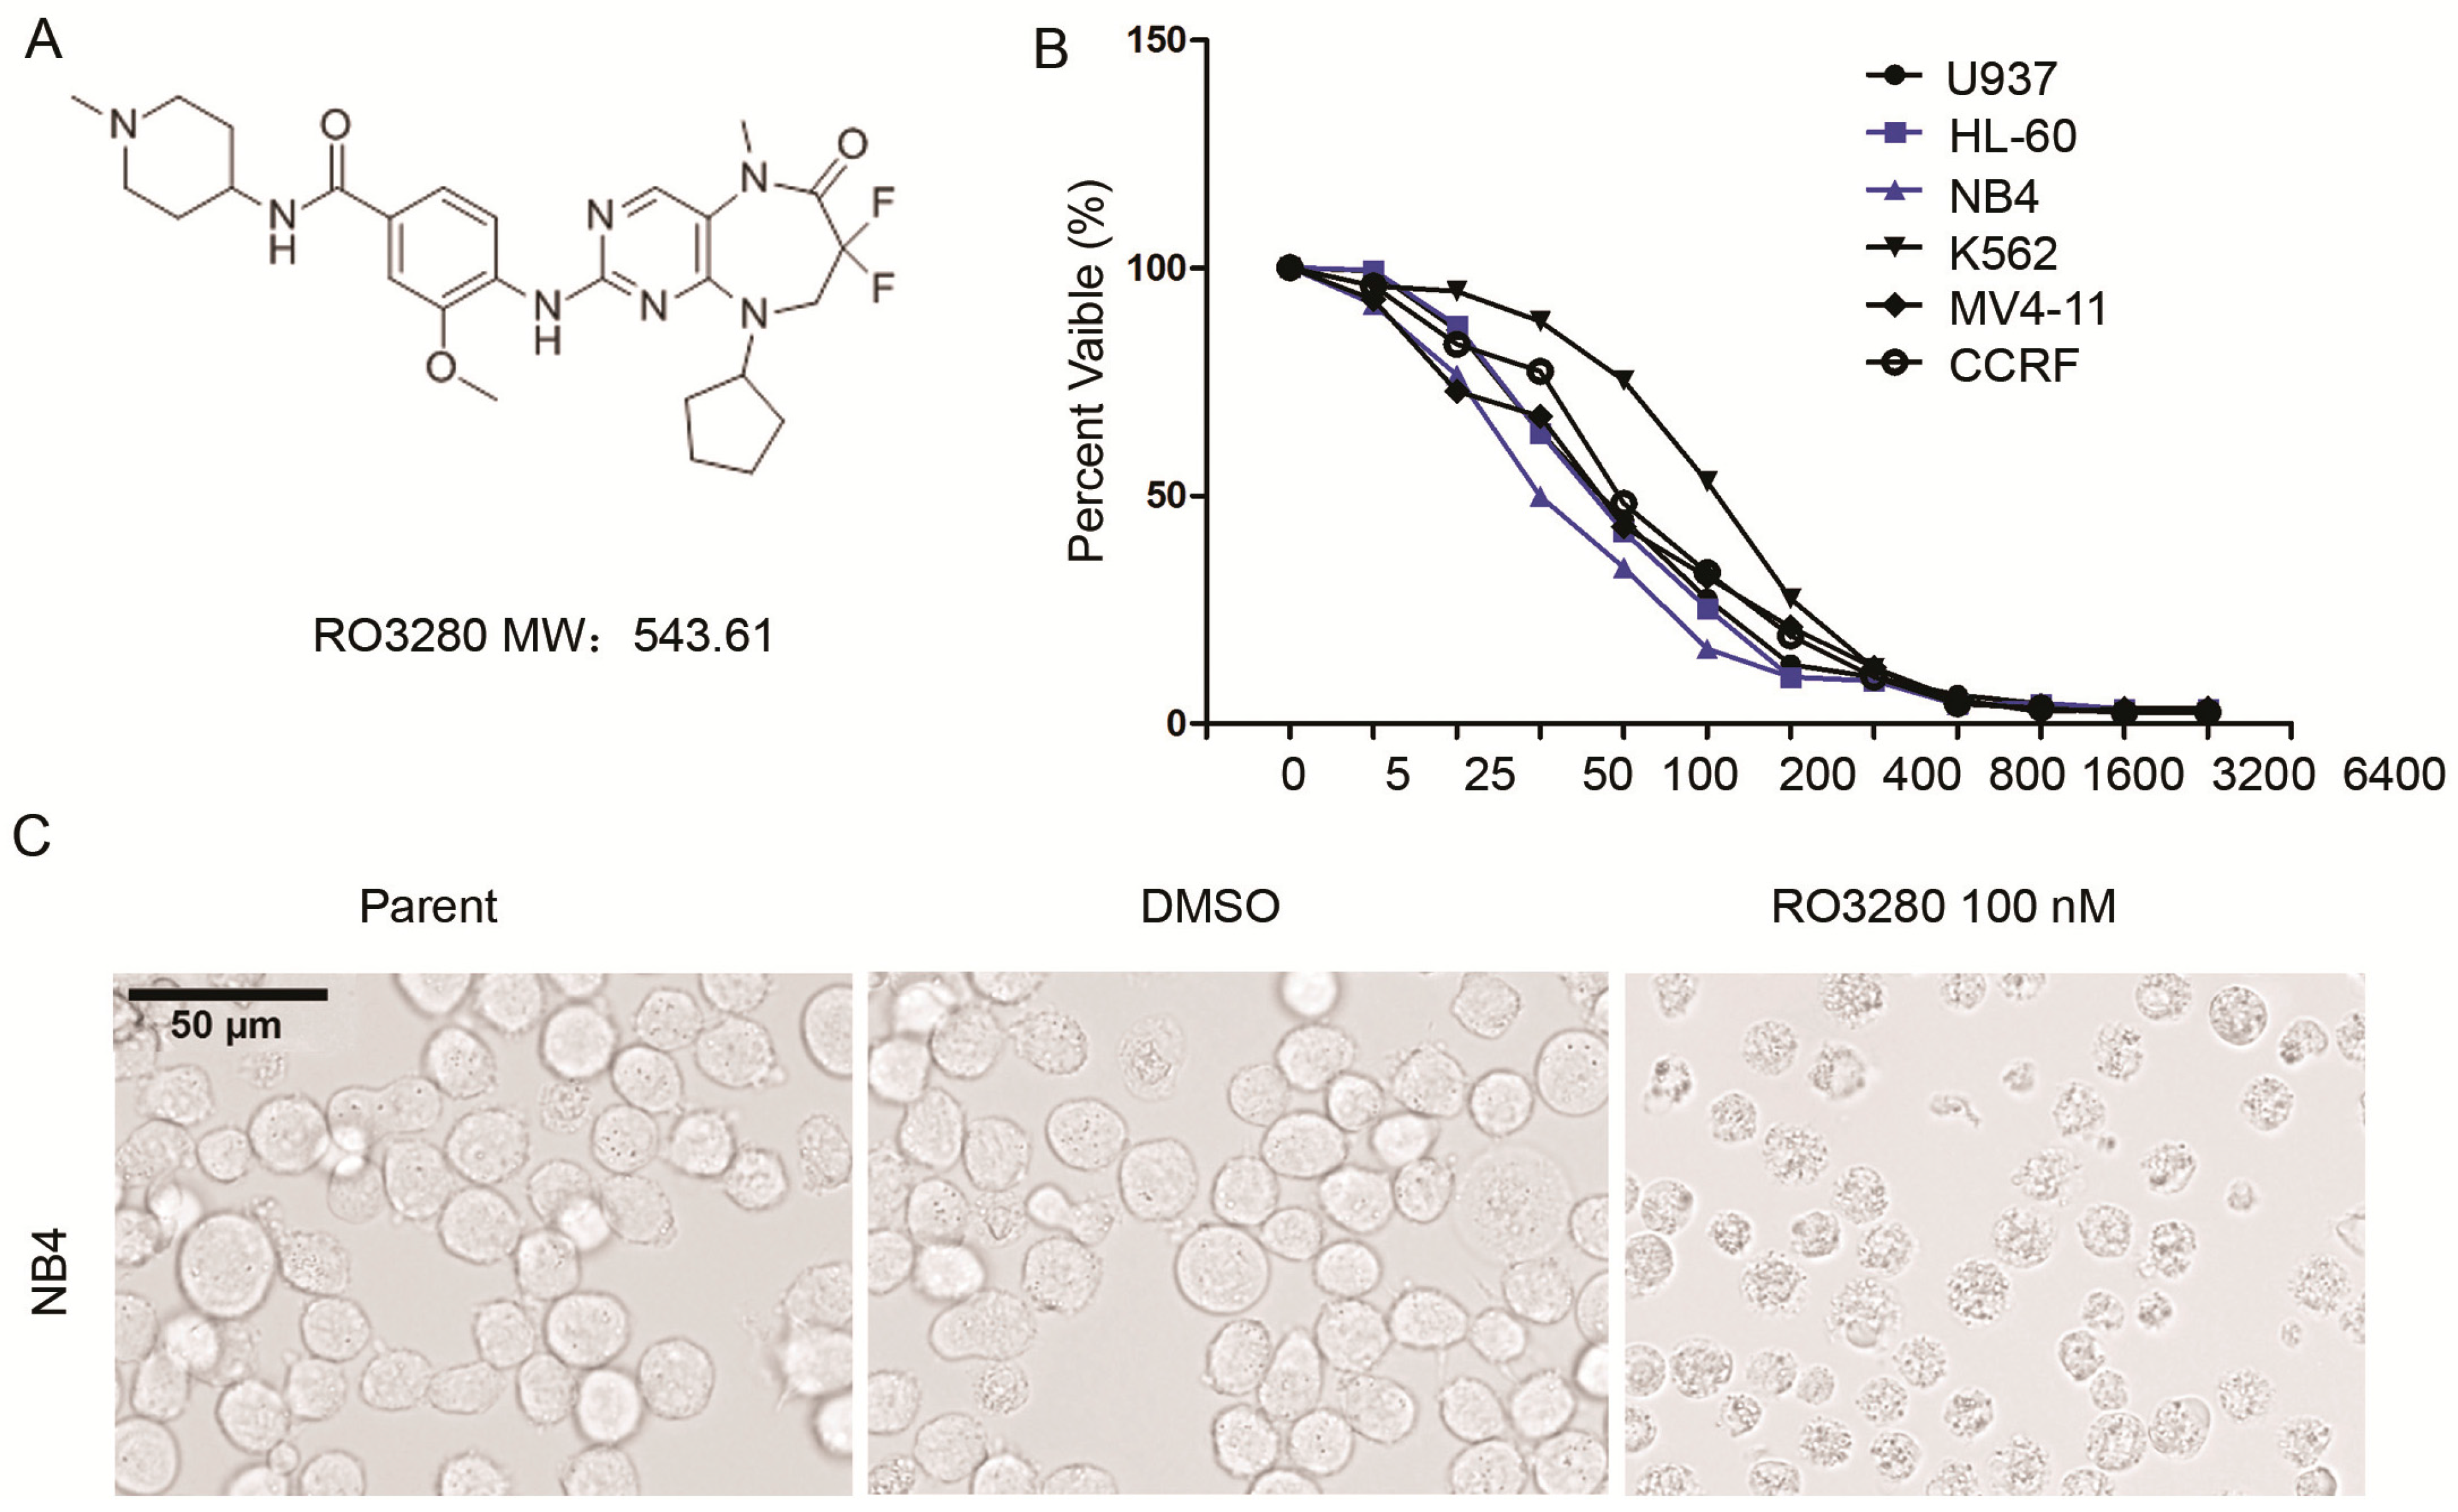
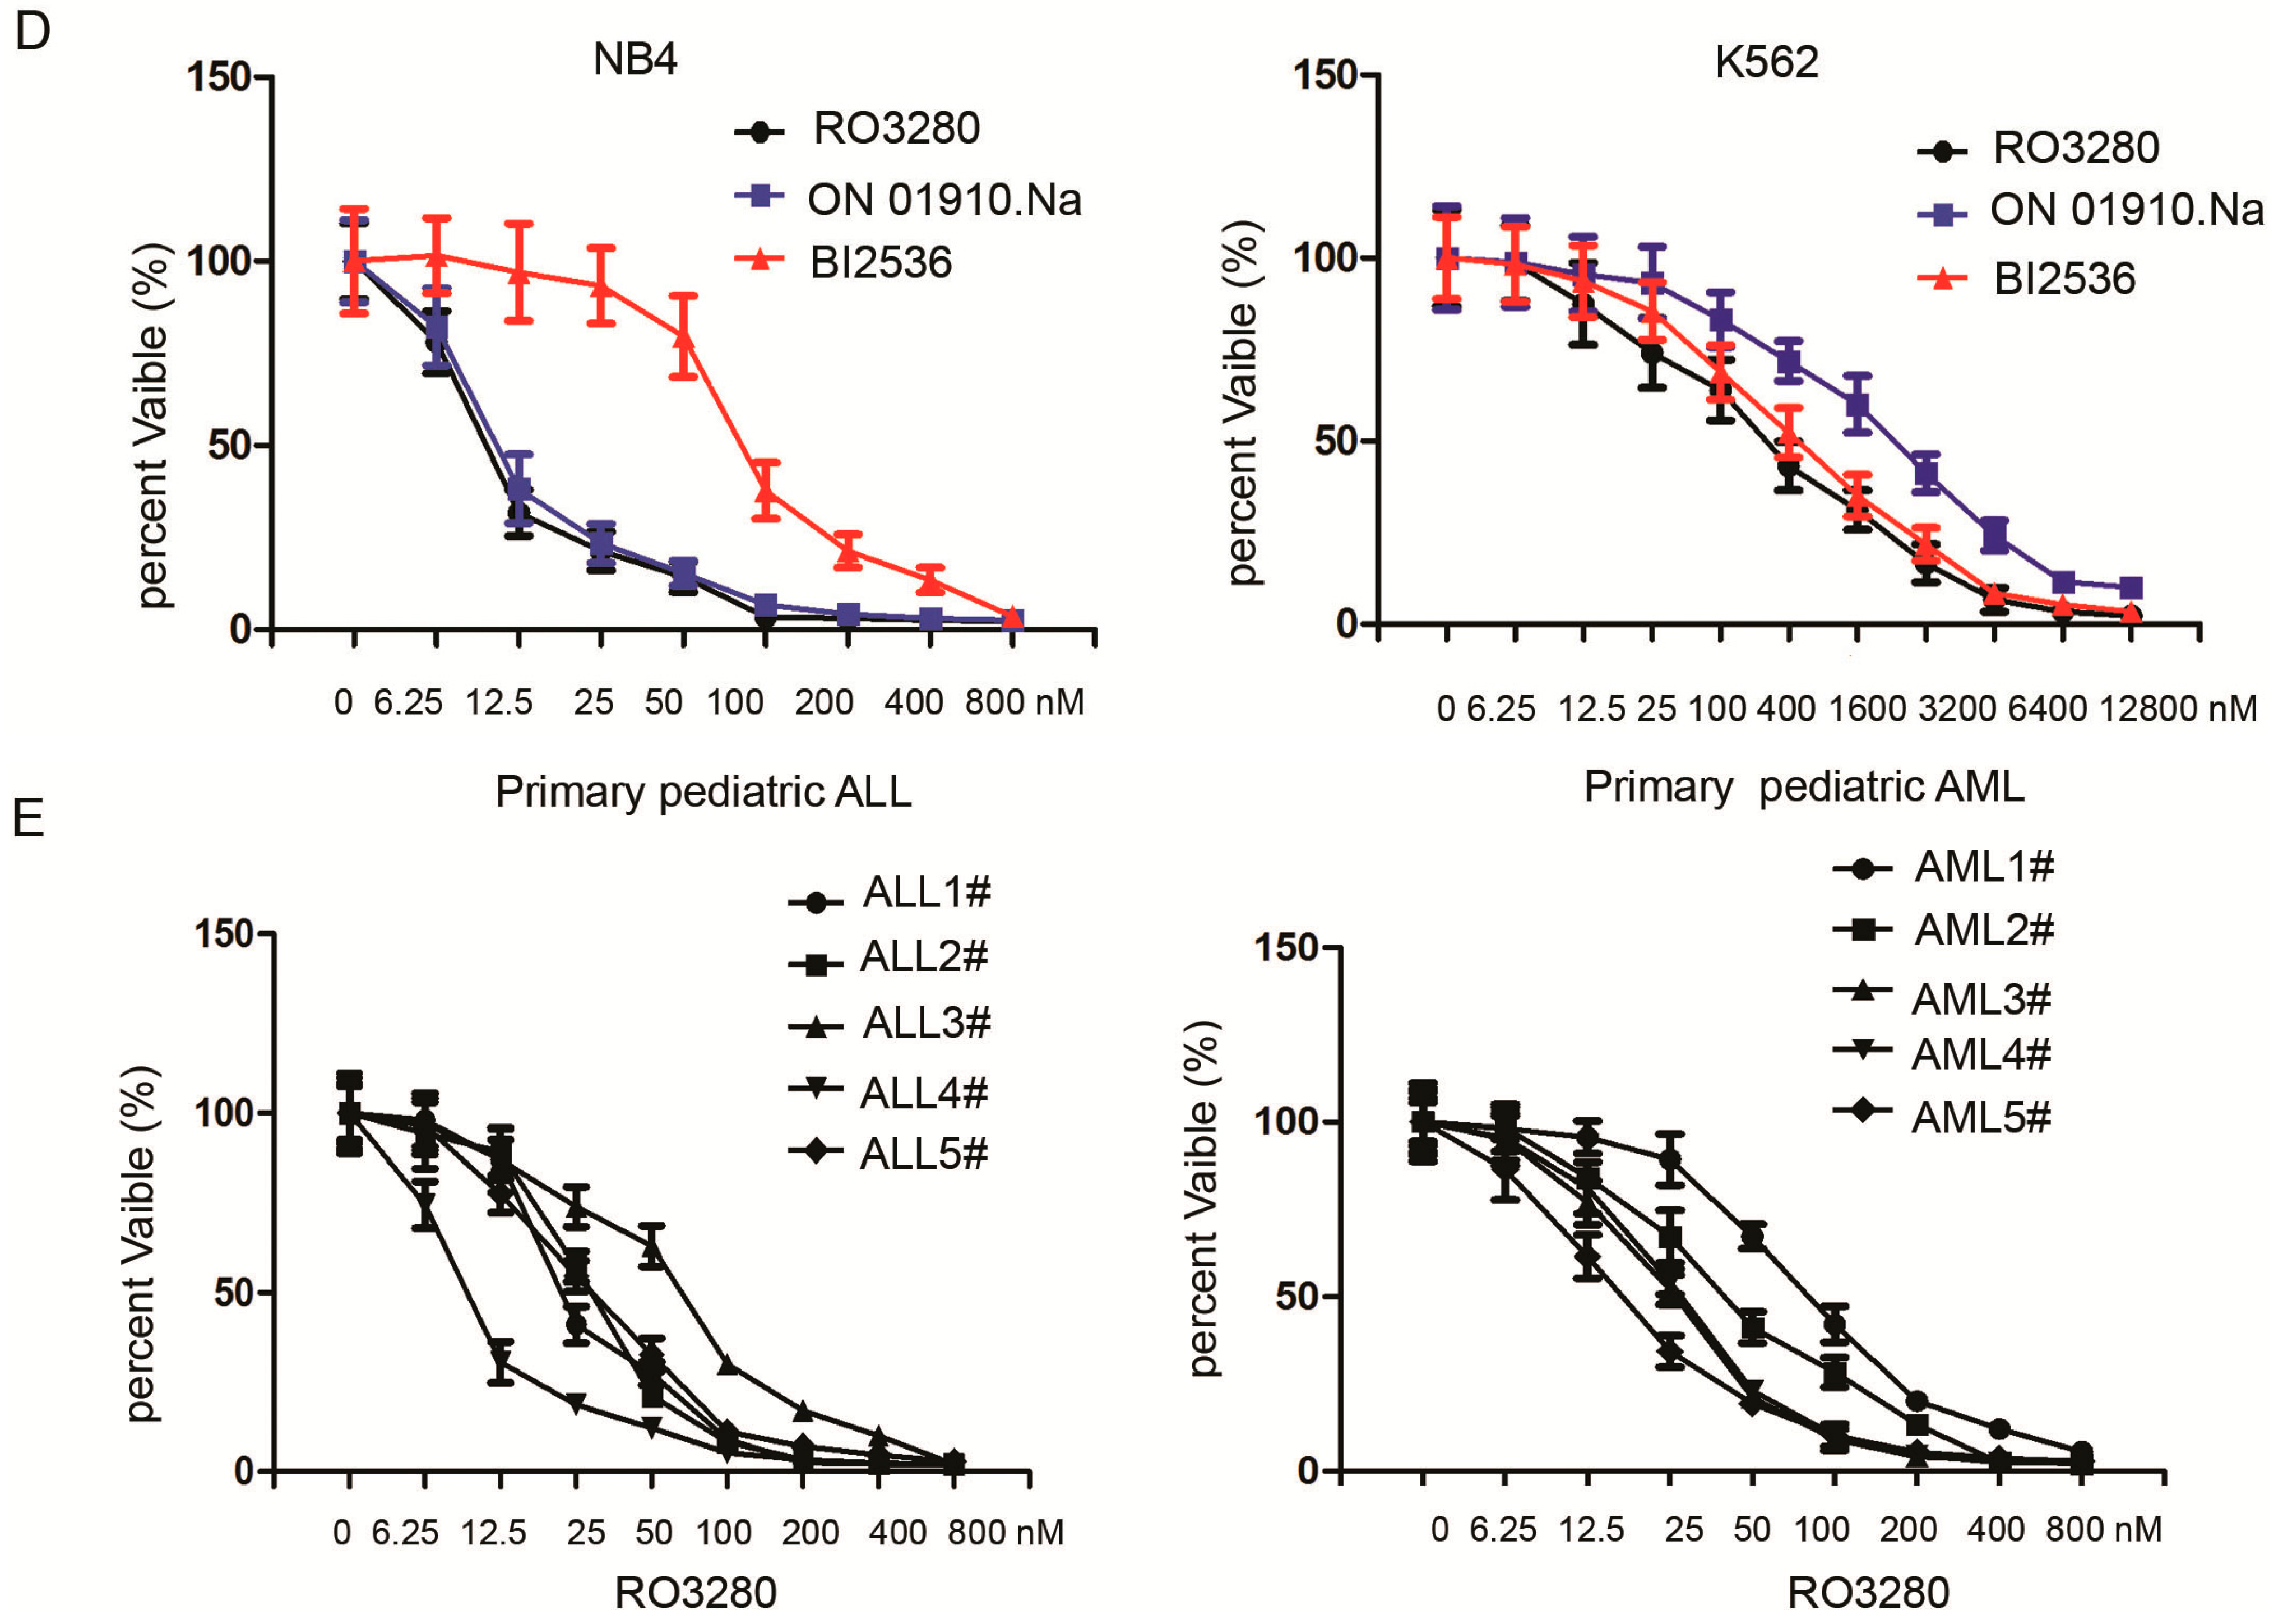
2.2. RO3280 Inhibits the Growth of Acute Leukemia Cells
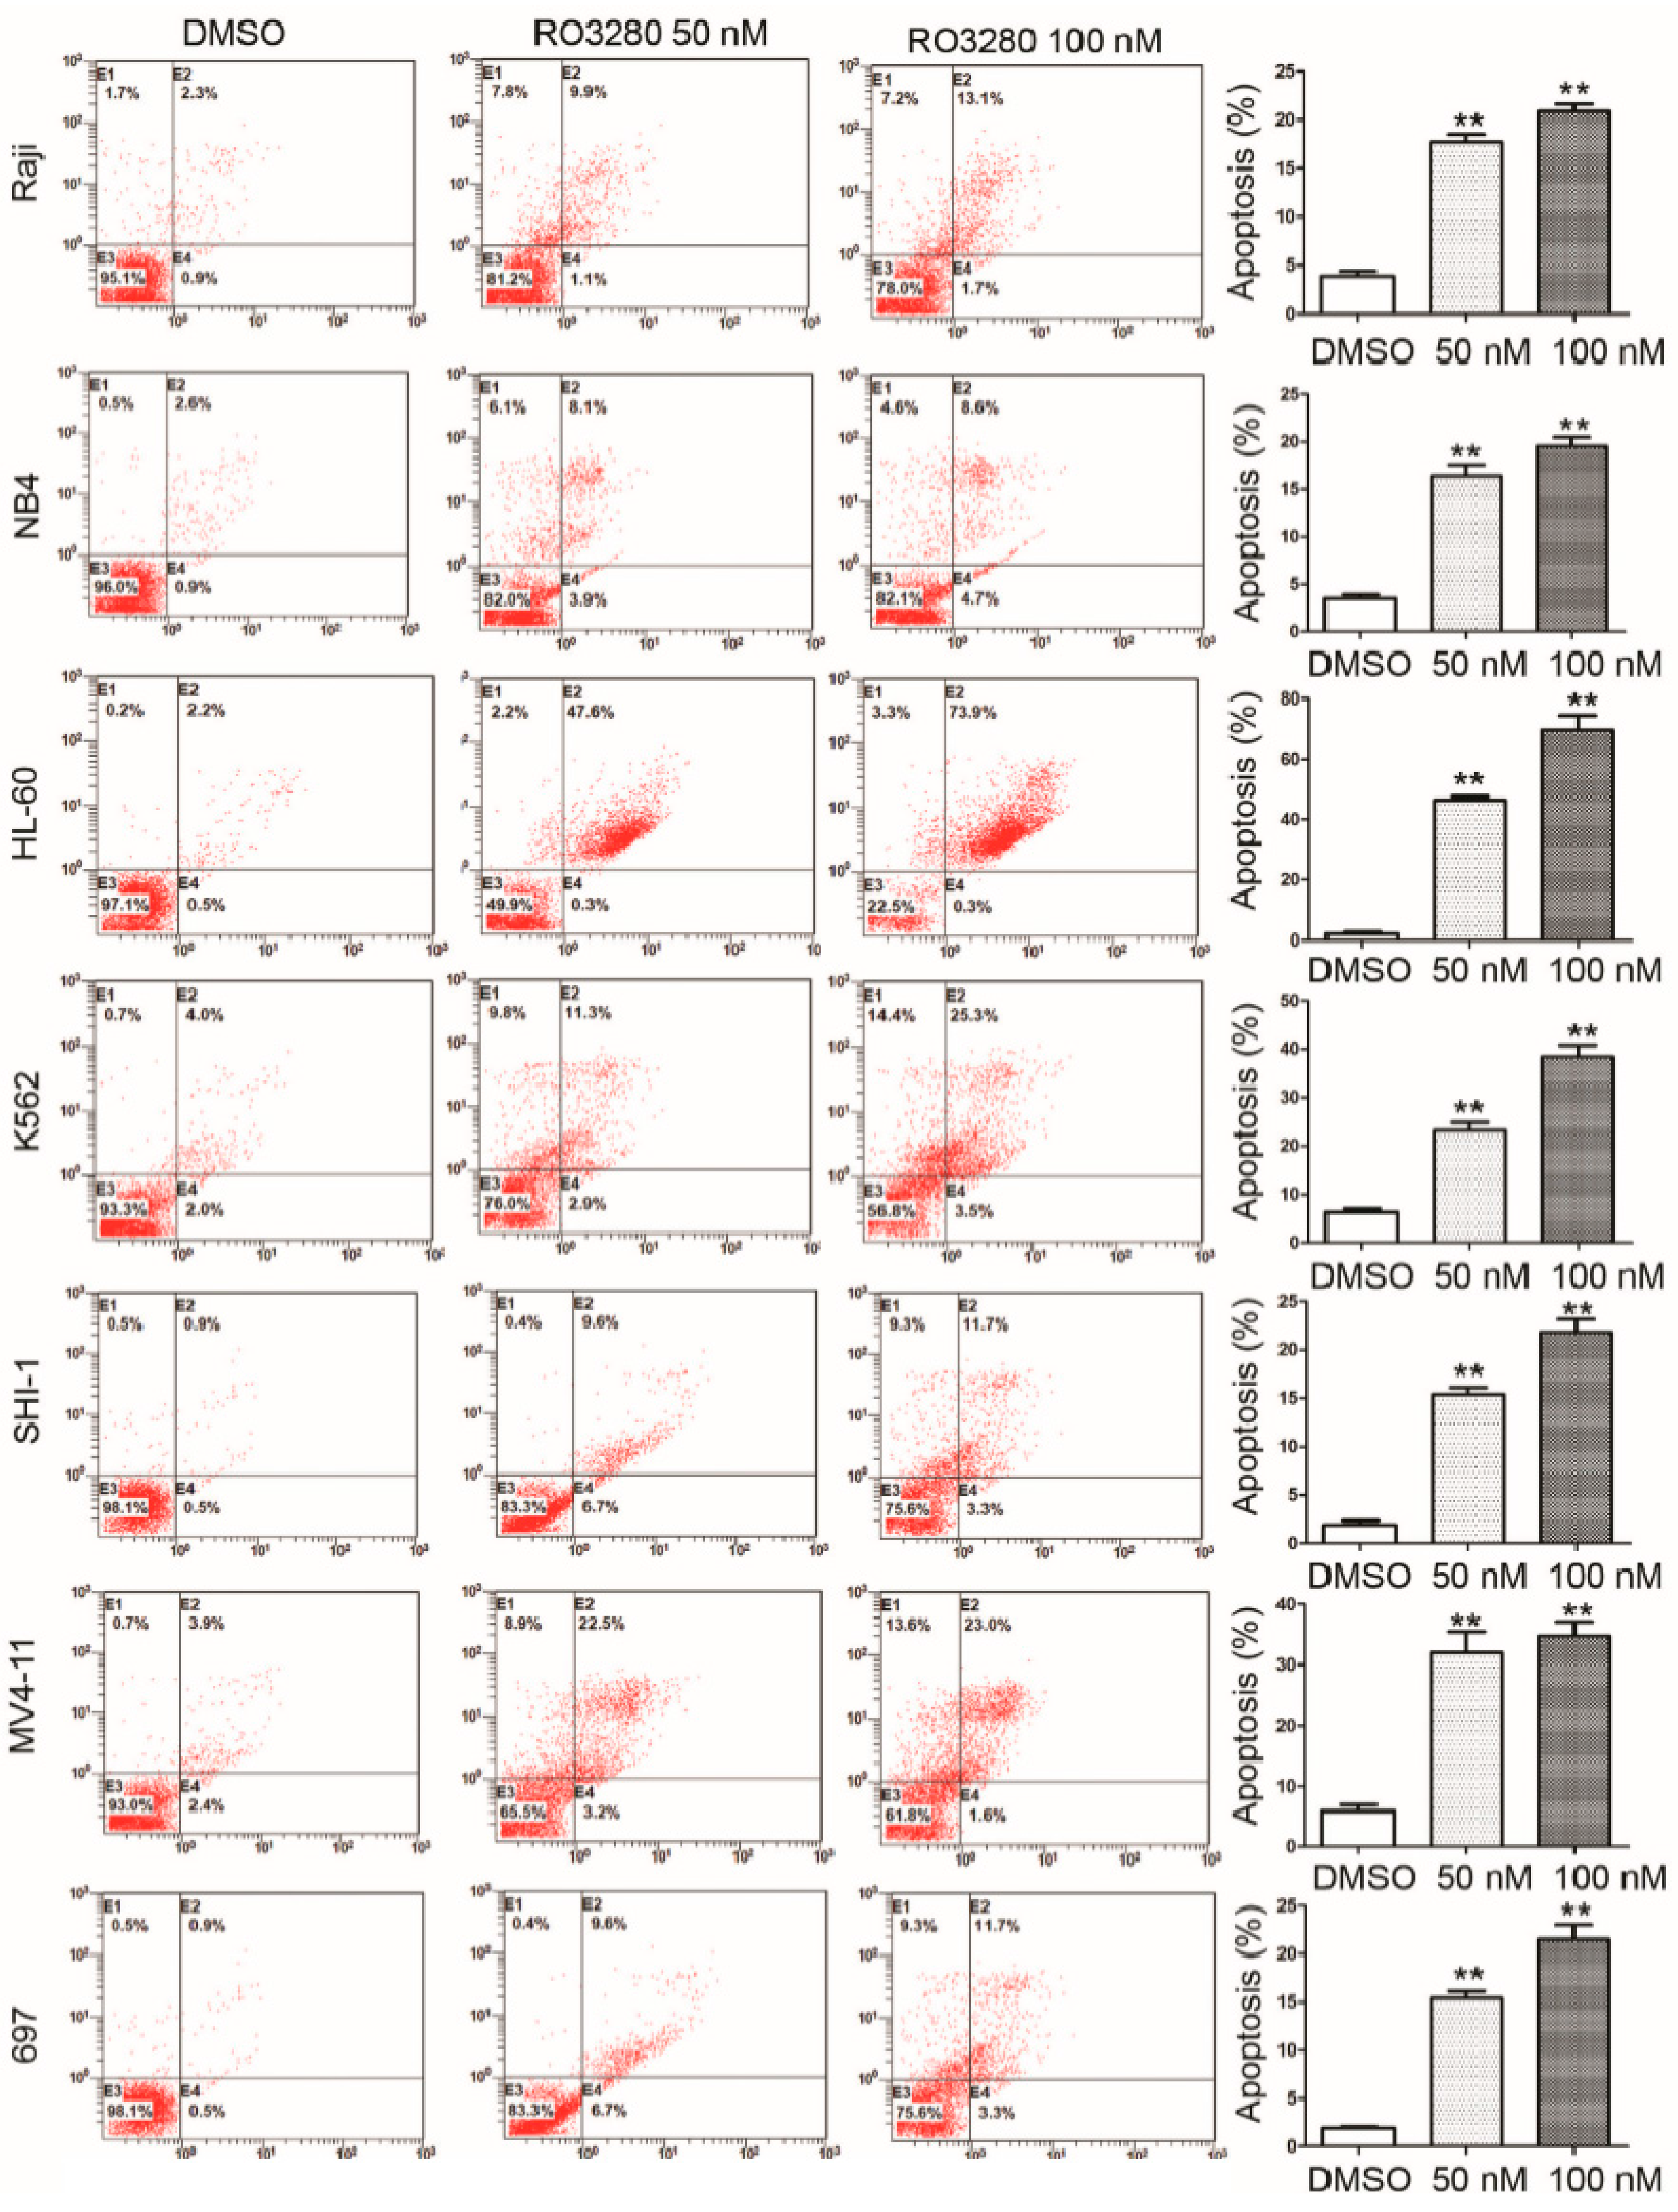
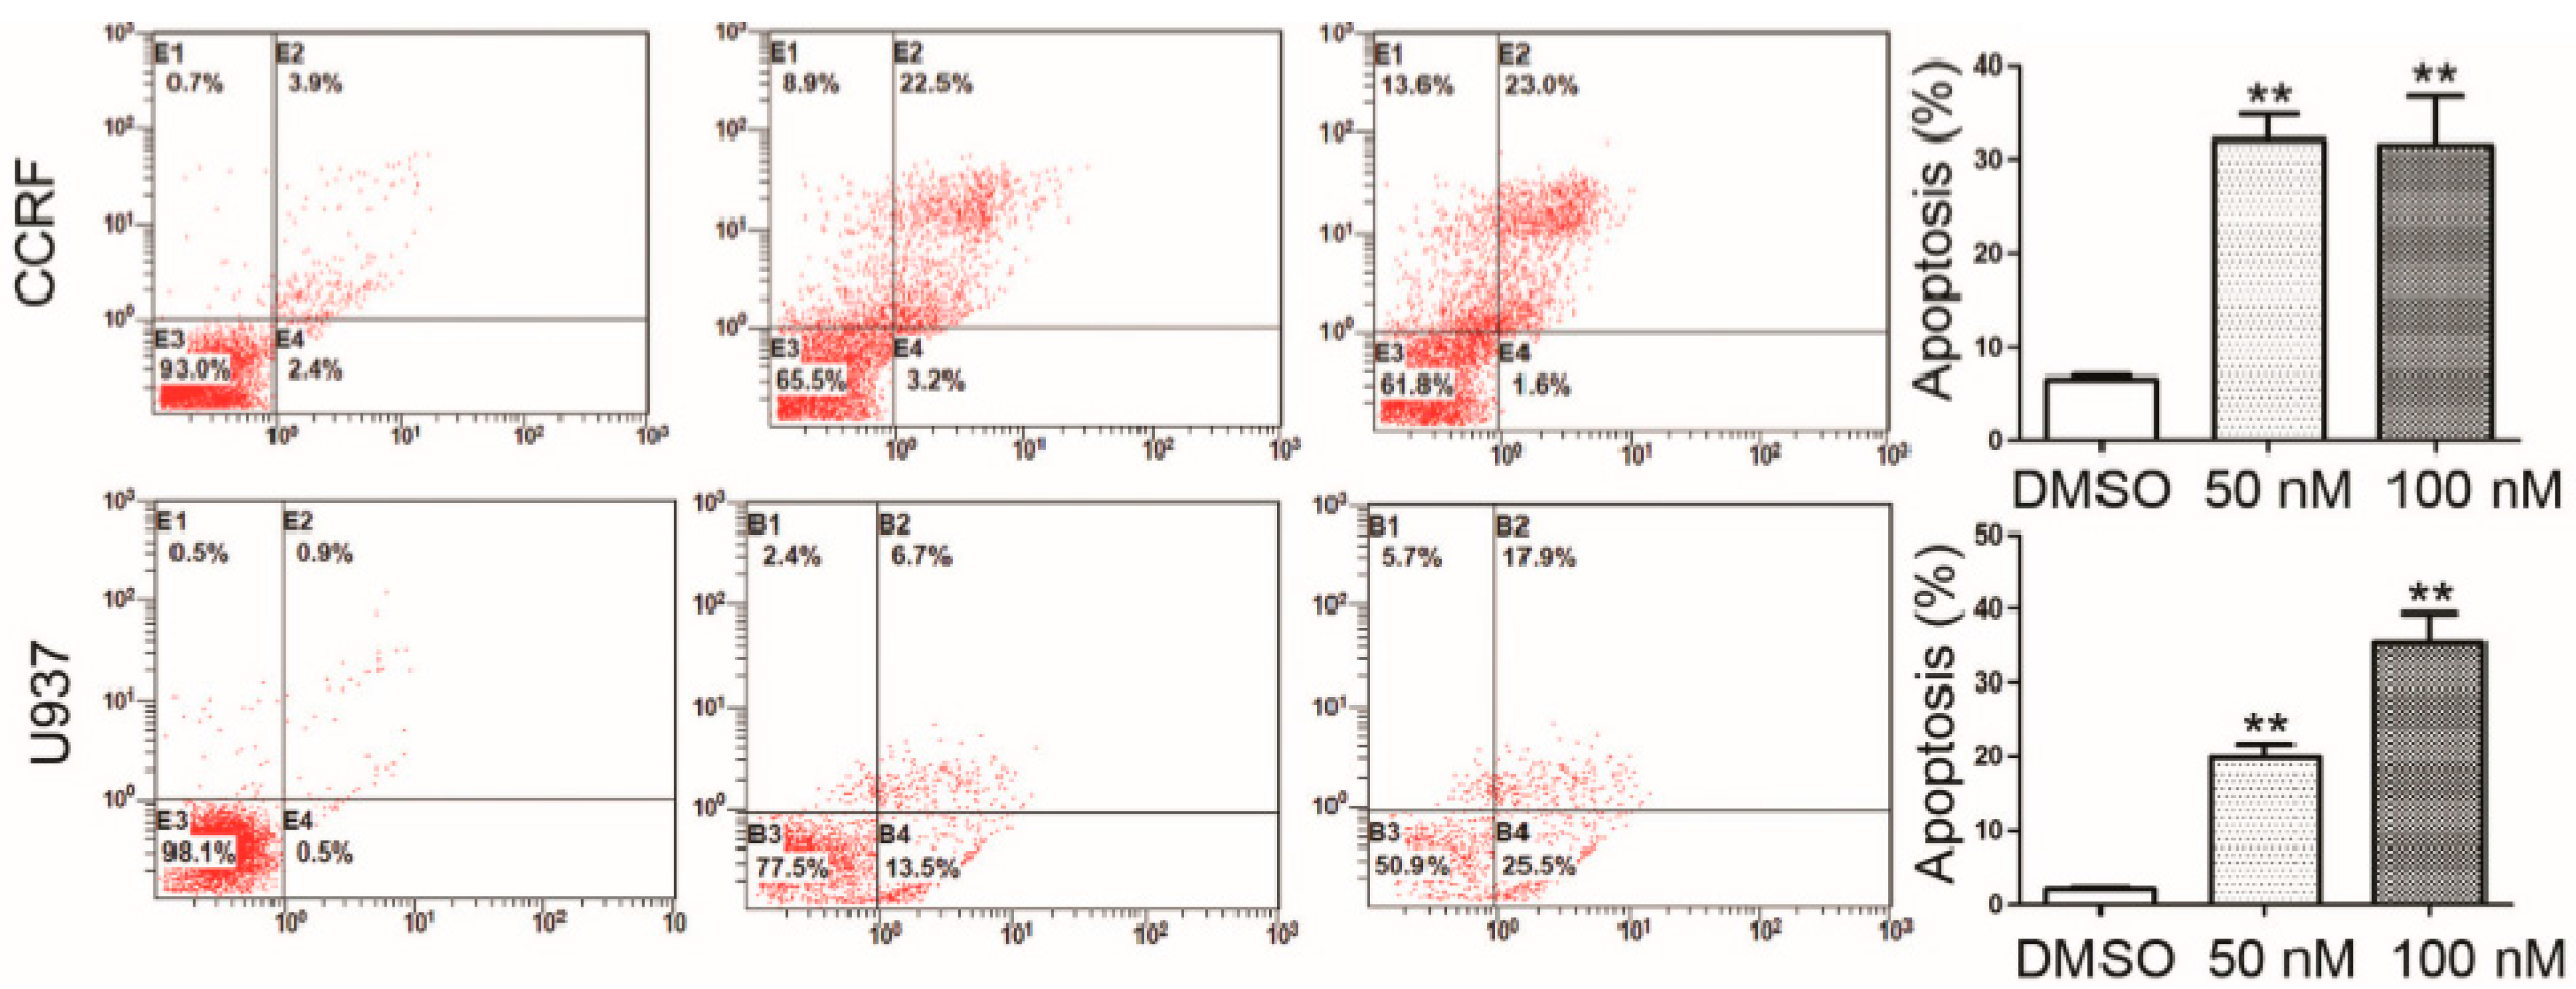
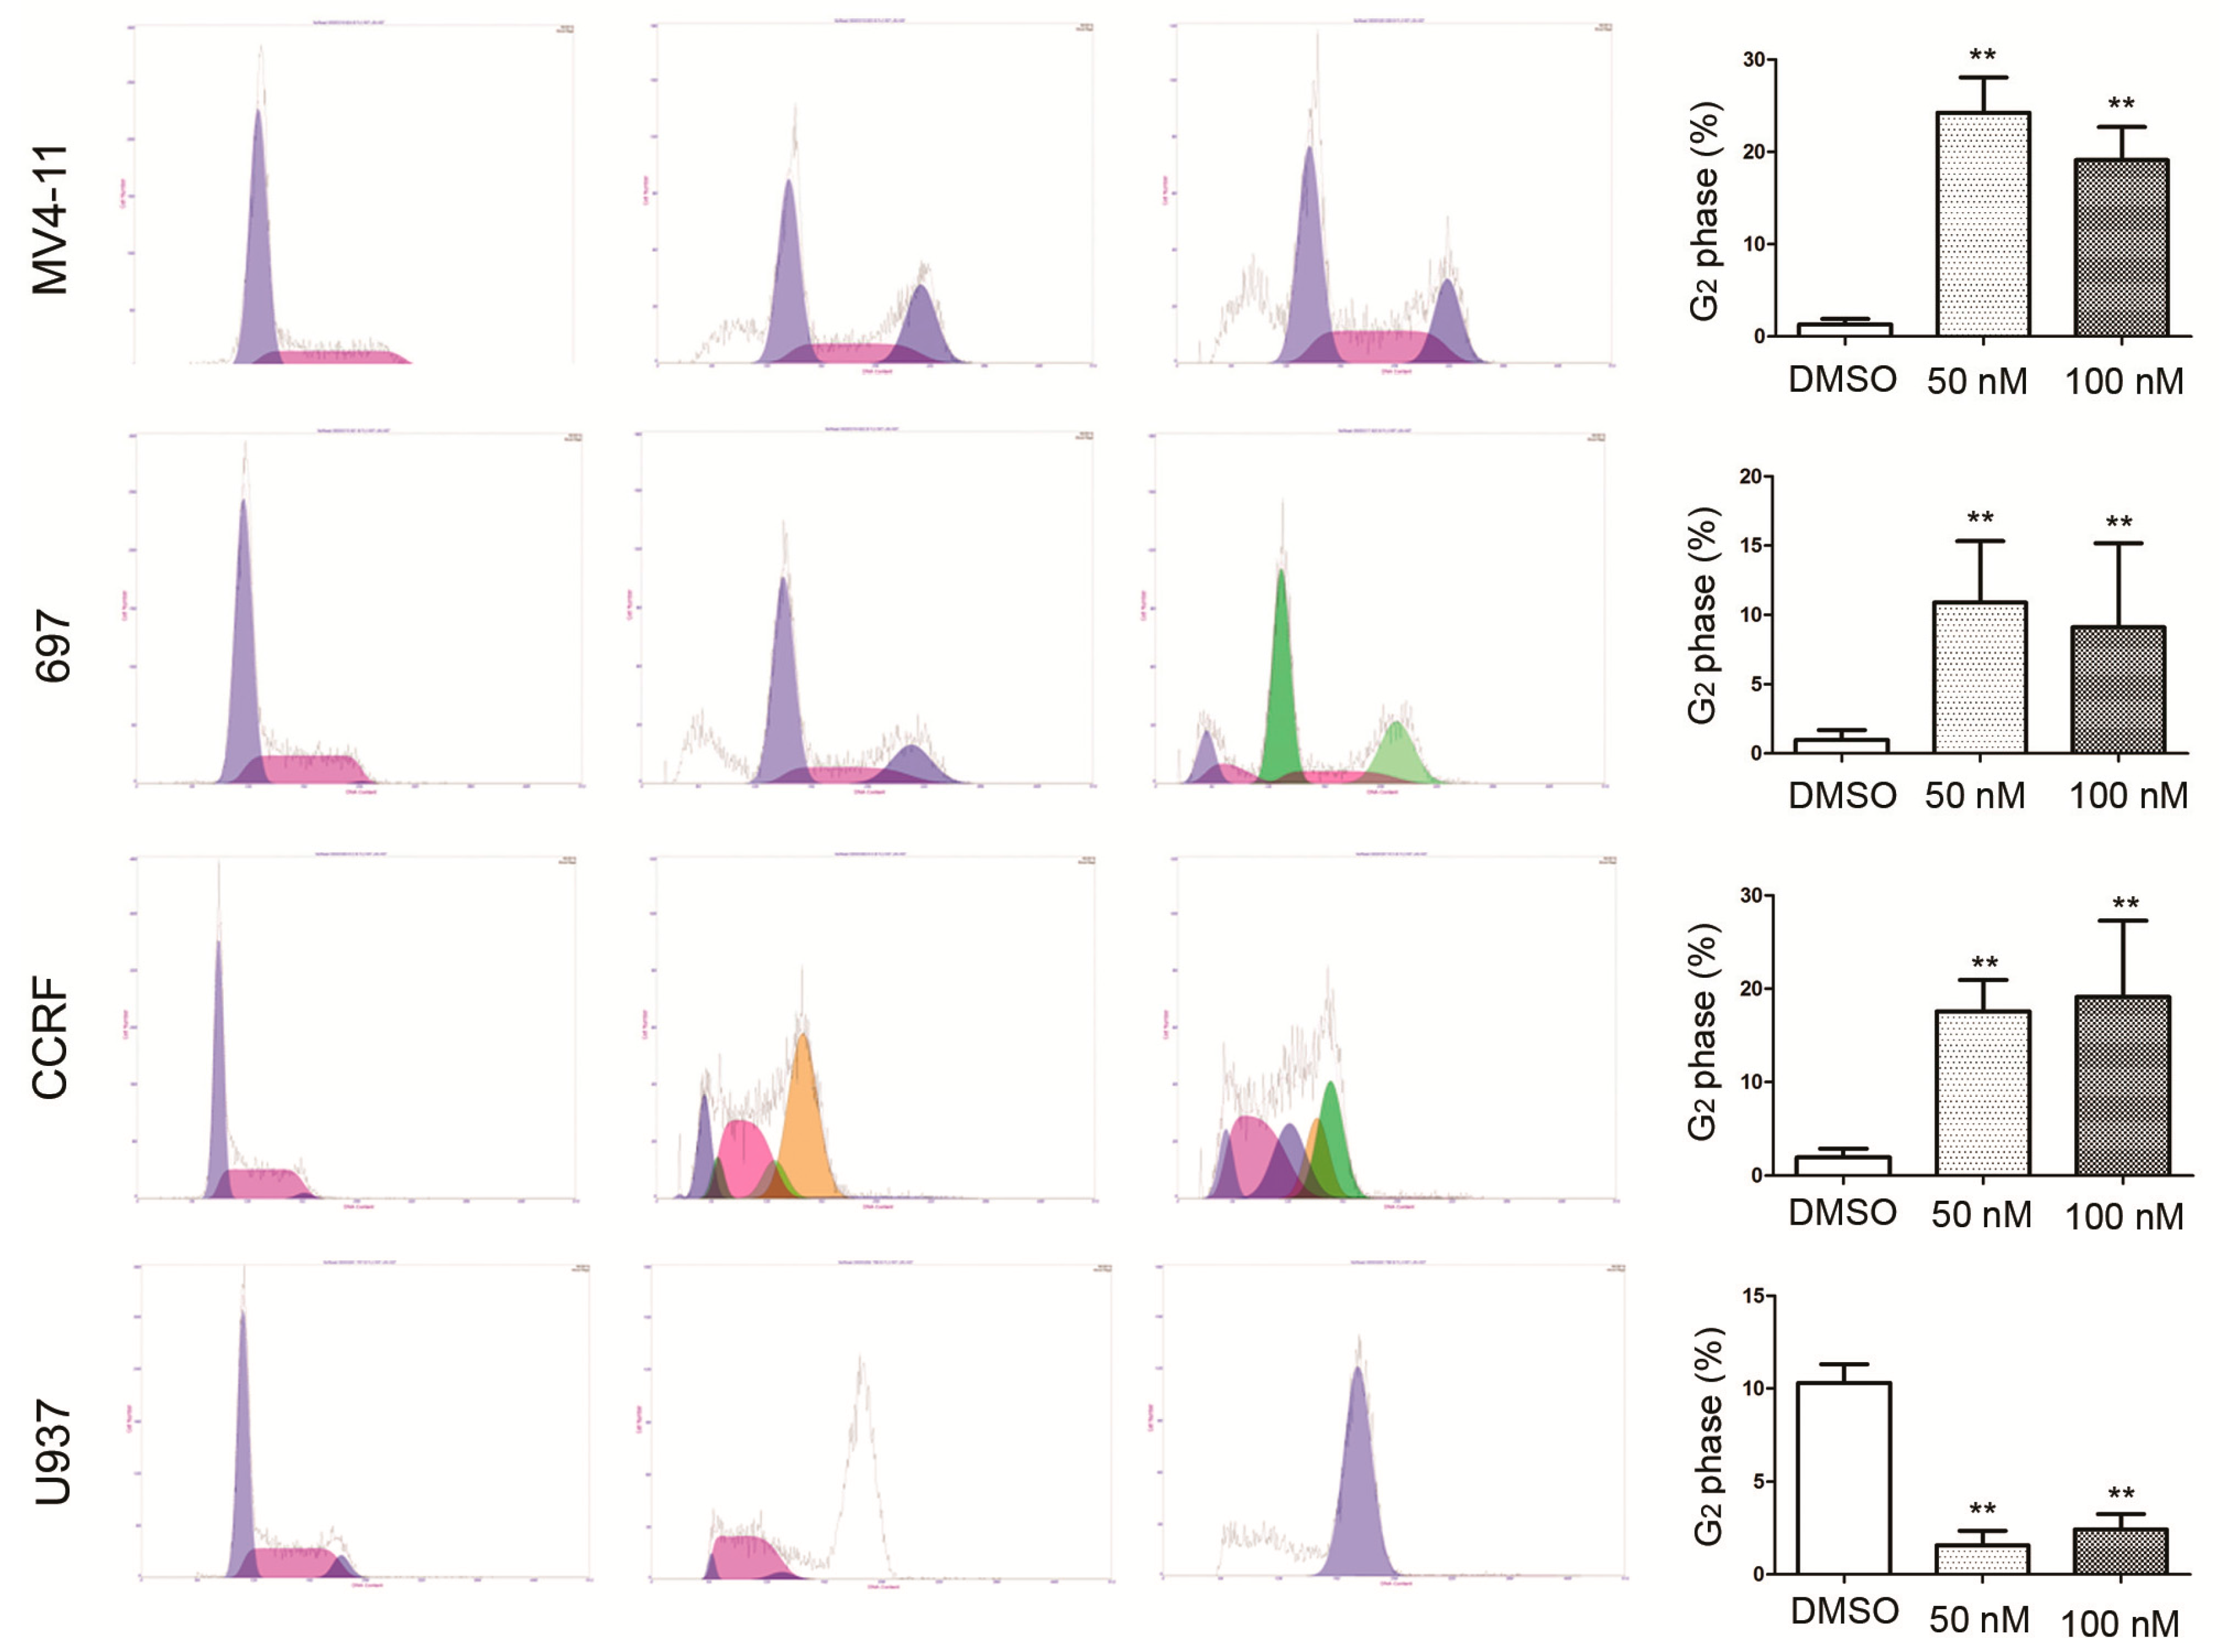
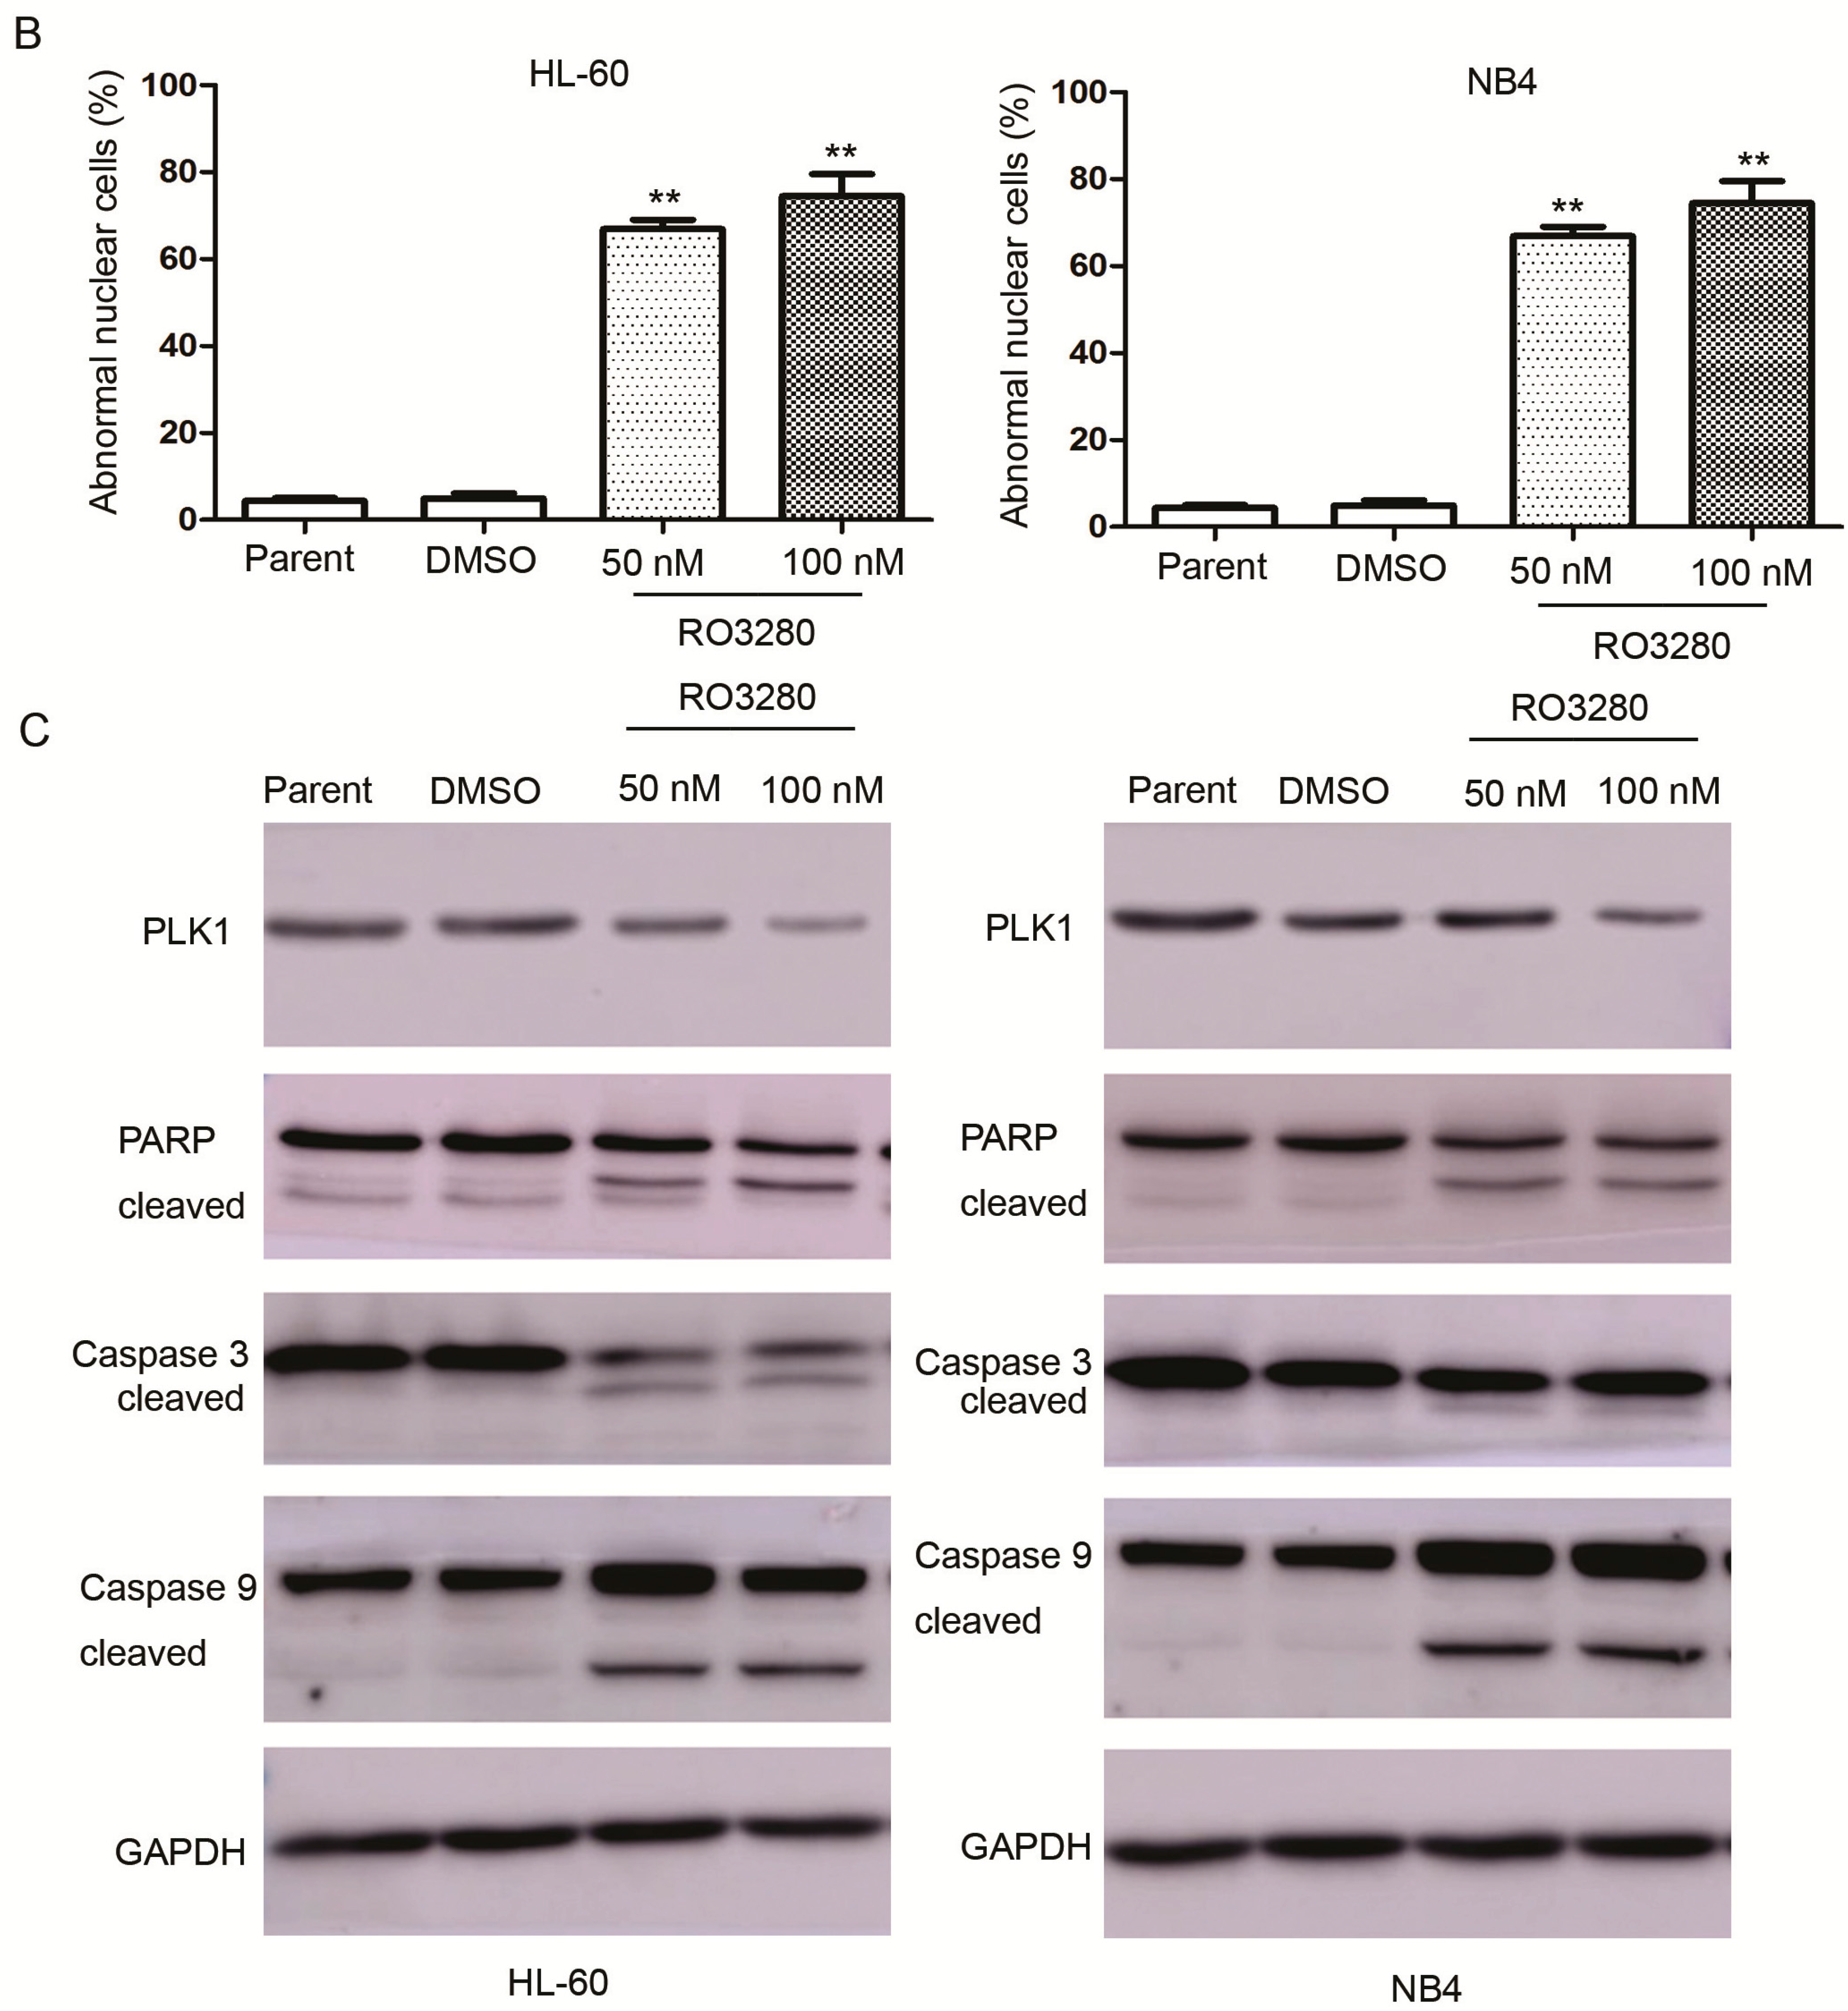
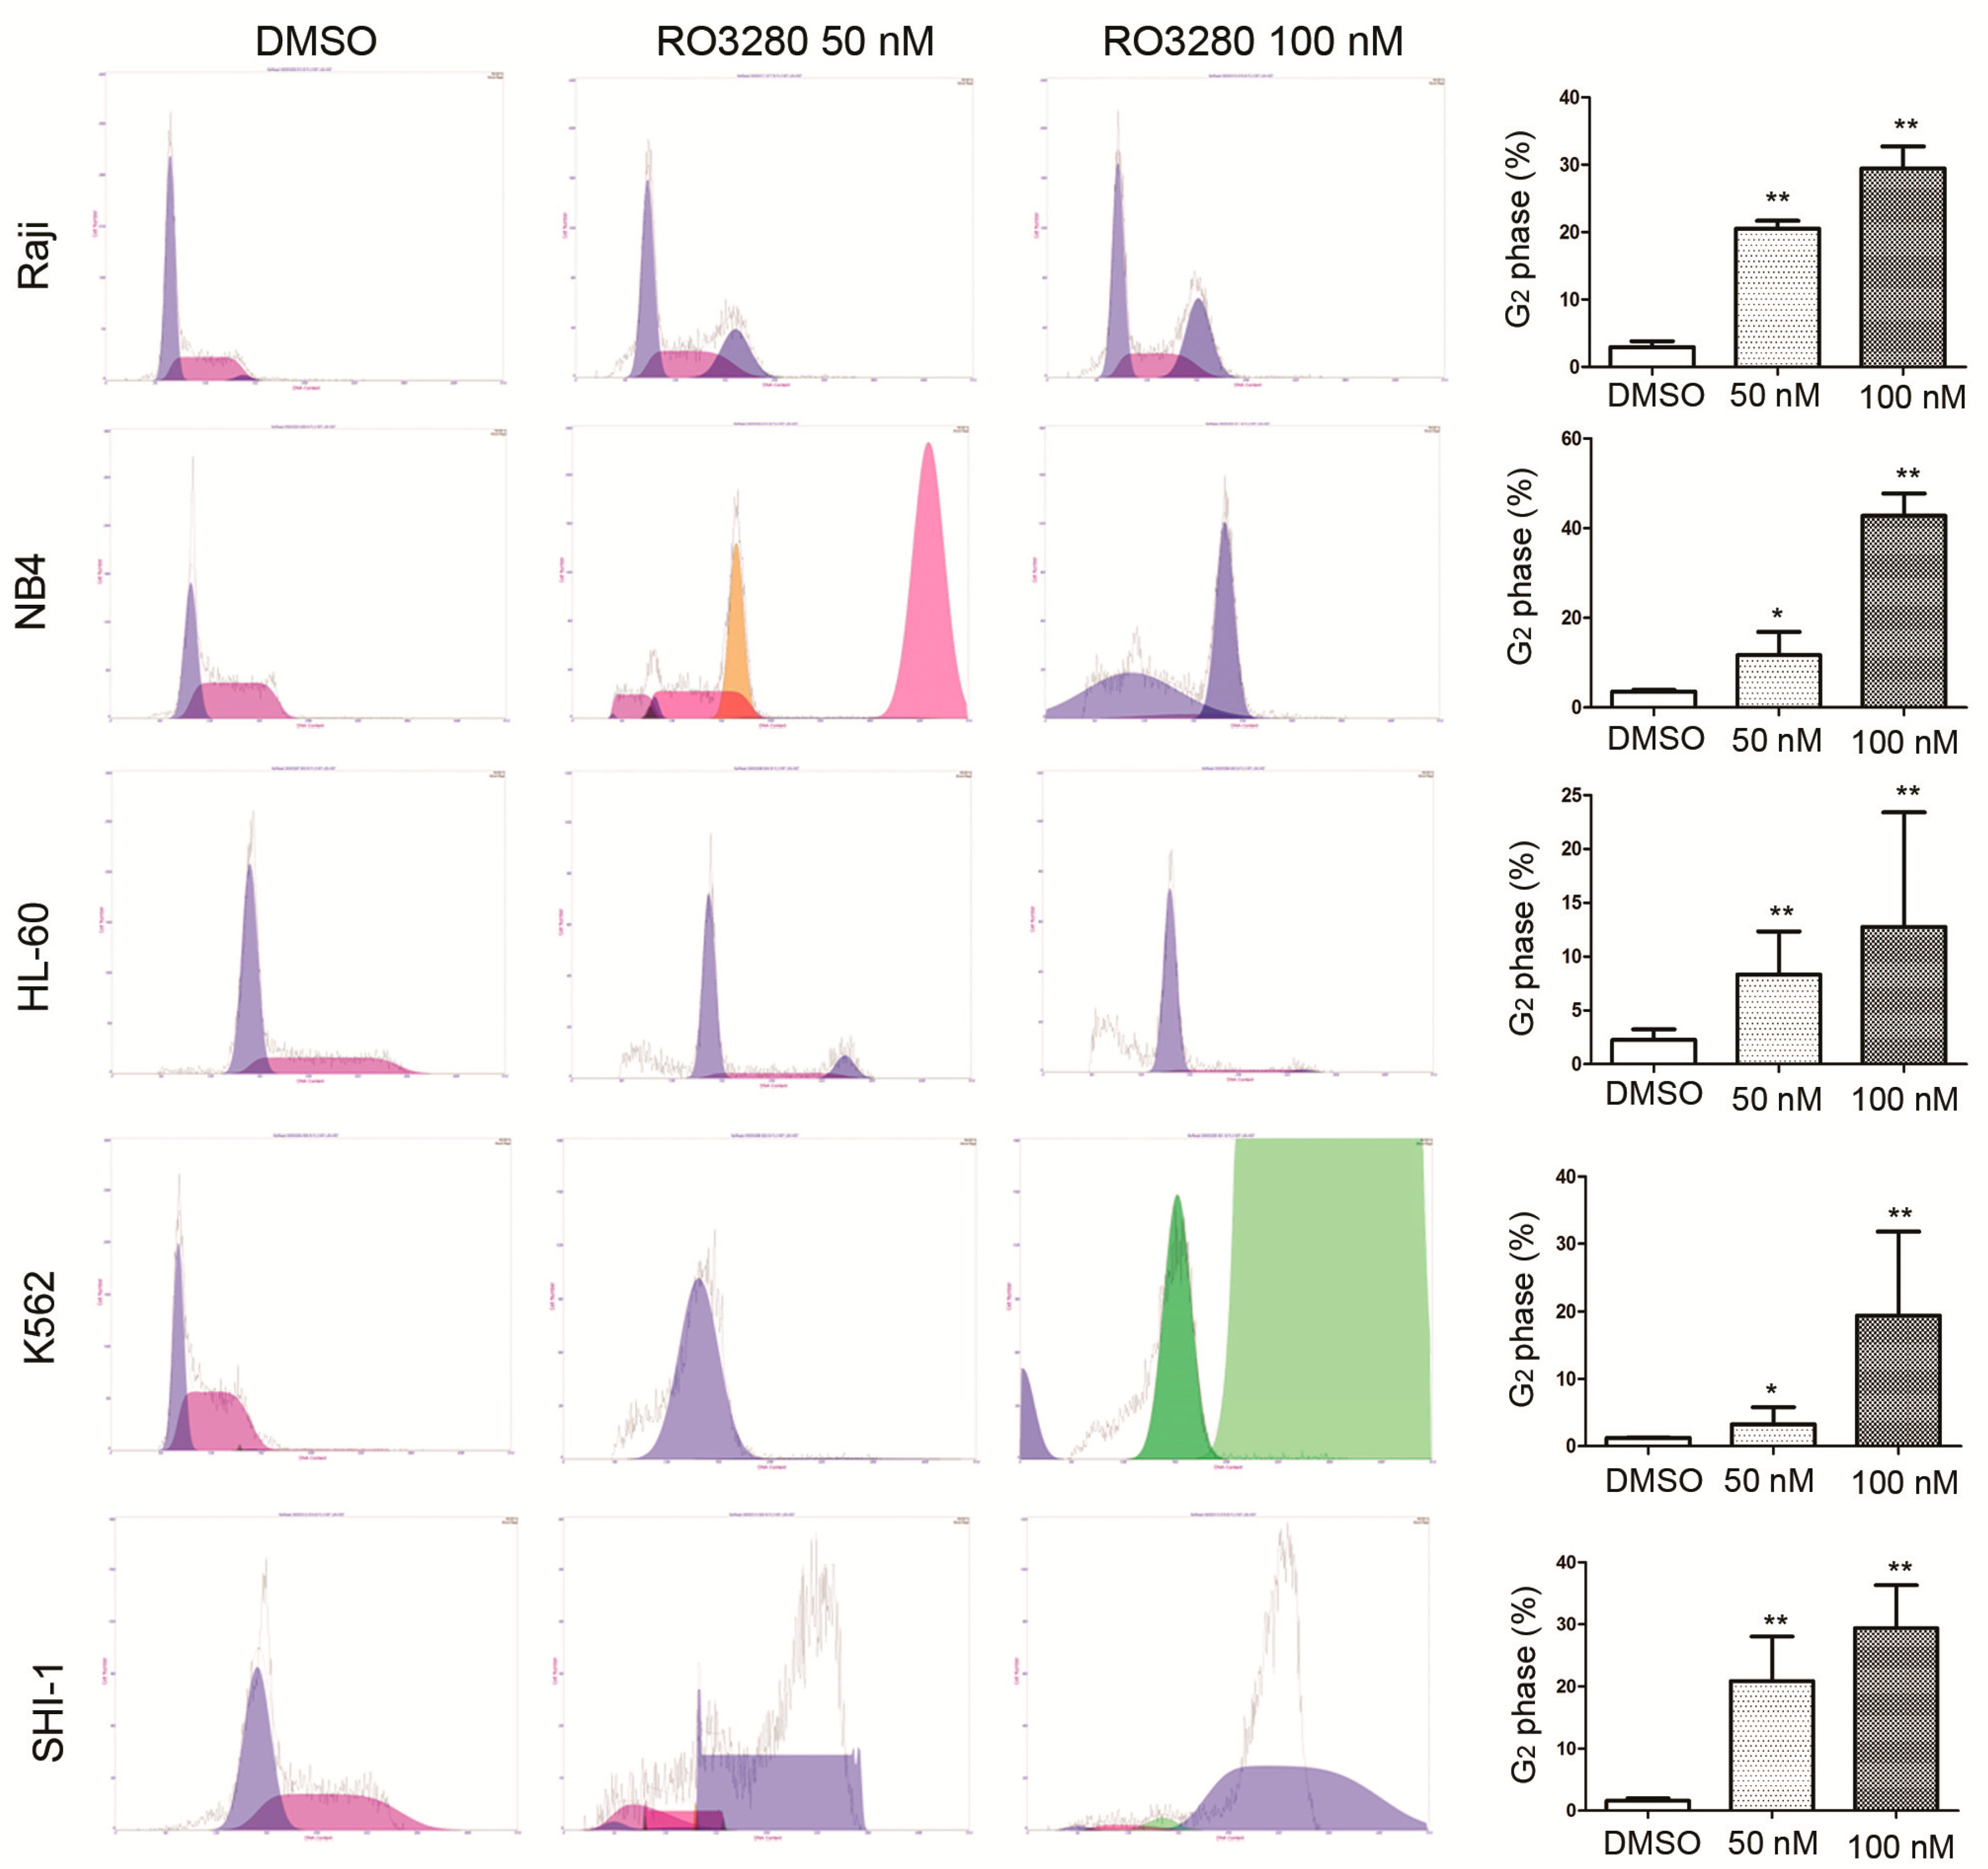
2.3. RO3280 Induced Apoptosis and Cell Cycle Disorder in Leukemia Cells


| Number | Gender | Age (Years) | Diagnosis | ALL Typing | Chromosome Analysis | Fusion Gene | Prednisone Sensitivity | PLK1 | IC50 (nM) |
|---|---|---|---|---|---|---|---|---|---|
| 1 | Female | 5 | ALL | B | 46, XY | Not detected | Sensitive | positive | 35.39 |
| 2 | Male | 4 | ALL | B | 46, XY | TEL/AML1+ | Sensitive | positive | 30.79 |
| 3 | Male | 3 | ALL | B | ALL/53–54, XY, +4, +6, +10, 12p+, +14, +17, +18, +20, +21 | Not detected | Sensitive | positive | 64.43 |
| 4 | Female | 4 | ALL | B | 46, XX | Not detected | Sensitive | positive | 8.27 |
| 5 | Female | 4 | ALL | B | ALL/53–55, XX, +X, 1q+, +4, +6, +10, +11, +15, +17, +21 | Not detected | Sensitive | positive | 36.01 |
| Number | Gender | Age (Years) | Diagnosis | AML Typing | Chromosome Analysis | Fusion Gene | PLK1 | IC50 nM |
|---|---|---|---|---|---|---|---|---|
| 1 | Female | 9 | AML | M4 | 46, XX | FLT3-ITD | positive | 88.65 |
| 2 | Female | 3 | AML | M4 | 46, XX, inv (16) (p13;q22) | CBF/MYH11 | positive | 47.02 |
| 3 | Male | 4 | AML | M5b | 46, XY, −2,+10, t (10;10) (p13;q23) | MLL/AF10 | positive | 28.57 |
| 4 | Male | 12 | AML | M2a | 45, X, −Y, t (8;21) (q22;q22) | AML/ETO | positive | 32.92 |
| 5 | Female | 1 | AML | M4 | 46, XX, inv (16) (p13;q22) | Not detected | positive | 19.20 |


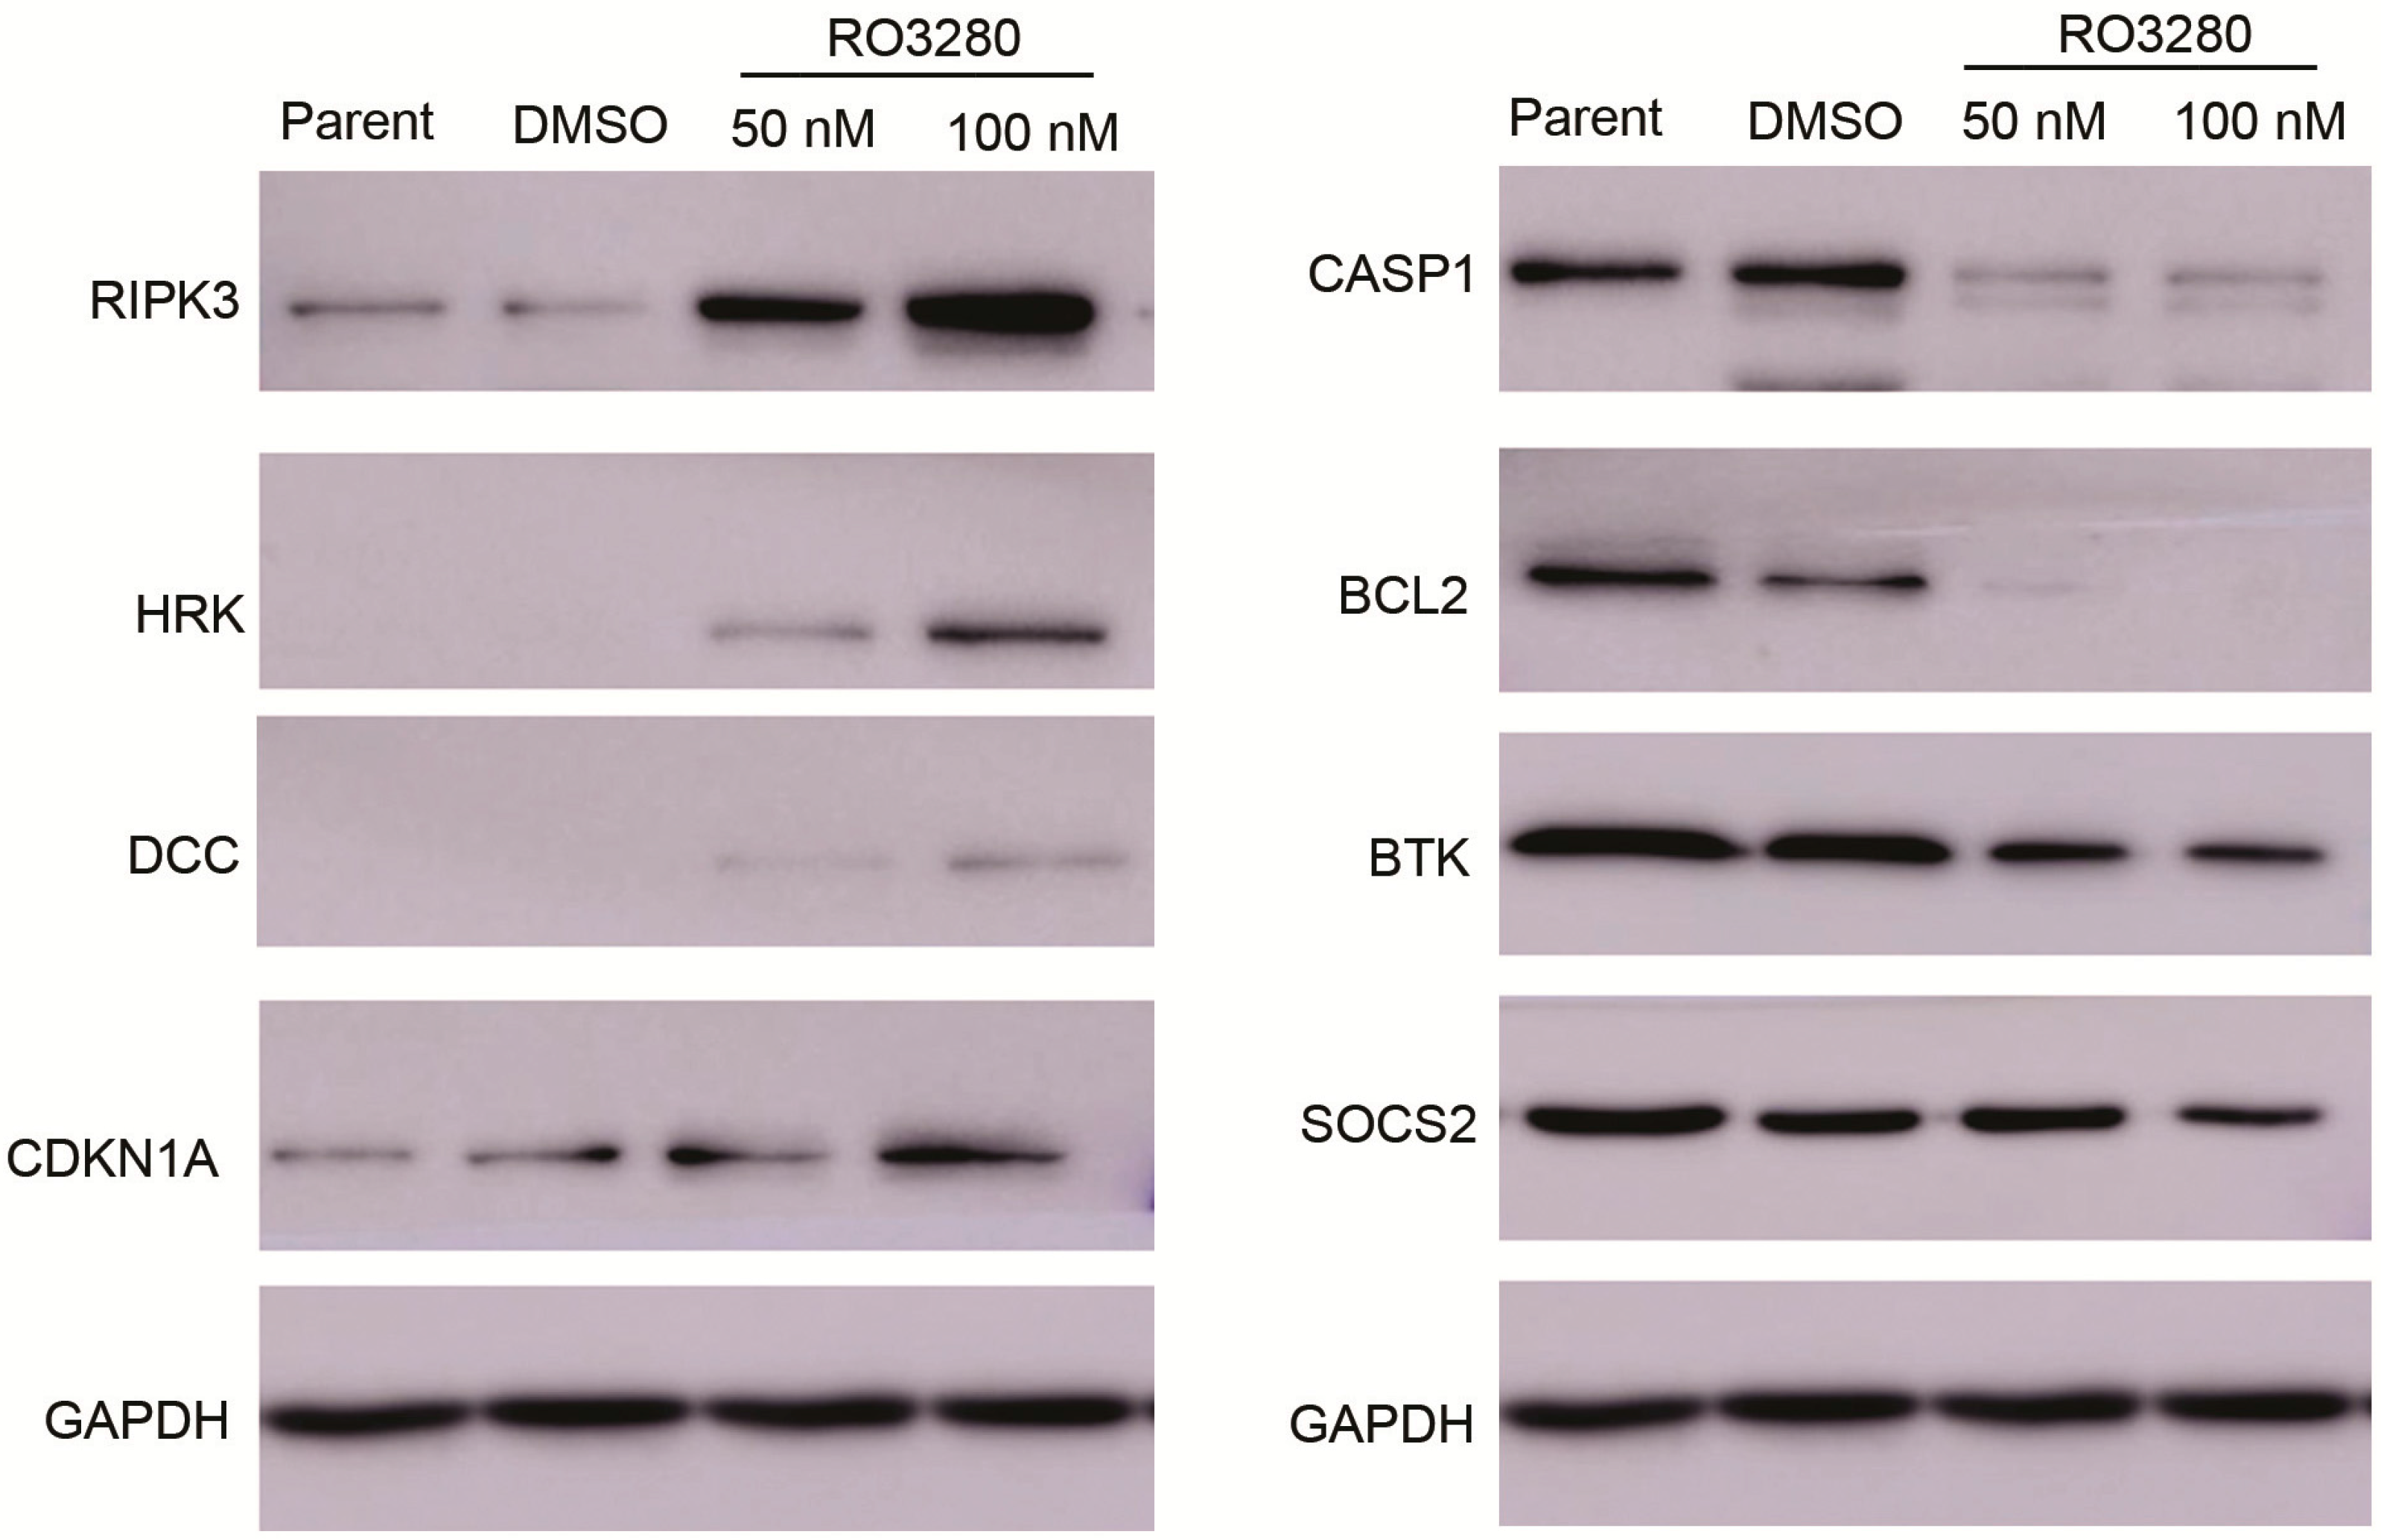
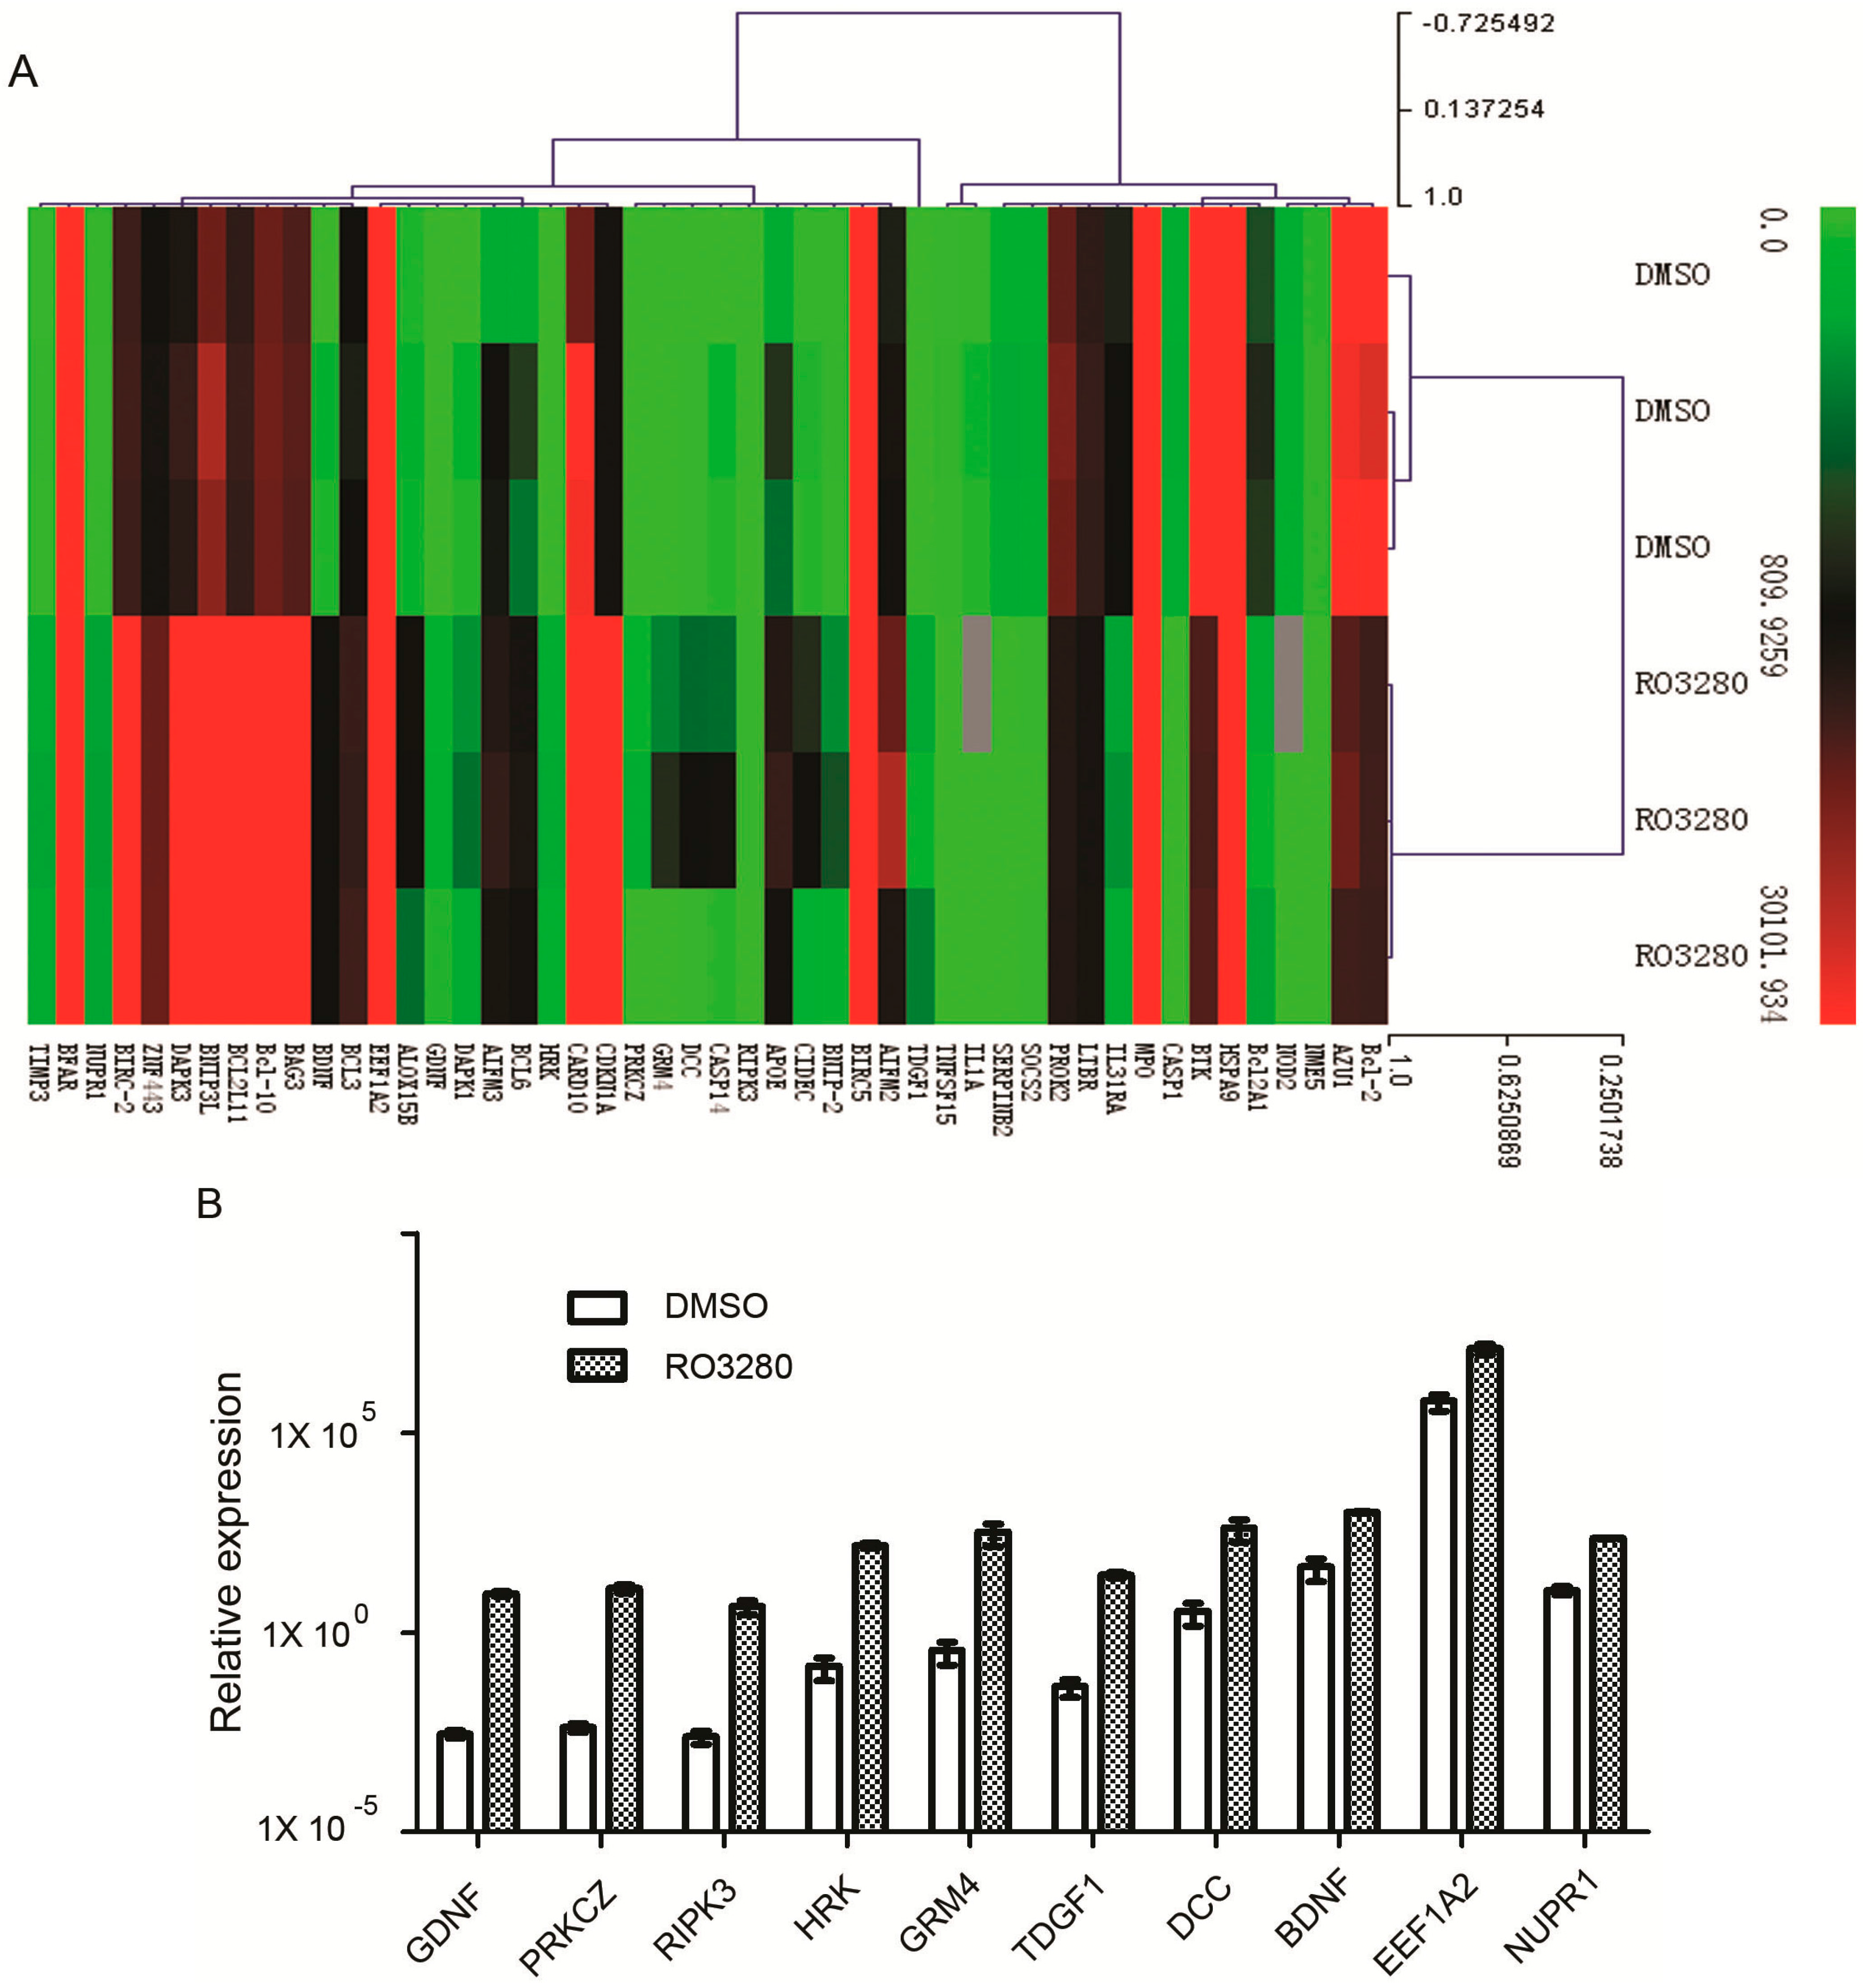
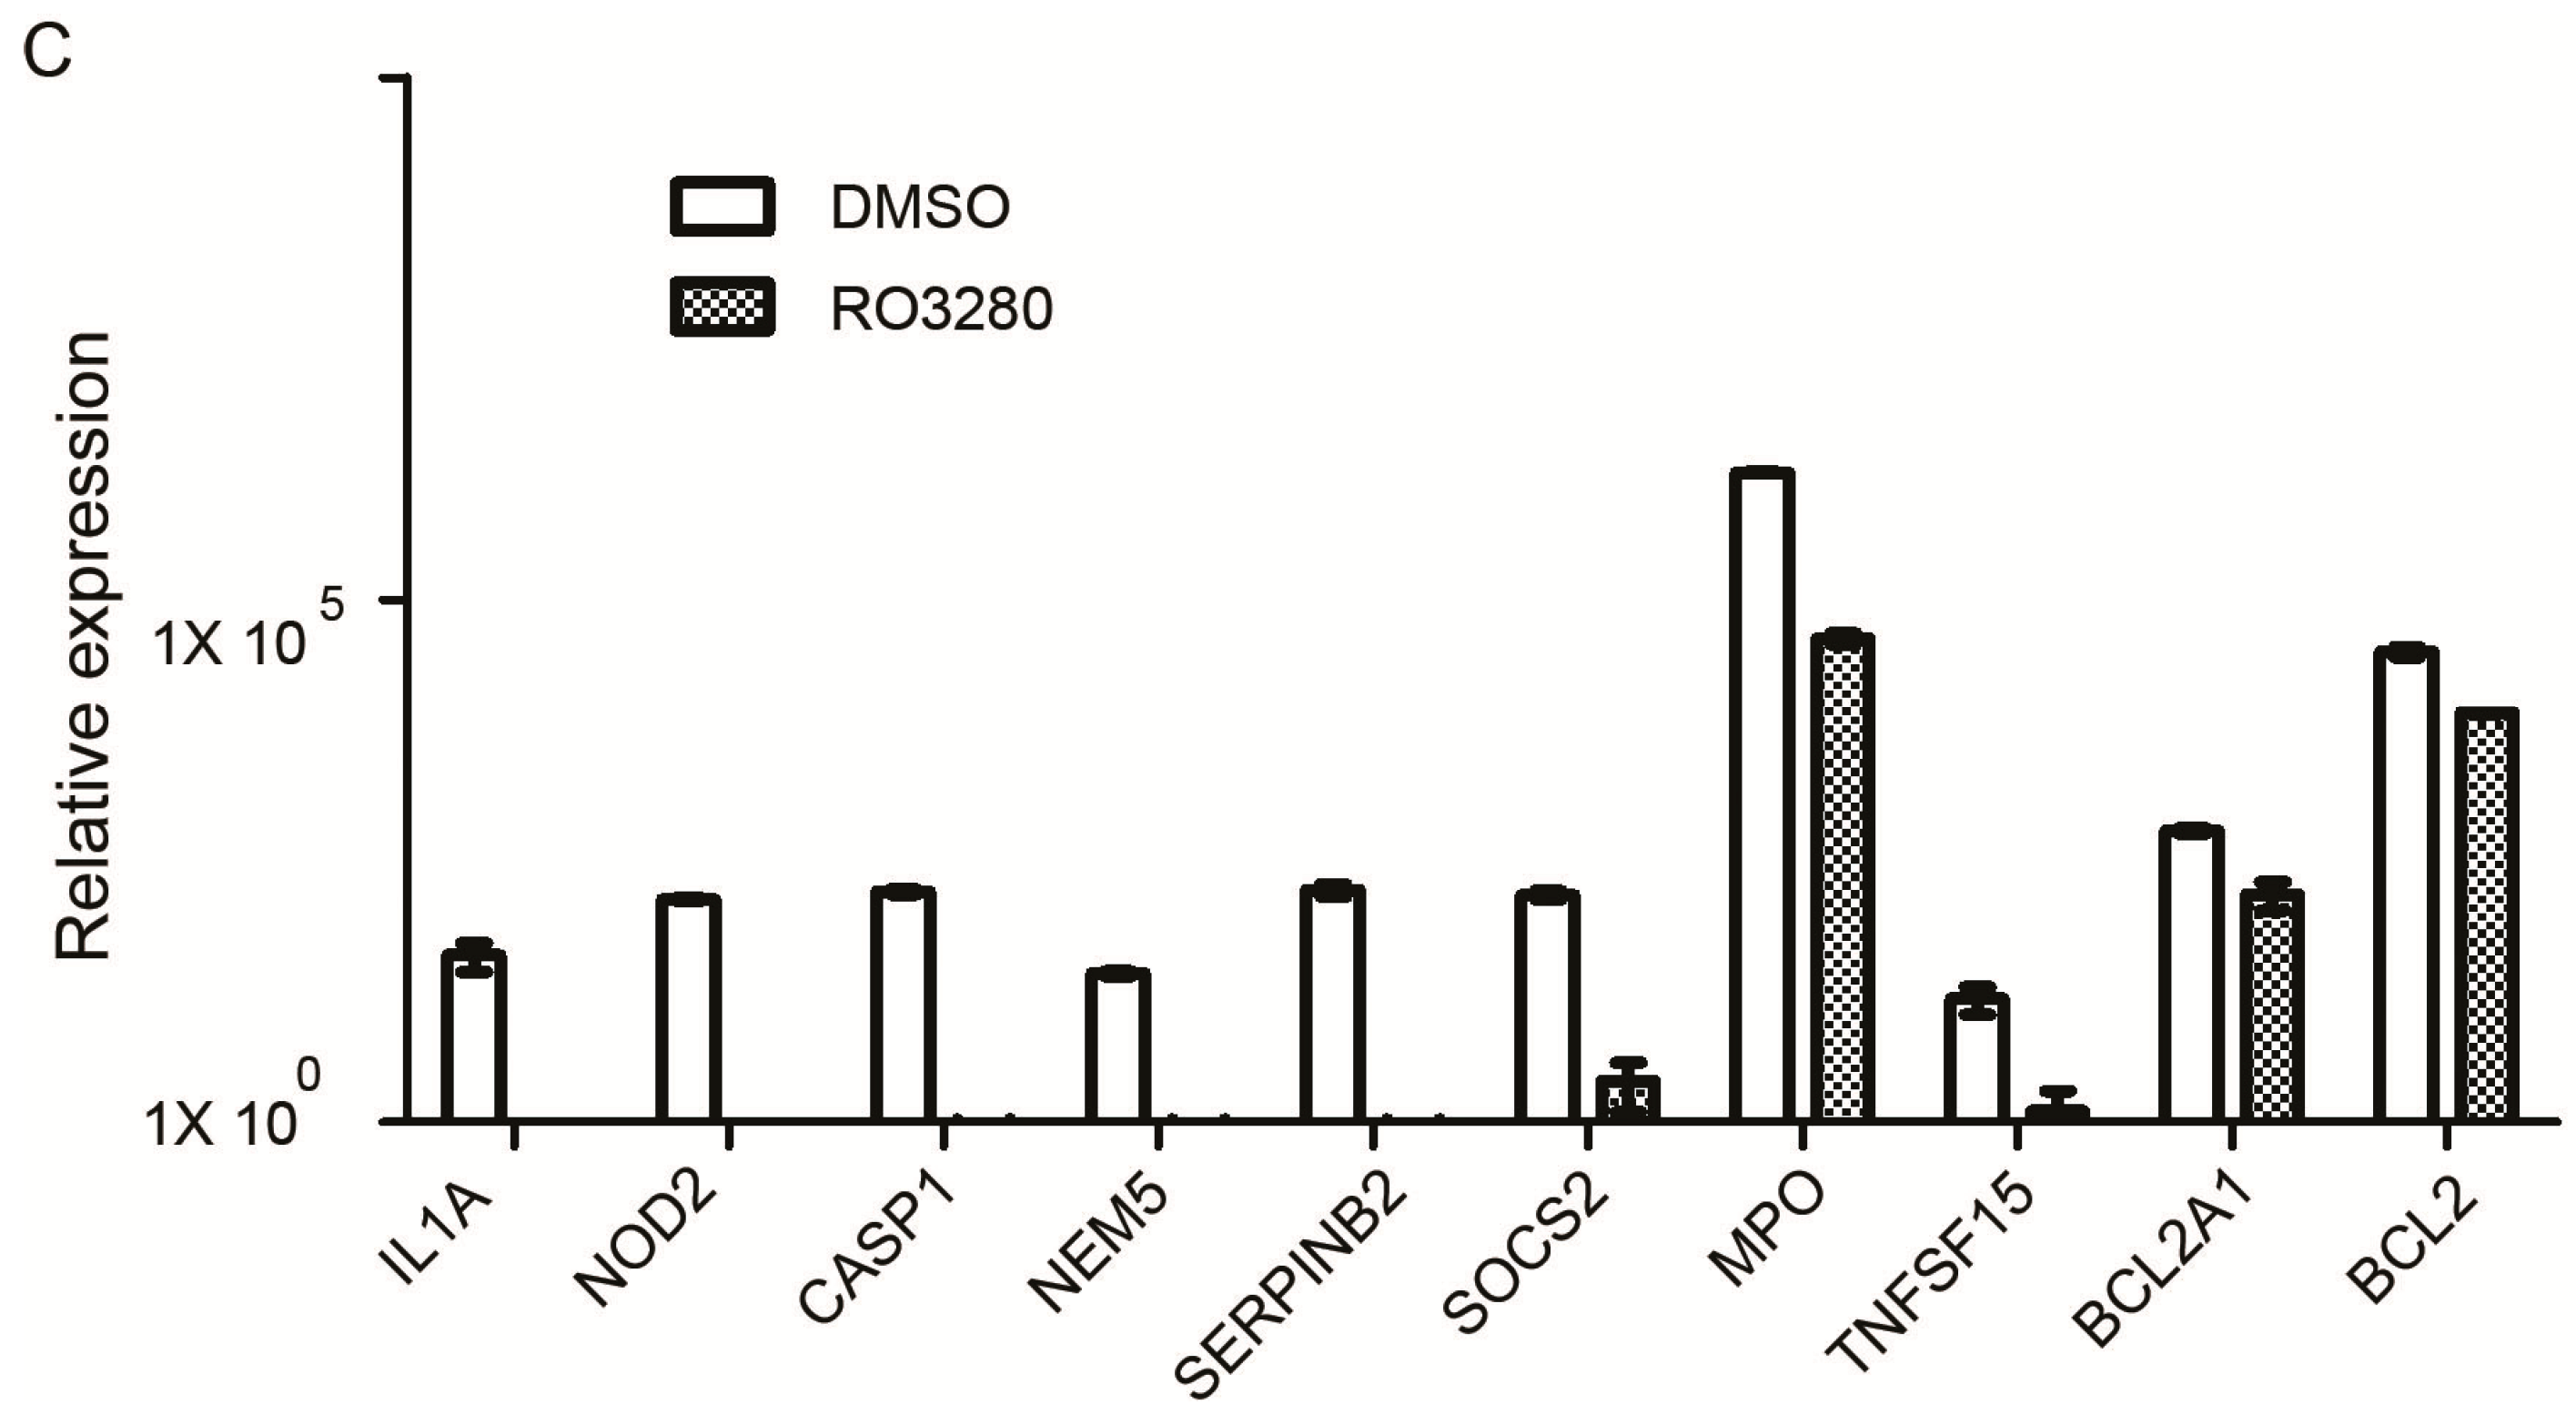
2.4. Real-Time PCR Array Identifies Genes Implicated in the Effect of RO3280 Treatment

| Gene | Description | DMSO | RO3280 | Fold Change | p Value |
|---|---|---|---|---|---|
| GDNF | glial cell derived neurotrophic factor | 0.0029 | 9.4172 | 3262.8632 | 0.0162 |
| PRKCZ | protein kinase C, zeta | 0.0042 | 12.7679 | 3065.9848 | 0.0457 |
| RIPK3 | receptor-interacting serine-threonine kinase 3 | 0.0025 | 4.5249 | 1802.2433 | 0.0126 |
| HRK | harakiri, BCL2 interacting protein | 0.1471 | 150.6503 | 1023.9242 | 0.0246 |
| GRM4 | glutamate receptor, metabotropic 4 | 0.3625 | 335.0571 | 924.1889 | 0.0225 |
| TDGF1 | teratocarcinoma-derived growth factor 1 | 0.0451 | 27.3203 | 605.1673 | 0.0218 |
| DCC | DCC netrin 1 receptor | 3.4002 | 425.7855 | 125.2247 | 0.0225 |
| BDNF | brain-derived neurotrophic factor | 44.1739 | 1023.2023 | 23.1630 | 0.0007 |
| EEF1A2 | eukaryotic translation elongation factor 1 α 2 | 633,377.6354 | 12,905,456.2968 | 20.3756 | 0.0083 |
| NUPR1 | nuclear protein, transcriptional regulator, 1 | 11.4562 | 232.1343 | 20.2629 | 0.0001 |
| CIDEC | cell death-inducing DFFA-like effector c | 33.4482 | 667.6981 | 19.9621 | 0.0187 |
| CDKN1A | cyclin-dependent kinase inhibitor 1A | 2113.7362 | 36,484.2997 | 17.2606 | 0.0113 |
| BNIP-2 | BCL2/adenovirus E1B 19 kDa interacting protein 2 | 18.2415 | 306.7483 | 16.8160 | 0.0145 |
| BIRC5 | baculoviral IAP repeat containing 5 | 60,340.7297 | 981,719.5648 | 16.2696 | 0.0164 |
| TIMP3 | TIMP metallopeptidase inhibitor 3 | 15.1670 | 201.9090 | 13.3124 | 0.0031 |
| CASP14 | caspase 14, apoptosis-related cysteine peptidase | 32.1570 | 410.5166 | 12.7660 | 0.0226 |
| CARD10 | caspase recruitment domain family, member 10 | 28,245.9365 | 329,683.7209 | 11.6719 | 0.0292 |
| ALOX15B | arachidonate 15-lipoxygenase, type B | 68.4589 | 796.1735 | 11.6299 | 0.0488 |
| APOE | apolipoprotein E | 411.8114 | 4632.2654 | 11.2485 | 0.0119 |
| BCL3 | B-cell CLL/lymphoma 3 | 950.2097 | 7763.8336 | 8.1707 | 0.0013 |
| BNIP3L | BCL2/adenovirus E1B 19 kDa interacting protein 3-like | 16,818.9831 | 130,854.4287 | 7.7802 | 0.0001 |
| DAPK1 | death-associated protein kinase 1 | 40.6424 | 287.7947 | 7.0811 | 0.0050 |
| AIFM2 | apoptosis-inducing factor, mitochondrion-associated, 2 | 1759.5718 | 12,454.0471 | 7.0779 | 0.0156 |
| BCL6 | B-cell CLL/lymphoma 6 | 385.7559 | 2574.1201 | 6.6729 | 0.0061 |
| AIFM3 | apoptosis-inducing factor, mitochondrion-associated, 3 | 764.9698 | 5057.6217 | 6.6115 | 0.0500 |
| ZNF443 | zinc finger protein 443 | 2001.5333 | 12,744.6420 | 6.3674 | 0.0009 |
| DAPK3 | death-associated protein kinase 3 | 5607.9528 | 30,206.6219 | 5.3864 | 0.0020 |
| BCL2L11 | BCL2-like 11 (apoptosis facilitator) | 7094.6609 | 34,581.3650 | 4.8743 | 0.0000 |
| BIRC-2 | baculoviral IAP repeat containing 2 | 8366.5954 | 35,580.9121 | 4.2527 | 0.0007 |
| BAG3 | BCL2-associated athanogene 3 | 10,487.7923 | 34,964.8259 | 3.3339 | 0.0002 |
| Bcl-10 | B-cell CLL/lymphoma 10 | 13,170.6013 | 36,171.7865 | 2.7464 | 0.0000 |
| BFAR | bifunctional apoptosis regulator | 14,398.6434 | 31,271.8562 | 2.1719 | 0.0243 |
| Gene | Description | DMSO | RO3280 | Fold Change | p Value |
|---|---|---|---|---|---|
| IL1A | interleukin 1α | 39.8703 | 0.0000 | 0.0000 | 0.0316 |
| NOD2 | nucleotide-binding oligomerization domain containing 2 | 135.5059 | 0.0000 | 0.0000 | 0.0000 |
| CASP1 | caspase 1, apoptosis-related cysteine peptidase | 161.0668 | 0.0011 | 0.0000 | 0.0001 |
| NME5 | NME/NM23 family member 5 | 26.4650 | 0.0006 | 0.0000 | 0.0000 |
| SERPINB2 | serpin peptidase inhibitor, clade B | 168.2487 | 0.2504 | 0.0015 | 0.001 |
| SOCS2 | suppressor of cytokine signaling 2 | 150.3483 | 2.5012 | 0.0166 | 0.0006 |
| MPO | myeloperoxidase | 1,652,217.4204 | 42,599.1776 | 0.0258 | 0.0000 |
| TNFSF15 | tumor necrosis factor superfamily, member 15 | 15.2009 | 1.2803 | 0.0842 | 0.0360 |
| Bcl2A1 | BCL2-related protein A1 | 619.9195 | 152.6633 | 0.2463 | 0.0019 |
| Bcl-2 | B-cell CLL/lymphoma 2 | 31,688.9516 | 8210.5905 | 0.2591 | 0.0026 |
| BTK | Bruton’s agammaglobulinemia tyrosine kinase | 37,873.9816 | 9837.2022 | 0.2597 | 0.0001 |
| IL31RA | interleukin 31 receptor A | 823.6783 | 230.4415 | 0.2798 | 0.0009 |
| PROK2 | prokineticin 2 | 13,280.3733 | 4801.4889 | 0.3615 | 0.0004 |
| AZU1 | azurocidin 1 | 29,361.9342 | 10,755.3769 | 0.3663 | 0.0003 |
| LTBR | lymphotoxin β receptor | 6702.9536 | 2753.6837 | 0.4108 | 0.0004 |
| HSPA9 | heat shock 70 kDa protein 9 | 318,280.1754 | 141,258.3887 | 0.4438 | 0.0000 |
3. Experimental Section
3.1. Cell and Culture Conditions
3.2. Patients and Samples
3.3. CD34+ Cell Purification
3.4. Quantitative Reverse-Transcription PCR for PLK1
3.5. Cell Proliferation and Viability Assay
3.6. Cell Cycle Analysis
3.7. Apoptosis Assay
3.8. Western Blot Analysis
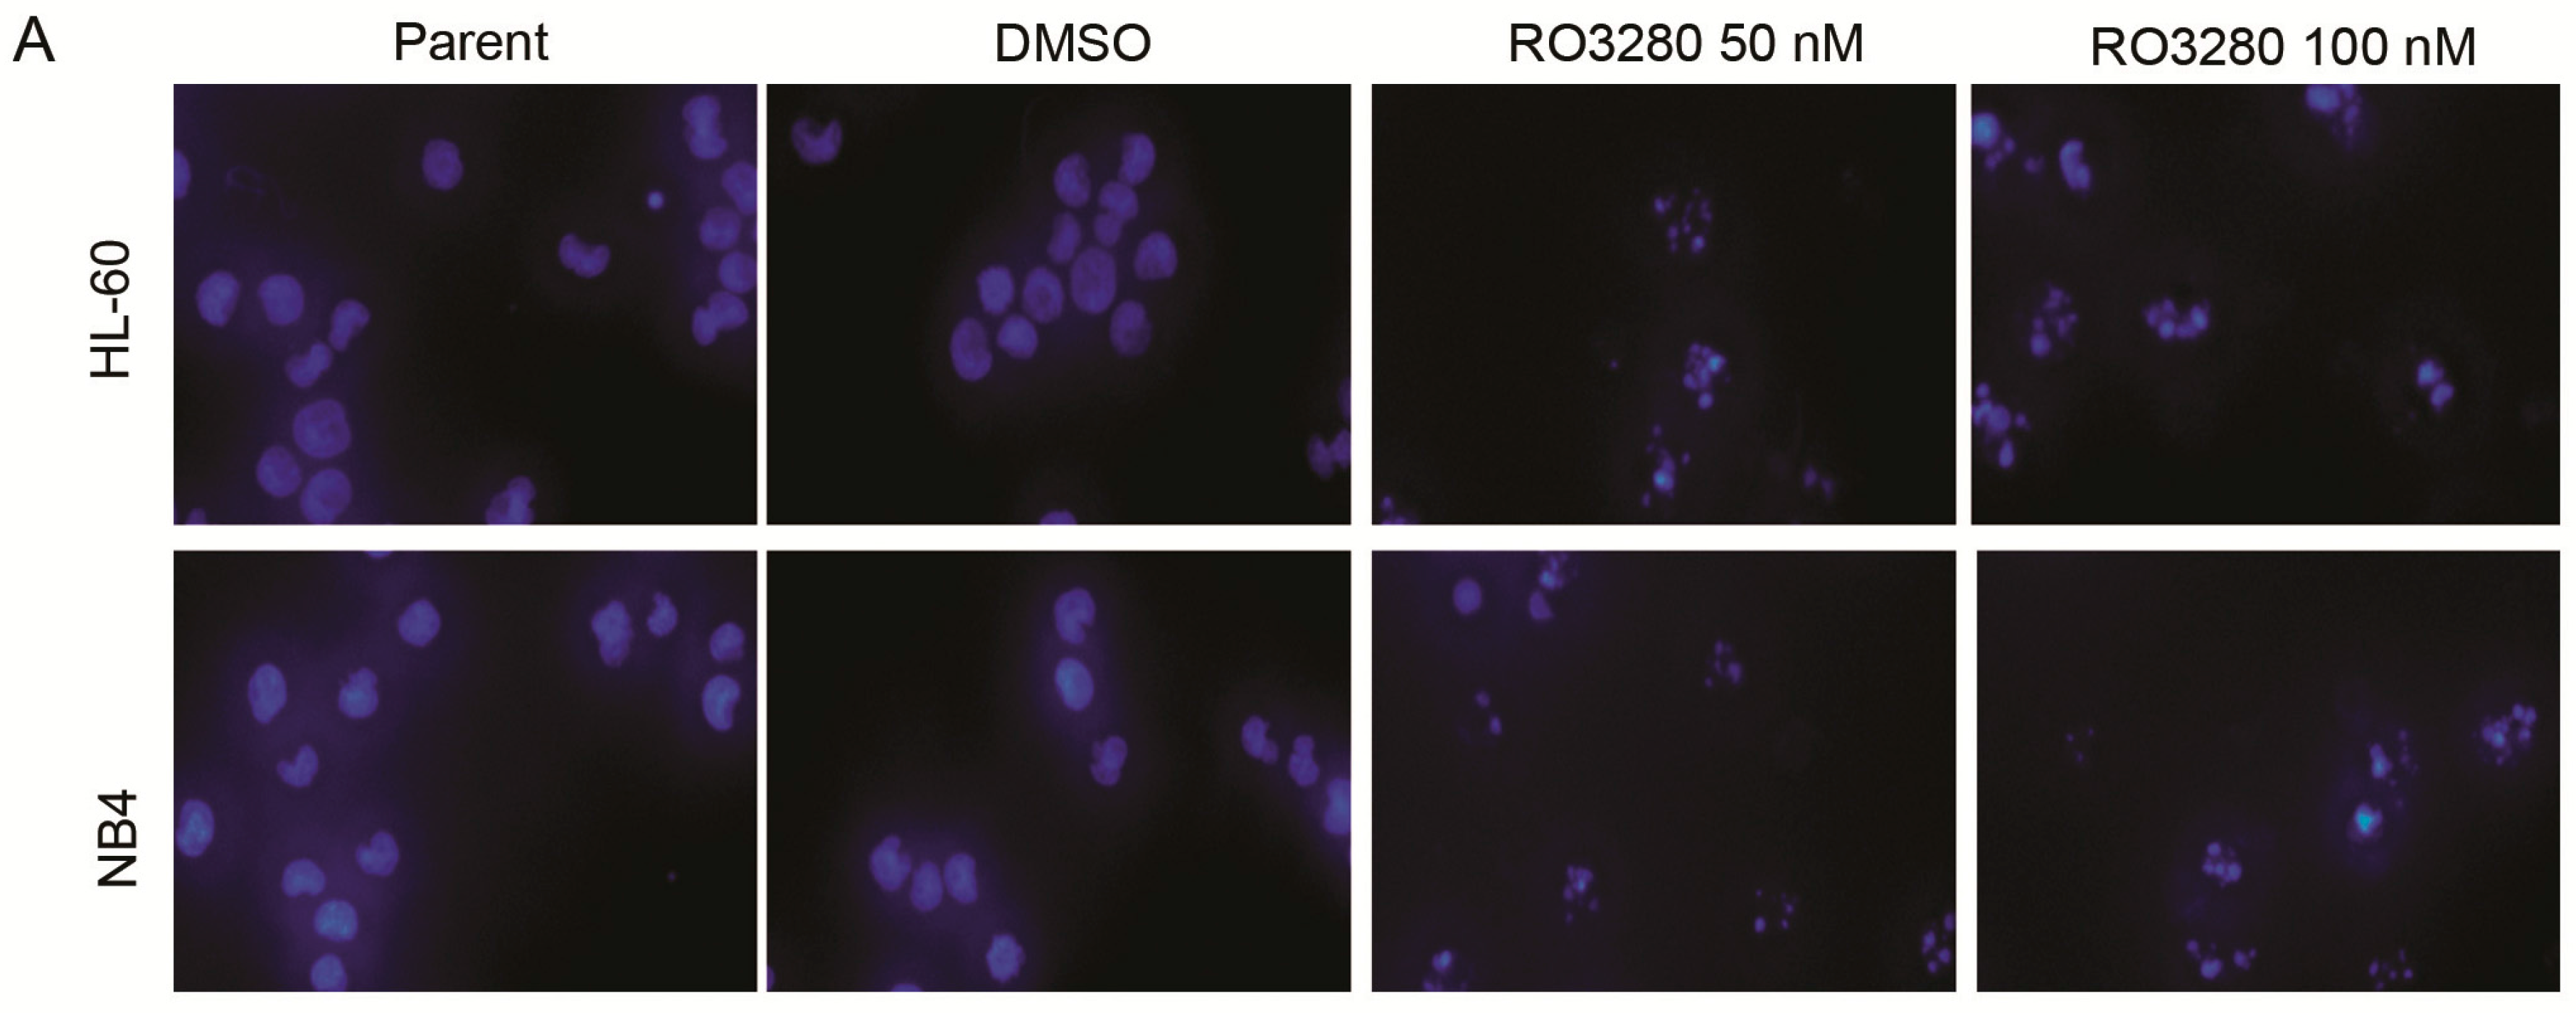
3.9. Hoechst 33342 Staining Analysis
3.10. Real-Time PCR Array Analysis
3.11. Statistical Analysis
4. Conclusions
Acknowledgments
Author Contributions
Conflicts of Interest
References
- Jemal, A.; Thomas, A.; Murray, T.; Thun, M. Cancer statistics. CA Cancer J. Clin. 2002, 52, 23–47. [Google Scholar] [CrossRef] [PubMed]
- Jabbour, E.; Cortes, J.; Ravandi, F.; O’Brien, S.; Kantarjian, H. Targeted therapies in hematology and their impact on patient care: Chronic and acute myeloid leukemia. Semin. Hematol. 2013, 50, 271–283. [Google Scholar] [CrossRef] [PubMed]
- Miano, M.; Micalizzi, C.; Calvillo, M.; Dufour, C. New targets in pediatric acute myeloid leukemia. Immunol. Lett. 2013, 155, 47–50. [Google Scholar] [CrossRef] [PubMed]
- Zhao, Y.; Huang, H.; Wei, G. Novel agents and biomarkers for acute lymphoid leukemia. J. Hematol. Oncol. 2013, 6, 40. [Google Scholar] [CrossRef] [PubMed]
- Moore, A.S.; Kearns, P.R.; Knapper, S.; Pearson, A.D.; Zwaan, C.M. Novel therapies for children with acute myeloid leukaemia. Leukemia 2013, 27, 1451–1460. [Google Scholar] [CrossRef] [PubMed]
- Lancet, J.E. New agents: Great expectations not realized. Best Pract. Res. Clin. Haematol. 2013, 26, 269–274. [Google Scholar] [CrossRef] [PubMed]
- Ostronoff, F.; Estey, E. The role of quizartinib in the treatment of acute myeloid leukemia. Expert Opin. Investig. Drugs 2013, 22, 1659–1669. [Google Scholar] [CrossRef] [PubMed]
- Hales, E.C.; Taub, J.W.; Matherly, L.H. New insights into Notch1 regulation of the PI3K-AKT-mTOR1 signaling axis: Targeted therapy of gamma-secretase inhibitor resistant T-cell acute lymphoblastic leukemia. Cell. Signal. 2014, 26, 149–161. [Google Scholar] [CrossRef] [PubMed]
- Vitagliano, O.; Addeo, R.; D’Angelo, V.; Indolfi, C.; Indolfi, P.; Casale, F. The Bcl-2/Bax and Ras/Raf/MEK/ERK signaling pathways: Implications in pediatric leukemia pathogenesis and new prospects for therapeutic approaches. Expert Rev. Hematol. 2013, 6, 587–597. [Google Scholar] [CrossRef] [PubMed]
- Peloquin, G.L.; Chen, Y.B.; Fathi, A.T. The evolving landscape in the therapy of acute myeloid leukemia. Protein Cell 2013, 4, 735–746. [Google Scholar] [CrossRef] [PubMed]
- Smith, C.C.; Shah, N.P. The role of kinase inhibitors in the treatment of patients with acute myeloid leukemia. Am. Soc. Clin. Oncol. Educ. Book 2013. [Google Scholar] [CrossRef]
- Hatzimichael, E.; Georgiou, G.; Benetatos, L.; Briasoulis, E. Gene mutations and molecularly targeted therapies in acute myeloid leukemia. Am. J. Blood Res. 2013, 3, 29–51. [Google Scholar] [PubMed]
- Gjertsen, B.T.; Schoffski, P. Discovery and development of the Polo-like kinase inhibitor volasertib in cancer therapy. Leukemia 2014. [Google Scholar] [CrossRef]
- Tsykunova, G.; Reikvam, H.; Ahmed, A.B.; Nepstad, I.; Gjertsen, B.T.; Bruserud, O. Targeting of polo-like kinases and their cross talk with Aurora kinases—Possible therapeutic strategies in human acute myeloid leukemia? Expert Opin. Investig. Drugs 2012, 21, 587–603. [Google Scholar] [CrossRef] [PubMed]
- Wasch, R.; Hasskarl, J.; Schnerch, D.; Lubbert, M. BI2536—Targeting the mitotic kinase Polo-like kinase 1 (PLK1). In Small Molecules in Oncology; Springer Berlin Heidelberg: Berlin, Germany, 2010; Volume 184, pp. 215–218. [Google Scholar]
- Zhang, Z.; Zhang, G.; Kong, C. High expression of Polo-like kinase 1 is associated with the metastasis and recurrence in urothelial carcinoma of bladder. Urol. Oncol. 2013, 31, 1222–1230. [Google Scholar] [CrossRef] [PubMed]
- Zhang, G.; Zhang, Z.; Liu, Z. Polo-like kinase 1 is overexpressed in renal cancer and participates in the proliferation and invasion of renal cancer cells. Tumour Biol. 2013, 34, 1887–1894. [Google Scholar] [CrossRef] [PubMed]
- Maire, V.; Nemati, F.; Richardson, M.; Vincent-Salomon, A.; Tesson, B.; Rigaill, G.; Gravier, E.; Marty-Prouvost, B.; de Koning, L.; Lang, G.; et al. Polo-like kinase 1: A potential therapeutic option in combination with conventional chemotherapy for the management of patients with triple-negative breast cancer. Cancer Res. 2013, 73, 813–823. [Google Scholar] [CrossRef] [PubMed]
- Deeraksa, A.; Pan, J.; Sha, Y.; Liu, X.D.; Eissa, N.T.; Lin, S.H.; Yu-Lee, L.Y. PLK1 is upregulated in androgen-insensitive prostate cancer cells and its inhibition leads to necroptosis. Oncogene 2013, 32, 2973–2983. [Google Scholar] [CrossRef] [PubMed]
- Ackermann, S.; Goeser, F.; Schulte, J.H.; Schramm, A.; Ehemann, V.; Hero, B.; Eggert, A.; Berthold, F.; Fischer, M. Polo-like kinase 1 is a therapeutic target in high-risk neuroblastoma. Clin. Cancer Res. 2011, 17, 731–741. [Google Scholar] [CrossRef] [PubMed]
- Pellegrino, R.; Calvisi, D.F.; Ladu, S.; Ehemann, V.; Staniscia, T.; Evert, M.; Dombrowski, F.; Schirmacher, P.; Longerich, T. Oncogenic and tumor suppressive roles of Polo-like kinases in human hepatocellular carcinoma. Hepatology 2010, 51, 857–868. [Google Scholar] [PubMed]
- Zhang, Y.; Liu, Y.; Yang, Y.X.; Xia, J.H.; Zhang, H.X.; Li, H.B.; Yu, C.Z. The expression of PLK-1 in cervical carcinoma: A possible target for enhancing chemosensitivity. J. Exp. Clin. Cancer Res. 2009, 28, 130. [Google Scholar] [CrossRef] [PubMed]
- Schmit, T.L.; Zhong, W.; Nihal, M.; Ahmad, N. Polo-like kinase 1 (PLK1) in non-melanoma skin cancers. Cell Cycle 2009, 8, 2697–2702. [Google Scholar] [CrossRef] [PubMed]
- Renner, A.G.; Dos Santos, C.; Recher, C.; Bailly, C.; Creancier, L.; Kruczynski, A.; Payrastre, B.; Manenti, S. Polo-like kinase 1 is overexpressed in acute myeloid leukemia and its inhibition preferentially targets the proliferation of leukemic cells. Blood 2009, 114, 659–662. [Google Scholar] [CrossRef] [PubMed]
- Zhang, Y.; Du, X.L.; Wang, C.J.; Lin, D.C.; Ruan, X.; Feng, Y.B.; Huo, Y.Q.; Peng, H.; Cui, J.L.; Zhang, T.T.; et al. Reciprocal activation between PLK1 and STAT3 contributes to survival and proliferation of esophageal cancer cells. Gastroenterology 2012, 142, 521–530. [Google Scholar] [CrossRef] [PubMed]
- Behren, A.; Muhlen, S.; Acuna Sanhueza, G.A.; Schwager, C.; Plinkert, P.K.; Huber, P.E.; Abdollahi, A.; Simon, C. Phenotype-assisted transcriptome analysis identifies FOXM1 downstream from Ras-MKK3-p38 to regulate in vitro cellular invasion. Oncogene 2010, 29, 1519–1530. [Google Scholar] [CrossRef] [PubMed]
- Malumbres, M. Preclinical models for cell cycle-targeted therapies. Adv. Exp. Med. Biol. 2006, 587, 139–147. [Google Scholar] [PubMed]
- Valsasina, B.; Beria, I.; Alli, C.; Alzani, R.; Avanzi, N.; Ballinari, D.; Cappella, P.; Caruso, M.; Casolaro, A.; Ciavolella, A.; et al. NMS-P937, an orally available, specific small-molecule Polo-like kinase 1 inhibitor with antitumor activity in solid and hematologic malignancies. Mol. Cancer Ther. 2012, 11, 1006–1016. [Google Scholar] [CrossRef] [PubMed]
- Hikichi, Y.; Honda, K.; Hikami, K.; Miyashita, H.; Kaieda, I.; Murai, S.; Uchiyama, N.; Hasegawa, M.; Kawamoto, T.; Sato, T.; et al. TAK-960, a novel, orally available, selective inhibitor of Polo-like kinase 1, shows broad-spectrum preclinical antitumor activity in multiple dosing regimens. Mol. Cancer Ther. 2012, 11, 700–709. [Google Scholar] [CrossRef] [PubMed]
- Chen, S.; Bartkovitz, D.; Cai, J.; Chen, Y.; Chen, Z.; Chu, X.J.; Le, K.; Le, N.T.; Luk, K.C.; Mischke, S.; et al. Identification of novel, potent and selective inhibitors of Polo-like kinase 1. Bioorgan. Med. Chem. Lett. 2012, 22, 1247–1250. [Google Scholar] [CrossRef]
- Gumireddy, K.; Reddy, M.V.; Cosenza, S.C.; Boominathan, R.; Baker, S.J.; Papathi, N.; Jiang, J.; Holland, J.; Reddy, E.P. ON01910, a non-ATP-competitive small molecule inhibitor of PLK1, is a potent anticancer agent. Cancer Cell 2005, 7, 275–286. [Google Scholar] [CrossRef] [PubMed]
- Oliveira, J.C.; Pezuk, J.A.; Brassesco, M.S.; Morales, A.G.; Queiroz, R.G.; Scrideli, C.A.; Tone, L.G. PLK1 expression and BI2536 effects in childhood acute lymphoblastic leukemia. Pediatr. Blood Cancer 2014, 61, 1227–1231. [Google Scholar] [CrossRef] [PubMed]
- Dasmahapatra, G.; Patel, H.; Nguyen, T.; Attkisson, E.; Grant, S. PLK1 inhibitors synergistically potentiate HDAC inhibitor lethality in imatinib mesylate-sensitive or resistant BCR/ABL+ leukemia cells in vitro and in vivo. Clin. Cancer Res. 2013, 19, 404–414. [Google Scholar] [CrossRef] [PubMed]
- Ikezoe, T.; Yang, J.; Nishioka, C.; Takezaki, Y.; Tasaka, T.; Togitani, K.; Koeffler, H.P.; Yokoyama, A. A novel treatment strategy targeting Polo-like kinase 1 in hematological malignancies. Leukemia 2009, 23, 1564–1576. [Google Scholar] [CrossRef] [PubMed]
- Berg, T.; Bug, G.; Ottmann, O.G.; Strebhardt, K. Polo-like kinases in AML. Expert Opin. Investig. Drugs 2012, 21, 1069–1074. [Google Scholar] [CrossRef] [PubMed]
- Stadler, W.M.; Vaughn, D.J.; Sonpavde, G.; Vogelzang, N.J.; Tagawa, S.T.; Petrylak, D.P.; Rosen, P.; Lin, C.C.; Mahoney, J.; Modi, S.; et al. An open-label, single-arm, phase 2 trial of the Polo-like kinase inhibitor volasertib (BI6727) in patients with locally advanced or metastatic urothelial cancer. Cancer 2014, 120, 976–982. [Google Scholar] [CrossRef] [PubMed]
- Lin, C.C.; Su, W.C.; Yen, C.J.; Hsu, C.H.; Su, W.P.; Yeh, K.H.; Lu, Y.S.; Cheng, A.L.; Huang, D.C.; Fritsch, H.; et al. A phase I study of two dosing schedules of volasertib (BI6727), an intravenous Polo-like kinase inhibitor, in patients with advanced solid malignancies. Br. J. Cancer 2014, 110, 2434–2440. [Google Scholar] [CrossRef] [PubMed]
- Wagenblast, J.; Hirth, D.; Thron, L.; Arnoldner, C.; Diensthuber, M.; Stover, T.; Hambek, M. Effects of the Polo-like-kinase-1-inhibitor BI2536 in squamous cell carcinoma cell lines of the head and neck. Oncol. Lett. 2012, 4, 175–177. [Google Scholar] [PubMed]
- Nie, Z.; Feher, V.; Natala, S.; McBride, C.; Kiryanov, A.; Jones, B.; Lam, B.; Liu, Y.; Kaldor, S.; Stafford, J.; et al. Discovery of TAK-960: An orally available small molecule inhibitor of Polo-like kinase 1 (PLK1). Bioorg. Med. Chem. Lett. 2013, 23, 3662–3666. [Google Scholar] [CrossRef] [PubMed]
- Oussenko, I.A.; Holland, J.F.; Reddy, E.P.; Ohnuma, T. Effect of ON 01910. Na, an anticancer mitotic inhibitor, on cell-cycle progression correlates with RanGAP1 hyperphosphorylation. Cancer Res. 2011, 71, 4968–4976. [Google Scholar] [CrossRef] [PubMed]
- Bowles, D.W.; Diamond, J.R.; Lam, E.T.; Weekes, C.D.; Astling, D.P.; Anderson, R.T.; Leong, S.; Gore, L.; Varella-Garcia, M.; Vogler, B.W.; et al. Phase I study of oral rigosertib (ON 01910. Na), a dual inhibitor of the PI3K and PLK1 pathways, in adult patients with advanced solid malignancies. Clin. Cancer Res. 2014, 20, 1656–1665. [Google Scholar] [CrossRef] [PubMed]
- Garuti, L.; Roberti, M.; Bottegoni, G. Polo-like kinases inhibitors. Curr. Med. Chem. 2012, 19, 3937–3948. [Google Scholar] [CrossRef] [PubMed]
- Schmittgen, T.D.; Lee, E.J.; Jiang, J. High-throughput real-time PCR. Methods Mol. Biol. 2008, 429, 89–98. [Google Scholar] [PubMed]
- Liu, X. PLK1, a negative regulator of p21. Cell Cycle 2009, 8, 336–337. [Google Scholar] [PubMed]
- Kreis, N.N.; Louwen, F.; Zimmer, B.; Yuan, J. Loss of p21Cip1/CDKN1A renders cancer cells susceptible to Polo-like kinase 1 inhibition. Oncotarget 2014, in press. [Google Scholar]
- Driscoll, D.L.; Chakravarty, A.; Bowman, D.; Shinde, V.; Lasky, K.; Shi, J.; Vos, T.; Stringer, B.; Amidon, B.; D’Amore, N.; et al. PLK1 inhibition causes post-mitotic DNA damage and senescence in a range of human tumor cell lines. PLoS One 2014, 9, e111060. [Google Scholar] [CrossRef] [PubMed]
- Thalhammer, V.; Lopez-Garcia, L.A.; Herrero Martin, D.; Hecker, R.; Laubscher, D.; Gierisch, M.E.; Wachtel, M.; Bode, P.; Nanni, P.; Blank, B.; et al. PLK1 phosphorylates PAX3-FOXO1 the inhibition of which triggers regression of alveolar rhabdomyosarcoma. Cancer Res. 2014. [Google Scholar] [CrossRef]
- Zhao, J.; Jitkaew, S.; Cai, Z.; Choksi, S.; Li, Q.; Luo, J.; Liu, Z.G. Mixed lineage kinase domain-like is a key receptor interacting protein 3 downstream component of TNF-induced necrosis. Proc. Natl. Acad. Sci. USA 2012, 109, 5322–5327. [Google Scholar] [CrossRef] [PubMed]
- Haddick, P.C.; Tom, I.; Luis, E.; Quinones, G.; Wranik, B.J.; Ramani, S.R.; Stephan, J.P.; Tessier-Lavigne, M.; Gonzalez, L.C. Defining the ligand specificity of the deleted in colorectal cancer (DCC) receptor. PLoS One 2014, 9, e84823. [Google Scholar] [CrossRef] [PubMed]
- Meimei, L.; Peiling, L.; Baoxin, L.; Changmin, L.; Rujin, Z.; Chunjie, H. Lost expression of DCC gene in ovarian cancer and its inhibition in ovarian cancer cells. Med. Oncol. 2011, 28, 282–289. [Google Scholar] [CrossRef] [PubMed]
- Inohara, N.; Ding, L.; Chen, S.; Nunez, G. harakiri, A novel regulator of cell death, encodes a protein that activates apoptosis and interacts selectively with survival-promoting proteins BCL-2 and BCL-XL. EMBO J. 1997, 16, 1686–1694. [Google Scholar] [CrossRef] [PubMed]
- Choi, B.; Pagano, M.; Dai, W. PLK1 phosphorylates PTEN and regulates its mitotic activity during the cell cycle. J. Biol. Chem. 2014, 20, 14066–14074. [Google Scholar] [CrossRef]
- Bustin, S.A.; Benes, V.; Garson, J.A.; Hellemans, J.; Huggett, J.; Kubista, M.; Mueller, R.; Nolan, T.; Pfaffl, M.W.; Shipley, G.L.; et al. The MIQE guidelines: Minimum information for publication of quantitative real-time PCR experiments. Clin. Chem. 2009, 55, 611–622. [Google Scholar] [CrossRef] [PubMed]
© 2015 by the authors; licensee MDPI, Basel, Switzerland. This article is an open access article distributed under the terms and conditions of the Creative Commons Attribution license (http://creativecommons.org/licenses/by/4.0/).
Share and Cite
Wang, N.-N.; Li, Z.-H.; Zhao, H.; Tao, Y.-F.; Xu, L.-X.; Lu, J.; Cao, L.; Du, X.-J.; Sun, L.-C.; Zhao, W.-L.; et al. Molecular Targeting of the Oncoprotein PLK1 in Pediatric Acute Myeloid Leukemia: RO3280, a Novel PLK1 Inhibitor, Induces Apoptosis in Leukemia Cells. Int. J. Mol. Sci. 2015, 16, 1266-1292. https://doi.org/10.3390/ijms16011266
Wang N-N, Li Z-H, Zhao H, Tao Y-F, Xu L-X, Lu J, Cao L, Du X-J, Sun L-C, Zhao W-L, et al. Molecular Targeting of the Oncoprotein PLK1 in Pediatric Acute Myeloid Leukemia: RO3280, a Novel PLK1 Inhibitor, Induces Apoptosis in Leukemia Cells. International Journal of Molecular Sciences. 2015; 16(1):1266-1292. https://doi.org/10.3390/ijms16011266
Chicago/Turabian StyleWang, Na-Na, Zhi-Heng Li, He Zhao, Yan-Fang Tao, Li-Xiao Xu, Jun Lu, Lan Cao, Xiao-Juan Du, Li-Chao Sun, Wen-Li Zhao, and et al. 2015. "Molecular Targeting of the Oncoprotein PLK1 in Pediatric Acute Myeloid Leukemia: RO3280, a Novel PLK1 Inhibitor, Induces Apoptosis in Leukemia Cells" International Journal of Molecular Sciences 16, no. 1: 1266-1292. https://doi.org/10.3390/ijms16011266
APA StyleWang, N.-N., Li, Z.-H., Zhao, H., Tao, Y.-F., Xu, L.-X., Lu, J., Cao, L., Du, X.-J., Sun, L.-C., Zhao, W.-L., Xiao, P.-F., Fang, F., Su, G.-H., Li, Y.-H., Li, G., Li, Y.-P., Xu, Y.-Y., Zhou, H.-T., Wu, Y., ... Pan, J. (2015). Molecular Targeting of the Oncoprotein PLK1 in Pediatric Acute Myeloid Leukemia: RO3280, a Novel PLK1 Inhibitor, Induces Apoptosis in Leukemia Cells. International Journal of Molecular Sciences, 16(1), 1266-1292. https://doi.org/10.3390/ijms16011266