2.1. Sequence Alignment and Structure Modeling
Pyrobaculum sp. 1860 is capable of growing in harsh environments (84 °C, pH 6.8), which makes it an attractive source for thermostable enzymes. According to the genome annotation of this strain, only one gene (Uniprot: G7VG08, designated as
P186_1588) was found to encode a putative carboxylesterase. The gene
P186_1588 consists of 585 bp with GC content of 63.6%, and encodes a protein composed of 194 amino acids with molecular weight and pI calculated to be 21,131 Da and 6.32, respectively. A BLASTP search using the PDB protein database revealed that P186_1588 showed low identity with other carboxylesterases including the uncharacterized carboxylesterase (PDB: 3BDI) from
Thermoplasma acidophilum (identity: 30%, coverage: 99%); the carboxylesterase (PDB: 3HI4) from
Pseudomonas fluorenscens DSM 12885 (identity: 27%, coverage: 82%) [
25]; the carboxylesterase (PDB: 4CCW) from
Bacillus subtilis (identity: 29%, coverage: 87%); and the carboxylesterase (PDB: 4FHZ) from
Rhodobacter sphaeroides (identity: 32%, coverage: 69%) [
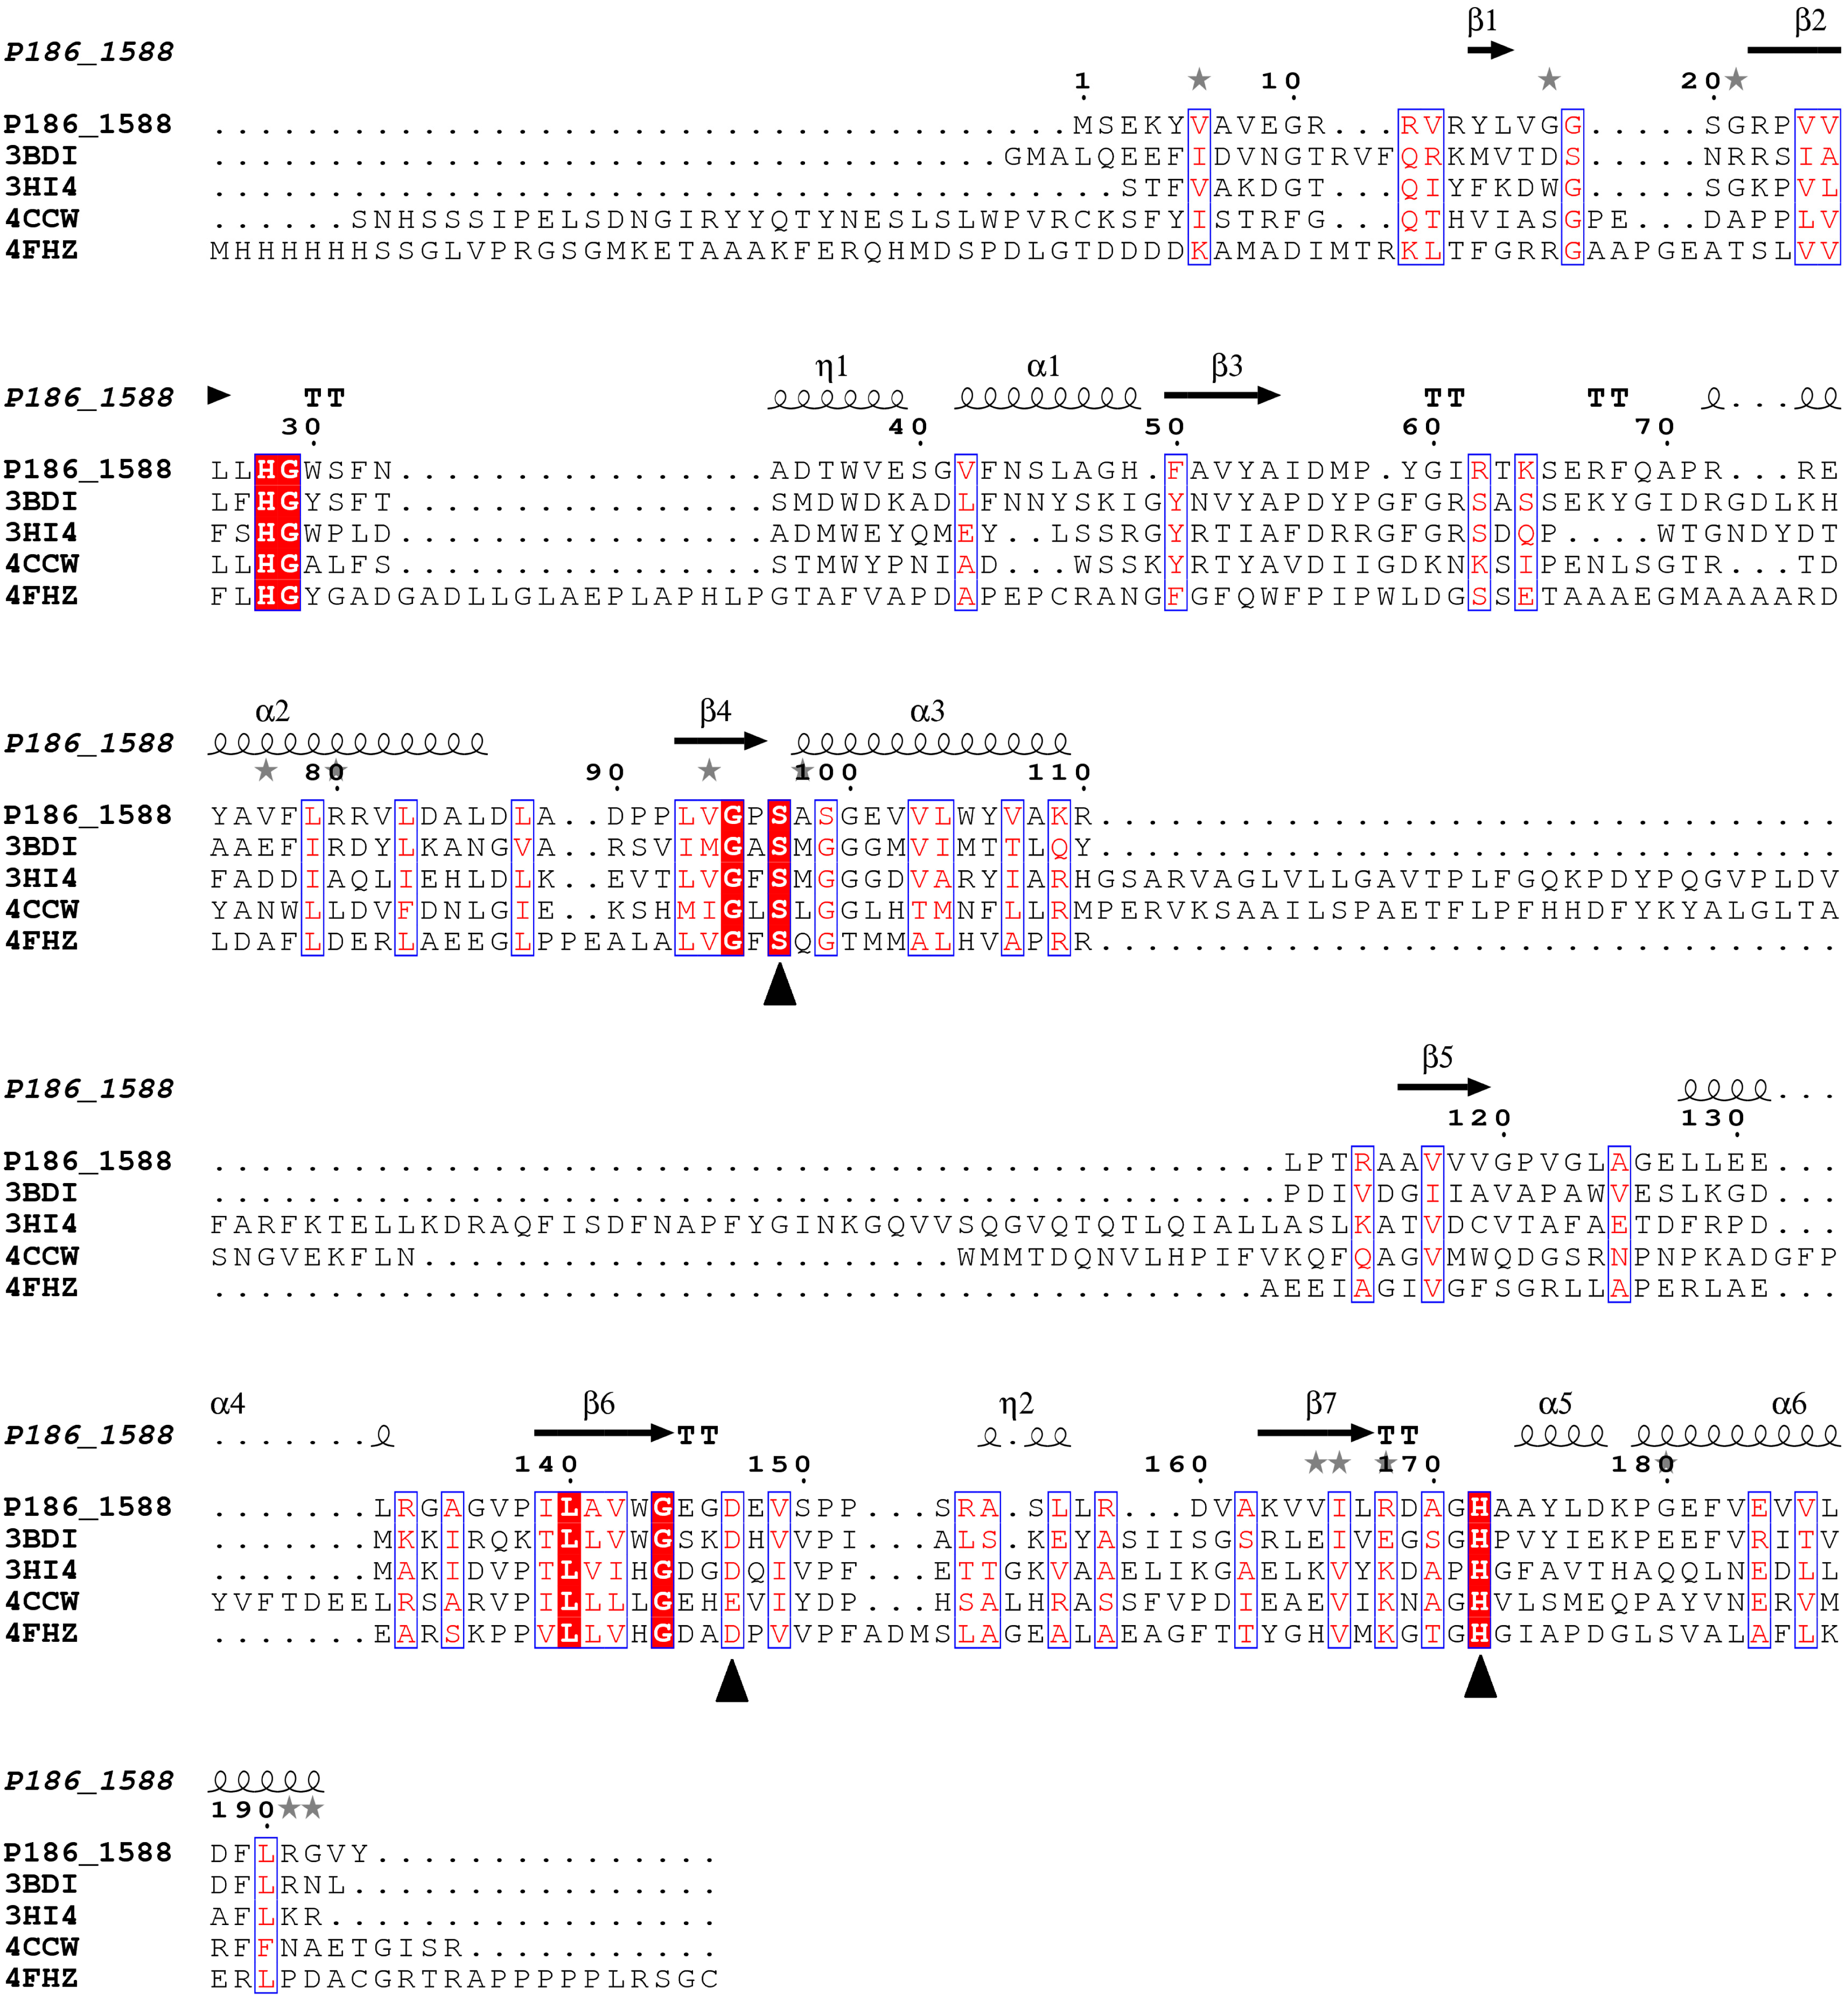
26], which suggests that P186_1588 might be a novel esterase. Multiple sequence alignment predicted that the catalytic triad of P186_1588 was formed by Ser
97, Asp
147 and His
172 (
Figure 1). Generally, the catalytic serine is located in a consensus pentapeptide (G-X-S-X-G). However, Ser
97 in the predicted catalytic triad situates in a sequence of G-X-S-X-S (
Figure 1). Few lipases/esterases have been reported with the serine-containing consensus sequence as G-X-S-X-S [
27]. In order to confirm this prediction, Ser
97, Asp
147 and His
172 were mutated into Ala
97, Asn
147 and Leu
172 respectively. The activities of the mutant enzymes were examined with different kinds of
p-NP esters. None of the mutant proteins showed detectable activity, which confirmed the importance of these residues in the activity of P186_1588.
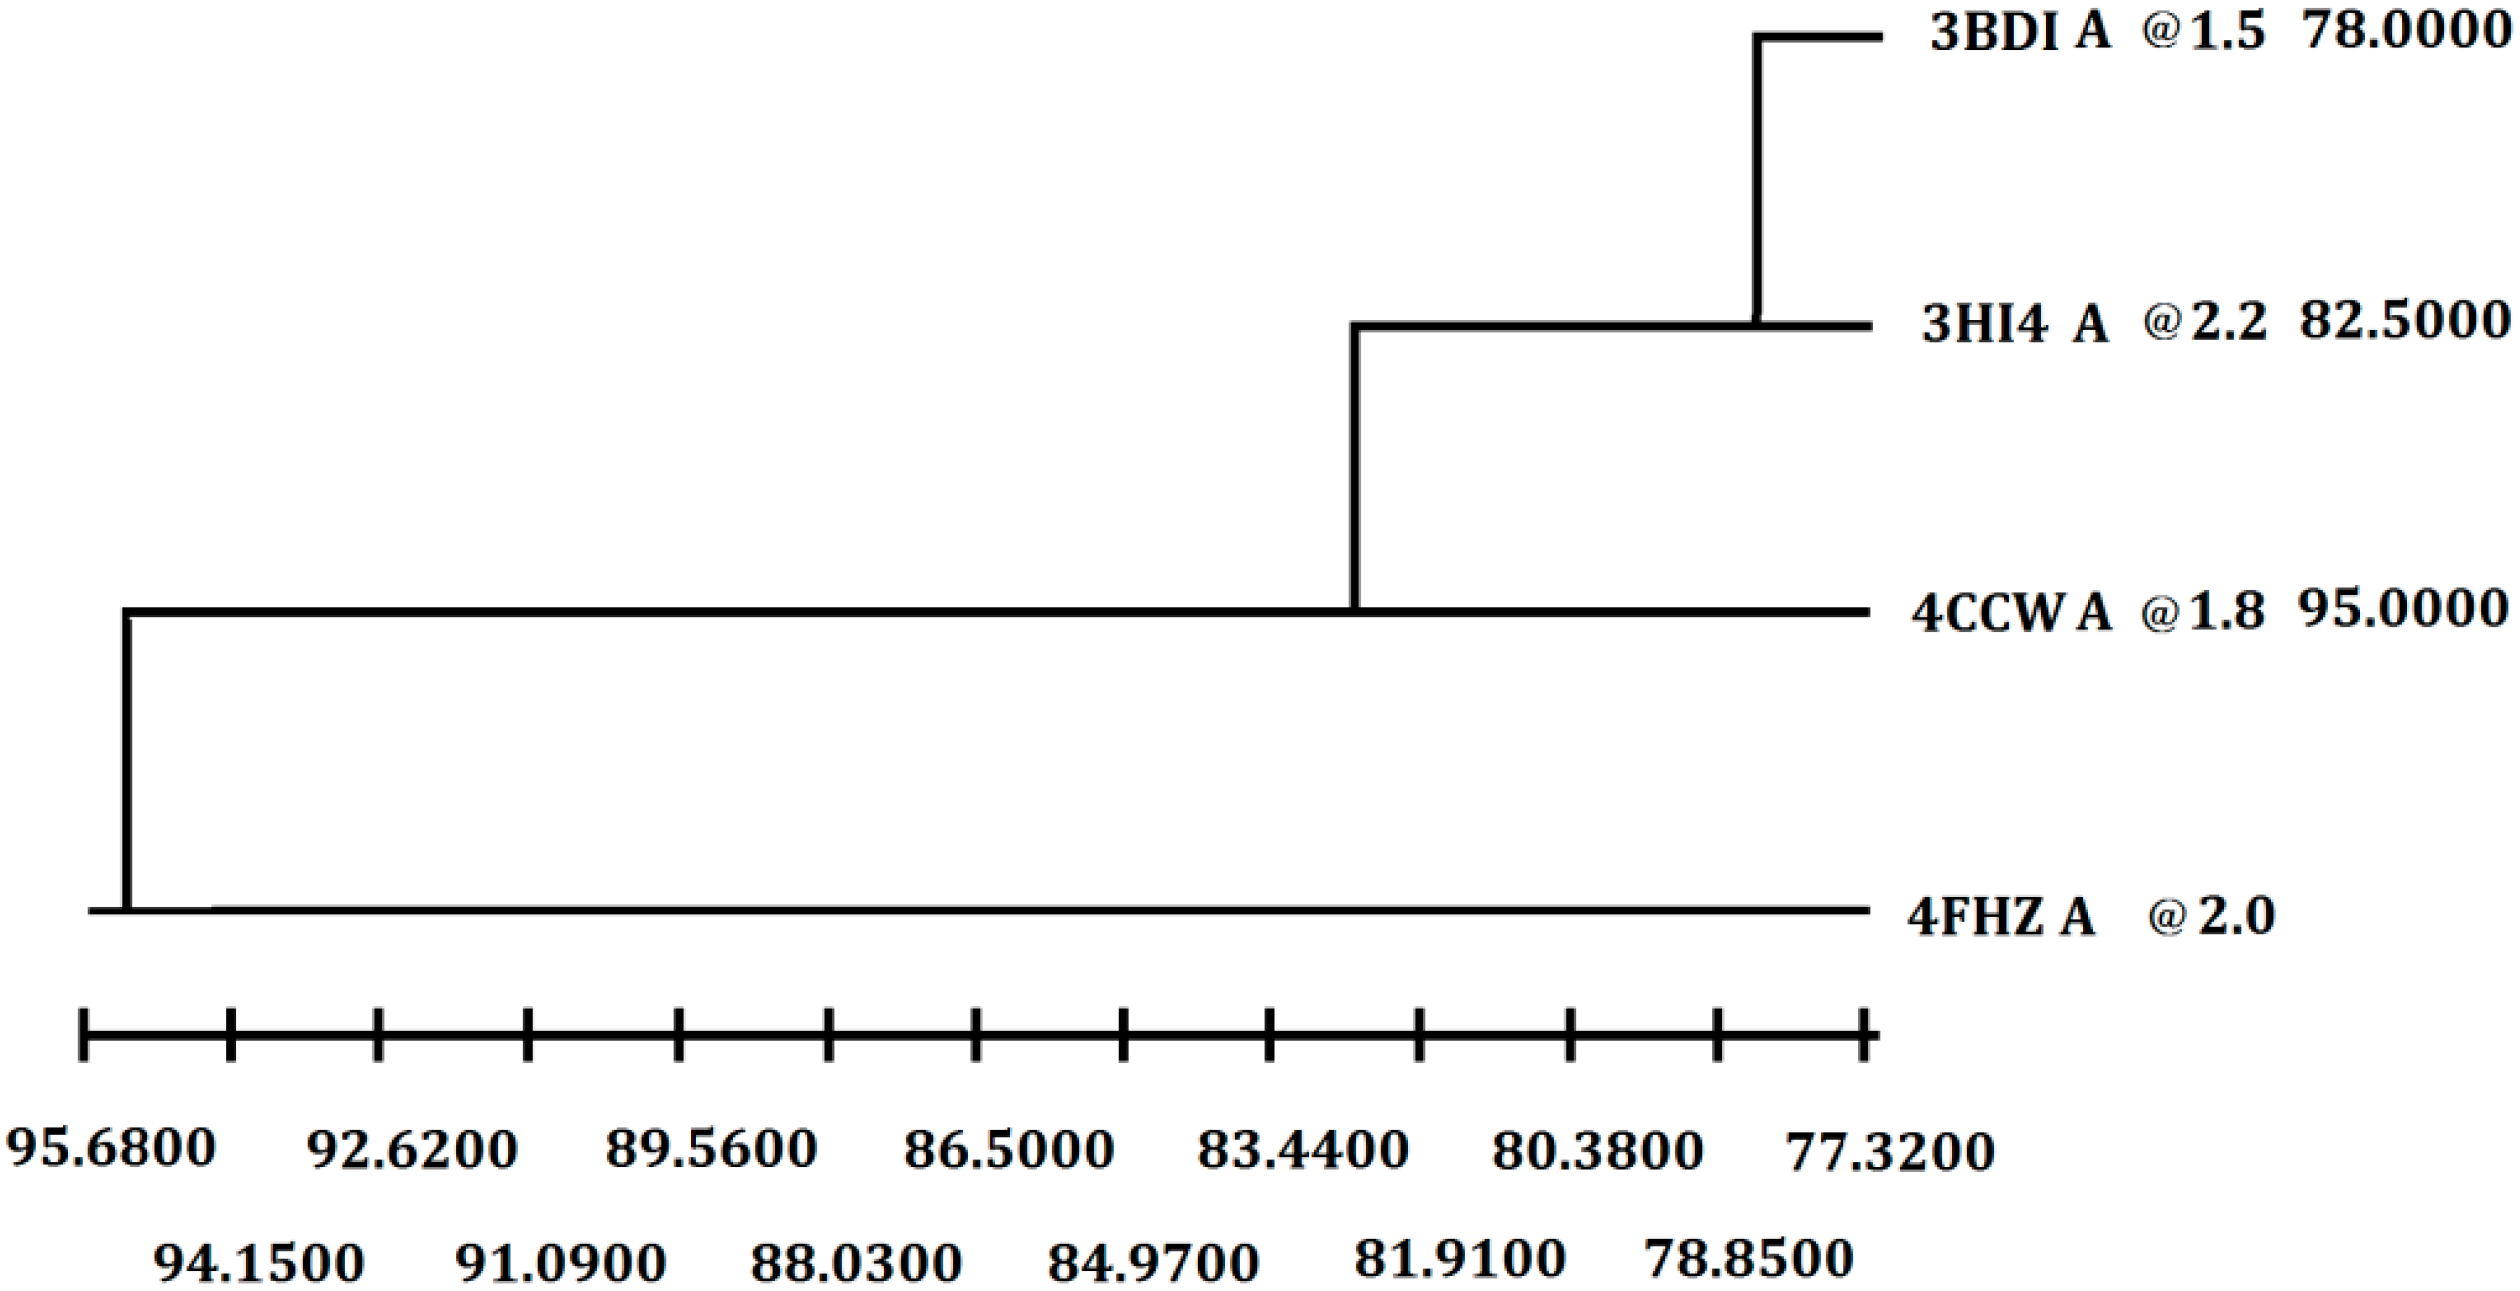
In order to get the 3D model of P186_1588, the crystal structure of the carboxylesterase (PDB ID: 3BDI) from
T. acidophilum was finally selected as the best template for the homology modeling according to the crystallographic resolution and overall sequence identity (
Figure 2). In general, proteins with 30%–50% sequence identity share at least 80% of their structures [
28]. The P186_1588 shares 30% of sequence identity (coverage 99%) with the selected template. After 100 models calculated by Modeller, the best P186_1588 model was selected with the lowest value of discrete optimized protein energy (DOPE) assessment score [
29]. Furthermore, the geometry analysis of the model using online PROCHECK showed that 89.4% of the residues in the most favored regions of the Ramachandran plot, 10.6% of the residues in the allowed regions, and none of residues in disallowed regions (
Figure S1-A). Moreover, the ProSA Z score (−7.60) for the model is also in the range of scores typically found in the proteins with similar sequence length (
Figure S1-B) [
30]. All of these results indicated that the model of P186_1588 was reasonable and acceptable.
Figure 1.
Multiple sequence alignment between P186_1588 and other closely related esterases: 3BDI, an uncharacterized carboxylesterase from Thermoplasma acidophilum; 3HI4, a carboxylesterase from Pseudomonas fluorenscens; 4CCW, a carboxylesterase from Bacillus subtilis; 4FHZ: a carboxylesterase from Rhodobacter sphaeroides. The catalytic triad of P186_1588 (Ser97, Asp147, and His172) is marked with filled triangles (■). The alpha helix, beta sheet, random coil and beta turn are identical to α, β, η and T, respectively.
Figure 2.
Selection of the best crystal structure template for homology modeling. Weighted pair-group average clustering based on a distance matrix. The last column represents the distance between this protein’s cluster and those below it.
Figure 2.
Selection of the best crystal structure template for homology modeling. Weighted pair-group average clustering based on a distance matrix. The last column represents the distance between this protein’s cluster and those below it.
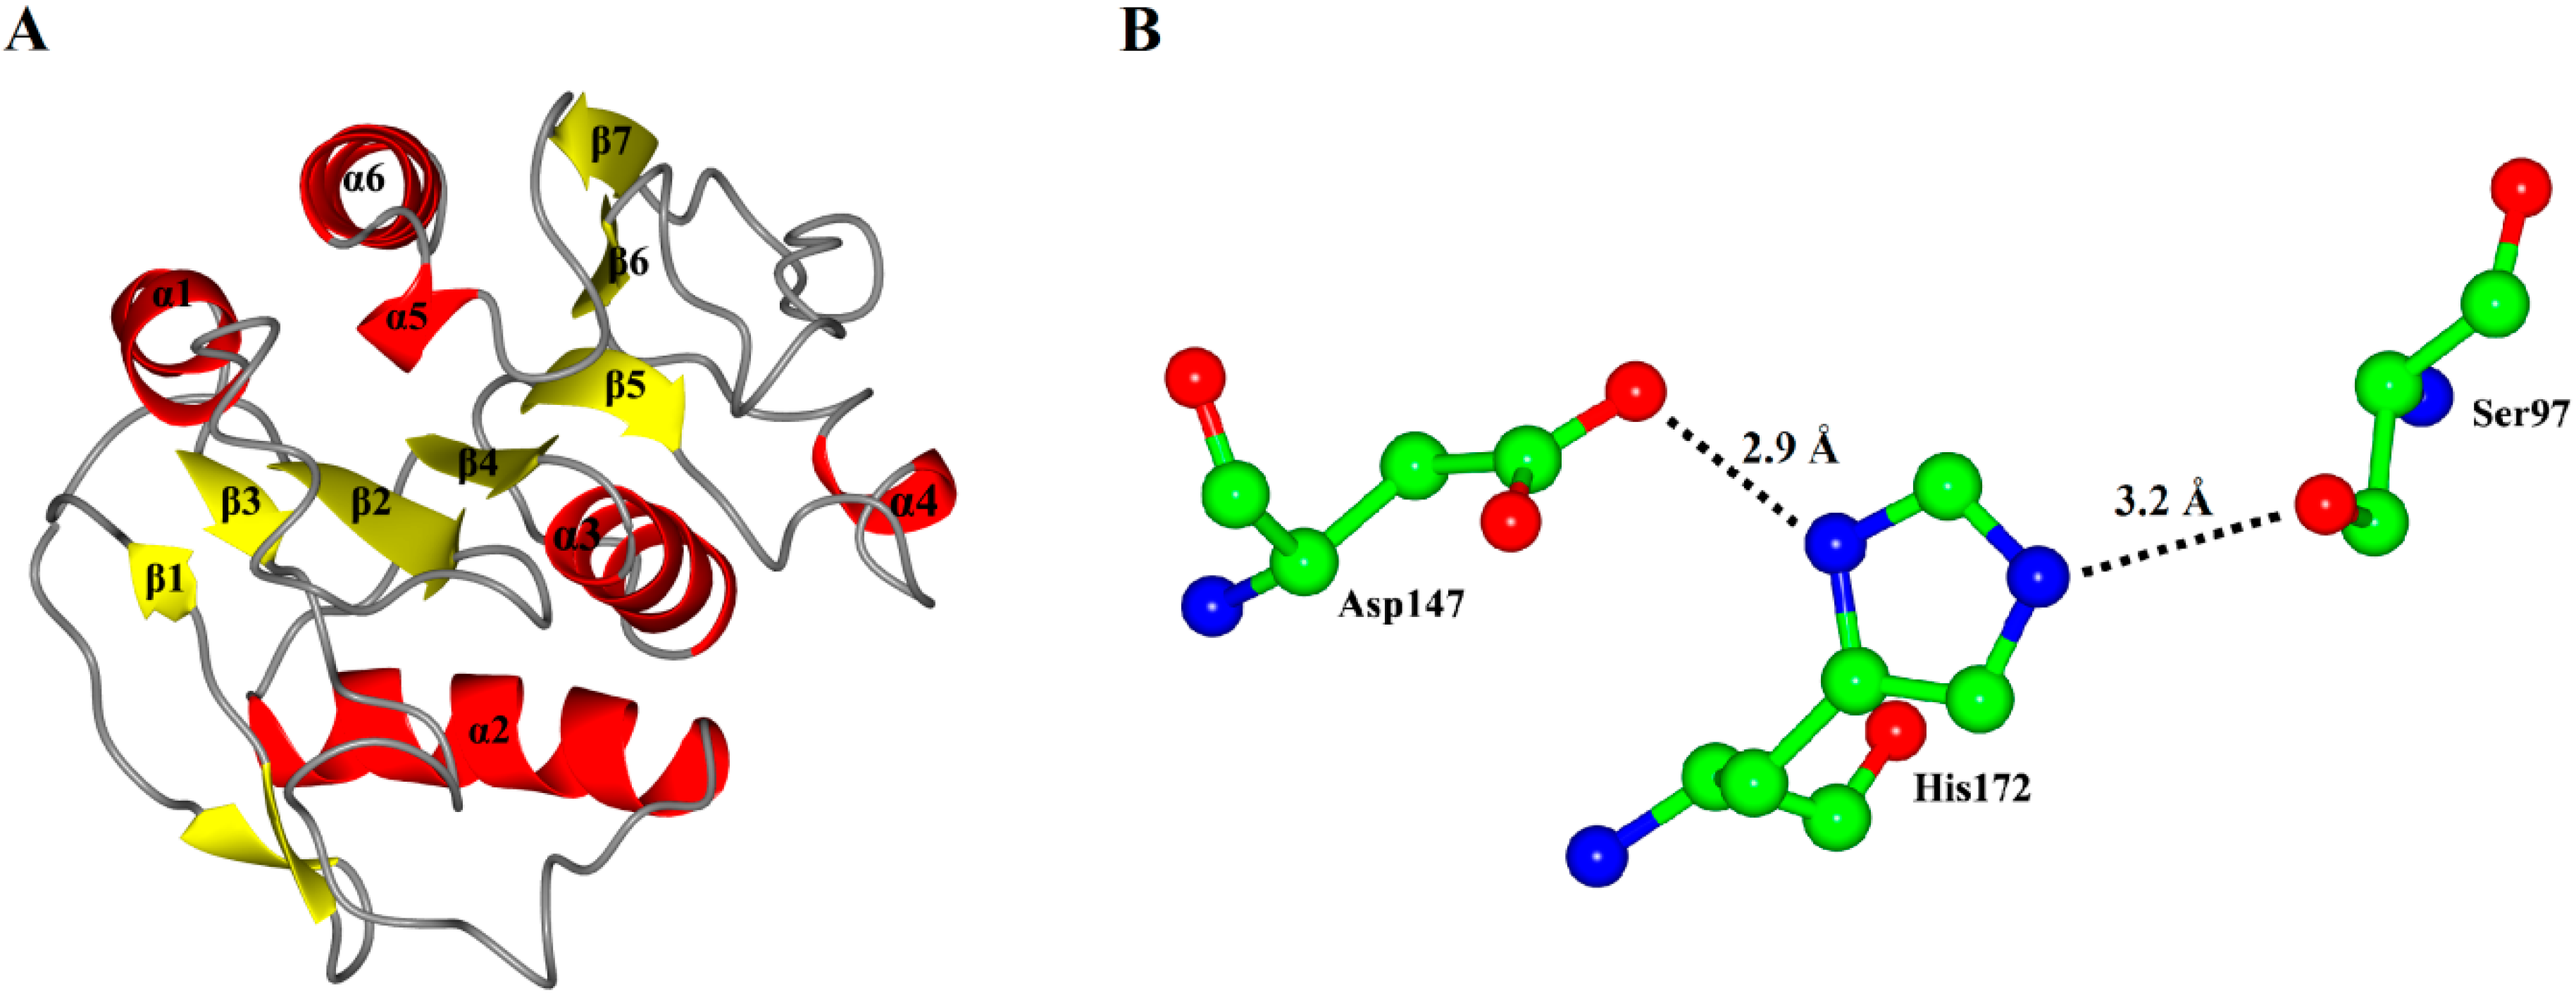
As expected, the model of P186_1588 showed a typical α/β hydrolase fold with β-sheets surrounded by α-helices (
Figure 3A). It contained six α-helices and seven β-sheets. The CASTp [
31] program predicted that its active site (pocket) consisted of residues Gly29, Trp30, Ser31, Phe32, Pro96, Gly120, Val149, Ala173 and Tyr175. The internal part of the pocket exhibited a hydrophobic region including the residues Trp30, Phe32, Pro96, Val149, and Tyr175. The catalytic triad Ser
97, Asp
147 and His
172 were located on the loops between β4-α3, β6-β7 and β7-α5, respectively. In order to complete the catalytic triad, the hydroxyl (Oγ-Ser
97) of Ser
97 can form a hydrogen bond (3.2 Å) with the N atom (Nε-His
172) of His
172 whose other N atom (Nδ-His
172) can form a hydrogen bond (2.9 Å) with the hydroxyl (Oδ-Asp
147) of Asp
147 (
Figure 3B).
Figure 3.
(A) Overall representation of P186_1588. The α-helices and β-sheets domain are in red and yellow, respectively; (B) The catalytic triad (Ser97, Asp147 and His172) of P186_1588 shown as ball-and-stick mode. The lines and numbers represent the distances of Oγ-Ser97/Nε-His172 and Nδ-His172/Oδ-Asp147 in angstroms.
2.2. Purification and Identification of the Recombinant Esterase
In order to analyze whether the
P186_1588 expression product has an esterase activity, the corresponding protein (rP186_1588) was purified from recombinant
E. coli BL21 (DE3). The purification parameters of rP186_1588 are summarized in
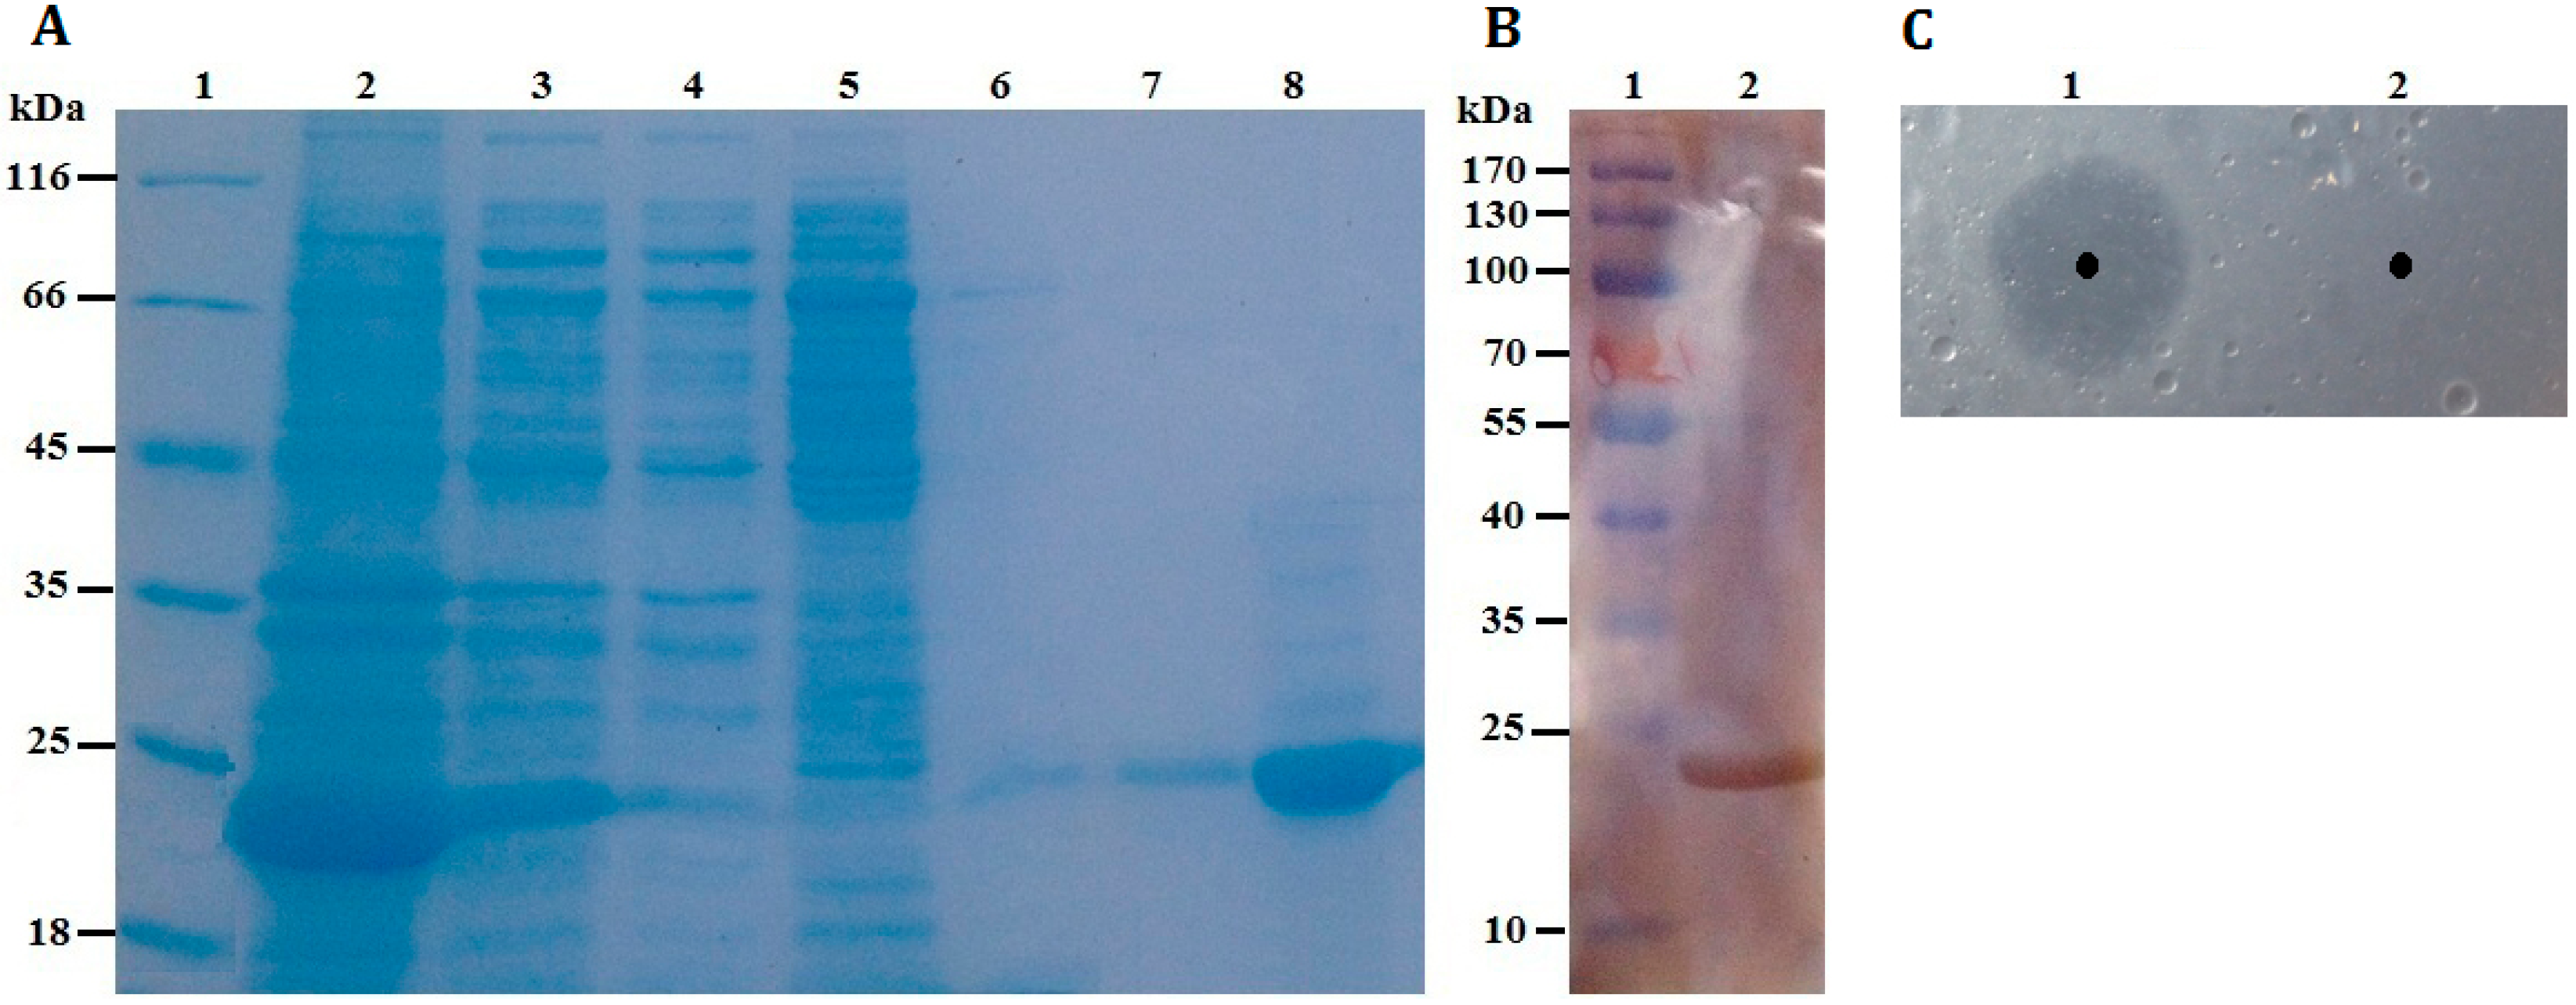
Table 1. The results revealed that the purification procedure had a recovery of 33.88% in total enzyme activity and a 21.34-fold increase in enzyme specific activity. Furthermore, as shown in
Figure 4A, rP186_1588 was partially soluble expressed in
E. coli, and was found to be electrophoretically pure by SDS-PAGE with right molecular weight of approximately 23 kDa. By western blotting analysis using anti-His antibody, the purified rP186_1588 presented as a single band (
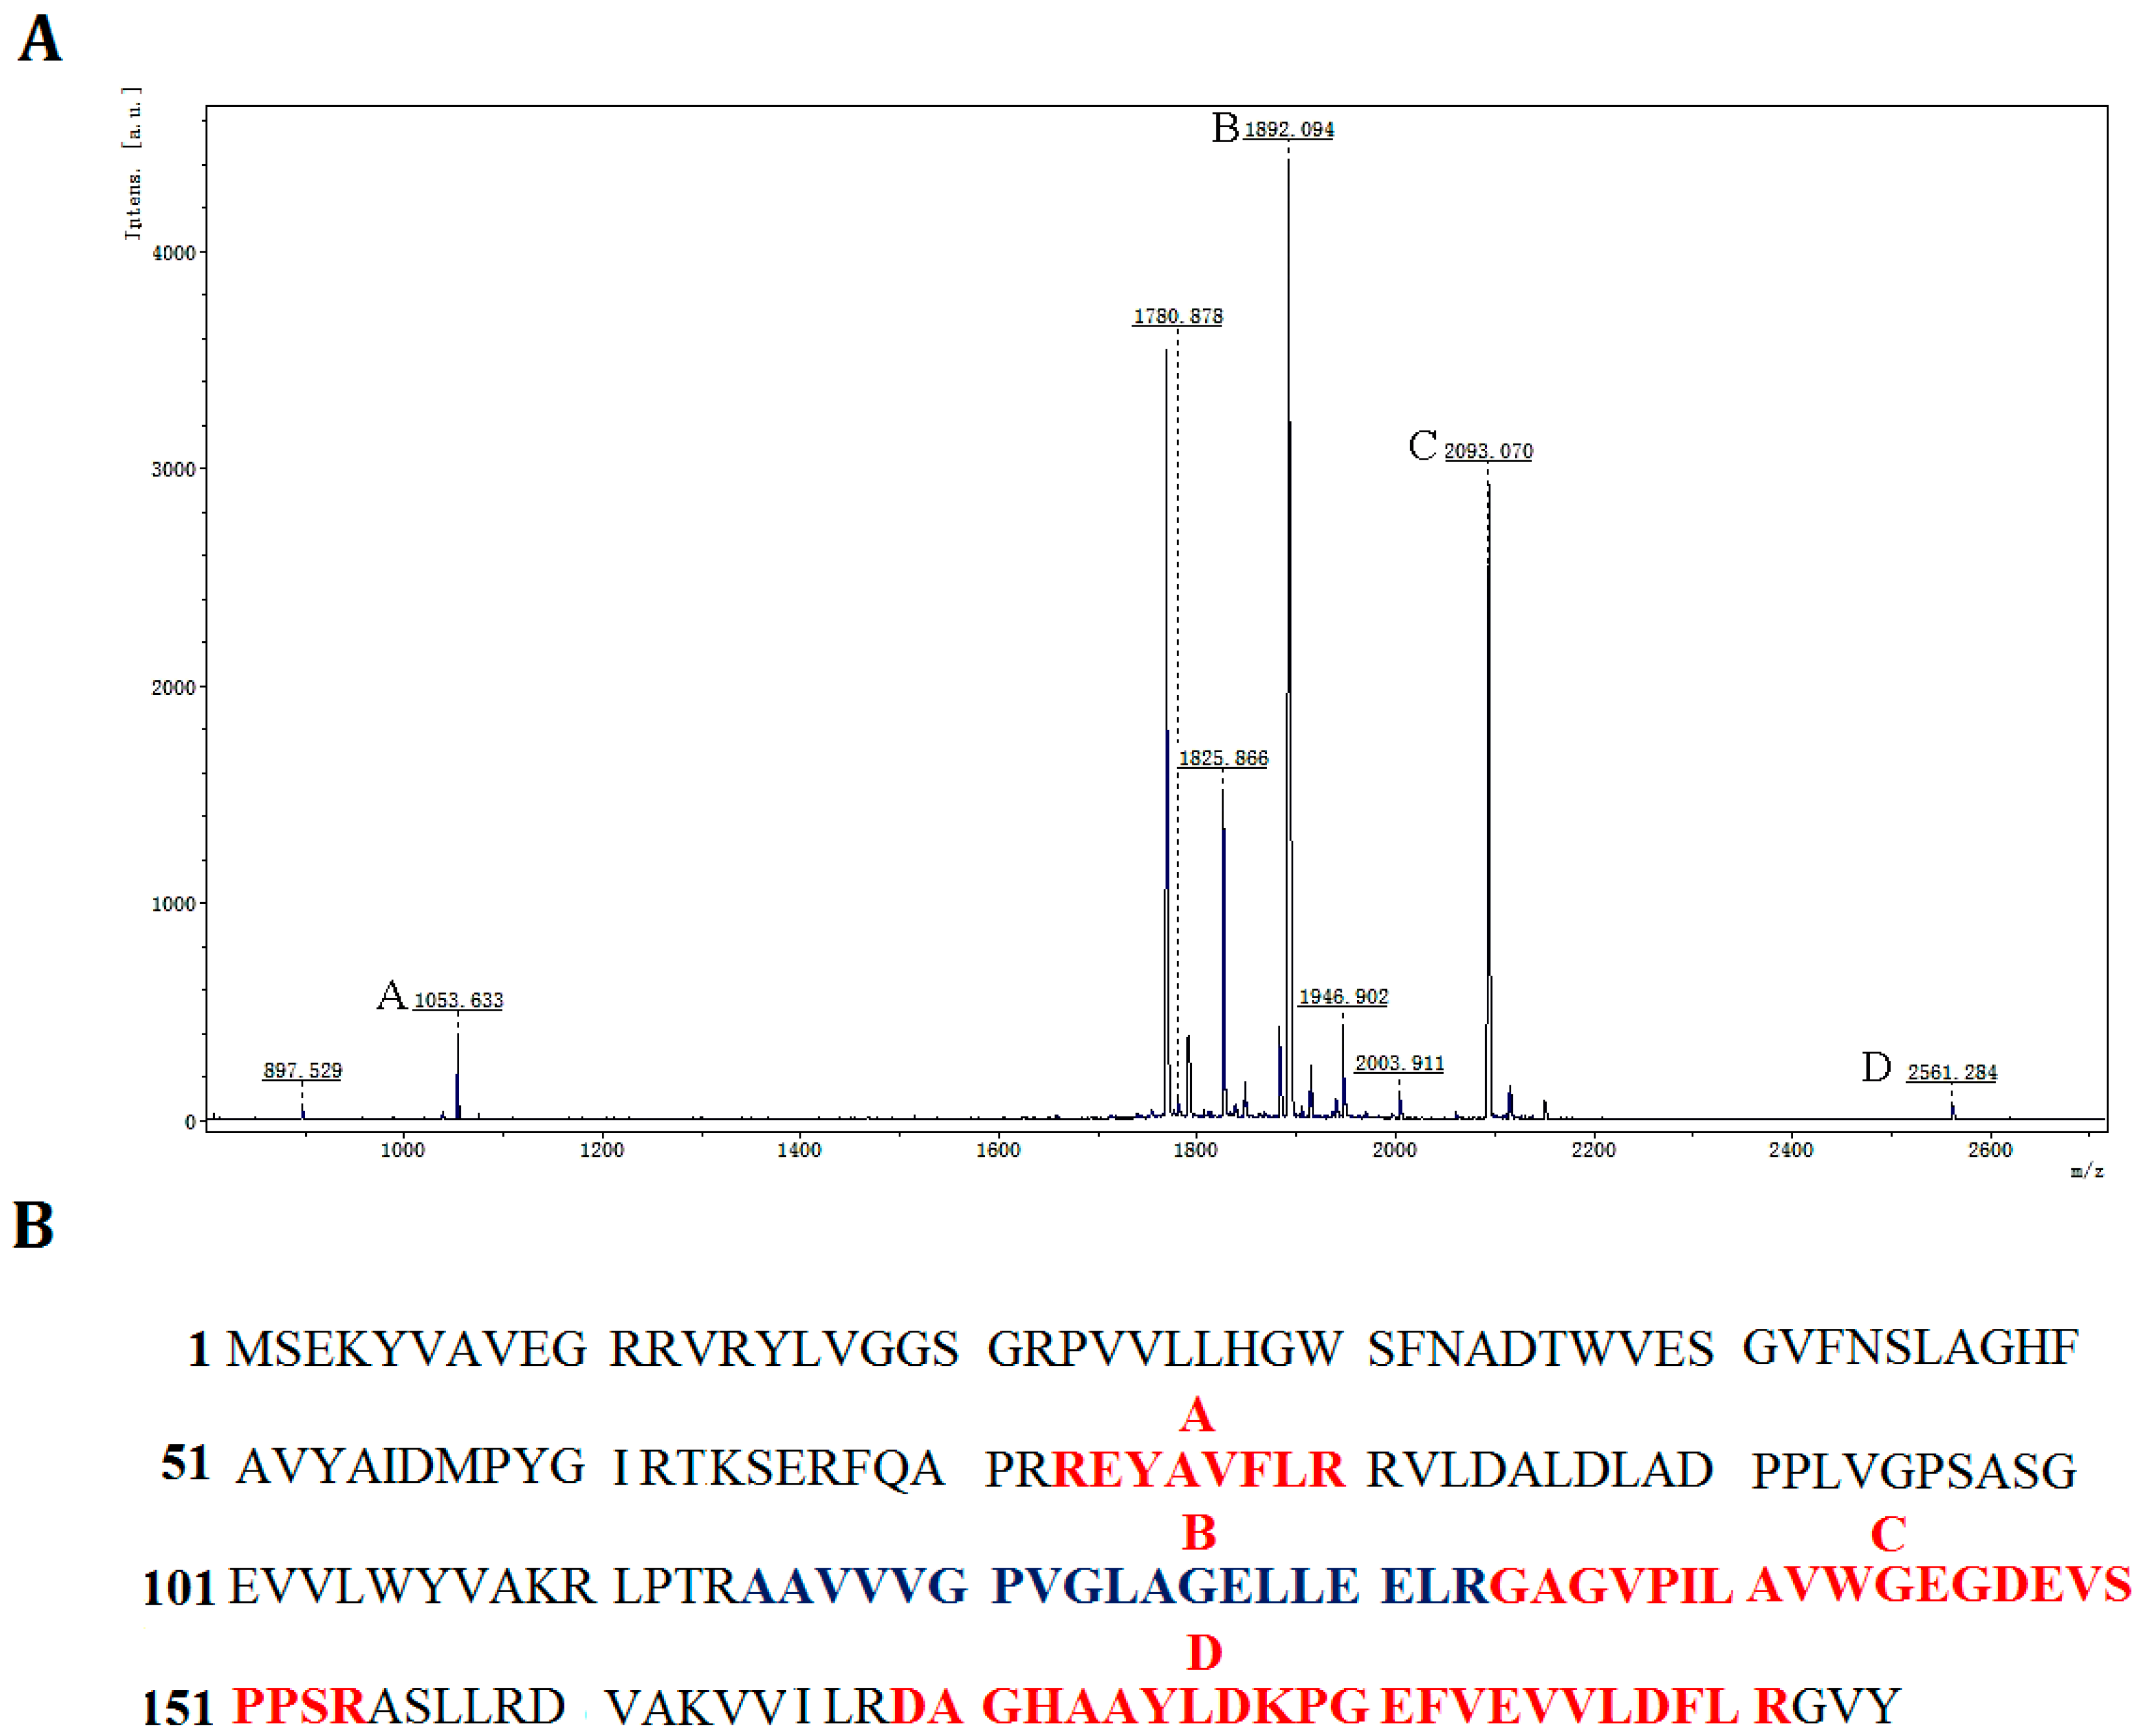
Figure 4B). In order to further determine that the purified protein was the product of gene
p186_1588, peptide mass fingerprinting was used to analyze the digested peptide fragments of rP186_1588. Four peptide fragments matched the deduced amino acid sequence of
p186_1588 (
Figure 5). These results proved that the purified rP186_1588 was encoded by
p186_1588. In order to determine whether the purified rP186_1588 was active, rP186_1588 was spotted on a tributyrin agar plate. After incubation for 12 h, a clear hydrolysis zone was formed on plate (
Figure 4C), which further confirmed that rP186_1588 was functionally expressed in
E. coli and displayed activity towards tributyrin.
Table 1.
Purification of rP186_1588 from E. coli BL21 (DE3) *.
Table 1.
Purification of rP186_1588 from E. coli BL21 (DE3) *.
| | Concentration (mg/mL) | Volume (mL) | Activity (U/mL) | Specific Activity (U/mg) | Purification Fold | Recovery (%) |
|---|
| Cell lysate | 4.40 | 30.00 | 7.01 | 1.59 | 1 | 100 |
| rP186_1588 | 0.28 | 7.50 | 9.50 | 33.93 | 21.34 | 33.88 |
Figure 4.
(A) SDS-PAGE. Lane 1: protein molecular weight markers; Lane 2: the soluble fraction of the cell lysate after induction; Lane 3: the insoluble fraction of the cell lysate after induction; Lane 4: fluid through Ni-NTA column; Lane 5: purified fraction from Ni-NTA eluted by washing buffer containing 30 mM imidazole; Lane 6: purified fraction from Ni-NTA eluted by washing buffer containing 60 mM imidazole; Lane 7: purified fraction from Ni-NTA eluted by washing buffer containing 100 mM imidazole; Lane 8: purified rP186_1588 eluted by washing buffer containing 200 mM imidazole; (B) Western blotting analysis. Lane 1: protein markers; Lane 2: purified rP186_1588; (C) Activity testing on tributyrin plate. Lane 1: rP186_1588; Lane 2: buffer solution (NTA-0).
Figure 5.
Identification of rP186_1588 by peptide mass fingerprinting analysis. (A) MALDI-TOF spectra of rP186_1588, x-axis: m/z ratio; y-axis: species abundance in terms of percent signal intensity. Major peaks corresponding to the predicted peptides are marked as A, B, C, and D; (B) The peptide fragments of rP186_1588 whose molecular weights correspond to those of the peaks shown in the peptide mass fingerprint.
2.3. Biochemical Characterization of rP186_1588
The substrate specificity of rP186_1588 was tested using various
p-NP esters with different acyl chain lengths (
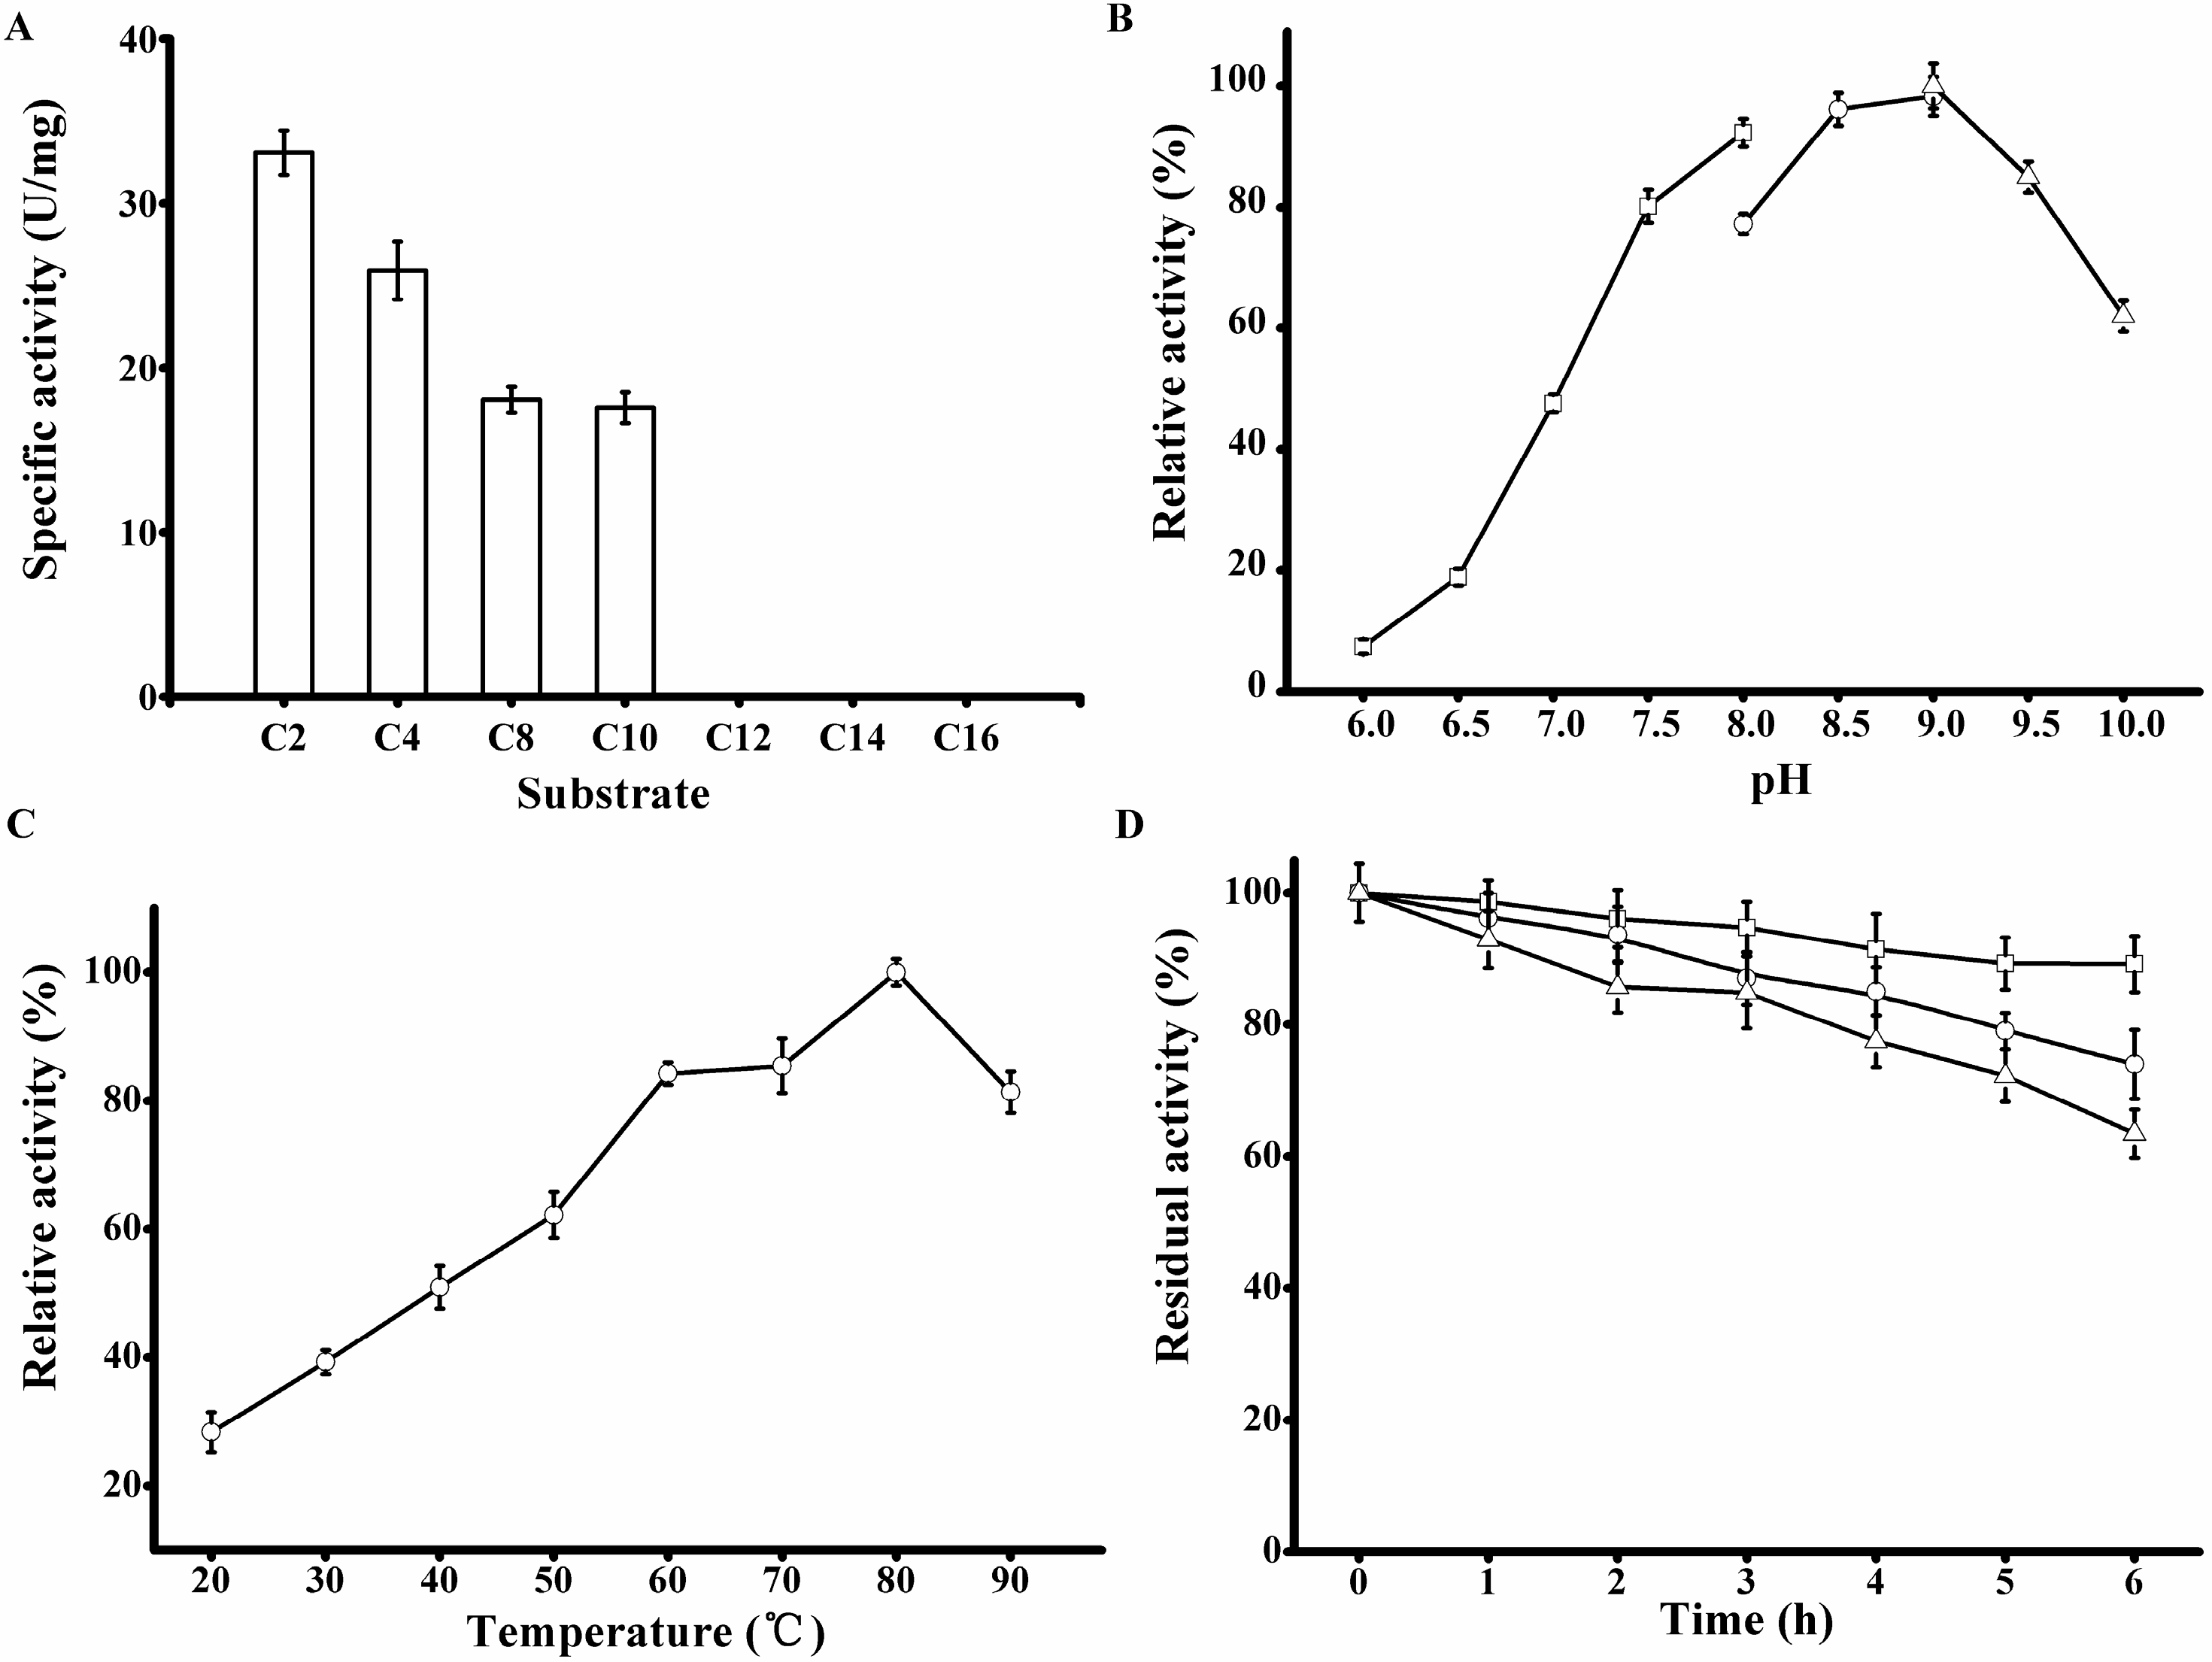
Table 2). rP186_1588 was able to hydrolyze
p-NP esters with acyl chain length up to ten carbon atoms (
Figure 6A) with the specific activity towards
p-NPC2,
p-NPC4,
p-NPC8, and
p-NPC10 of 33.07, 25.90, 18.05, and 17.57 U/mg, respectively (
Table 2). Based on the substrate preference of rP186_1588, it can be concluded that it is not a lipase but an esterase. The substrate profile of rP186_1588 was different from those of other reported archaeal esterases. The carboxylesterase from
S. solfataricus showed hydrolytic activity towards all kinds of
p-NP esters with
p-NPC8 as its best substrate [
32]. The esterase Est from
P. calidifontis, a member from the same genus
Pyrobaculum, showed hydrolytic activity towards short to medium length esters with
p-NPC6 as its best substrate [
33]. In addition, the
Km values of rP186_1588 increased with the elevated chain length from
p-NPC2 to
p-NPC10, while the catalytic efficiency (
kcat/
Km) values decreased gradually (
Table 2). The purified rP186_1588 displayed highest specific activity towards
p-NPC2 with the lowest
Km value of 0.35 mM and the highest
kcat/
Km value of 33.29 s
−1·mM
−1.
Table 2.
Kinetic parameters for P186_1588 with p-NP esters.
Table 2.
Kinetic parameters for P186_1588 with p-NP esters.
| Substrate | Km (mM) | kcat (s−1) | kcat/Km (s−1·mM−1) | Specific Activity (U/mg) |
|---|
| p-NP acetate (C2) | 0.35 ± 0.01 | 11.65 ± 0.48 | 33.29 ± 1.37 | 33.07 ± 1.36 |
| p-NP butyrate (C4) | 1.27 ± 0.04 | 9.12 ± 0.62 | 7.18 ± 0.19 | 25.90 ± 1.76 |
| p-NP caprylate (C8) | 2.64 ± 0.14 | 6.36 ± 0.28 | 2.41 ± 0.11 | 18.05 ± 0.79 |
| p-NP decanoate (C10) | 4.99 ± 0.21 | 6.19 ± 0.33 | 1.24 ± 0.07 | 17.57 ± 0.94 |
Figure 6.
Biochemical characterization of the purified rP186_1588. (A) Activities of rP186_1588 towards p-NP esters with various chain lengths (C2, acetate; C4, butyrate; C8, caprylate; C10, decanoate; C12, laurate; C14, myristate; and C16, palmitate); (B) Effect of pH on the activity of rP186_1588; (C) Effect of temperature on the activity of rP186_1588; (D) Effect of temperature on stability of rP186_1588 at 70 °C (□), 80 °C (○) and 90 °C (Δ). The values represent the means of three independent experiments (Mean ± standard error).
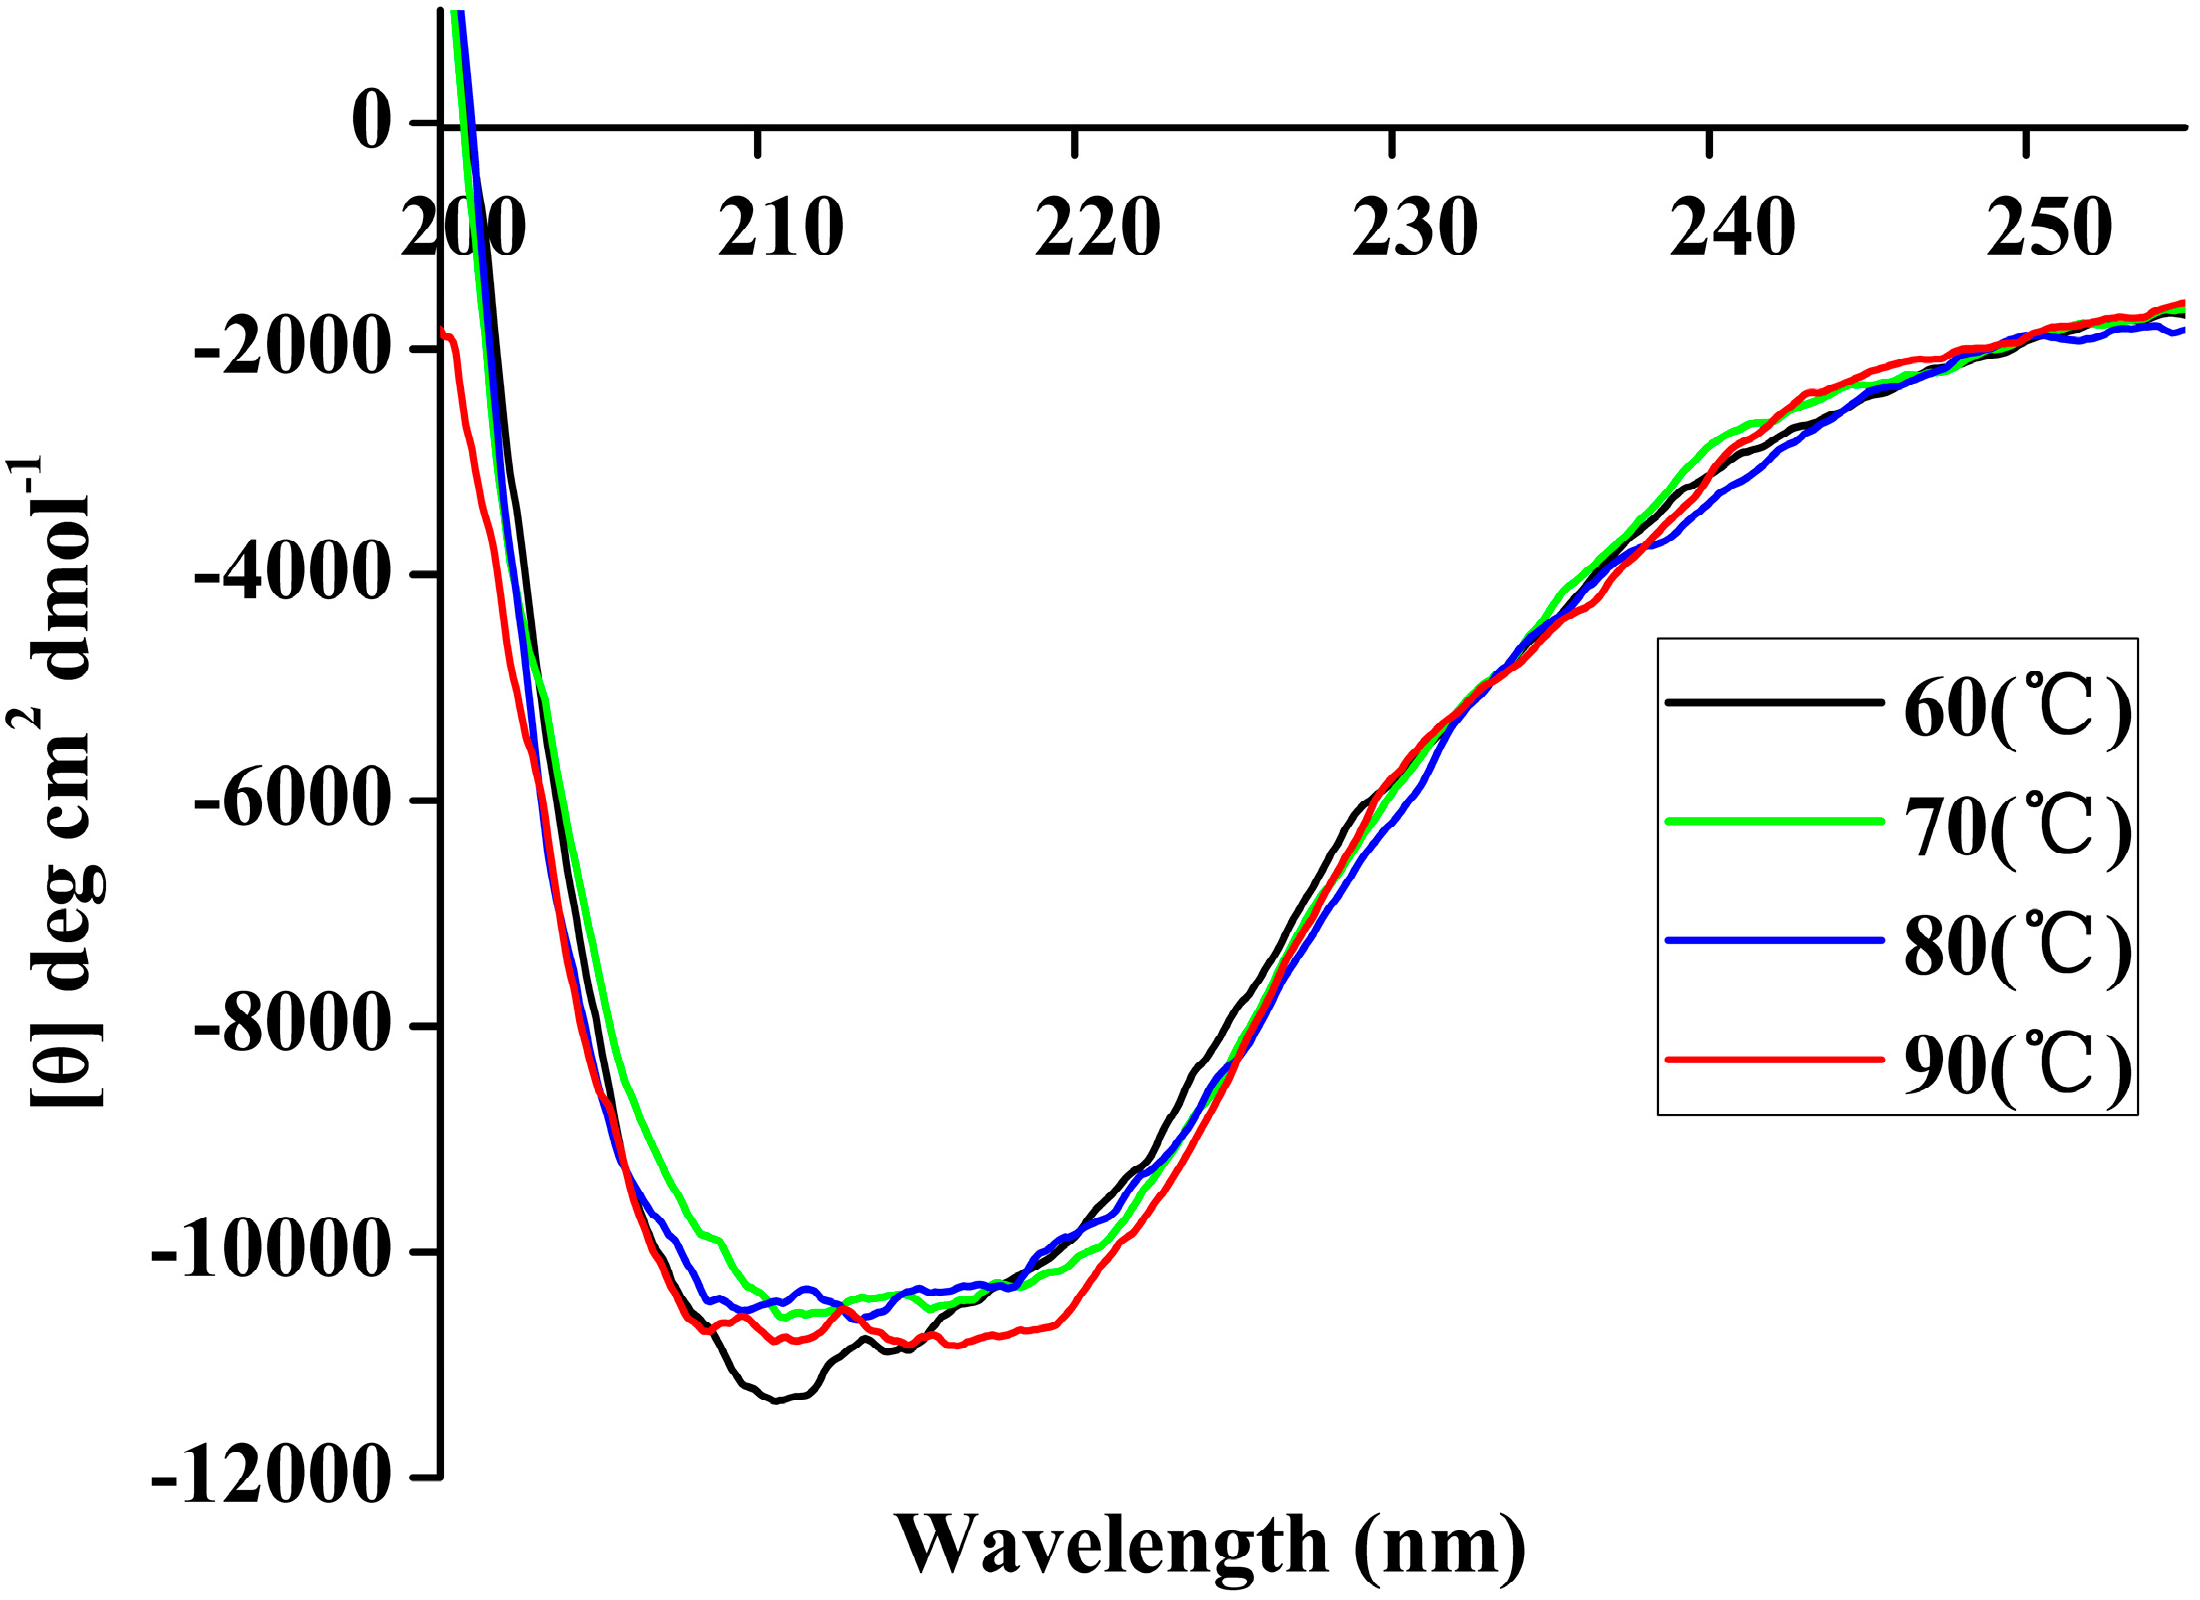
The purified rP186_1588 displayed the maximal activity at pH 9.0 (
Figure 6B) and 80 °C (
Figure 6C). These were also different from those of other reported archaeal esterases. The esterase from
S. solfataricus exhibited maximal activity at pH of 8.0 and temperature of 85 °C [
32], while the Est from
P. calidifontis showed optimum pH and temperature at 7.0 and 90 °C respectively [
33]. The thermal stability of rP186_1588 was also tested at three different temperatures (70, 80, and 90 °C). As shown in
Figure 6D, rP186_1588 retained more than 70% of its original activity after 6 h of incubation at 90 °C. As for the thermal stability, the esterase from
S. solfataricus remained about 40% of its original activity after incubation at 80 °C for 2 h [
32], while the esterase Est from
P. calidifontis showed no decrease in activity after 2 h treatment at 100 °C [
33]. These results revealed that rP186_1588 possessed good thermostability.
2.4. Effects of Organic Solvents, Metal Ions, EDTA and PMSF on rP186_1588
The esterase activity is commonly affected by many factors, such as organic solvents, surfactants, and metal ions [
2]. The maintenance of activity in organic solvents is important for industrial enzymes [
2]. As shown in
Table 3, in the presence of organic solvents (15%,
v/
v), most of the tested organic solvents including acetonitrile, acetone, methanol, ethanol, and isopropanol resulted in 21%–76% increment of the activity of rP186_1588. However, when the organic solvents were used at high concentration (30%,
v/
v), only methanol and acetone could still increase the activity of rP186_1588, while the other polar organic solvents decreased 20%–40% of the activity of rP186_1588. The esterase Est from
P. calidifontis maintained 105% of residual activity after treatment with 50% of methanol for 1 h [
33]. The esterase from
S. solfataricus kept 78% of its original activity after incubation in 5% of methanol at 30 °C for 1h. However, when the temperature increased to 70 °C, only 27% of its original activity retained [
32]. Comparing with these two esterases, the thermal stable rP186_1588 has good resistance to organic solvents, which also indicates that the thermostability of the enzyme correlates with its resistance to organic solvents [
34]. The influence of a variety of detergents on rP186_1588 was also shown in
Table 3. The detergents CTAB and Triton X-100 at low concentration (0.1%,
v/
v) could strongly increase the activity of rP186_1588, while the detergents Tween-20 and SDS showed inhibitory effect on the activity of rP186_1588. When the detergents were used at high concentration (1%,
v/
v), only the detergent CTAB could still increase the activity of rP186_1588, while the other detergents decreased 30%–60% of the activity of rP186_1588. This activity loss might be due to the 3D conformational changes of rP186_1588 caused by them [
35]. This feature is different from lipases which are often activated by surfactants through increasing the access of substrates to the active center associated with the hydrophobic binding [
36].
When the metal ions tested with 1 mM, Na
+, K
+, Ca
2+ and Mn
2+ showed no significant influence on the enzyme activity of rP186_1588, while Mg
2+, Cu
2+, Zn
2+, and Co
2+ could slightly decrease the activity to 94.68%, 85.33%, 92.38% and 95.11% of its original activity, respectively. However, when the metal ion concentration increased to 10 mM, rP186_1588 was inhibited by Zn
2+ (50.97%), Mn
2+ (88.07%) and Co
2+ (72.68%), even completely inhibited by Cu
2+ (4.67%). The chelating agent EDTA showed little inhibition on rP186_1588, which suggested that rP186_1588 was not a metalloenzyme and metal ions might be unnecessary for its enzymatic activity. Moreover, rP186_1588 was partially inhibited by a low concentration (1 mM) of PMSF, while it was completely inhibited by high concentration (10 mM) of PMSF. PMSF is a typical serine inhibitor and can covalently link the active serine residue. In general, PMSF always undergoes spontaneous hydrolysis at high temperature [
37]. Therefore, when a low concentration of PMSF was used at high temperature, most of PMSF hydrolyzed, which resulted in little inhibitory effect on the activity of rP186_1588. However, when a high concentration was used, there was enough PMSF remaining to fully inhibit the activity of rP186_1588. These results further confirmed that rP186_1588 was a serine esterase.
Table 3.
Effects of organic solvents, surfactants, metal ions, and inhibitors on the activity of rP186_1588.
Table 3.
Effects of organic solvents, surfactants, metal ions, and inhibitors on the activity of rP186_1588.
| Additives | Relative Activity(%) + SE |
|---|
| Control | 100 | 100 |
| Organic solvents | 15% (v/v) | 30% (v/v) |
| Acetonitrile | 176.67 ± 3.71 | 68.47 ± 0.68 |
| Acetone | 121.38 ± 2.06 | 122.89 ± 5.53 |
| DMSO | 84.88 ± 0.31 | 77.75 ± 1.48 |
| Methanol | 144.49 ± 1.01 | 168.47 ± 5.90 |
| Ethanol | 165.23 ± 2.31 | 80.13 ± 1.24 |
| Isopropanol | 143.20 ± 2.29 | 79.27 ± 0.60 |
| Surfactants | 0.1% (v/v) | 1% (v/v) |
| CTAB | 142.55 ± 3.79 | 179.91 ± 2.91 |
| Tween-20 | 84.02 ± 1.48 | 66.52 ± 0.73 |
| Triton X-100 | 130.45 ± 3.65 | 69.11 ± 0.29 |
| SDS | 83.15 ± 1.33 | 42.33 ± 0.29 |
| Metal ions | 1 mM | 10 mM |
| Na+ | 105.32 ± 1.79 | 109.20 ± 1.93 |
| K+ | 112.65 ± 2.37 | 117.25 ± 5.04 |
| Ca2+ | 108.99 ± 2.47 | 107.12 ± 0.48 |
| Mg2+ | 94.68 ± 2.25 | 119.12 ± 0.73 |
| Mn2+ | 103.74 ± 2.80 | 88.07 ± 1.14 |
| Cu2+ | 85.33 ± 2.09 | 4.67 ± 0.02 |
| Zn2+ | 92.38 ± 1.57 | 50.97 ± 1.68 |
| Co2+ | 95.11 ± 4.09 | 72.68 ± 1.96 |
| Inhibitor | 1 mM | 10 mM |
| EDTA | 96.83 ± 0.17 | 120.73 ± 3.75 |
| PMSF | 71.64 ± 0.70 | ND * |
2.6. Molecular Dynamics Simulations
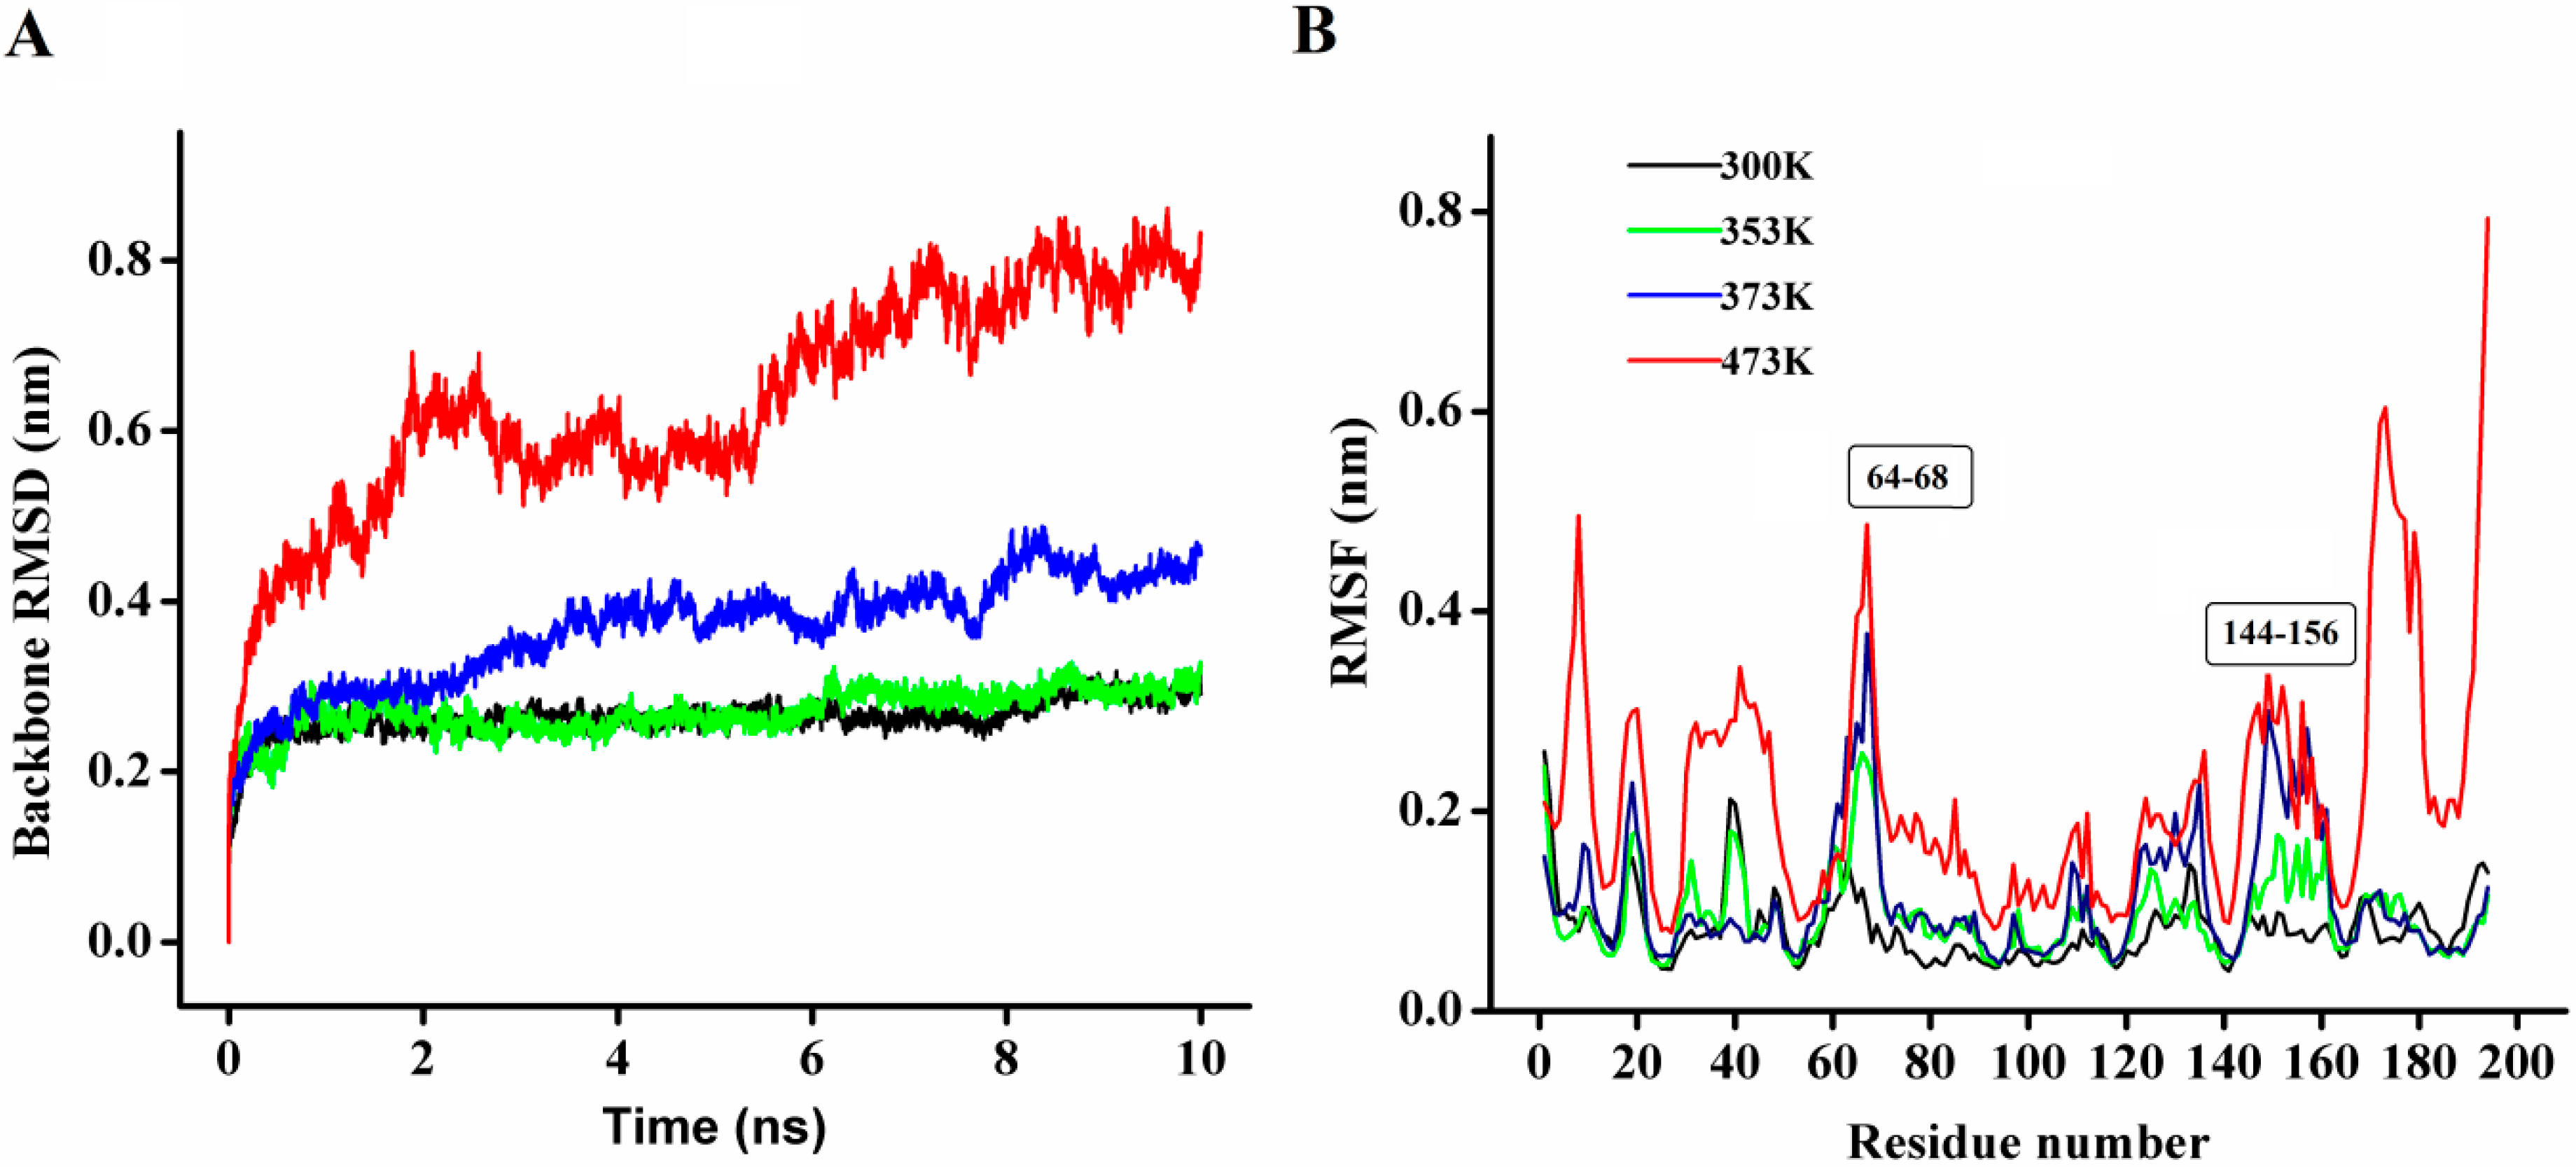
In order to explore the thermostability of P186_1588, comparative MD simulations were carried out at four different temperatures (300, 353, 373, and 473 K). The dynamic behavior of the enzyme was examined by analyzing the MD simulation trajectories. As shown in
Figure 8A, at 300 and 353 K simulations, the backbone RMSD (root mean square deviation) equilibrated after about 600 ps, and remained stable until the end of the simulation with RMSD value converged to 0.263 and 0.270 nm respectively. These results indicated that the global 3D structure of P186_1588 was well maintained and the protein was stable throughout the simulation. In the trajectory run at 373 K, the backbone RMSD of P186_1588 reached equilibrium after about 600 ps and maintained well to about 2.5 ns. After that, the backbone RMSD increased and attained a high value of 0.367 nm. At 473 K simulation, the backbone RMSD increased from the beginning of the simulation and reached a high value of 0.633 nm. These results indicated that increasing temperature up to 353 K showed very little effect on the stability of its native structure, and when the temperature was higher than 373 K, proteins started to unfold.
Figure 7.
Far-UV CD spectra of rP186_1588 recorded in the 250 nm–200 nm range at different temperatures (60 °C, black; 70 °C, green; 80 °C, blue; 90 °C, red).
Figure 7.
Far-UV CD spectra of rP186_1588 recorded in the 250 nm–200 nm range at different temperatures (60 °C, black; 70 °C, green; 80 °C, blue; 90 °C, red).
Figure 8.
(A) The rmsd values for the backbone atoms of P186_1588 during 10 ns simulation at different temperatures; (B) The rmsf values of the residues in P186_1588 at different temperatures. The color-coding scheme is as follows: 300 K (black), 353 K (green), 373 K (blue) and 473 K (red).
Figure 8.
(A) The rmsd values for the backbone atoms of P186_1588 during 10 ns simulation at different temperatures; (B) The rmsf values of the residues in P186_1588 at different temperatures. The color-coding scheme is as follows: 300 K (black), 353 K (green), 373 K (blue) and 473 K (red).
The average RMSF (root mean square fluctuations) values in the MD simulation reflect the relative flexibility of each residue in a protein—a higher rmsf value indicates less stability [
20,
21,
39]. As shown in
Figure 8B, most regions in P186_1588 showed minor fluctuation with the temperature increased from 300 to 373 K. These results revealed that most regions in P186_1588 were relatively thermal stable with certain rigidity. As reported in many studies, thermophilic enzymes are more rigid than mesophilic enzymes [
40,
41]. Two flexible regions including residues 64–68 (designated as region A1) and residues 144–156 (designated as region A2) showed major fluctuation, which indicated that they were thermal sensitive areas. These flexible regions (A1 and A2) are two loops connecting β3 and α2, and β6 and β7, respectively. Considering the RMSFs of the three catalytic residues, Asp
147 was the largest fluctuation residue that was located in the flexible region A2, while the RMSFs of Ser
97 and His
172 were relative low at high temperatures. Therefore, the flexibility of region A2 might favor the entry of the substrates and/or catalysis [
42]. However, the region A1 is far away from the catalytic center in spatial structure (
Figure S2), so, this area would be regarded as the hotspot for protein engineering in order to further improve its thermostability [
43].
The radius of gyration (Rg) parameter, calculated as the RMS distance of atoms from the protein’s center, reflects the compactness of protein structure. In general, reduced Rg (higher compactness) has been identified as a protein stabilizing factor [
10]. As shown in
Table 4, P186_1588 had the most compact structure at the lowest temperature (300 K, Rg: 1.597 nm). Moreover, P186_1588 displayed similar compactness at 353 K (Rg: 1.617 nm) and 373 K (Rg: 1.622 nm) which were a little less compact than it at 300 K. However, the average Rg value increased to 1.672 nm at the temperature of 473 K. These results also indicated that P186_1588 had good thermal stability at temperatures below 373 K.
Table 4.
Average of Rg, SASA and average number of protein-protein and protein-solvent H-bonds in P186_1588 at different temperature simulations.
Table 4.
Average of Rg, SASA and average number of protein-protein and protein-solvent H-bonds in P186_1588 at different temperature simulations.
| P186_1588 | 300 K | 353 K | 373 K | 473 K |
|---|
| Backbone RMSD (nm) | 0.263 | 0.270 | 0.367 | 0.633 |
| Rg (nm) | 1.597 | 1.617 | 1.622 | 1.672 |
| SASA (nm2) | 105.926 | 111.506 | 112.778 | 119.897 |
| PSASA (nm2) | 54.597 | 55.215 | 57.428 | 56.007 |
| ASASA (nm2) | 51.329 | 56.291 | 55.349 | 63.891 |
| Protein-protein H-bond | 113 | 109 | 104 | 96 |
| Protein-solvent H-bond | 403 | 390 | 383 | 303 |
The solvent accessible surface area (SASA) reflects the exposure of protein atoms to solvent, which can be obtained by calculating the surface area of atom in contact with solvent molecules [
22]. In our study, the total SASA values showed a slight increase with the temperature rising from 300 to 473 K. This profile is in agreement with the variation trend of Rg values. These results revealed that P186_1588 became less compact with more solvent penetration into the internal core of the protein at high temperatures. Comparing the variation of hydrophilic SASA (PSASA) and hydrophobic SASA (ASASA), the increase of total SASA is mostly attributed to the hydrophobic residues (
Table 4). In general, the non-polar side chains of protein always cluster together into the interior through the hydrophobic interactions [
21]. The increase in the hydrophobic SASA indicated that more non-polar side chains became to be exposed to the solvents at high temperatures. The average number of intramolecular hydrogen bonds was also calculated at different temperature simulations. As shown in
Table 4, with the increase in temperature, there was a slight decrease in number of the hydrogen bond. However, average numbers of protein-solvent interactions decreased more sharply at high temperature (473 K) (
Table 4).
To gain more insight into the effect of temperature on the conformation of P186_1588, the second structure of the protein was also calculated according to the DSSP algorithm. As shown in
Table 5, the content of α-helix and β-sheet in P186_1588 maintained well in the simulation period at temperature of 300, 353, and 373 K. However, the content of α-helix and β-sheet reduced sharply at temperature of 473K, which indicated that α-helix and β-sheet were gradually disordered at high temperature. These resulted revealed that P186_1588 started to unfold at temperature higher than 373K, which corresponded well with the RMSd results and CD results.
Table 5.
Average second structure contents in P186_1588 trajectories obtained at different temperatures.
Table 5.
Average second structure contents in P186_1588 trajectories obtained at different temperatures.
| P186_1588 | 300 K | 353 K | 373 K | 473 K |
|---|
| Coil | 0.22 | 0.26 | 0.23 | 0.28 |
| β-Sheet | 0.21 | 0.20 | 0.22 | 0.17 |
| β-Bridge | 0.00 | 0.01 | 0.01 | 0.01 |
| Bend | 0.15 | 0.16 | 0.18 | 0.22 |
| Turn | 0.16 | 0.14 | 0.11 | 0.16 |
| α-Helix | 0.21 | 0.22 | 0.24 | 0.10 |
| 310-Helix | 0.05 | 0.03 | 0.02 | 0.05 |
Electrostatic interactions of ion pairs in thermophilic enzyme may contribute to its stability at high temperature [
6,
21]. Molecular dynamic simulations can provide valuable information for identifying the critical ion pairs, and also help us to design more favorable interaction for mesophilic proteins by introducing new charged residues [
44]. From the amino acid component of P186_1588, we found that it contained 45 charged amino acid residues including Lys, Arg, Asp, and Glu. Many ion pairs that formed by the positively charged and negatively charged residues have been found during the simulations at 300, 353, 373, and 473 K (Data not shown). In general, salt bridges became weaken and their occupancy times decreased with the temperature increasing. However, among these ion pairs, four ion pairs (Arg
14-Asp
35, Arg
114-Asp
9°, Lys
178-Asp
169, and Arg
168-Glu
145) could still maintain well even at high temperatures, suggesting a crucial role in stabilizing this enzyme (
Table 6) [
42]. As shown in
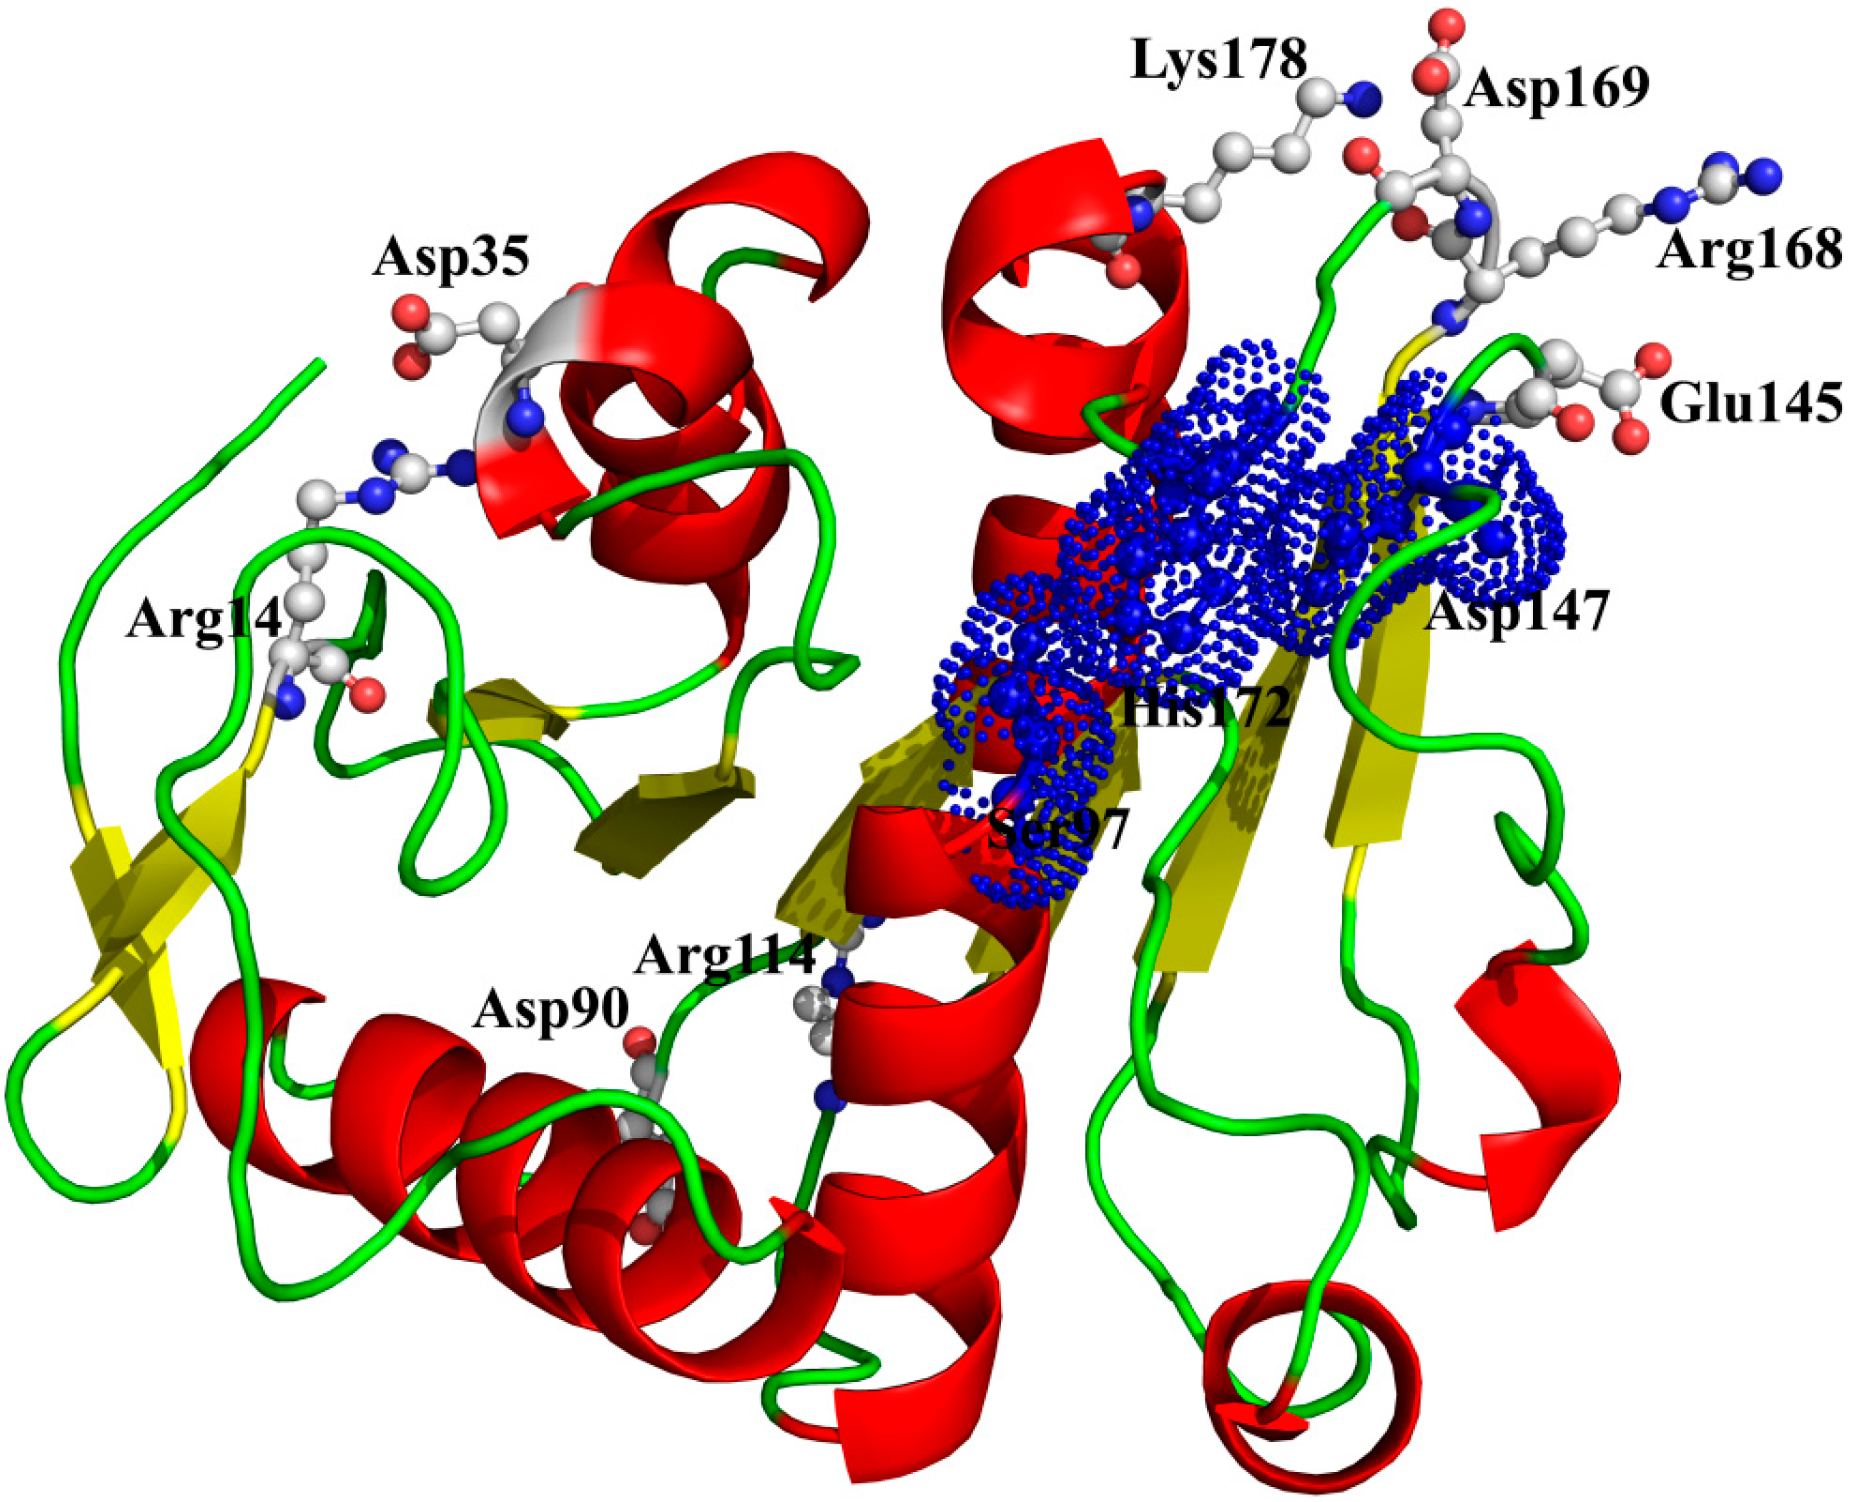
Figure 9, two ion pairs (Arg
14-Asp
35 and Arg
114-Asp
9°) are far away from the catalytic center, while the other two ion pairs (Lys
178-Asp
169 and Arg
168-Glu
145) are near to the catalytic center. Especially, in the ion pair of Arg
168-Glu
145, the residue Arg
168, near to the catalytic residue His
172, is located on a loop structure, and the other residue Glu
145, near to the catalytic residue Asp
147, is located on another loop structure. Therefore, this ion pair (Arg
168-Glu
145) may have an important role in maintaining the distance between the catalytic residues Asp
147 and His
172.
Table 6.
Important salt bridge interactions of P186_1588 at 300K, 353K, 373K, and 473K simulation and their occupation time *.
Table 6.
Important salt bridge interactions of P186_1588 at 300K, 353K, 373K, and 473K simulation and their occupation time *.
| Salt Bridge | 300 K | 353 K | 373 K | 473 K |
|---|
| Occupancy Time (%) | Distance (nm) | Occupancy Time (%) | Distance (nm) | Occupancy Time (%) | Distance (nm) | Occupancy Time (%) | Distance (nm) |
|---|
| R14-D35 | 100 | 0.175 | 99 | 0.185 | 97 | 0.228 | 85 | 0.298 |
| R114-D90 | 100 | 0.288 | 80 | 0.441 | 75 | 0.402 | 54 | 0.495 |
| K178-D169 | 99 | 0.308 | 99 | 0.307 | 99 | 0.306 | 84 | 0.416 |
| R168-E145 | 99 | 0.332 | 99 | 0.370 | 78 | 0.402 | 71 | 0.466 |
Figure 9.
The spatial distribution of the important salt bridges in P186_1588. The backbone of the protein is represented in cartoon. Residues forming the ion pairs are represented in ball-and-stick mode. The catalytic residues (Ser97, Glu147 and His172) were shown as dot.
Figure 9.
The spatial distribution of the important salt bridges in P186_1588. The backbone of the protein is represented in cartoon. Residues forming the ion pairs are represented in ball-and-stick mode. The catalytic residues (Ser97, Glu147 and His172) were shown as dot.
2.7. Docking Analysis and Binding Free Energy Decomposition
As characterized in the
Section 2.3, rP186_1588 showed ability to hydrolyze short to medium chain length
p-NP esters. In order to explain its substrate specificity, four substrates (
p-NPC2,
p-NPC4,
p-NPC8 and
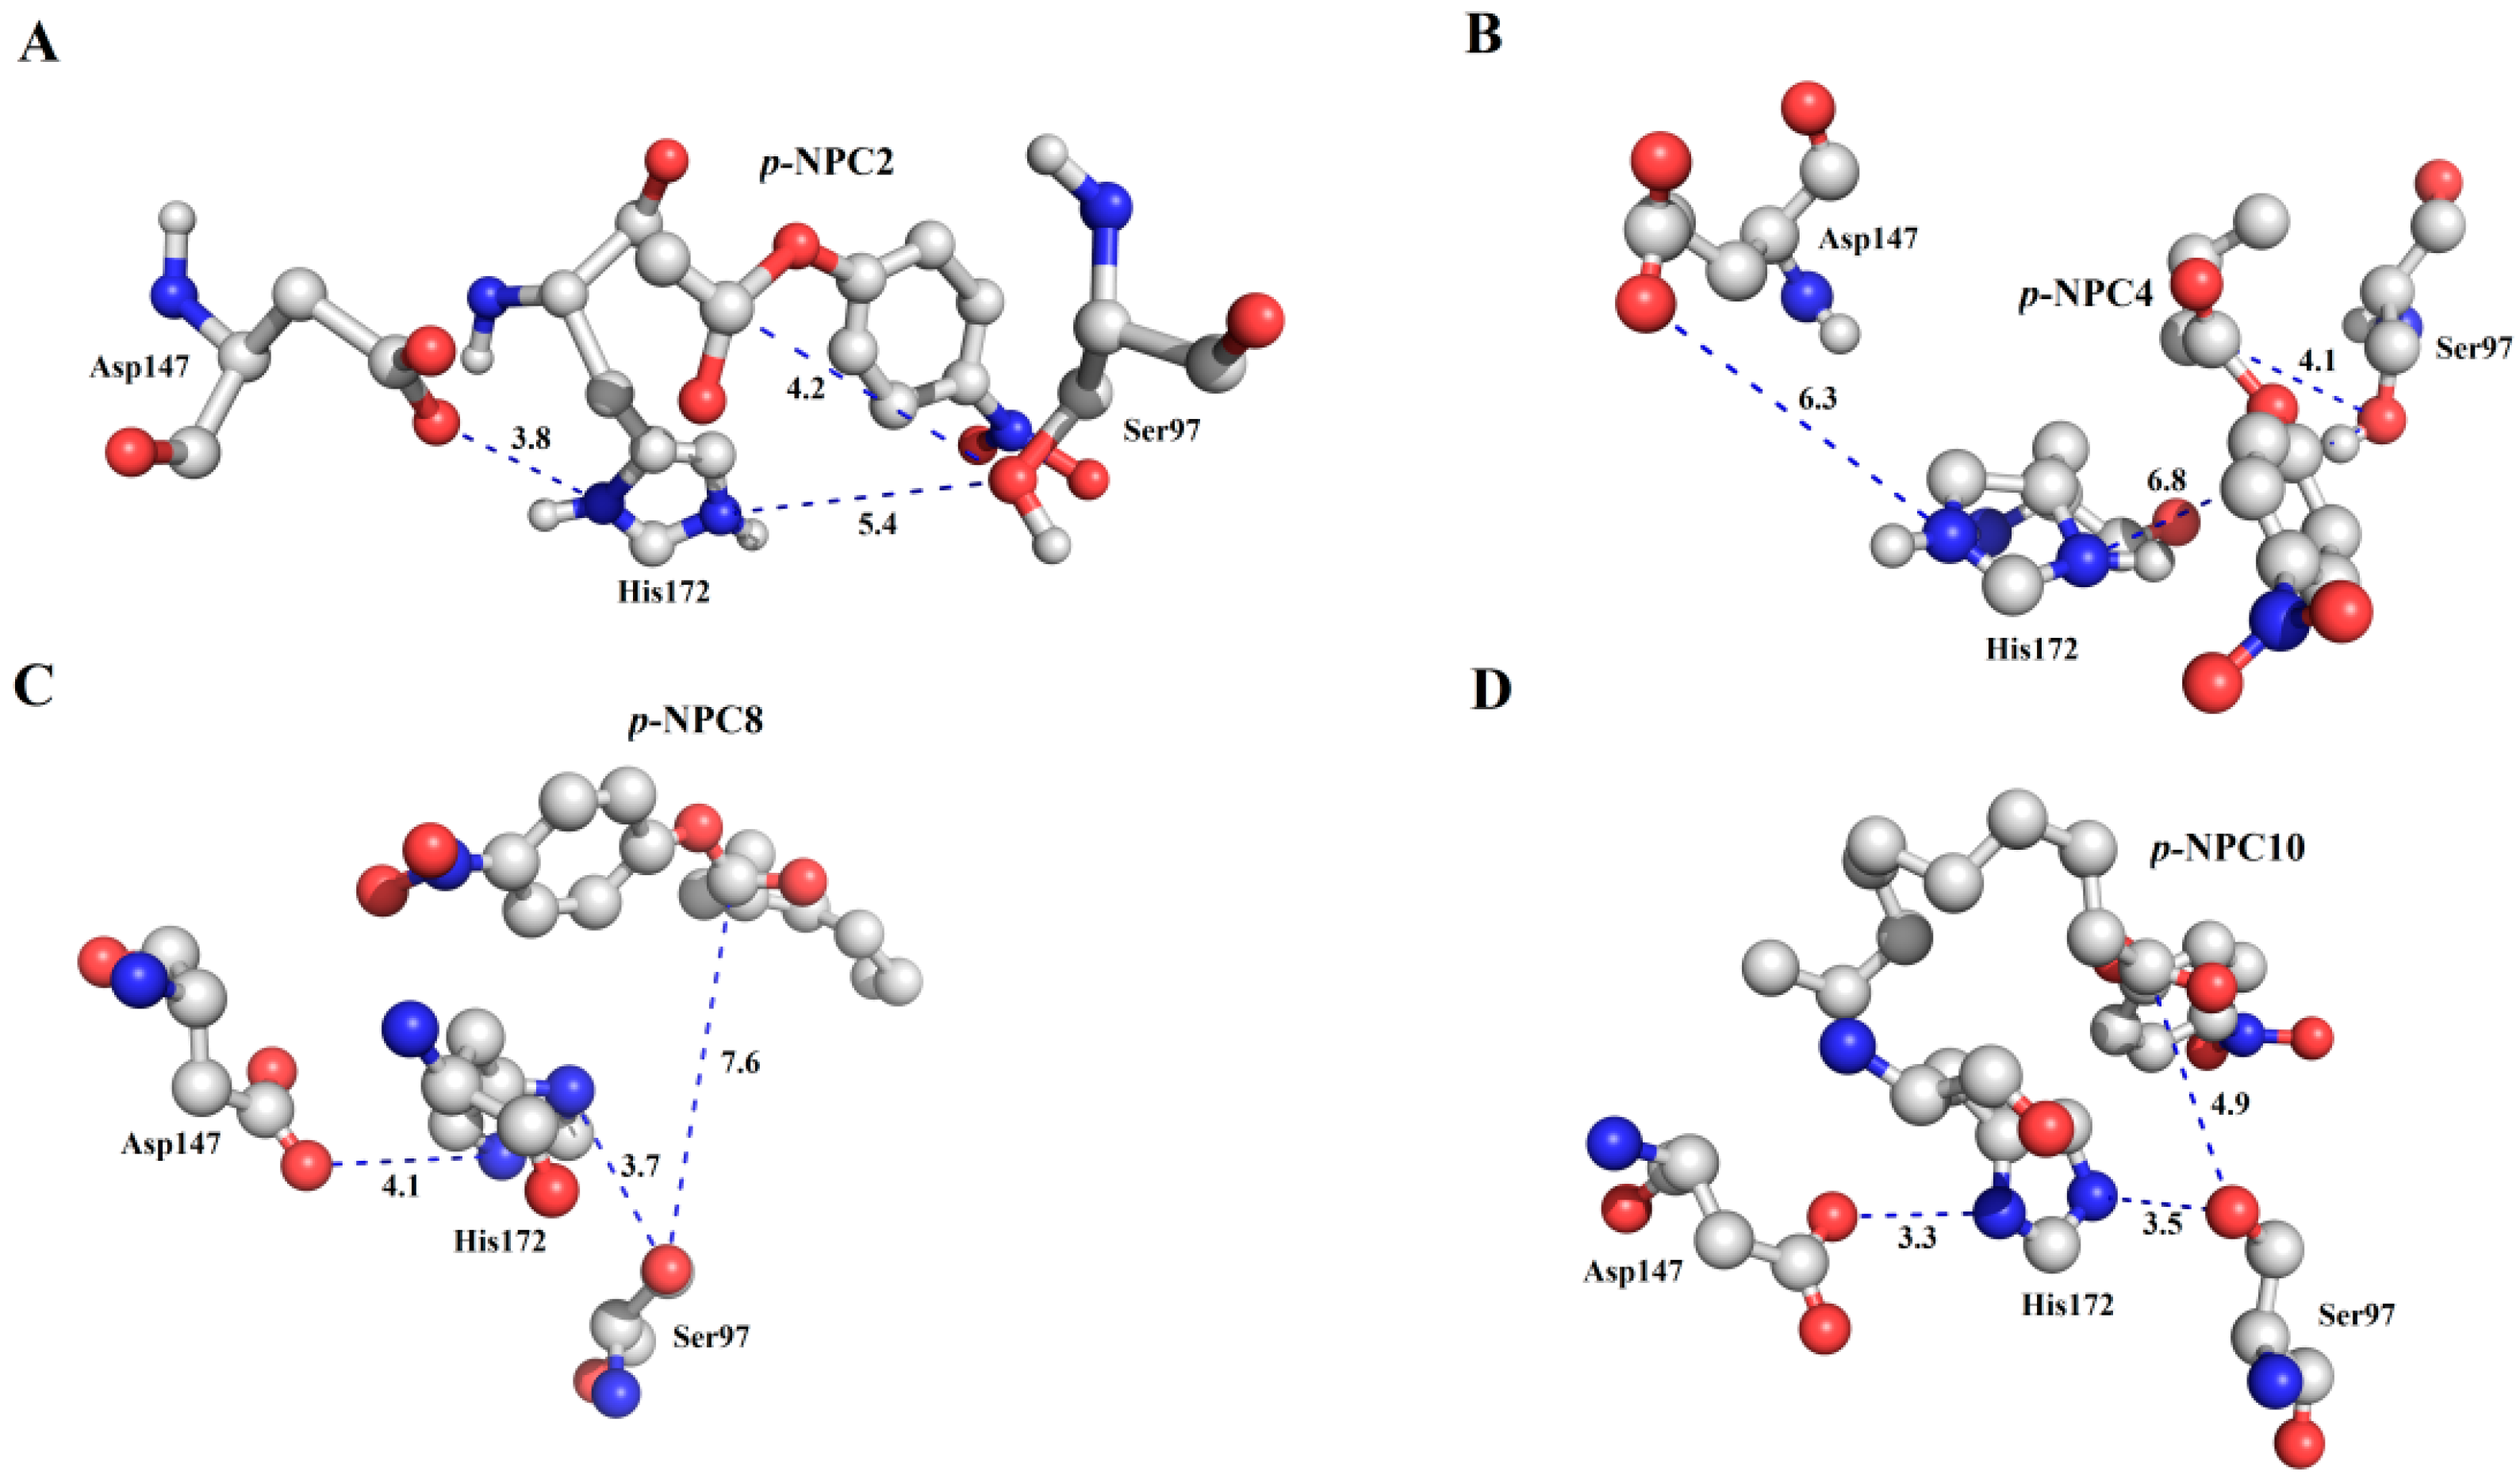
p-NPC10) were docked into P186_1588. In the
Figure 10, all the substrates were located in a reasonable orientation with the distance between hydroxyl (Oγ-Ser
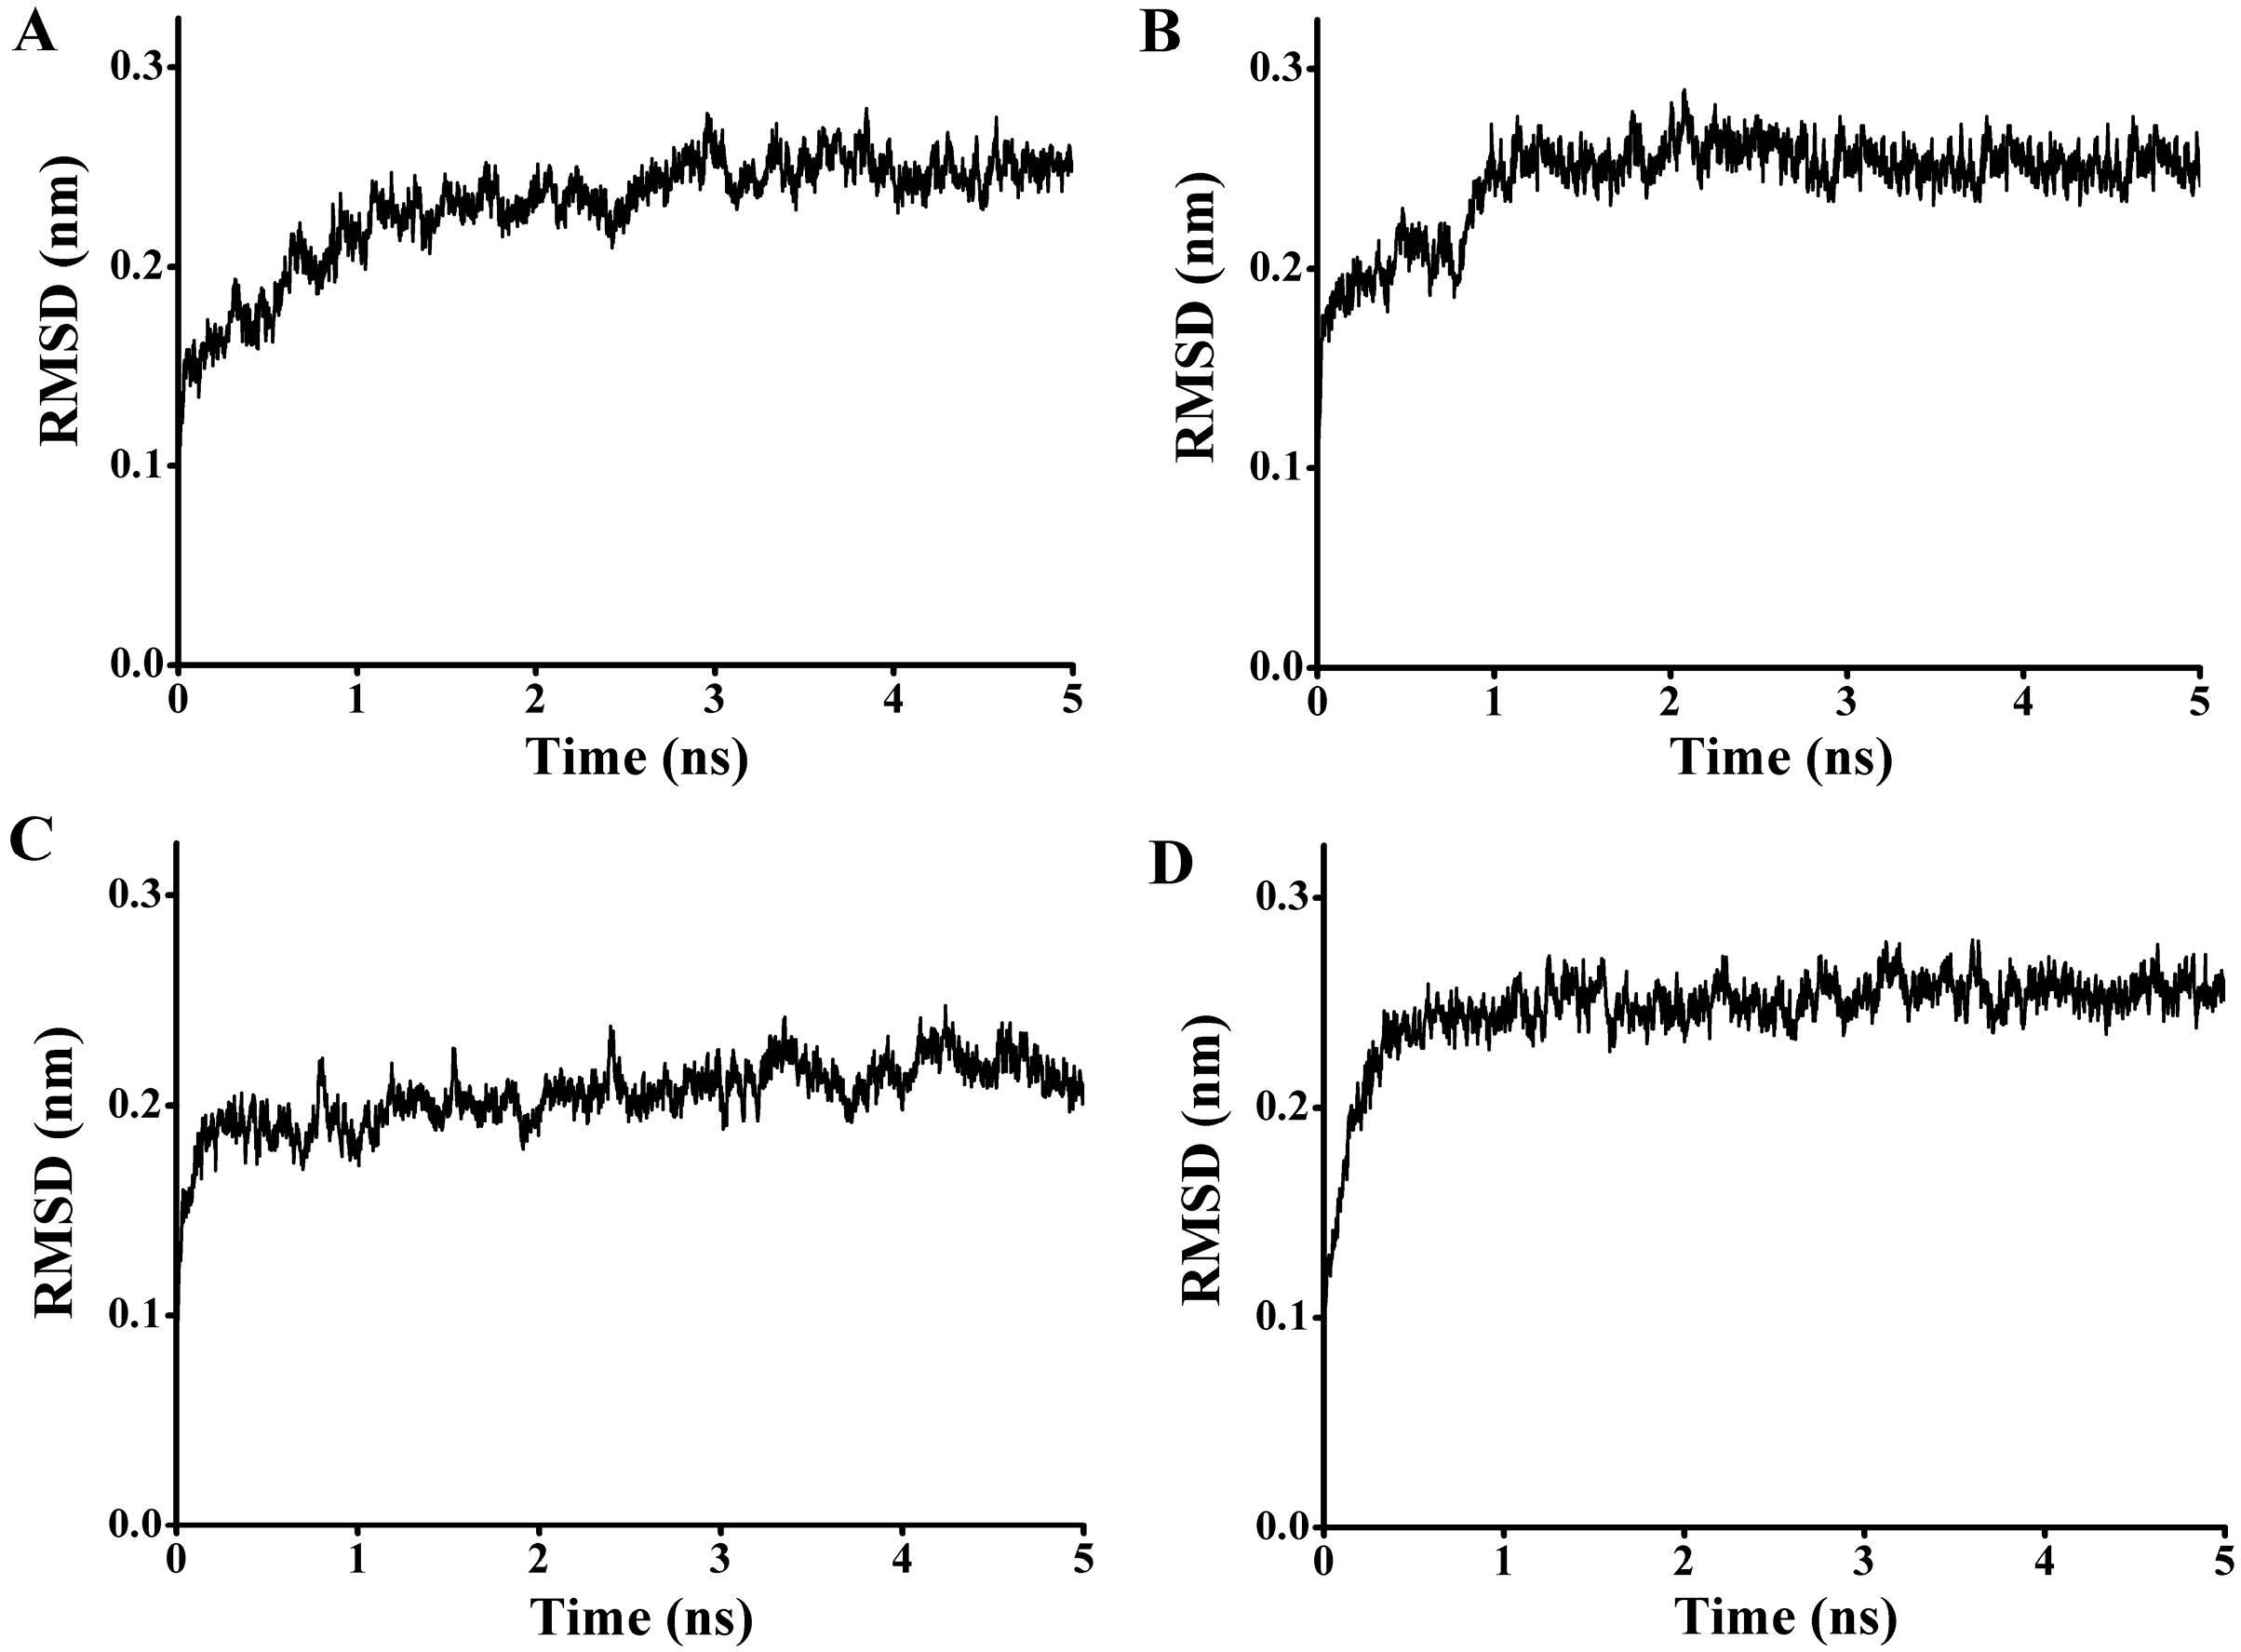
97) and the carbonyl carbon of the substrate from 4.1 to 7.6 Å. To get a reliable binding free energy, all the complexes were performed for MD simulations. After 5 ns MD simulation, RMSD values of all the complexes were stable after approximately 3000 ps, indicating that the simulation systems have equilibrated (
Figure 11). The equilibrated systems were then used to calculate the binding free energy for each enzyme-substrate complex using MM-PBSA approach. As shown in
Table 7, negative binding free energy values (Δ
Gbinding) revealed that the binding between the enzyme and the
p-NP esters were spontaneous. However, the Δ
Gbinding value rose with the increase of the carbon chain length of substrate. The Δ
Gbinding between P186_1588 and
p-NPC2 showed the lowest binding free energy (−39.54 kcal·mol
−1) in the four enzyme-substrate complexes. These results predicted that P186_1588 would show the highest affinity towards
p-NPC2. This profile is in harmony with the kinetic experiment that rP186_1588 displayed the lowest
Km value towards
p-NPC2 (
Table 2).
Figure 10.
The binding mode of the complexes between P186_1588 and p-NP esters. (A) The binding pose for the complex of P186_1588 and p-NPC2; (B) The binding pose for the complex of P186_1588 and p-NPC4; (C) The binding pose for the complex of P186_1588 and p-NPC8; (D) The binding pose for the complex of P186_1588 and p-NPC10.
Figure 11.
The rmsd values for the backbone atoms of the docked complex during 5 ns simulations. (A) The rmsd values for the complex of P186_1588 and p-NPC2; (B) The rmsd values for the complex of P186_1588 and p-NPC4; (C) The rmsd values for the complex of P186_1588 and p-NPC8; (D) The rmsd values for the complex of P186_1588 and p-NPC10.
To get insight into the driving force for the binding interaction, the binding free energy items were also analyzed. The binding free energy component in
Table 7 shows that the van der Waals interactions (Δ
EvdW) are much larger than other energy components, which reveals that the van der Waals interactions are the major driving force for the binding between P186_1588 and
p-NP esters. In addition, the electrostatic energy (Δ
Eele) shows as negative values, while the polar contribution to the solvation free energy (Δ
EPB) displays as positive values, which indicates that the electrostatic interactions would be offset by the unfavorable electrostatic solvation free energy. This result is expected since the electrostatic interaction is generally anti-correlated with the electrostatic solvation free energy [
45].
Table 7.
Binding free energy (in kcal·mol−1) for p-NP esters binding to P186_15588 *.
Table 7.
Binding free energy (in kcal·mol−1) for p-NP esters binding to P186_15588 *.
| | ΔEele | ΔEvdW | ΔEPB | ΔESA | ΔGgas | ΔGsol | ΔGbinding |
|---|
| p-NPC2 | −3.31(0.32) | −42.84(0.33) | 10.35(0.25) | −3.74(0.02) | −46.15(0.40) | 6.61(0.26) | −39.54(0.31) |
| p-NPC4 | −0.00(0.00) | −37.46(0.28) | 6.25(0.08) | −4.28(0.01) | −37.46(0.28) | 1.97(0.08) | −35.49(0.27) |
| p-NPC8 | −2.22(0.14) | −29.58(0.23) | 6.80(0.11) | −3.26(0.02) | −31.80(0.29) | 3.54(0.10) | −28.26(0.24) |
| p-NPC10 | −0.32(0.02) | −30.72(0.34) | 7.79(0.23) | −3.84(0.03) | −31.04(0.42) | 3.85(0.23) | −27.18(0.34) |
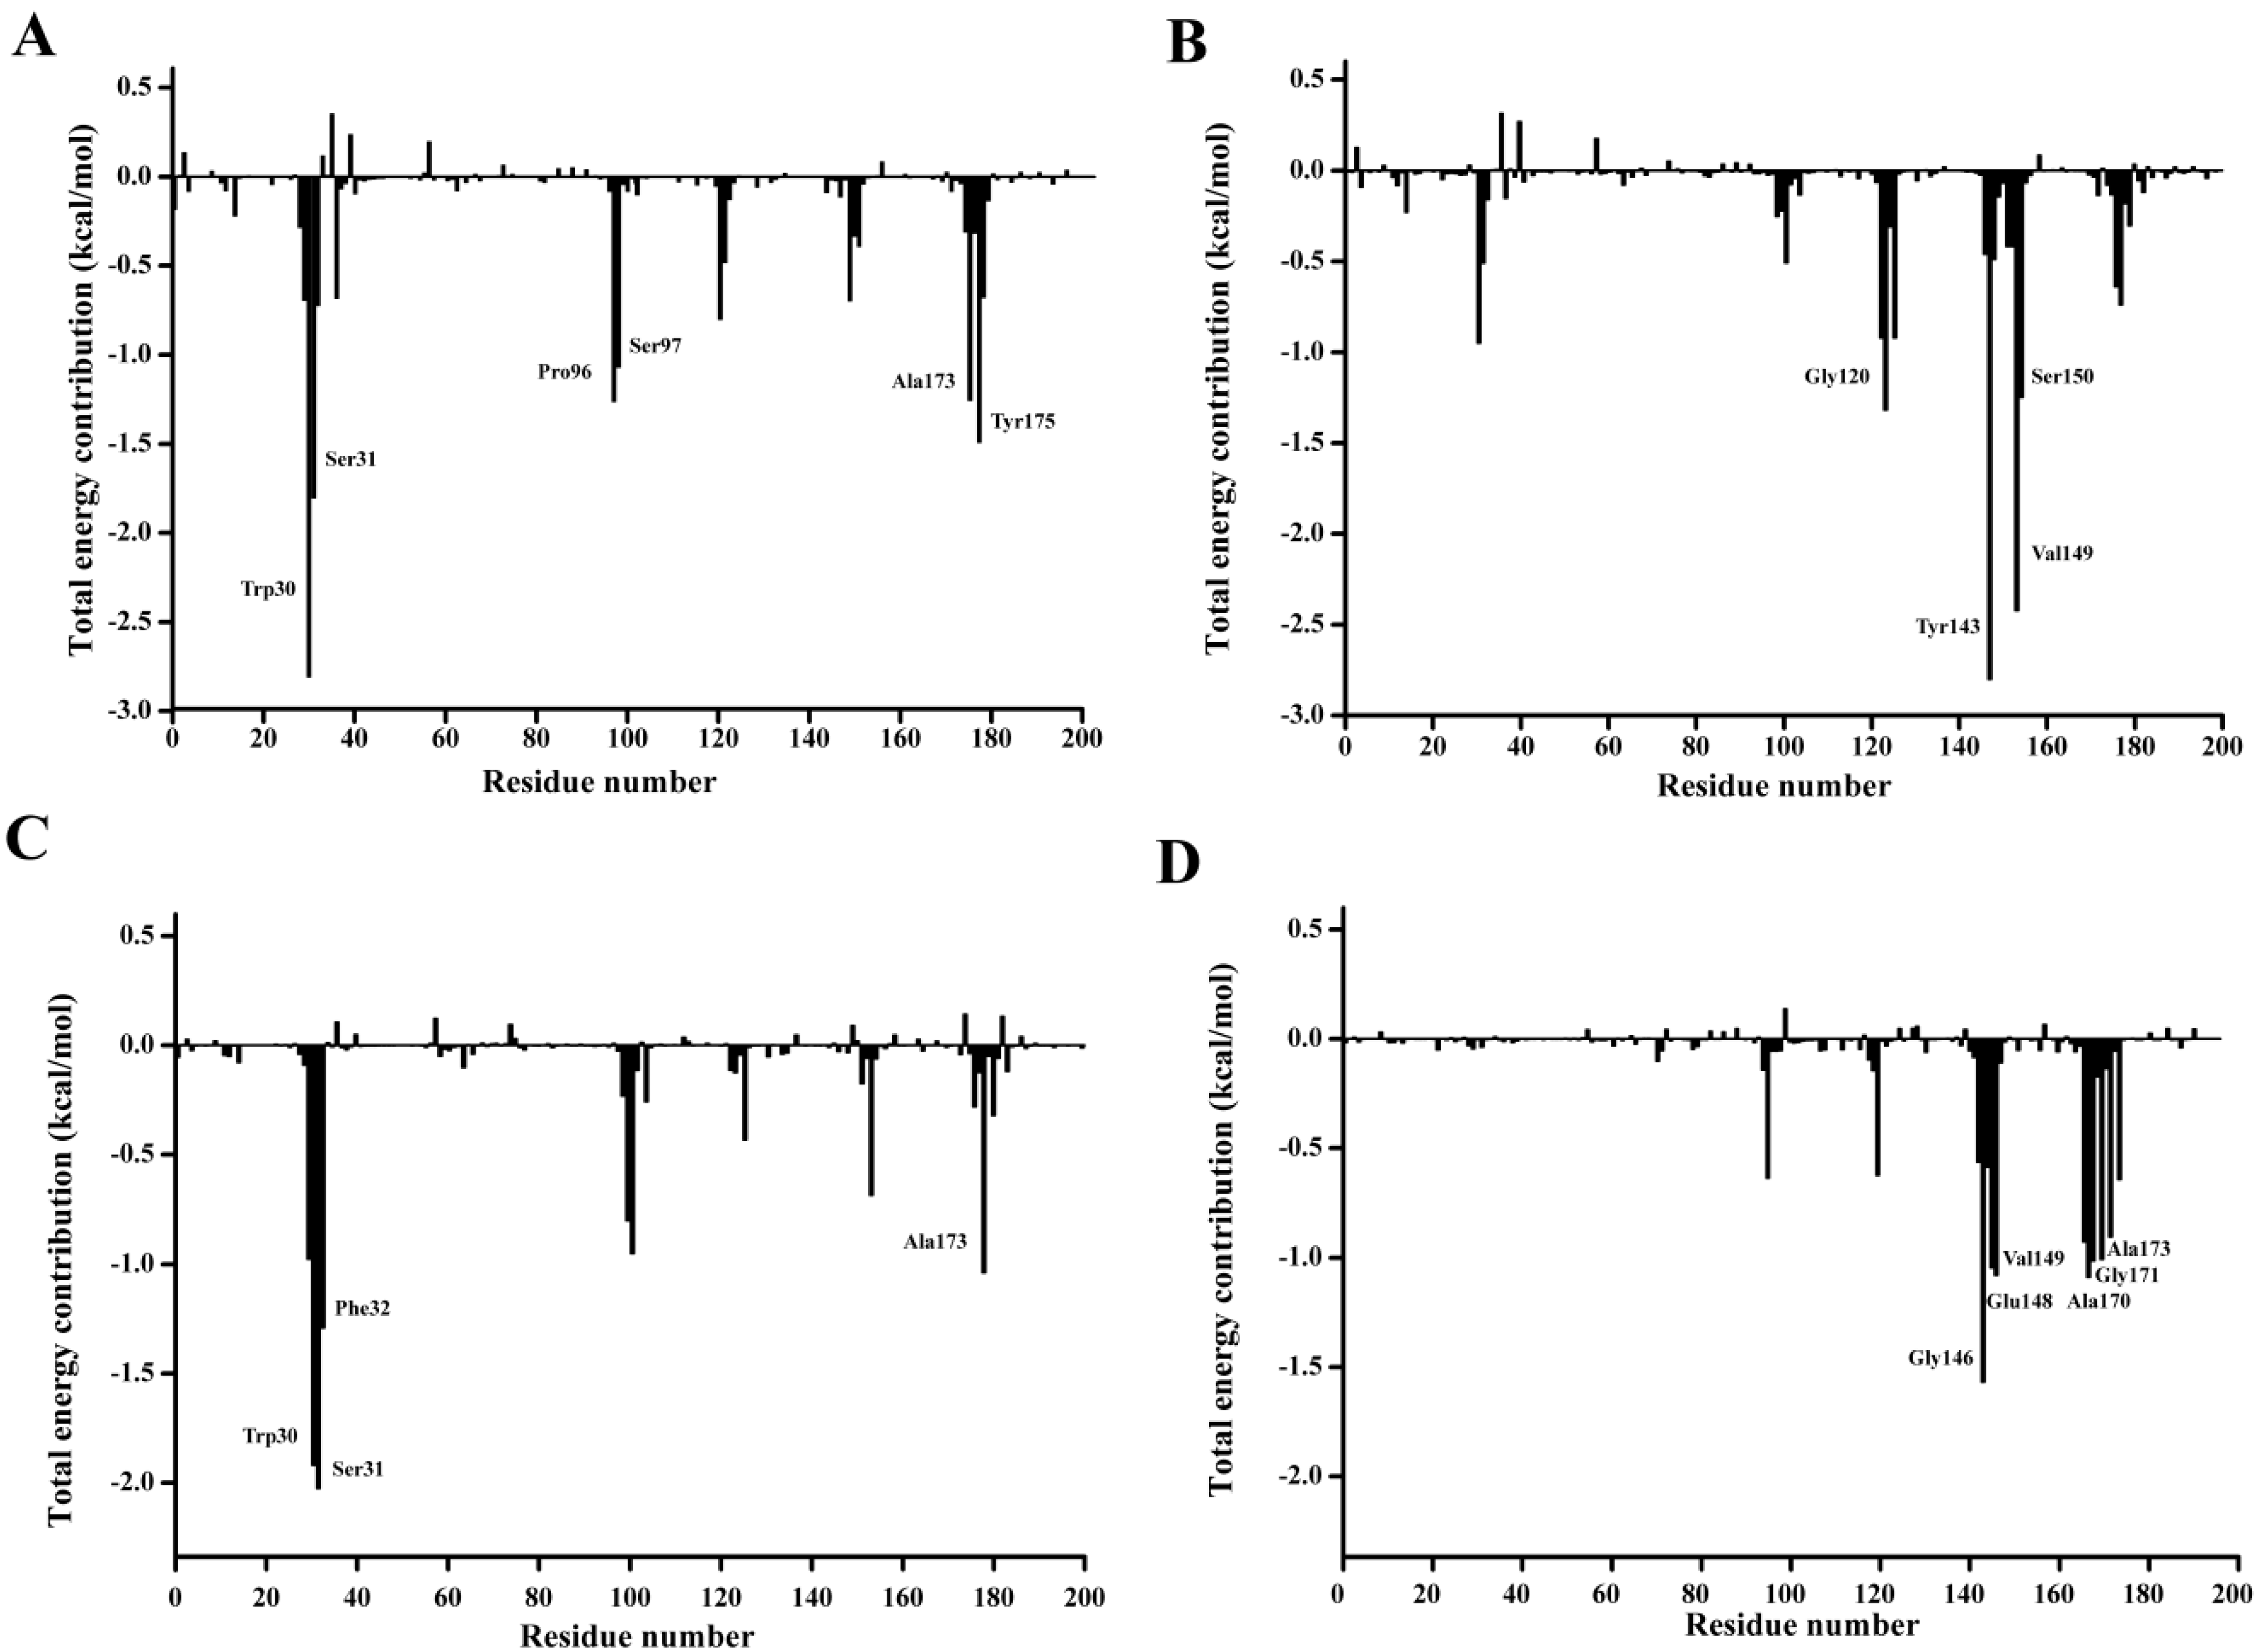
In order to qualitatively obtain more details of the residue energy contribution that played an important role in the
p-NP ester binding, the binding free energy was decomposed on a per-residue level with MM-PBSA method. The per residue contribution profile are shown in
Figure 12. Six residues including Trp30, Ser31, Pro96, Ser97, Ala173, and Tyr175 are observed to significantly contribute to the substrate binding of
p-NPC2. Four residues Gly120, Trp143, Val149, and Ser150 have major contribution to the binding of
p-NPC4. As for the binding of
p-NPC8, Trp30, Ser31, Phe32, and Ala175 are found to make remarkably contribution. As for the binding of
p-NPC10, Gly146, Glu148, Val149, Ala170, Gly171, and Ala173 are shown important contribution. In addition, as shown in
Table 8, the van der Waals energy contribution of each residue are much larger than the corresponding electrostatic energy contribution. These results reveal that these residues contribute their substrate affinity mainly through van der Waals interactions. Moreover, the total interaction energy for
p-NPC2 (−9.69) and
p-NPC4 (−7.63) were lower than those for
p-NPC8 (−6.28) and
p-NPC10 (−6.80). These results revealed that the binding pocket could provide a better hydrophobic environment for short chain
p-NP esters. In the complex of P186_1588 and
p-NPC2, and P186_1588 and
p-NPC8, Trp30 provided the strongest van der Waal energy, which suggested that it played a crucial role in the binding of
p-NPC2 and
p-NPC8. These results revealed that improving the hydrophobic environment through protein engineering would further enhance its activity towards short chain
p-NP esters.
Figure 12.
Residue-residue interaction spectra for all kinds of complexes according to the MM-PBSA method. The x-axis denotes the residue number, and the y-axis denotes the interaction energy between the P186_1588 and each residue. The important residues (<−1 kcal·mol−1) for binding are marked by corresponding texts. (A) The residue-residue interaction spectra for the complex of P186_1588 and p-NPC2; (B) The residue-residue interaction spectra for the complex of P186_1588 and p-NPC4; (C) The residue-residue interaction spectra for the complex of P186_1588 and p-NPC8; (D) The residue-residue interaction spectra for the complex of P186_1588 and p-NPC10.
Table 8.
The total energy (Etotal), van der Waal energy (EvdW), and electrostatic energy (Eele) between substrates and individual residues (Etotal < −1.0 kcal·mol−1 listed in energy rank order).
Table 8.
The total energy (Etotal), van der Waal energy (EvdW), and electrostatic energy (Eele) between substrates and individual residues (Etotal < −1.0 kcal·mol−1 listed in energy rank order).
| p-NPC2 | EvdW | Eele | Etotal | p-NPC4 | EvdW | Eele | Etotal |
|---|
| Trp30 | −2.68 | −0.13 | −2.81 | Gly120 | −1.28 | −0.04 | −1.32 |
| Ser31 | −1.14 | −0.66 | −1.80 | Trp143 | −2.78 | −0.02 | −2.80 |
| Pro96 | −1.16 | −0.10 | −1.26 | Val149 | −2.34 | 0.08 | −2.42 |
| Ser97 | −1.01 | −0.06 | −1.07 | Ser150 | −1.21 | −0.04 | −1.25 |
| Ala173 | −1.39 | 0.13 | −1.26 | | | | |
| Tyr175 | −1.60 | 0.11 | −1.49 | | | | |
| Total | −8.98 | −0.71 | −9.69 | Total | −7.61 | −0.02 | −7.63 |
| p-NPC8 | EvdW | Eele | Etotal | p-NPC10 | EvdW | Eele | Etotal |
| Trp30 | −2.14 | 0.22 | −1.92 | Gly146 | −1.35 | −0.22 | −1.57 |
| Ser31 | −1.14 | −0.89 | −2.03 | Glu148 | −1.47 | 0.43 | −1.04 |
| Phe32 | −1.42 | 0.13 | −1.29 | Val149 | −1.10 | 0.02 | −1.08 |
| Ala173 | −0.93 | −0.11 | −1.04 | Ala170 | −1.08 | −0.01 | −1.09 |
| | | | | Gly171 | −1.20 | 0.19 | −1.01 |
| | | | | Ala173 | −1.02 | 0.01 | −1.01 |
| Total | −5.63 | −0.65 | −6.28 | Total | −7.22 | 0.42 | −6.80 |


