Article

BTG1 Expression Correlates with the Pathogenesis and Progression of Ovarian Carcinomas

1
Department of Gynecology, the First Affiliated Hospital of China Medical University, Shenyang 110001, China
2
Department of Biochemistry and Molecular Biology, Institute of Pathology and Pathophysiology, College of Basic Medicine, China Medical University, Shenyang 110001, China
3
Clinical Cancer Institute, Kanagawa Cancer Center, Yokohama 241-0815, Japan
*
Author to whom correspondence should be addressed.
Int. J. Mol. Sci. 2013, 14(10), 19670-19680; https://doi.org/10.3390/ijms141019670
Submission received: 13 May 2013 / Revised: 5 September 2013 / Accepted: 6 September 2013 / Published: 27 September 2013
(This article belongs to the Special Issue Advances in Cancer Diagnosis)

Abstract

:
BTG (B-cell translocation gene) can inhibit cell proliferation, metastasis, and angiogenesis and regulate cell cycle progression and differentiation in a variety of cell types. We aimed to clarify the role of BTG1 in ovarian carcinogenesis and progression. A BTG1-expressing plasmid was transfected into ovarian carcinoma cells and their phenotypes and related proteins were examined. BTG1 mRNA expression was detected in ovarian normal tissue (n = 17), ovarian benign tumors (n = 12), and ovarian carcinoma (n = 64) using real-time RT-PCR. Ectopic BTG1 expression resulted in lower growth rate, high cisplatin sensitivity, G1 arrest, apoptosis, and decreased migration and invasion. Phosphoinositide 3-kinase, protein kinase B, Bcl-xL, survivin, vascular endothelial growth factor, and matrix metalloproteinase-2 mRNA and protein expression was reduced in transfectants as compared to control cells. There was higher expression of BTG1 mRNA in normal tissue than in carcinoma tissue (p = 0.001) and in benign tumors than in carcinoma tissue (p = 0.027). BTG1 mRNA expression in International Federation of Gynecology and Obstetrics (FIGO) stage I/II ovarian carcinomas was higher than that in FIGO stage III/IV ovarian carcinomas (p = 0.038). Altered BTG1 expression might play a role in the pathogenesis and progression of ovarian carcinoma by modulating proliferation, migration, invasion, the cell cycle, and apoptosis.

1. Introduction

Ovarian cancer is a malignant disease that poses a serious threat to women’s health; it is the fifth leading cause of cancer-related death in women. More than 90% of ovarian cancers are classified as epithelial and are believed to arise from the ovarian epithelium due to risk factors such as family history of ovarian carcinoma, and mutation. Ovarian cancer is disproportionately deadly because the lack of a sophisticated approach to early diagnosis means that most ovarian cancers are diagnosed at advanced stages, resulting in the five-year survival rate of ovarian cancer being 47% [1,2]. Tumorigenesis and progression of ovarian carcinoma is a multistage process, and increased understanding of the changes that occur in gene expression during carcinogenesis may result in the improvement of its diagnosis, treatment, and prevention.
The human B-cell translocation gene (BTG) family comprises six members (BTG1, BTG2/TIS21/PC3, BTG3, BTG4/PC3B, Transducer of ErbB-2, and TOB2) whose encoding proteins inhibit proliferation and regulate cell cycle progression and differentiation in a variety of cell types. BTG is a nuclear protein that is imported into the nucleus through a nuclear localization signal; its nucleocytoplasmic translocation depends on the stage of cell growth as mediated by a nuclear export signal [35]. BTG1 was originally identified in a B-cell chronic lymphocytic leukemia at a t(q24;q22) translocation and was used as an indicator biomarker for complete remission of acute myeloid leukemia [68]. Human BTG1 is localized on chromosome 12q22 and its 4704-nucleotide cDNA encodes 171 amino acids and 19 kDa protein [9]. The N-terminal domain of BTG1 bears an LXXLL motif favoring nuclear accumulation, and another region encompassing Box A inhibiting nuclear localization [5]. The C-terminal domain of
BTG1 is involved in interaction with the nuclear receptor TRα and the myogenic factor MyoD [10]. BTG1 expression is highest in the G0/G1 phases of the cell cycle and is decreased when cells progress through G1. It is believed to be a potential tumor suppressor due to its inhibitory effects on proliferation and cell cycle progression [11]. Additionally, BTG1 can bind to protein arginine methyltransferase (PRMT) 1 via the box C region [6,12]. BTG1 expression in primary mouse bone marrow cells suppressed the outgrowth of erythroid colonies, which requires a BTG1 domain that binds to PRMT1 [13]. Human carbon catabolite repressor protein-associated factor 1 (hCAF-1) can form a hCAF-1/BTG1 complex [14], which is dependent on the phosphorylation of a putative p34CDC2/cyclin E and p34CDK2/cyclin A kinase site on BTG1 Ser-159 [15]. BTG1 is a Bcl-2-regulated mediator of apoptosis and contributes to antisense Bcl-2-mediated cytotoxic effects in breast cancer cells [16]. BTG1 enhanced homeobox B9-mediated transcription in transfected cells and mediated their antiproliferative function [17]. BTG1 overexpression induced increased apoptosis of NIH 3T3 cells, indicative of its pro-apoptotic effect [18]. BTG1 overexpression may inhibit myoblast proliferation and stimulate terminal differentiation [19]. In macrophages, activator protein-1 and nuclear factor κB inhibition mediated by BTG1 activation reversed the oxidative stress of the inducible nitric oxide synthase and cytokine genes [20].
As shown by DNA fragmentation and nuclear condensation, BTG1 localizes to specific macrophage-rich regions in human lesions and apoptotic cells. BTG1 mRNA is abundantly expressed in quiescent endothelial cells and decreased by the addition of angiogenic growth factors [17]. In this study, we describe the effects of BTG1 overexpression on the phenotypes and related proteins of ovarian carcinoma cells. We examined BTG1 mRNA expression in ovarian normal tissue, benign tumors, and carcinomas and compared it with clinicopathological parameters to clarify the roles of BTG1 in ovarian carcinogenesis and subsequent progression.

2. Results

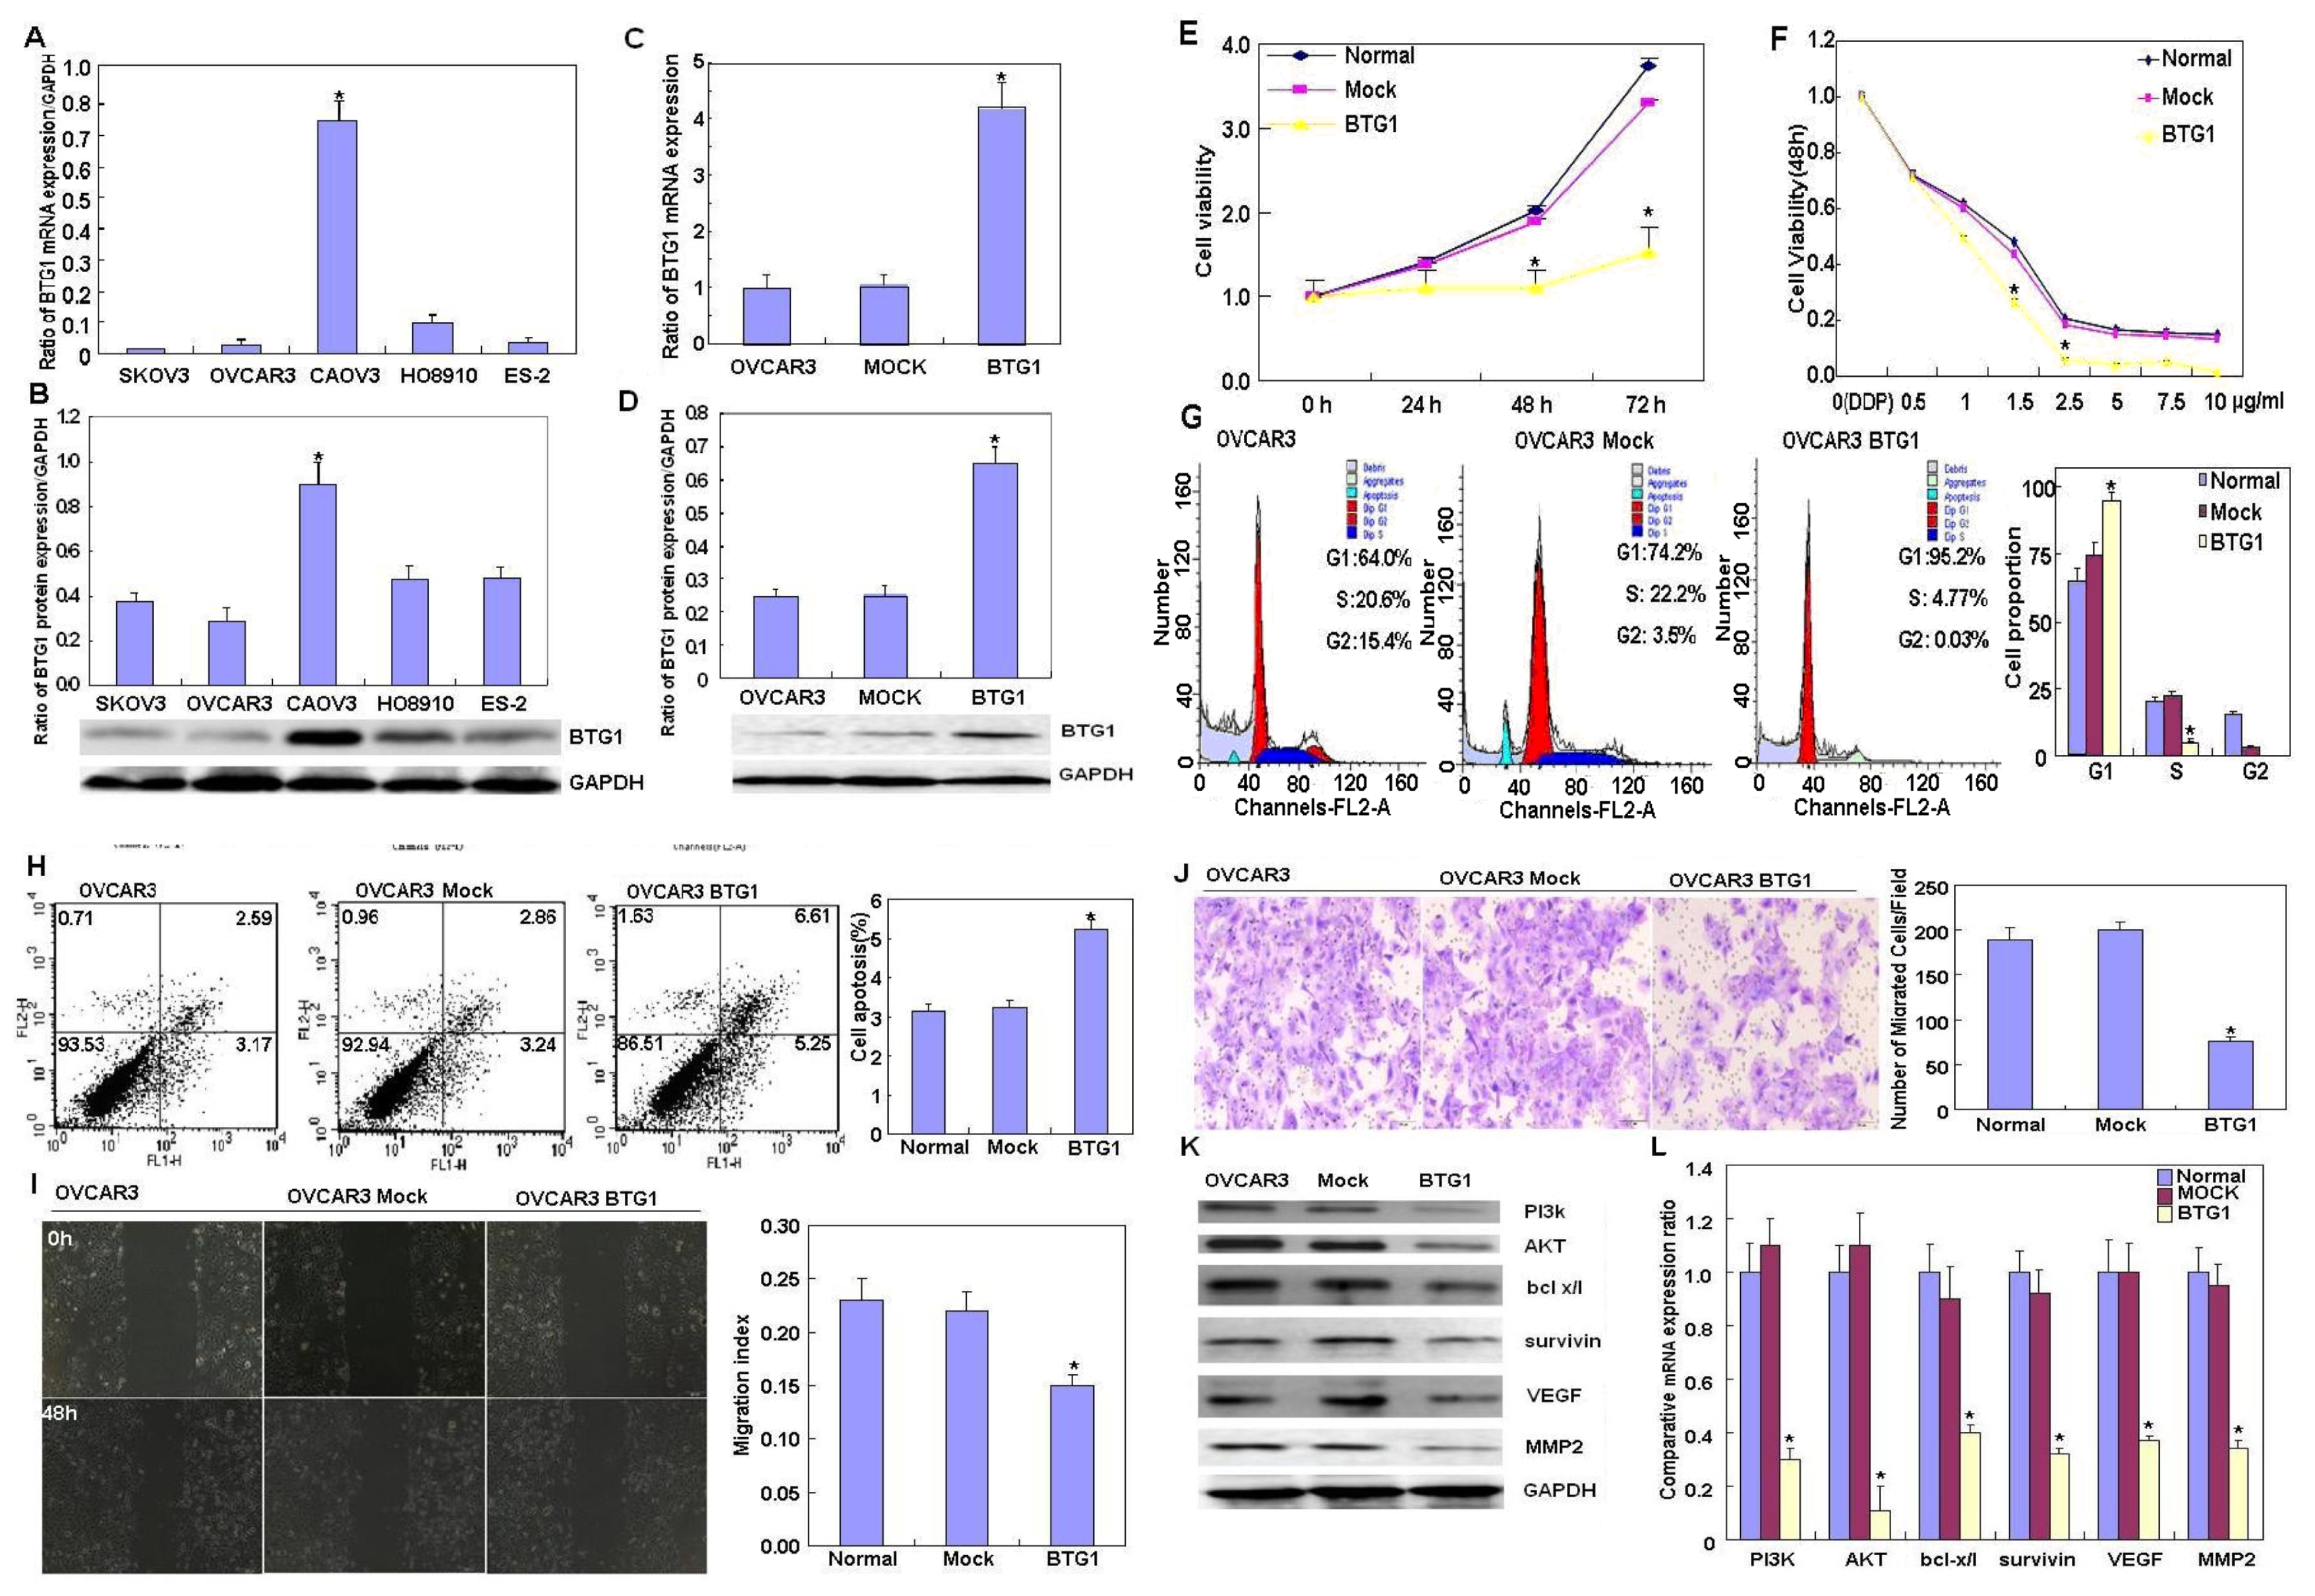
2.1. Effects of BTG1 Overexpression on the Phenotypes and Related Proteins of Ovarian Carcinoma

Real-time RT-PCR and western blotting revealed that BTG1 mRNA and protein expression, respectively, were higher in CAOV3 cells as compared with other carcinoma cells (Figure 1A,B, p < 0.05). To clarify the role of BTG1, a BTG1-expressing plasmid was transfected into OVCAR3 cells, as shown by real-time PCR (Figure 1C, p < 0.05) and western blotting (Figure 1D, p < 0.05). In comparison with the negative control and mock cells, Cell Counting Kit-8 (Dojindo, Kumamoto, Japan) revealed that the transfectants had a lower rate of growth (Figure 1E, p < 0.05) and higher cisplatin sensitivity (Figure 1F, p > 0.05); propidium iodide (PI) staining revealed that there was G1 arrest (Figure 1G, p < 0.05). Annexin V-fluorescein isothiocyanate (FITC) staining revealed the apoptosis-inducing effect of BTG1 overexpression in OVCAR3 cells (Figure 1H, p < 0.05). Wound healing and Transwell assays revealed slower migration (Figure 1I, p < 0.05) and invasion (Figure 1J, p < 0.05), respectively, by transfectants as compared to the negative control and mock cells. Additionally, there was lower phosphoinositide 3-kinase (PI3K), protein kinase B (Akt) Bcl-xL, survivin, vascular endothelial growth factor (VEGF), and matrix metalloproteinase-2 (MMP-2) protein (Figure 1K) and mRNA (Figure 1L) expression in the BTG1 transfectants as compared with the negative control and mock cells.

2.2. Correlation of BTG1 mRNA Expression with Tumorigenesis and Clinicopathological Features of Ovarian Carcinoma

BTG1 mRNA in ovarian tissue was amplified using real-time RT-PCR. There was higher expression of BTG1 mRNA in normal tissue than in carcinoma tissue (p = 0.001, Table 1) and in benign tumors than in carcinomas (p = 0.027, Table 1), as well as in International Federation of Gynecology and Obstetrics (FIGO) stage I/II carcinomas than in FIGO stage III/IV carcinomas (p = 0.038; Table 2). BTG1 mRNA expression was not correlated with pathological classification or differentiation of ovarian carcinoma (p > 0.05; Table 2).

3. Discussion

An increasing amount of evidence suggests that BTG1 is a member of a family of antiproliferative genes, as BTG1 expression is highest in the G0/G1 phases of the cell cycle and is downregulated when cells progress through G1[4,11]. The present study is the first instance that BTG1 mRNA expression in precancerous and cancerous ovarian tissue was examined. BTG1 mRNA expression was lower in carcinomas and higher in normal ovarian tissue, indicating that downregulated BTG1 expression contributes to ovarian epithelial carcinogenesis. Our findings are in agreement with the finding that BTG3 mRNA expression was higher in ovarian normal tissue and benign tumors than that in borderline, primary, and metastatic ovarian carcinoma [21]. Urzúa et al. [22] used cDNA microarray analysis and demonstrated a significant association between aberrant BTG1 mRNA expression and ovarian carcinoma. BTG1 downregulation was reported to result from genomic deletions, which were detected in 9% (65/722) of B-cell precursor acute lymphoblastic leukemia (ALL), but not in 109 cases of T-cell ALL [23]. In future studies, we aim to clarify the expression and genetic/epigenetic alteration of BTG1.
In the present study, BTG1 mRNA expression was negatively linked to FIGO staging of ovarian carcinoma, indicating that BTG1 protein might be involved in the development of ovarian cancer and may be considered a good biomarker for indicating the aggressive behaviors of ovarian carcinoma. Deng et al. [24] found that BTG3 mRNA expression was negatively correlated with dedifferentiation and FIGO staging of ovarian carcinoma. Our data are in accordance with that of Chen et al. [25], who reported that BTG1 expression was higher in the prostate carcinoma cell line LNCaP than in the aggressively metastatic AI C4-2 cell line at both mRNA and protein level. Wang et al. [26] treated LNCaP cells with the androgen receptor antagonist flutamide and found that BTG1 mRNA expression was upregulated, indicating that BTG1 overexpression might be involved in the enhancement of chemotherapeutic sensitivity in cancers.
After investigating the BTG1 mRNA and protein expression in all cell lines, we found that BTG1 mRNA and protein expression were higher in CAOV3 cells than in the other cell lines (p < 0.05); there were no significant differences between the other cell lines. We used the OVCAR3 cell line for BTG1 transfection because of its higher proliferation ability. In agreement with its function as a tumor suppressor gene, our in vitro study showed that ectopic BTG1 overexpression inhibited proliferation, migration, and invasion and induced G1 arrest and apoptosis in OVCAR3 cells. Forced BTG1 overexpression decreased the expression of PI3K, Akt, Bcl-xL, survivin, VEGF, and MMP-2 mRNA and protein; these are target factors in our cancer research, which have clear roles in the regulation of cellular apoptosis and proliferation, and thus were examined in this study. Other proteins, such as Wnt-5a, Notch, MDR and GST-π, were also analyzed, but did not yield significant results.

4. Materials and Methods

4.1. Cell Culture and Transfection

Ovarian carcinoma cell lines CAOV3 (serous adenocarcinoma), OVCAR3 (serous cystic adenocarcinoma), SKOV3 (serous papillary cystic adenocarcinoma), HO8910 (serous cystic adenocarcinoma), and ES-2 (clear cell carcinoma) were purchased from ATCC (Manassas, VA, USA). They were maintained in RPMI 1640 (ES-2, HO8910, and OVCAR3), DMEM (CAOV3), and McCoy’s 5A (SKOV3) medium supplemented with 10% fetal bovine serum (FBS), 100 units/mL penicillin, and 100 μg/mL streptomycin in a humidified atmosphere of 5% CO2 at 37 °C.

4.2. Plasmid Construction and Transfection

BTG1 was amplified using the following primer sequences: forward, 5′-CCGGAATTCATGCATCCCTTCTACACC-3′; reverse, 5′-GCTCTAGAACCTGATACAGTCATCATAT-3′. Template cDNA was obtained from human colorectal carcinoma HCT115 cells. PCR products were ligated into a pcDNA3.1 vector (Clontech, Mountain View, CA, USA) between the EcoRI and XbaI sites.
OVCAR3 cells were transfected with pcDNA3.1-BTG1 or empty pcDNA3.1 24 h after they were seeded on dishes and selected by G418 according to the manufacturer’s instructions (Qiagen, Valencia, CA, USA); the final collection comprised three monoclones, which were combined for the following experiments.

4.3. Cell Cycle Analysis

The cells were trypsinized, collected, washed with phosphate-buffered saline (PBS) twice, and fixed in 10 mL cold ethanol for 12 h. Then, the cells were washed with PBS twice and incubated with 1 mL RNase (0.25 mg/mL) at 37 °C for 1 h before they were pelleted and resuspended in 50 μg/mL PI and incubated at 4 °C in the dark for 30 min. The PI signal was detected using flow cytometry.

4.4. Apoptosis Assay

To detect phosphatidylserine externalization as an endpoint indicator of early apoptosis, flow cytometry was performed using 7-amino actinomycin and FITC-labeled annexin V (CA92121; BD Biosciences, San Diego, CA, USA) according to the manufacturer’s instructions.

4.5. Wound Healing Assay

Cells (1.0 × 10⁶ cells/well) were seeded in 6-well culture plates. After they had grown to confluence, the monolayer was scraped with a pipette tip (200 μL) into nine areas to create a scratch, washed with PBS thrice, and cultured in FBS-free medium. Cells were photographed at 0, 12, 24, and 48 h (n = 9) and the scratch area was measured using Scion Image for Windows (NIH, Bethesda, MD, USA). The wound healing rate = (area of original wound − area of actual wound at different times)/area of original wound × 100%.

4.6. Cell Invasion Assays

A thin Matrigel layer (40 μL of 8 mg/mL stock solution; Becton Dickinson, Bedford, MA, USA) was overlaid on the top chamber of 6.5-mm Transwell plates (8-μm pore size; BD Biosciences, 354481). The Matrigel was allowed to solidify by incubating the plates for 4 h at 37 °C. Culture medium was added to the bottom chamber of the Transwell plates. Stable clones for BTG1 (n = 3), vector control (n = 3), and negative control (n = 3) were resuspended in serum-free RPMI 1640 at a concentration of 2.5 × 10⁵ cells/mL, and 5 × 10⁴ cells were added to the top chamber of the Transwell plate. Following 48-h incubation, cells that had not invaded through the Matrigel were removed from the top surface using cotton swabs. Cells that had invaded through the Matrigel and reached the bottom surface of the filters were fixed in methanol and stained with 0.1% crystal violet. Invasion was quantified by counting the number of cells under an Olympus fluorescence microscope equipped with a 16-square reticle; the surface area of this grid was 1 mm2. Five separate fields were counted for each filter and the total numbers of cells were compared among groups using the Student t-test with the assumption of two-tailed distribution and two samples with equal variance. A difference of p < 0.05 was deemed statistically significant.

4.7. Subjects

Between January 2003 and December 2011, ovarian normal tissue (n = 17), benign tumors (n = 12), and carcinoma specimens (n = 64) from surgical resection were collected from the Department of Obstetrics and Gynecology, The First Hospital Affiliated to China Medical University, Shenyang, China. The average age at surgery was 50.8 years (range 20–80 years). Specimens were frozen immediately in liquid nitrogen and stored at −80 °C until used. None of the patients had undergone chemotherapy, radiotherapy, or adjuvant treatment before surgery. Informed consent was obtained from all subjects and the China Medical University Ethics Committee approved the study.

4.8. Pathology

All specimens were fixed in 10% neutral formalin, embedded in paraffin, and 4-μm sections were obtained. Sections were stained with hematoxylin-eosin to confirm their histological diagnosis and other microscopic characteristics. Each ovarian carcinoma specimen was evaluated according to the FIGO staging system. The histology of the ovarian carcinoma specimens was described according to World Health Organization classification.

4.9. Real-Time RT-PCR

Total RNA was extracted from the specimens using an RNeasy mini kit (Qiagen, Hilden, Germany). Total RNA (2 μg) underwent cDNA synthesis using avian myeloblastosis virus transcriptase and random primers (Takara, Otsu, Japan; Table S1). PCR amplification of cDNA was performed in 20-μL reactions according to the SYBR Premix Ex Taq II kit protocol (Takara, Otsu, Japan).

4.10. Western Blotting

Denatured proteins were separated on a sodium dodecyl sulfate-polyacrylamide gel (12% acrylamide) and transferred to a Hybond membrane (Amersham, Munich, Germany), which was blocked overnight with 5% skimmed milk in TBST (10 mmol/L Tris-HCl, 150 mmol/L NaCl, 0.1% Tween 20). For immunoblotting, the membrane was incubated for 1 h with primary antibodies against BTG1 (1:1000; Proteintech, Chicago, IL, USA), PI3K, Akt, Bcl-xL, survivin, VEGF, and MMP-2 (Santa Cruz Biotechnology, Santa Cruz, CA, USA). Then, it was rinsed with TBST and incubated with horseradish peroxidase–conjugated IgG (1:1000; Dako, Carpinteria, CA, USA) for 1 h. Bands were visualized with X film (Fujifilm, Tokyo, Japan) using ECL Plus detection reagents (Santa Cruz Biotechnology, Santa Cruz, CA, USA). Subsequently, the membrane was washed with WB Stripping Solution (pH 2–3; Nacalai Tesque, Tokyo, Japan) for 1 h and treated as described above except that anti-GAPDH antibody (1:1000; Santa Cruz Biotechnology, Santa Cruz, CA, USA) was used as an internal control. Densitometric quantification of the target proteins was performed with a GAPDH control using Scion Image (Version 4.0.3.2, Scion Corporation, Frederick, MD, USA, 2008) for Windows.

4.11. Statistical Analysis

Statistical evaluation was performed using Spearman’s correlation test and the Wilcoxon test to analyze the rank data and to differentiate the means of different groups, respectively. SPSS 10.0 (IBM, Armonk, NY, USA, 1999) was used to analyze all data and p < 0.05 was deemed statistically significant.

5. Conclusions

In summary, our findings suggest that upregulated BTG1 expression might suppress the aggressive phenotypes of ovarian carcinoma cells by downregulating expression of the phenotype-related genes and subsequently their encoded protein products, such as members of the PI3K-Akt pathway, Bcl-xL, survivin; VEGF; and MMP-2 which promote proliferation, anti-apoptosis, and invasion, respectively [2729]. Our study indicates that altered BTG1 expression might affect ovarian carcinogenesis and may be considered a potential biomarker for ovarian carcinogenesis and progression by modulating proliferative, apoptotic, migratory, and invasive events. Nevertheless, the biological functions of BTG1 in ovarian carcinoma require further investigation.

Supplementary Information

ijms-14-19670-s001.pdf
Figure 1. Effects of BTG1 overexpression on the phenotypes and related proteins of ovarian carcinoma cells. BTG1 mRNA and protein expression was screened in ovarian carcinoma cells (OVCAR3, SKOV3, HO8910, ES-2, and CAOV3); BTG1 mRNA (A) and protein (B) expression in CAOV3 cells was higher as compared with the other cell lines; After transfection with BTG1-expressing plasmids, BTG1 overexpression was detected in OVCAR3 cells by real-time RT-PCR (C) and western blotting (D) as compared with control (CTR) cells. The transfectants had lower growth and (E) and were sensitive to cisplatin treatment: cell viability decreased significantly at 1.5 μg/mL and 2.5 μg/mL cisplatin (F); and there was G1 arrest (G); a higher rate of apoptosis (H); less migration (I); and slower invasion (J) as compared to CTR cells. After forced BTG1 overexpression, there was reduced PI3K, Akt, Bcl-xL, survivin, VEGF, and MMP-2 mRNA (K) and protein expression (L) in OVCAR3 cells. *p < 0.05. Results are representative of three separate experiments; data are expressed as the mean ± standard deviation, with CTR as “1”.
Ijms 14 19670f1
Table 1. BTG1 mRNA expression in ovarian epithelial carcinogenesis.
GroupnBTG1 mRNA expression
Normal170.197 ± 0.080 **
Benign tumors120.127 ± 0.077 *
Carcinoma640.077 ± 0.059
**Compared with normal tissue (p = 0.001);
*compared with benign tumors (p = 0.027).
Table 2. Correlation of BTG1 mRNA expression with tumorigenesis and aggressive features of ovarian carcinoma.
Clinicopathological featuresnBTG1 mRNA expression
Pathological classification
Serous adenocarcinoma500.076 ± 0.062
Mucinous adenocarcinoma70.069 ± 0.038
Miscellaneous subtypes70.089 ± 0.059
FIGO staging:
I–II300.093 ± 0.069 *
III–IV340.063 ± 0.045
Differentiation
Well-differentiated210.084 ± 0.046
Moderately differentiated220.076 ± 0.053
Poorly differentiated210.071 ± 0.076
*Compared with International Federation of Gynecology and Obstetrics (FIGO) stage I/II (p = 0.038).

Acknowledgements

This work was supported by the Shenyang Outstanding Talent Foundation of China, the Shenyang Science and Technology Grant (F11-264-1-10 and F12-277-1-01), the Scientific Research Fund of Liaoning Provincial Education Department (L2010633), the Liaoning Science and Technology Grant (2009225008-11), the National Natural Science Foundation of China (Nos. 81172371 and 81202049) and the Grant-in Aid for Scientific Research from the Ministry of Education, Culture, Sports and Technology of Japan (23659958).

Conflicts of Interest

The authors declare no conflict of interest.

References

  1. Piek, J.M.; van Diest, P.J.; Verheijen, R.H. Ovarian carcinogenesis: An alternative hypothesis. Adv. Exp. Med. Biol 2008, 622, 79–87. [Google Scholar]
  2. Bandera, C.A. Advances in the understanding of risk factors for ovarian cancer. J. Reprod. Med 2005, 50, 399–406. [Google Scholar]
  3. Kawamura-Tsuzuku, J.; Suzuki, T.; Yoshida, Y.; Yamamoto, T. Nuclear localization of Tob is important for regulation of its antiproliferative activity. Oncogene 2004, 23, 6630–6638. [Google Scholar]
  4. Winkler, G.S. The mammalian anti-proliferative BTG/Tob protein family. J. Cell. Physiol 2010, 222, 66–72. [Google Scholar]
  5. Rodier, A.; Rochard, P.; Berthet, C.; Rouault, J.P.; Casas, F.; Daury, L.; Busson, M.; Magaud, J.P.; Wrutniak-Cabello, C.; Cabello, G. Identification of functional domains involved in BTG1 cell localization. Oncogene 2001, 20, 2691–2703. [Google Scholar]
  6. Lin, W.J.; Gary, J.D.; Yang, M.C.; Clarke, S.; Herschman, H.R. The mammalian immediate-early TIS21 protein and the leukemia-associated BTG1 protein interact with a protein-arginine N-methyltransferase. J. Biol. Chem 1996, 271, 15034–15044. [Google Scholar]
  7. Rimokh, R.; Rouault, J.P.; Wahbi, K.; Gadoux, M.; Lafage, M.; Archimbaud, E.; Charrin, C.; Gentilhomme, O.; Germain, D.; Samarut, J. A chromosome 12 coding region is juxtaposed to the MYC protooncogene locus in a t(8;12)(q24;q22) translocation in a case of B-cell chronic lymphocytic leukemia. Genes Chromosomes Cancer 1991, 3, 24–36. [Google Scholar]
  8. Cho, J.W.; Kim, J.J.; Park, S.G.; Lee, D.H.; Lee, S.C.; Kim, H.J.; Park, B.C.; Cho, S. Identification of B-cell translocation gene 1 as a biomarker for monitoring the remission of acute myeloid leukemia. Proteomics 2004, 4, 3456–3463. [Google Scholar]
  9. Rouault, J.P.; Rimokh, R.; Tessa, C.; Paranhos, G.; Ffrench, M.; Duret, L.; Garoccio, M.; Germain, D.; Samarut, J.; Magaud, J.P. BTG1, a member of a new family of antiproliferative genes. EMBO J 1992, 11, 1663–1670. [Google Scholar]
  10. Busson, M.; Carazo, A.; Seyer, P.; Grandemange, S.; Casas, F.; Pessemesse, L.; Rouault, J.P.; Wrutniak-Cabello, C.; Cabello, G. Coactivation of nuclear receptors and myogenic factors induces the major BTG1 influence on muscle differentiation. Oncogene 2005, 24, 1698–1710. [Google Scholar]
  11. Rouault, J.P.; Prevot, D.; Berthet, C.; Birot, A.M.; Billaud, M.; Magaud, J.P.; Corbo, L. Interaction of BTG1 and p53-regulated BTG2 gene products with mCaf1, the murine homolog of a component of the yeast CCR4 transcriptional regulatory complex. J. Biol. Chem 1998, 273, 22563–22569. [Google Scholar]
  12. Hata, K.; Nishijima, K.; Mizuguchi, J. Role for Btg1 and Btg2 in growth arrest of WEHI-231 cells through arginine methylation following membrane immunoglobulin engagement. Exp. Cell Res 2007, 313, 2356–2366. [Google Scholar]
  13. Bakker, W.J.; Blazquez-Domingo, M.; Kolbus, A.; Besooyen, J.; Steinlein, P.; Beug, H.; Coffer, P.J.; Löwenberg, B.; von Lindern, M.; van Dijk, T.B. FoxO3a regulates erythroid differentiation and induces BTG1, an activator of protein arginine methyl transferase 1. J. Cell. Biol 2004, 164, 175–184. [Google Scholar]
  14. Bogdan, J.A.; Adams-Burton, C.; Pedicord, D.L.; Sukovich, D.A.; Benfield, P.A.; Corjay, M.H.; Stoltenborg, J.K.; Dicker, I.B. Human carbon catabolite repressor protein (CCR4)-associative factor 1: Cloning, expression and characterization of its interaction with the B-cell translocation protein BTG1. Biochem. J 1998, 336, 471–481. [Google Scholar]
  15. Ikematsu, N.; Yoshida, Y.; Kawamura-Tsuzuku, J.; Ohsugi, M.; Onda, M.; Hirai, M.; Fujimoto, J.; Yamamoto, T. Tob2, a novel anti-proliferative Tob/BTG1 family member, associates with a component of the CCR4 transcriptional regulatory complex capable of binding cyclin-dependent kinases. Oncogene 1999, 18, 7432–7441. [Google Scholar]
  16. Nahta, R.; Yuan, L.X.; Fiterman, D.J.; Zhang, L.; Symmans, W.F.; Ueno, N.T.; Esteva, F.J. B cell translocation gene 1 contributes to antisense Bcl-2-mediated apoptosis in breast cancer cells. Mol. Cancer Ther 2006, 5, 1593–1601. [Google Scholar]
  17. Prevot, D.; Voeltzel, T.; Birot, A.M.; Morel, A.P.; Rostan, M.C.; Magaud, J.P.; Corbo, L. The leukemia-associated protein Btg1 and the p53-regulated protein Btg2 interact with the homeoprotein Hoxb9 and enhance its transcriptional activation. J. Biol. Chem 2000, 275, 147–153. [Google Scholar]
  18. Corjay, M.H.; Kearney, M.A.; Munzer, D.A.; Diamond, S.M.; Stoltenborg, J.K. Antiproliferative gene BTG1 is highly expressed in apoptotic cells in macrophage-rich areas of advanced lesions in Watanabe heritable hyperlipidemic rabbit and human. Lab. Invest 1998, 78, 847–858. [Google Scholar]
  19. Rodier, A.; Marchal-Victorion, S.; Rochard, P.; Casas, F.; Cassar-Malek, I.; Rouault, J.P.; Magaud, J.P.; Mason, D.Y.; Wrutniak, C.; Cabello, G. BTG1: A triiodothyronine target involved in the myogenic influence of the hormone. Exp. Cell Res 1999, 249, 337–348. [Google Scholar]
  20. Cho, I.J.; Lee, A.K.; Lee, S.J.; Lee, M.G.; Kim, S.G. Repression by oxidative stress of iNOS and cytokine gene induction in macrophages results from AP-1 and NF-kappaB inhibition mediated by B cell translocation gene-1 activation. Free Radic. Biol. Med 2005, 39, 1523–1536. [Google Scholar]
  21. Li, F.; Liu, J.; Park, E.S.; Jo, M.; Curry, T.E., Jr. The B cell translocation gene (BTG) family in the rat ovary: Hormonal induction, regulation, and impact on cell cycle kinetics. Endocrinology 2009, 150, 3894–3902. [Google Scholar]
  22. Urzua, U.; Roby, K.F.; Gangi, L.M.; Cherry, J.M.; Powell, J.I.; Munroe, D.J. Transcriptomic analysis of an in vitro murine model of ovarian carcinoma: Functional similarity to the human disease and identification of prospective tumoral markers and targets. J. Cell. Physiol 2006, 206, 594–602. [Google Scholar]
  23. Waanders, E.; Scheijen, B.; van der Meer, L.T.; van Reijmersdal, S.V.; van Emst, L.; Kroeze, Y.; Sonneveld, E.; Hoogerbrugge, P.M.; van Kessel, A.G.; van Leeuwen, F.N.; et al. The origin and nature of tightly clustered BTG1 deletions in precursor B-cell acute lymphoblastic leukemia support a model of multiclonal evolution. PLoS Genet 2012, 8, e1002533. [Google Scholar]
  24. Deng, B.; Zhao, Y.; Gou, W.; Chen, S.; Mao, X.; Takano, Y.; Zheng, H. Decreased expression of BTG3 was linked to carcinogenesis, aggressiveness, and prognosis of ovarian carcinoma. Tumour Biol 2013. [Google Scholar] [CrossRef]
  25. Chen, Q.; Watson, J.T.; Marengo, S.R.; Decker, K.S.; Coleman, I.; Nelson, P.S.; Sikes, R.A. Gene expression in the LNCaP human prostate cancer progression model: Progression associated expression in vitro corresponds to expression changes associated with prostate cancer progression in vivo. Cancer Lett. 2006, 244, 274–288. [Google Scholar]
  26. Wang, Y.; Shao, C.; Shi, C.H.; Zhang, L.; Yue, H.H.; Wang, P.F.; Yang, B.; Zhang, Y.T.; Liu, F.; Qin, W.J.; et al. Change of the cell cycle after flutamide treatment in prostate cancer cells and its molecular mechanism. Asian J. Androl 2005, 7, 375–380. [Google Scholar]
  27. Zheng, H.; Takahashi, H.; Murai, Y.; Cui, Z.; Nomoto, K.; Niwa, H.; Tsuneyama, K.; Takano, Y. Expressions of MMP-2, MMP-9 and VEGF are closely linked to growth, invasion, metastasis and angiogenesis of gastric carcinoma. Anticancer Res 2006, 26, 3579–3583. [Google Scholar]
  28. Ghayad, S.E.; Cohen, P.A. Inhibitors of the PI3K/Akt/mTOR pathway: New hope for breast cancer patients. Recent Pat. Anticancer Drug Discov 2010, 5, 29–57. [Google Scholar]
  29. Kunze, D.; Kraemer, K.; Erdmann, K.; Froehner, M.; Wirth, M.P.; Fuessel, S. Simultaneous siRNA- mediated knockdown of antiapoptotic BCL2, Bcl-xL, XIAP and survivin in bladder cancer cells. Int. J. Oncol. 2012, 41, 1271–1277. [Google Scholar]

