Article

Linking Phytochemical Diversity to Aflatoxin Suppression: LC-MS/MS Metabolomics of Trichilia dregeana Bark Extracts

by
Martha Cebile Jobe
1,
Babra Moyo
2,
Ntakadzeni Edwin Madala
3 and
Mulunda Mwanza
1,4,*
1
Food Security and Safety Niche Area, Faculty of Natural and Agricultural Sciences, North-West University, Mahikeng Campus, Mmabatho 2735, South Africa
2
Department of Food Science and Technology, University of Venda, University Rd., Thohoyandou 0950, South Africa
3
Center of Excellence in Mass Spectrometry for Southern Africa (CEMMSA), University of Venda, University Rd., Thohoyandou 0950, South Africa
4
Department of Animal Health, North-West University, Mahikeng Campus, Mmabatho 2735, South Africa
*
Author to whom correspondence should be addressed.
Molecules 2026, 31(3), 578; https://doi.org/10.3390/molecules31030578
Submission received: 12 December 2025 / Revised: 29 January 2026 / Accepted: 5 February 2026 / Published: 6 February 2026

Abstract

Trichilia dregeana has a rich phytochemical diversity and biological activity; however, information on its metabolomic profile and antimycotoxigenic potential is limited. This study investigated different extracts of T. dregeana bark obtained with various solvents (water, ethanol, ethyl acetate, and methanol), assessing their chemical composition using LC-MS and their inhibitory activity against the aflatoxin produced by Aspergillus fungi. LC-MS analysis identified metabolites belonging to several secondary metabolite classes, including flavonoids, phenolic acids, lignan glycosides, cardiac glycosides, coumarins, cinnamic acids, and limonoids. Solvent polarity strongly influenced metabolite distribution, with water and methanol enriching polar antioxidant compounds, while ethanol and ethyl acetate extracted semipolar antimicrobial constituents. The antimycotoxigenic efficacy of T. dregeana bark extracts was evaluated against Aspergillus flavus in maize, rice, and flour matrices. Among the tested extracts, only the methanolic extract exhibited a statistically significant reduction in aflatoxin levels (µg/kg), while the water, ethanol, and ethyl acetate extracts showed no significant inhibition. Fungal inoculation significantly increased aflatoxin levels, with maize showing the highest contamination (673.32 µg/kg). At 50 µg/mL extract, aflatoxin concentrations were reduced to 230.39 µg/kg maize, 129.93 µg/kg rice, and 143.89 µg/kg flour, with efficacy comparable to or exceeding the commercial fungicide tenazole. Associations between solvent-dependent metabolite class distribution and aflatoxin suppression were observed; however, bioactivity was demonstrated exclusively at the crude extract level. These findings suggest that methanolic extracts of T. dregeana bark may represent a promising natural alternative to antimycotoxin agents, warranting further fractionation and mechanistic validation.

1. Introduction

The safety and quality of animal feed are critical to global livestock productivity, food security, and public health. Contamination by pathogenic bacteria such as Escherichia coli, Salmonella enterica, and Staphylococcus aureus, along with toxigenic fungi such as Aspergillus and Fusarium, remains a major challenge [1,2]. Such microorganisms not only reduce feed nutritive value but also produce harmful mycotoxins, including aflatoxins and fumonisins, which pose risks to both animal and human health [3]. Concurrently, fungal spoilage and mycotoxin contamination impose substantial economic losses and food-chain risks. Aspergillus species, particularly aflatoxin-producing strains such as A. flavus, are among the most prevalent fungal contaminants of animal feed and pose a significant risk to feed safety due to their ability to produce aflatoxins [4,5].
Antibiotics and synthetic preservatives have been used as feed additives to control microbial damage and improve growth performance. However, the emergence of antimicrobial resistance and increased consumer demand for antibiotic-free livestock production necessitate the development of sustainable alternative agents [6]. Among the promising alternatives are phytogenic feed additives derived from medicinal plants, which are rich in bioactive compounds such as terpenoids, phenolics, alkaloids, and saponins [7,8]. Phytochemicals, especially terpenoids, phenolics, and alkaloids, offer multi-target antimicrobial actions and can be formulated as extracts, essential oils, or standardized phytogenic feed additives [9]. The Meliaceae family (Azadirachta indica, Trichilia spp.) is known for limonoids that function as insect antifeedants and display antibacterial and antifungal activities [10].
Trichilia dregeana is indigenous to southern and eastern Africa and is commonly known as the forest mahogany. Ethnobotanical records indicate its use in traditional medicine for treating infections, inflammation, and gastrointestinal disorders. Traditional uses include remedies for infectious and inflammatory conditions, suggesting bioactivity aligned with antimicrobial indications. In this study, we focus on its suitability as an antimicrobial agent in cereal grains. Preliminary studies have shown that extracts of T. dregeana exhibit antibacterial activity against E. coli and S. aureus [11]. Although direct antifungal data remain limited, analogous limonoids from related Trichilia species have demonstrated inhibitory effects against phytopathogenic fungi [12,13]. Given the urgent need for natural alternatives to antibiotics in feed, and the phytochemical richness of T. dregeana, systematic evaluation of this plant as a potential antimicrobial feed additive is required. Therefore, this study aimed to investigate the efficiency of different solvents (water, ethanol, ethyl acetate, and methanol) in extracting essential compounds (metabolites) from T. dregeana bark. Furthermore, the antimicrobial potential in cereal-based feed safety management was also investigated. Although several plant-derived extracts have demonstrated antifungal or antimycotoxigenic potential, the distinction between fungal growth inhibition and specific suppression of aflatoxin biosynthesis remains insufficiently explored. Moreover, limited information is available on how solvent-dependent extraction influences the phytochemical composition of T. dregeana bark and its antimycotoxigenic activity. This study hypothesizes that solvent-dependent extraction of phytochemicals from T. dregeana bark results in reduced antimycotoxigenic activity against A. flavus, which is attributed to antifungal growth inhibition that focuses on reducing the overall growth of fungi, thus suppressing aflatoxin biosynthesis.

2. Results

2.1. Metabolomic Profiling of T. dregeana Bark Extracts

Untargeted LC-MS/MS analysis identified a substantial number of metabolites across the water, ethanol, ethyl acetate, and methanol extracts of T. dregeana bark (Table 1). All compound identifications are reported as putative annotations (MSI level 2), based on accurate mass measurements, MS/MS fragmentation patterns, and database matching; no authentic reference standards were employed. The chemical classes comprised flavonoids, phenolics, lignan glycosides, cardiac glycoside, coumarin, cinnamic acids and limonoids. As previously reported in plant metabolomics, the distribution of metabolites varied significantly among solvents, indicating considerable solvent polarity selectivity [14,15] and, as such, it is imperative that metabolomic studies are conducted using different solvents for comprehensive coverage. Catechin, caffeic acid, glucosyringic acid, hydroquinone-o-glycopyranoside, quinic acid derivatives, and lignan glycosides were among the highly polar phenolic chemicals that predominated in the aqueous extract, reflecting the strong affinity of water for hydrophilic phytochemicals. These chemicals are known to be extremely soluble in water due to glycosylation and hydroxylation patterns [16].
Ethanol yielded the widest chemical diversity of both polar and moderately nonpolar compounds. These included flavonoid glycosides including kaempferol-3-O-rutinoside, quercetin-3-O-rutinoside, cardiac glycoside (neriifolin), and quinone. Ethyl acetate extracts were rich in semipolar flavonoids, and diarylheptanoids such as gingerol, reflecting the affinity of semipolar solvents for these compounds. This fraction showed the highest abundance in ethyl acetate, which preferentially extracts mid-range hydrophobic metabolites [17]. Methanol extracted a broad range of medium-polarity phytochemicals, including phenolic glycosides, flavonoids, coumarins, and limonoids, reflecting its effectiveness in solubilizing both polar and moderately hydrophobic metabolites. This shows methanol’s efficiency in extracting both polar and moderately nonpolar bioactive constituents. Methanol is a widely used solvent for phenolic extraction due to its strong hydrogen-bonding capacity [18] which explains its efficiency in recovering complex bioactive metabolites. Although methanol, ethanol, and ethyl acetate exhibit overlapping polarity ranges, their differential hydrogen-bonding capacity and protic/aprotic characteristics resulted in partial selectivity toward distinct metabolite subclasses. Methanol extracted the broadest range of polar and mid-polar secondary metabolites, including flavonoid glycosides and phenolic acids, whereas ethyl acetate favored less polar aglycones.

2.2. Distribution of Antifungal, Antioxidant, and Antimicrobial Metabolites

Table 2 lists metabolites with previously reported antifungal, antioxidant, and/or antibacterial activity in other systems. These molecules were distributed across all four solvent extracts, although the greatest antifungal and antioxidant profiles were seen in the water and methanol extracts, while antimicrobial metabolites were most concentrated in the water, ethanol, and methanol extracts. Antifungal and antioxidant metabolites included flavonoid-3-O-glycosides (methanol), catechins (all solvents), and hydroquinone (water, ethanol and methanol). Antimicrobial metabolites included catechins (all solvents), gingerols (all solvents), limonoids (methanol), and quinone/hydroquinone (water, ethanol and methanol). Methanol extract contained flavonoids, which have been shown to have antibacterial properties that disrupt membranes and cycle redox [19]. Limonoids have strong antifungal and antibacterial characteristics, including activity against Aspergillus species [20,21].

2.3. Inhibition of Aflatoxin by T. dregeana in Cereal Grains

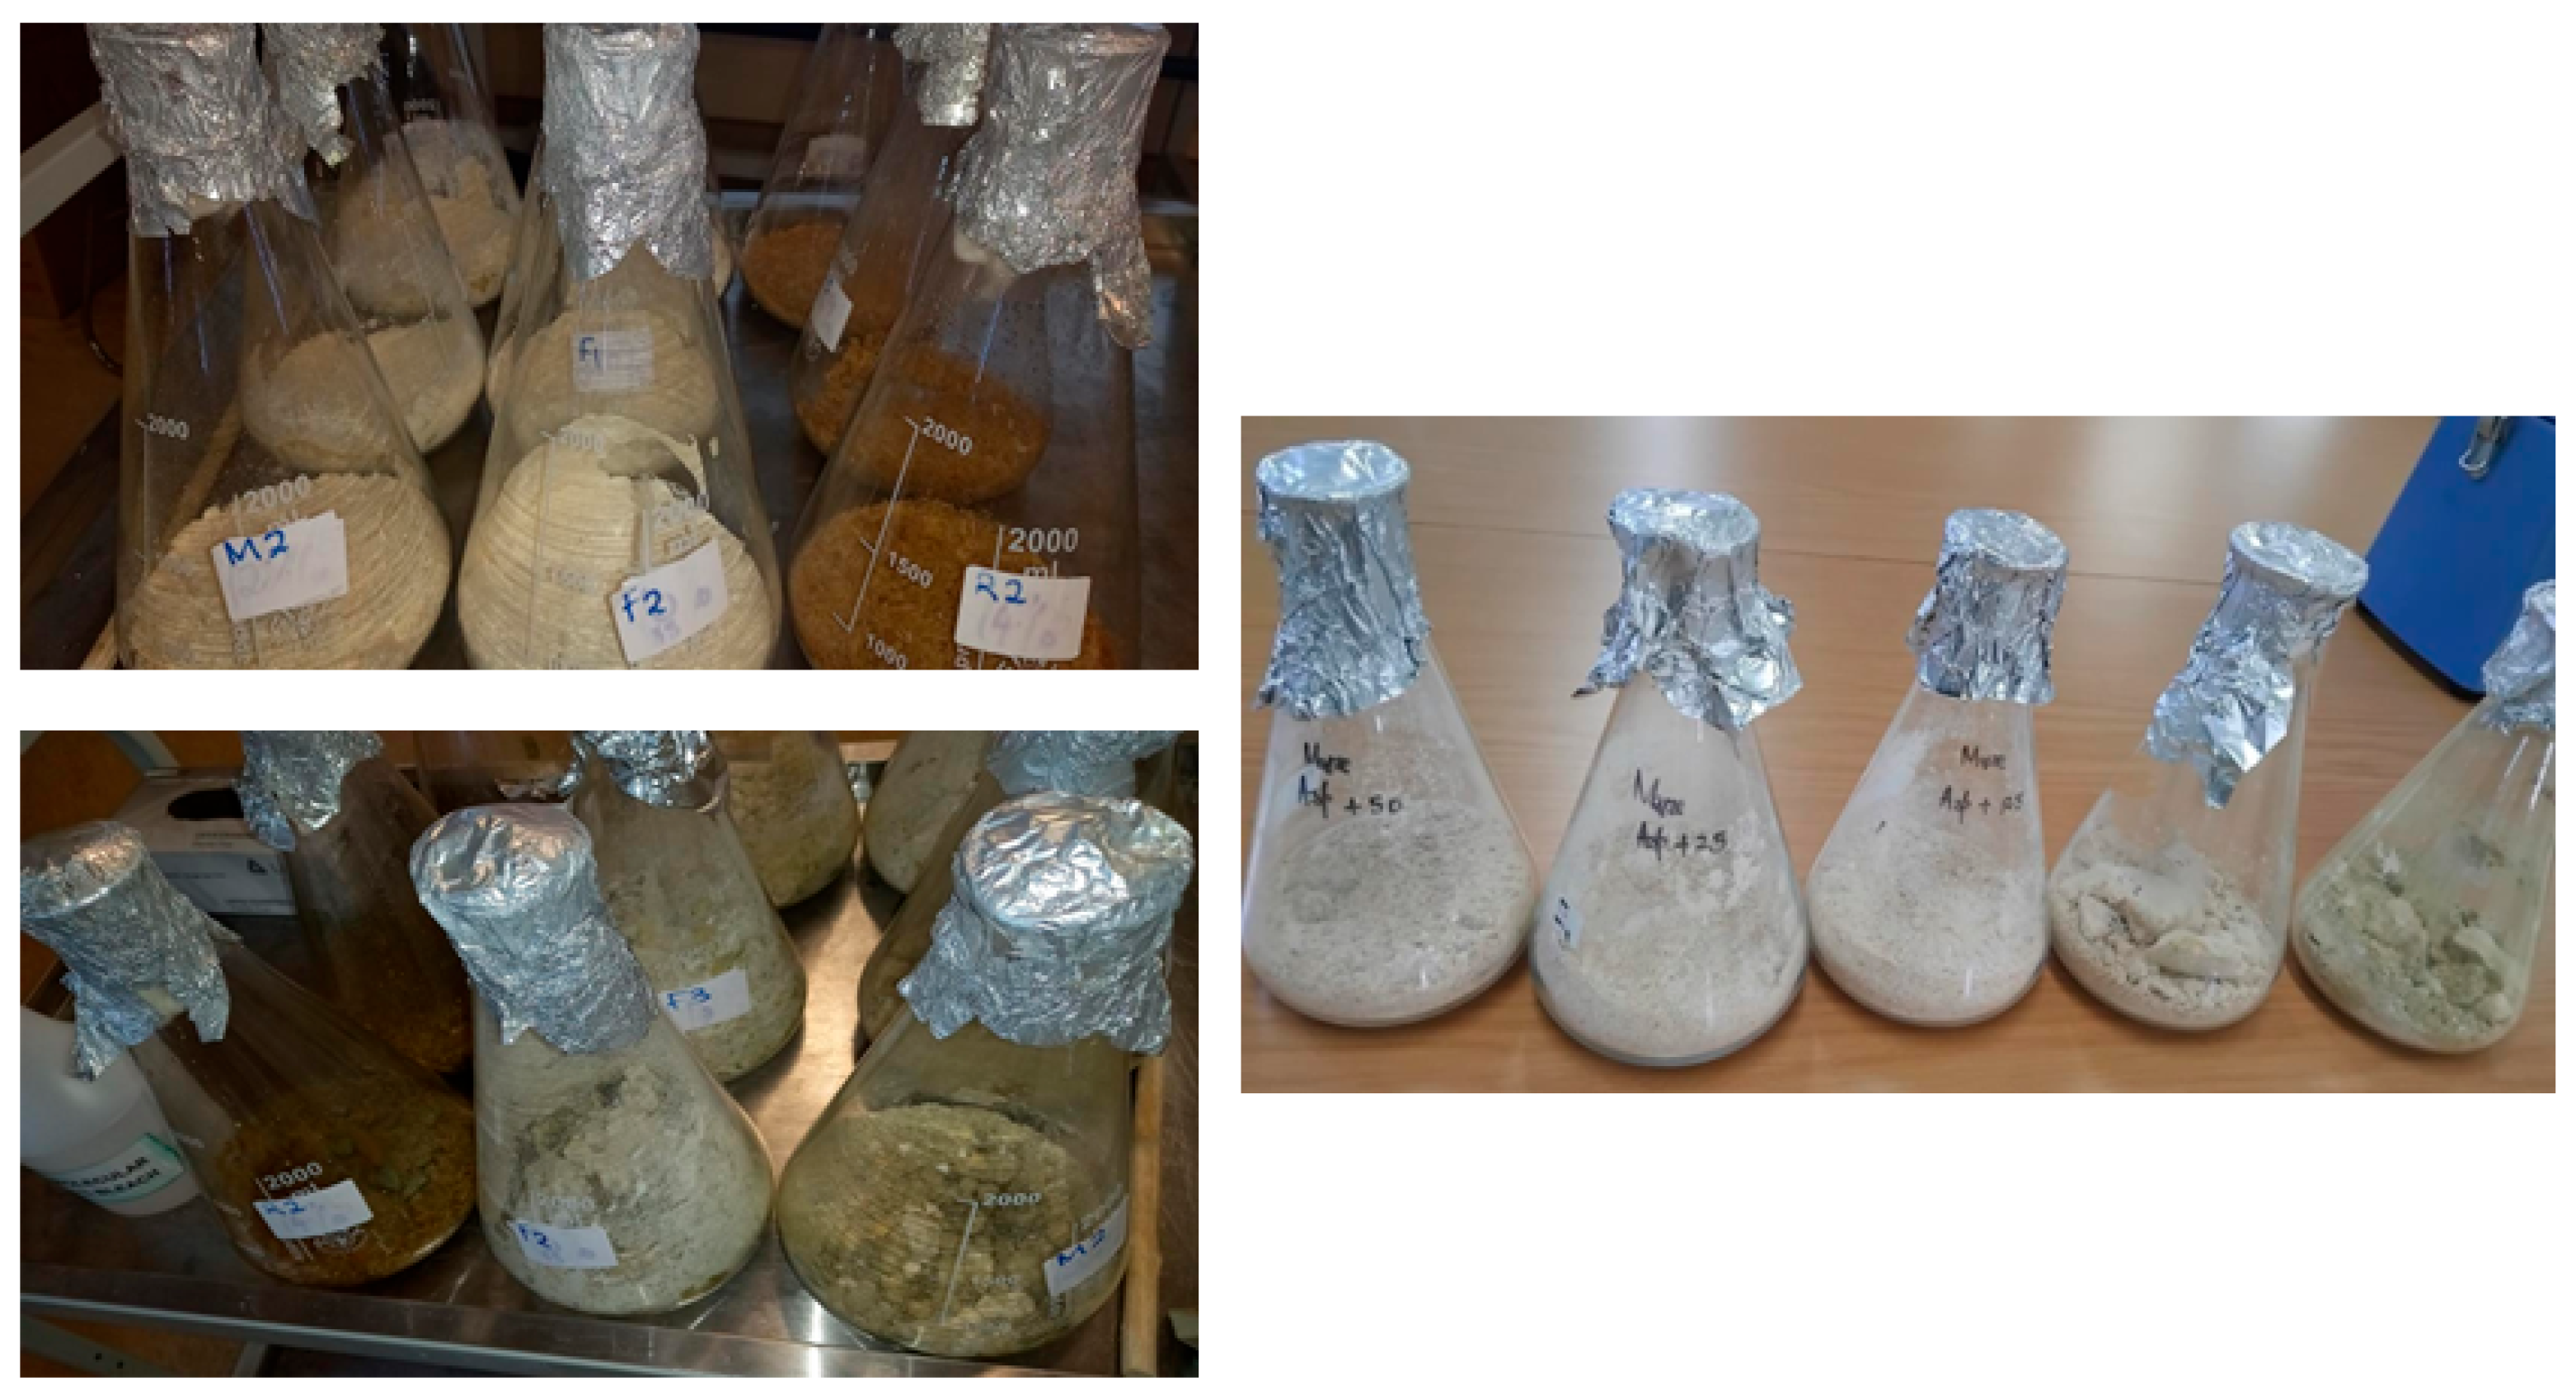
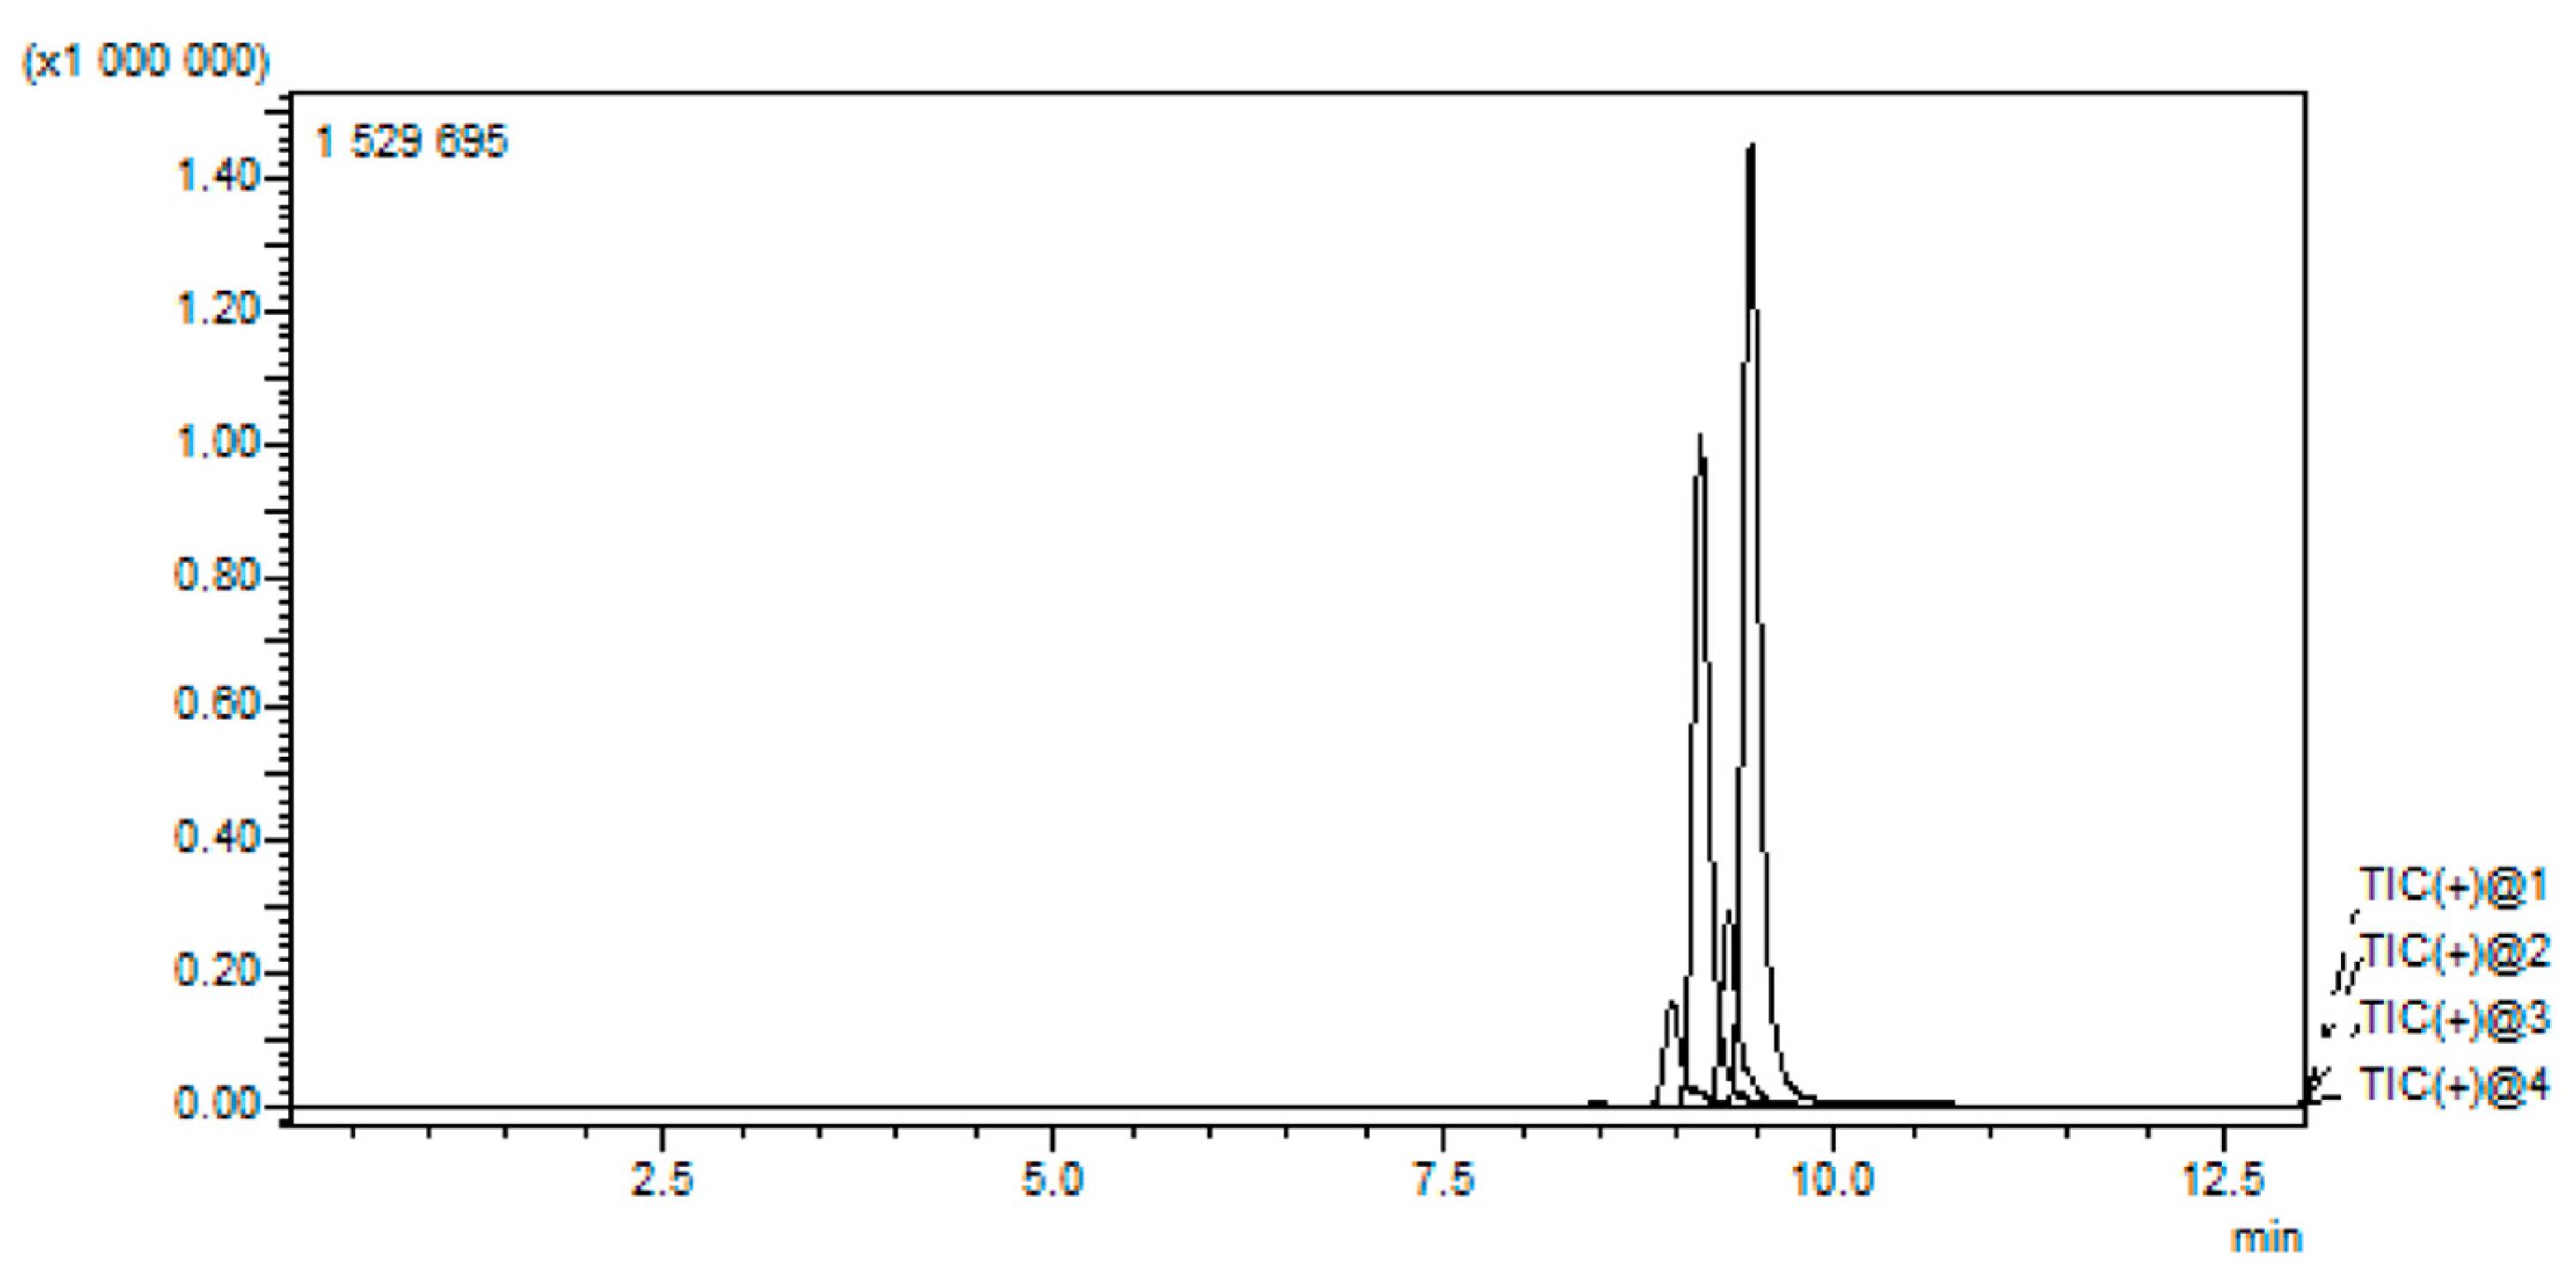
Figure 1 and Figure 2 below show the chromatograph output of the aflatoxin B1, B2, G1, and G2 standards and the production of aflatoxin in different feed matrices before inoculation and after 21 days of production, respectively.
Aflatoxin concentrations differed significantly among treatments and feed matrices (p < 0.05), Table 3. Significant reductions in aflatoxin levels (µg/kg) were observed only for the methanolic extract, while the water, ethanol, and ethyl acetate extracts did not differ significantly from the untreated control. A supplementary table has been added to present aflatoxin data for all extracts, including those showing no inhibitory effect. The A. flavus-inoculated group exhibited higher levels of aflatoxin in all feed matrices; the most contaminated matrix was maize (673.32 µg/kg), followed by rice (448.08 µg/kg) and flour (205.70 µg/kg). This data demonstrated active aflatoxin production after fungal inoculation since its levels were substantially greater than in the uninoculated control. The aflatoxin level in the control flour sample was 102.15 µg/kg. This value remained high after A. flavus inoculation (205.70 µg/kg), indicating persistent contamination. Tenazole reduced aflatoxin to 136.66 µg/kg, while the 50 µg/mL extract of T. dregeana bark reduced its level to 143.89 µg/kg. Lower concentrations of the extract (12.5 and 25 µg/mL) also showed inhibitory effects, reducing the levels to 159.32 µg/kg and 156.88 µg/kg, respectively. However, control maize had minimal aflatoxin contamination (34.38 µg/kg). Inoculation with A. flavus dramatically increased this to 673.32 µg/kg. Treatment with 50 µg/mL T. dregeana extract significantly reduced the aflatoxin level to 230.39 µg/kg, lower than Tenazole (445.51 µg/kg). The 25 µg/mL extract yielded 400.02 µg/kg, and the 12.5 µg/mL extract achieved 479.70 µg/kg, all lower than the A. flavus-only group. Rice samples inoculated with A. flavus showed a sharp rise in aflatoxin concentration from 84.90 µg/kg in the control to 448.08 µg/kg. Tenazole reduced this to 107.13 µg/kg. The 50 µg/mL T. dregeana extract similarly reduced the level to 129.93 µg/kg. Lower concentrations (25 µg/mL and 12.5 µg/mL) also reduced aflatoxin levels but remained significantly higher at 220.68 µg/kg and 344.94 µg/kg, respectively.

3. Discussion

Solvent-polarity theory, which states that hydrophilic solvents enrich phenolic compounds and glycosides while organic solvents extract terpenoids, lipids, and sterols, is consistent with the different extraction patterns observed across water, ethanol, ethyl acetate, and methanol [14]. The LC-MS profiling of T. dregeana extracts demonstrated that solvent polarity critically influences the qualitative composition of phytochemicals, reflecting both the chemical nature of the plant metabolites and their solubility characteristics. Polar solvents such as water and methanol preferentially extracted highly polar phenolic acids and glycosylated flavonoids, consistent with the literature showing that the solubility of phenolic compounds increases with solvent polarity due to hydrogen bonding and dipole interactions with hydroxyl groups on these molecules. Water extracts in this study were enriched in catechin, glucosyringic acid, and caffeic acid, aligning with reports that polar solvents often yield higher levels of glycosylated and hydroxylated phenolics compared to less polar extracts. Similarly, methanol extracts exhibited a broad spectrum of compounds, including flavonoids, phenolic glycosides, and coumarins, supporting prior findings that methanol’s intermediate polarity efficiently dissolves both polar and moderately nonpolar plant metabolites.
The polar solvents extract high quantities of flavonoids, catechins, phenolic acids, and glycosides, which account for their significant antioxidant properties. Phenolic chemicals neutralize free radicals through hydrogen donation and metal chelation, helping to reduce oxidative stress [35]. Antimicrobial metabolites were detected in both hydrophilic and lipophilic fractions, indicating various mechanisms of action. According to Álvarez-Martínez [36], phenolic antimicrobials such as catechins work by disrupting cell walls, inhibiting enzymes, and denaturing proteins. The widespread presence of quinone/hydroquinone suggests that they may be key chemotaxonomic indicators of T. dregeana with broad antibacterial applications.
Flavonoids, limonoids, quinones, and catechins have been shown to suppress A. flavus growth and aflatoxin biosynthesis [37]. These compounds were found in the methanol extract used in the study. The current work is the first to evaluate the metabolomic content of T. dregeana bark extracts and their inhibitory effects on A. flavus growth and aflatoxin production across maize, rice, and flour matrices.
The suppression of aflatoxin in maize, rice, and flour reveals that T. dregeana bark extract works in a variety of nutritional compositions. The methanol extract exhibited the strongest inhibition, most likely due to its balanced profiles of phenolic antioxidants flavonoid glycosides, phenolic acids and membrane-active metabolites (limonoids, quinone lipids) with known antifungal properties. The overall pattern indicates that aflatoxin reduction levels following treatment with the methanolic extract may be described by synergistic interactions between metabolite classes rather than a single dominant molecule and may be associated with the presence of phytochemical classes previously reported to exhibit antifungal or antimycotoxigenic activity in other systems. This is consistent with the emerging literature demonstrating that plant extracts rich in polyphenols may suppress aflatoxin production through multiple putative mechanisms described in the literature [21,38]. Coumarins such as scopoletin, detected in methanol extracts, have been reported to inhibit fungal sporulation and secondary metabolite production. The broad-spectrum bioactivity found across food matrices suggests that T. dregeana bark extracts could be used as natural preservatives to prevent A. flavus contamination and aflatoxin production in stored grains and animal feeds. The discovery of flavonoid glycosides and limonoids compounds previously used in plant-derived antifungal formulations confirms the viability of converting these extracts into marketable antimycotoxin medicines.

4. Materials and Methods

4.1. Plant Material and Extraction

The T. dregeana bark used in this study was harvested in KwaZulu-Natal and verified by the Botany Department of North-West University, and a voucher specimen was deposited at S.D. Phalatse herbarium (UNWH) with voucher number Jobe-1 (2026) for future reference. The bark of T. dregeana was washed under tap water and rinsed with distilled water before being chopped and air-dried at room temperature to avoid volatile compounds degrading. After drying, it was ground into powder, and 5 g was extracted with 100 mL [39] of either methanol, ethanol, ethyl acetate, or water. The extract was kept for 24 h in an orbital shaker at 150 rpm at room temperature and filtered through 150 mm Whatman filter paper (Lasec® International (Pty) Ltd., Cape Town, South Africa). Two milliliters of the filtrate was filtered through a 0.22 µm syringe filter (Labotec (Pty) Ltd., Johannesburg, South Africa) into amber vials for metabolomic analysis.

4.1.1. Chromatographic Separation and Mass Spectral Analysis

A liquid chromatography–quadrupole time-of-flight tandem mass spectrometer (LC-MS-9030 q-TOF, Shimadzu Corporation, Kyoto, Japan) was used to evaluate the extracts from the T. dregeana sample. An Evosphere (Fortis Technologies Ltd., Cheshire, UK) C18 column (100 × 2.1 mm, 1.7 µm) kept at 55 °C was used to separate secondary metabolites. Using binary mobile phase gradient elution at a flow rate of 0.3 mL/min−1, the bioactive compounds in the T. dregeana extracts were separated after a volume of 5 µL was injected into the device. Formic acid (0.1%: v/v) in ultra-pure water and methanol were used as mobile phases A and B, respectively. The mobile phase composition was maintained at 5% for mobile phase B from 0 to 3 min and then kept at that level for 8 min. After 8 min, B’s proportion increased to 40%, and between 23 and 25 min, it reached 95%. After 27 min, the gradient was changed to 5% mobile phase B, and it remained at this composition until 30 min, re-equilibrating the column for the next run. Mass spectral analysis was conducted using a q-TOF high-resolution mass spectrometer with an electrospray interface (ESI) functioning in negative ionization mode.
Nebulization and dry gas flow of 3 L min−1, heat block temperature of 400 °C, DL temperature of 280 °C, detector voltage of 1.8 kV, interface voltage of 4.0 kV, interface temperature of 300 °C, and light tube temperature of 42 °C were the parameters of the mass spectrometer. High mass accuracy was monitored using sodium iodide as a calibration solution. MS1 and MS2 were produced simultaneously via data-dependent acquisition for every ion with an intensity threshold above 3000 and m/z values between 100 and 1000 Da. Argon was used as a collision gas to generate MS2 data, with a collision energy of 30 eV.

4.1.2. Molecular Identification

The Shimadzu LCMS-9030 q-TOF’s raw data was converted to mzML format and processed with Sirius (v6.1) to predict chemical formulas and annotate compounds. The detected molecules were compared against the KNApSAcK natural products database (https://www.knapsackfamily.com/knapsack_core/top.php; accessed on 26 January 2026), and their accurate masses, retention times, fragment ions, and compound names were recorded.

4.2. Feed Inoculation and Treatment

The Aspergillus strain (MG659624) was revived on PDA (Merck KGaA, Darmstadt, Germany) media that was prepared following the manufacturer’s protocol. Briefly, 200 g of each feed sample was weighed into a flask and autoclaved at 121 °C to remove any debris, and the feed was placed in a 100 °C oven for 24 h to achieve a 0% moisture content [40]. Treatments were assigned to cereal matrices using a randomized complete design, with extract treatments and controls randomly allocated to experimental units using a random number generator prior to incubation. This procedure was implemented to minimize allocation bias and ensure comparability among treatment groups. The experiment comprised 3 treatments (control, A. flavus-only, and A. flavus + treatments), 3 matrices, 3 extract concentrations 12.5, 25, and 50 mg/mL, and tenazole, each in triplicate, giving a total of 24 experimental units. The fungal spore suspension was used to inoculate the feed, where 2 mL of 2 × 10⁻² was added to the feed, and respective treatments of either T. dregeana extract or tenazole and distilled water were used to achieve a moisture content of 15%. The 15% moisture levels of the cereal matrices were adjusted according to the established feed inoculation protocols to provide optimal conditions for fungal growth and aflatoxin production [41]. The organic extracts were dried after extraction and redissolved in water before use to avoid the solvent being an antimicrobial variable. The feed flasks were incubated at 30 °C to allow fungal growth and mycotoxin production, while constantly monitoring and mixing on a weekly basis for 21 days. Aflatoxin inhibition experiments were independently repeated three times, with each experimental run conducted on separate occasions using freshly prepared fungal inoculum, feed matrix, and extract solutions. Within each independent experiment, all treatments were performed in triplicate. On day 21, the samples were placed in a Ziplock bag and stored at 20 °C freezer for further analysis of aflatoxin quantification (HPLC and LC-MS).

4.3. Quantification of Aflatoxins Using LC-QqQ-MS

4.3.1. Sample Preparation

A total of 50 g of the respective homogenized feed sample was used for aflatoxin detection while blinding the treatment identity to minimize bias and ensure objective measurement of mycotoxin level. The aflatoxin extraction was performed using the Easi Extract® aflatoxin immunoaffinity columns (®Biopharm Rhone Ltd., Glasgow, UK) according to the manufacturer’s protocol. Briefly, 100 mL of 80% methanol was added to 50 g of the sample and 5 g of sodium chloride and allowed to mix thoroughly for 20 min in a blender at high speed. The sample was filtered through a Whatman no. 4 filter paper into clean beakers. In total, 2 mL of the filtered extract was diluted with 14 mL phosphate-buffered saline (PBS) solution, then allowed to pass through the column at a flow rate of 1 drop/second to enable capture of the aflatoxins by the antibody. The column was further washed by passing through 20 mL PBS to remove residual liquid. Then, 2 mL of 100% methanol was used to elute the toxins from the column, and samples were further filtered using micro-pore syringe filters (0.22 μm) into an amber vial.
Aflatoxin detection and quantification were performed using HPLC (Shimadzu FCV-20H2) (Shimadzu Corporation, Kyoto, Japan) with operation conditions as given in the KOBRA® cell (Shimadzu Corporation, Kyoto, Japan) instruction manual. In total, 10 µL was injected into the HPLC system, and calibration curves for each aflatoxin were constructed using total aflatoxin standard (B1, B2, G1, and G2) (Trilogy, Washington, DC, USA) solutions. The aflatoxin concentration of the samples was calculated by measuring the area of the peak and then interpolating from the standard curve.

4.3.2. LC-MS/MS Analysis

Briefly, an 8050 LC-MS/MS triple quadrupole System (Shimadzu Corporation, Kyoto, Japan) equipped with a Turbo Ion Spray electrospray ionization (ESI) source and a 1100 Series HPLC System was used. Chromatographic separation of the conjugates was performed using a Shimadzu C18 column (150 × 2.1 mm, 5 μm) (Shimadzu Corporation, Kyoto, Japan) with mobile phases A (10 mM ammonium acetate in water) and B (2% acetic acid in methanol). The flow rate was 0.25 mL/min with an injection volume of 10 µL for all standards and samples. The ESI-MS/MS source temperature was 550 °C, in multiple reaction monitoring (MRM) mode, in both positive and negative polarities, in two separate chromatographic runs per sample by scanning two fragmentation reactions per analyte. Further MS parameters were as follows: curtain gas 10 psi (69 kPa of max. 99.5% nitrogen); ion source gas 1 (sheath gas) 50 psi (345 kPa of nitrogen); ion source gas 2 (drying gas) 50 psi (345 kPa of nitrogen); ion spray voltage −4000 V and +4000 V, respectively and collision-activated dissociation gas (nitrogen) high. For the aflatoxin, the running conditions were as shown in Table 4.

4.4. Statistical Analysis

Quantitative data were analyzed using one-way ANOVA in SAS 9.4, for each sample type (rice, maize, and flour) and followed by Tukey’s HSD post hoc test. The results are presented as the mean ± standard deviation.

5. Conclusions

The integrated metabolomic and antifungal investigation shows that T. dregeana bark extracts include a diverse range of phenolics, terpenoids, limonoids, saponins, and quinone lipids that work together to suppress A. flavus growth and aflatoxin production. The substantial association between metabolite composition and bioactivity across solvents emphasizes the importance of specific chemical classes in inhibiting aflatoxin production. These findings support the continued development of T. dregeana extracts as natural antifungal agents for food and feed safety. However, the findings are limited to crude-extract-level observations, with significant aflatoxin inhibition observed only for the methanolic extract under controlled experimental conditions. Limitations include the absence of fungal biomass measurements, mechanistic validation, toxicity assessment, and regulatory evaluation. Therefore, to advance toward practical application, future studies are required to isolate and characterize the active compounds through fractionation. Comprehensive toxicity testing is essential to ensure safety for animal and human consumption, and any potential use must undergo rigorous regulatory assessment to meet feed additive standards. Collectively, these steps are critical to translating the observed bioactivity into safe, effective, and commercially viable interventions for feed and food safety.

Author Contributions

Conceptualization, M.C.J. and M.M.; methodology, M.C.J.; software, B.M. and N.E.M.; validation, B.M., N.E.M. and M.M.; formal analysis, M.C.J. and B.M.; investigation, M.C.J.; resources, B.M., N.E.M. and M.M.; data curation, M.C.J.; writing—original draft preparation, M.C.J.; writing—review and editing, B.M., N.E.M. and M.M.; supervision, M.M.; project administration, M.M.; funding acquisition, M.M. All authors have read and agreed to the published version of the manuscript.

Funding

This research received no external funding.

Institutional Review Board Statement

Not applicable.

Informed Consent Statement

Not applicable.

Data Availability Statement

The original contributions presented in this study are included in the article. Further inquiries can be directed to the corresponding author.

Conflicts of Interest

The authors declare no conflicts of interest.

References

  1. Rodrigues, I.; Naehrer, K. A three-year survey on the worldwide occurrence of mycotoxins in feedstuffs and feed. Toxins 2012, 4, 663–675. [Google Scholar] [CrossRef] [PubMed]
  2. Kumar, A. Phytoconstituents as antifungals. In Phytoconstituents and Antifungals; Kumar, A., Ed.; Academic Press: Cambridge, MA, USA, 2022; pp. 35–51. [Google Scholar]
  3. Zain, M.E. Impact of mycotoxins on humans and animals. J. Saudi Chem. Soc. 2011, 15, 129–144. [Google Scholar] [CrossRef]
  4. Okechukwu, V.O.; Adelusi, O.A.; Kappo, A.P.; Njobeh, P.B.; Mamo, M.A. Aflatoxins: Occurrence, biosynthesis, mechanism of action and effects, conventional/emerging detection techniques. Food Chem. 2024, 436, 137775. [Google Scholar] [CrossRef]
  5. Ahmad, T.; Wang, S.; Liu, Y. Aspergillus flavus and Aflatoxins (3rd Edition). Toxins 2025, 17, 326. [Google Scholar] [CrossRef]
  6. Ahmed, S.K.; Hussein, S.; Qurbani, K.; Ibrahim, R.H.; Fareeq, A.; Mahmood, K.A.; Mohamed, M.G. Antimicrobial resistance: Impacts, challenges, and future prospects. J. Med. Surg. Public Health 2024, 2, 100081. [Google Scholar] [CrossRef]
  7. Yang, C.; Chowdhury, M.A.; Huo, Y.; Gong, J. Phytogenic compounds as alternatives to in-feed antibiotics: Potentials and challenges in application. Pathogens 2015, 4, 137–156. [Google Scholar] [CrossRef] [PubMed]
  8. Biswas, S.; Ahn, J.M.; Kim, I.H. Assessing the potential of phytogenic feed additives: A comprehensive review on their effectiveness as a potent dietary enhancement for nonruminant in swine and poultry. J. Anim. Physiol. Anim. Nutr. 2024, 108, 711–723. [Google Scholar] [CrossRef]
  9. Wang, J.; Deng, L.; Chen, M.; Che, Y.; Li, L.; Zhu, L.; Chen, G.; Feng, T. Phytogenic feed additives as natural antibiotic alternatives in animal health and production: A review of the literature of the last decade. Anim. Nutr. 2024, 17, 244–264. [Google Scholar] [CrossRef] [PubMed]
  10. Oyedeji-Amusa, M.O.; Sadgrove, N.J.; Van Wyk, B.E. The Ethnobotany and Chemistry of South African Meliaceae: A Review. Plants 2021, 10, 1796. [Google Scholar] [CrossRef]
  11. Mossie, T.; Kassa, T.; Urge, B. Evaluation of Antibacterial Activity of Trichilia dregeana Sond. (Meliaceae) Methanolic Extract Against Gram-Positive and Gram-Negative Bacteria. Vet. Med. Sci. 2025, 11, e70231. [Google Scholar] [CrossRef]
  12. Tuan, N.; Kuo, P.C.; Vu, H.; Hien, V.; Le Dang, Q.; Tran-Trung, H.; Li, Y.C.; Thanh, N.T.; Wu, T.; Thang, T. The Limonoids and Other Constituents from the Fruits of Melia azedarach and Their Biological Activity. Rec. Nat. Prod. 2022, 16, 307–315. [Google Scholar] [CrossRef]
  13. Mugabi, L.C.; Mukanganyama, S. Antimycobacterial and Antifungal Activities of Leaf Extracts from Trichilia emetica. Scientifica 2024, 2024, 8784390. [Google Scholar] [CrossRef]
  14. Dai, J.; Mumper, R.J. Plant phenolics: Extraction, analysis, and their antioxidant and anticancer properties. Molecules 2010, 15, 7313–7352. [Google Scholar] [CrossRef] [PubMed]
  15. Do, Q.D.; Angkawijaya, A.E.; Tran-Nguyen, P.L.; Huynh, L.H.; Soetaredjo, F.E.; Ismadji, S.; Ju, Y.H. Effect of extraction solvent on total phenol content, total flavonoid content, and antioxidant activity of Limnophila aromatica. J. Food Drug Anal. 2014, 22, 296–302. [Google Scholar] [CrossRef] [PubMed]
  16. Ignat, I.; Volf, I.; Popa, V.I. A critical review of methods for characterization of polyphenolic compounds in fruits and vegetables. Food Chem. 2011, 126, 1821–1835. [Google Scholar] [CrossRef] [PubMed]
  17. Narayanan, M.; Chanthini, A.; Devarajan, N.; Saravanan, M.; Sabour, A.; Alshiekheid, M.; Chi, N.T.L.; Brindhadevi, K. Antibacterial and antioxidant efficacy of ethyl acetate extract of Cymodocea serrulata and assess the major bioactive components in the extract using GC-MS analysis. Process Biochem. 2023, 124, 24–32. [Google Scholar] [CrossRef]
  18. Anokwuru, C.; Anyasor, G.; Olusola, A. Effect of Extraction Solvents on Phenolic, Flavonoid and Antioxidant activities of Three Nigerian Medicinal Plants. Nat. Sci. 2011, 9, 53–61. [Google Scholar]
  19. Goel, S.; Parihar, P.S.; Meshram, V. Plant-Derived Quinones as a Source of Antibacterial and Anticancer Agents. In Bioactive Natural Products in Drug Discovery; Singh, J., Meshram, V., Gupta, M., Eds.; Springer: Singapore, 2020; pp. 245–279. [Google Scholar]
  20. Roy, A.; Saraf, S. Limonoids: Overview of significant bioactive triterpenes distributed in plants kingdom. Biol. Pharm. Bull. 2006, 29, 191–201. [Google Scholar] [CrossRef]
  21. Tan, T.N.; Trung, H.T.; Le Dang, Q.; Thi, H.V.; Vu, H.D.; Ngoc, T.N.; Thi Do, H.T.; Nguyen, T.H.; Quang, D.N.; Tran Dinh, T. Characterization and Antifungal Activity of Limonoid Constituents Isolated from Meliaceae Plants Melia dubia, Aphanamixis polystachya, and Swietenia macrophylla against Plant Pathogenic Fungi In Vitro. J. Chem. 2021, 2021, 4153790. [Google Scholar] [CrossRef]
  22. Mariri, N.G.; Mongalo, N.I.; Makhafola, T.J. The in vitro cytotoxicity, genotoxicity, and LC-ToF-MS profiling of four South African plants with good antifungal activity. S. Afr. J. Bot. 2024, 174, 446–455. [Google Scholar] [CrossRef]
  23. Cushnie, T.T.; Lamb, A.J. Antimicrobial activity of flavonoids. Int. J. Antimicrob. Agents 2005, 26, 343–356. [Google Scholar] [CrossRef]
  24. Barbary, O.; El-Sohaimy, S.; El-Saadani, M.; Zeitoun, A.M.A. Antioxidant, antimicrobial and anti-HCV activities of lignan extracted from flaxseed. Res. J. Agric. Biol. Sci. 2010, 6, 247–256. [Google Scholar]
  25. Wu, H.B.; Liu, T.T.; Zhang, Z.X.; Wang, W.S.; Zhu, W.W.; Li, L.F.; Li, Y.R.; Chen, X. Leaves of Magnolia liliflora Desr. as a high-potential by-product: Lignans composition, antioxidant, anti-inflammatory, anti-phytopathogenic fungal and phytotoxic activities. Ind. Crops Prod. 2018, 125, 416–424. [Google Scholar] [CrossRef]
  26. Balasundram, N.; Sundram, K.; Samman, S. Phenolic compounds in plants and agri-industrial by-products: Antioxidant activity, occurrence, and potential uses. Food Chem. 2006, 99, 191–203. [Google Scholar] [CrossRef]
  27. Wang, M.; Jiang, N.; Wang, Y.; Jiang, D.; Feng, X.J. Characterization of phenolic compounds from early and late ripening sweet cherries and their antioxidant and antifungal activities. J. Agric. Food Chem. 2017, 65, 5413–5420. [Google Scholar] [CrossRef]
  28. Silva, B.; Souza, M.M.; Badiale-Furlong, E. Antioxidant and antifungal activity of phenolic compounds and their relation to aflatoxin B1 occurrence in soybeans (Glycine max L.). J. Sci. Food Agric. 2020, 100, 1256–1264. [Google Scholar] [CrossRef]
  29. Alkufeidy, R.M.; Ameer Altuwijri, L.; Aldosari, N.S.; Alsakabi, N.; Dawoud, T.M. Antimicrobial and synergistic properties of green tea catechins against microbial pathogens. J. King Saud Univ. Sci. 2024, 36, 103277. [Google Scholar] [CrossRef]
  30. El-Khateeb, A.Y.; Elsherbiny, E.A.; Tadros, L.K.; Ali, S.M.; Hamed, H.B. Phytochemical analysis and antifungal activity of fruit leaves extract on the mycelial growth of fungal plant pathogens. Plant Pathol. Microbiol. 2013, 4, 1000199. [Google Scholar]
  31. Bolton, J.L.; Trush, M.A.; Penning, T.M.; Dryhurst, G.; Monks, T.J. Role of Quinones in Toxicology. Chem. Res. Toxicol. 2000, 13, 135–160. [Google Scholar] [CrossRef] [PubMed]
  32. Sharma, S.; Yadav, A.J. Discovery, Gingerol Derivatives as 14α-demethylase Inhibitors: Design and Development of Natural, Safe Antifungals for Immune-compromised Patients. Lett. Drug Des. Discov. 2020, 17, 918–928. [Google Scholar] [CrossRef]
  33. Mthembu, S.X.H.; Dludla, P.V.; Ziqubu, K.; Nyambuya, T.M.; Kappo, A.P.; Madoroba, E.; Nyawo, T.A.; Nkambule, B.B.; Silvestri, S.; Muller, C.J.F.; et al. The Potential Role of Polyphenols in Modulating Mitochondrial Bioenergetics within the Skeletal Muscle: A Systematic Review of Preclinical Models. Molecules 2021, 26, 2791. [Google Scholar] [CrossRef]
  34. Tan, Q.G.; Luo, X.D. Meliaceous Limonoids: Chemistry and Biological Activities. Chem. Rev. 2011, 111, 7437–7522. [Google Scholar] [CrossRef]
  35. Heim, K.E.; Tagliaferro, A.R.; Bobilya, D.J. Flavonoid antioxidants: Chemistry, metabolism and structure-activity relationships. J. Nutr. Biochem. 2002, 13, 572–584. [Google Scholar] [CrossRef]
  36. Álvarez-Martínez, F.J.; Barrajón-Catalán, E.; Herranz-López, M.; Micol, V. Antibacterial plant compounds, extracts and essential oils: An updated review on their effects and putative mechanisms of action. Phytomedicine 2021, 90, 153626. [Google Scholar] [CrossRef]
  37. Tian, F.; Woo, S.Y.; Lee, S.Y.; Park, S.B.; Im, J.H.; Chun, H.S. Plant-based natural flavonoids show strong inhibition of aflatoxin production and related gene expressions correlated with chemical structure. Food Microbiol. 2023, 109, 104141. [Google Scholar] [CrossRef]
  38. Castano-Duque, L.; Lebar, M.D.; Mack, B.M.; Lohmar, J.M.; Carter-Wientjes, C. Investigating the Impact of Flavonoids on Aspergillus flavus: Insights into Cell Wall Damage and Biofilms. J. Fungi 2024, 10, 665. [Google Scholar] [CrossRef] [PubMed]
  39. Jobe, M.C.; Mwanza, M. Inhibitive effect of Urginea epigea methanolic extract and silver/zinc oxide nanoparticles on Aspergillus and aflatoxin production. PLoS ONE 2025, 20, e0320454. [Google Scholar] [CrossRef] [PubMed]
  40. Saha, N.; Goates, C.; Hernandez, S.; Jin, W.; Westover, T.; Klinger, J. Characterization of particle size and moisture content effects on mechanical and feeding behavior of milled corn (Zea mays L.) stover. Powder Technol. 2022, 405, 117535. [Google Scholar] [CrossRef]
  41. Hassane, A.; El-Shanawany, A.; Abo-Dahab, N.; Abdel-Hadi, A.; Abdul-Raouf, U.; Mwanza, M. Influence of Different Moisture Contents and Temperature on Growth and Production of Aflatoxin B1 by a Toxigenic Aspergillus flavus Isolate in Wheat Flour. J. Ecol. Health Environ. 2017, 5, 77–83. [Google Scholar] [CrossRef]
Figure 1. Chromatograms of target analytes (AFB1, AFB2, AFG1, and AFG2) obtained by MRM in ESI-positive ionization mode.
Molecules 31 00578 g001
Figure 2. Feed inoculated with A. flavus before and after aflatoxin production.
Molecules 31 00578 g002
Table 1. Chemical composition of T. dregeana bark extract in different extraction solvents, water, ethanol, ethyl acetate, and methanol using negative ionization.
Compound ClassCompound NameCompound FormulaRetention Time (min)Precursor Ion (m/z)Fragment IonsWaterEthanolEthyl AcetateMethanol
FlavonoidCatechinC15H14O65.86289.0714151, 123, 109xxxx
FlavonoidProcyanidin B2 C30H26O127.34577.1355289, 125 x
FlavonoidKaempferol-3-O-rutinosideC30H26O1311.72593.1308447, 285, 284 xxx
FlavonoidQuercetin-3-O-rutinosideC30H26O1410.95609.1258463, 301, 300 x x
FlavonoidQuercetin-3-O-xylosylglucosideC26H28O168.73595.1311301, 300 x
FlavonoidQuercetin-3-O-glucosideC21H20O129.25463.0888301, 300 x
DiarylheptanoidGingerolC17H26O415.32293.1754221, 220, 205, 192xxxx
Cardiac glycosideNeriifolinC30H46O821.76533.3119417, 399, 355, 331, 145 xxx
Lignan glycosideLyoniresinol glucopyranosideC28H38O138.51581.2245419, 404, 373, 233xx x
Phenolic glycosideHydroquinone-O-glucopyranosideC12H16O77.72271.0822139xx x
Phenolic acidGlucosyringic acidC15H20O108.64359.0985153, 121x x
Cinnamic acidCaffeic acidC9H8O46.59179.0348135x x
Chlorogenic acid3-coumaroylquinic acidC16H18O87.67337.0922119, 111x x
CoumarinScopoletinC12H16O78.30191.0347148, 120, 104xxxx
Limonoid12-O-deacetyltrichilin HC34H44O1318.98659.2780131 x
Table 2. Compounds with both antioxidant and antimicrobial properties across all extracts.
Compound ClassCompound NameBioactivity
(Extract Level)
WaterEthanolEthyl AcetateMethanolReferences
Flavonoid-3-O-glycosidesQuercetin-3-O-glycosideantioxidant, antifungal x[22,23]
Lignan glycosidesLyoniresinolantioxidant, antimicrobial, antifungalx x[24,25]
PhenolsChlorogenic acidantioxidant, antifungalx x[26,27,28]
FlavonoidCatechinsantioxidant, antimicrobial, antifungalxxxx[29]
Cinnamic acid Caffeic acidantioxidant, antifungal x [30]
Phenolic glycosidesQuinone & hydroquinoneantimicrobial, antifungalxx x[31]
Diarylheptanoid Gingerolsantioxidant, antimicrobial, antifungalx xx[32,33]
Limonoids12-O-deacetyltrichilin Hantimicrobial, antifungal x[20,34]
Table 3. Effect of T. dregeana methanol extract on aflatoxin production (in µg/kg) in different feed matrices (flour, maize, and rice) (mean ± SD, µg/kg aflatoxin; n = 3).
TreatmentFlour (µg/kg)Maize (µg/kg)Rice (µg/kg)
Control102.15 a ± 16.5534.38 e ± 0.7584.90 f ± 9.26
A. flavus205.70 b ± 25.49673.32 a ± 13.54448.08 a ± 2.06
Tenazole136.66 d ± 0.47445.51 c ± 4.92107.13 e ± 0.78
A. flavus + 12.5 µg/mL159.32 c ± 2.79479.20 b ± 2.63344.94 b ± 16.36
A. flavus + 25 µg/mL156.88 c ± 15.63400.02 c ± 0.41220.68 c ± 22.85
A. flavus + 50 µg/mL143.89 d ± 16.3230.39 d ± 0.15129.93 d ± 7.29
Groups with the same letter are not significantly different (Tukey HSD, p < 0.05).
Table 4. Retention times and mass precursor for aflatoxins.
Target CompoundsRetention Time (min)MRM Transition (m/z)
AFB19.464313.10 > 241.10
AFB29.332315.10 > 259.10
AFG18.684329.10 > 243.10
AFG28.971331.10 > 245.10
Disclaimer/Publisher’s Note: The statements, opinions and data contained in all publications are solely those of the individual author(s) and contributor(s) and not of MDPI and/or the editor(s). MDPI and/or the editor(s) disclaim responsibility for any injury to people or property resulting from any ideas, methods, instructions or products referred to in the content.