

Quantitative and Comparative Assessment of Recombinant Human β-Glucocerebrosidase Uptake Bioactivity Using a Stable hMMR-Expressing CHO Cell Model

Abstract
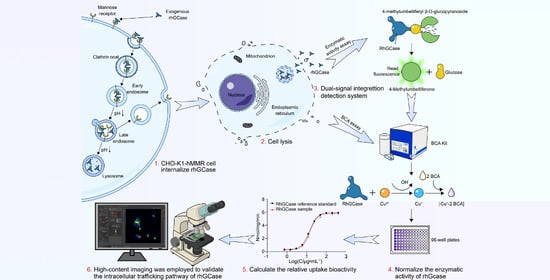
1. Introduction
2. Results
2.1. Identification of CHO-hMMR Cells
2.2. Optimization of the Cellular Uptake Bioassay Based on CHO-hMMR Cells
2.3. Methodological Validation
2.3.1. Specificity
2.3.2. Accuracy
2.3.3. Intermediate Precision
2.4. Linearity and Range
2.5. Reliability of the Assay Results
2.6. Stability of Cell Passage
2.7. Application of the Cellular Uptake Bioassay
2.8. Localization of rhGCase in CHO-hMMR Cells
2.9. Receptors Involved in rhGCase Uptake by CHO-hMMR Cells
3. Discussion
4. Materials and Methods
4.1. Cell Lines and Reagents
4.2. Flow Cytometry Analysis
4.3. Cellular Uptake Bioassay
4.4. Specificity
4.5. Accuracy, Precision, and Linearity
4.6. Assay Reliability
4.7. Stability Test of Cell Passage
4.8. Application of the Cell Uptake Bioassay
4.9. Localization of rhGCase in CHO-hMMR Cells
4.10. Inhibition Experiment
5. Conclusions
Author Contributions
Funding
Institutional Review Board Statement
Informed Consent Statement
Data Availability Statement
Conflicts of Interest
Abbreviations
| GD | Gaucher disease |
| LSD | Lysosomal storage disorder |
| ERT | Enzyme Replacement Therapy |
| GnT1 | Gene encoding N-acetylglucosaminyltransferase 1 |
| rhGCase | Recombinant human β-glucocerebrosidase |
| ELISA | Enzyme-linked immunosorbent assay |
| PMA | Phorbol myristate acetate |
| EC50 | Half-maximal effective concentration |
| Emax | Maximum effect |
| hMMR | Human macrophage mannose receptor |
| 4-MU-Glc | 4-methylumbelliferyl-β-D-glucopyranoside |
| 4-MU | 4-methylumbelliferone |
| BCA | Bicinchoninic acid |
| WT | Wild-type |
| OE | Overexpressed |
| IC | Isotype control |
| RP-HPLC | Reverse-phase high-performance liquid chromatography |
| GCV | Geometric variation coefficient |
| GSD | Geometric standard deviation |
| CIGSD | 95% upper confidence limit of GSD |
| CIGCV | 95% upper confidence limit of GCV |
| M6P | D-mannose-6-phosphate |
| PBS | Phosphate-buffered serum |
| FBS | Fetal bovine serum |
| S-shaped | Typical sigmoidal |
| IC50 | Half-maximal inhibitory concentration |
| SPR | Surface plasmon resonance |
| ER | Endoplasmic reticulum |
References
- Bennett, L.L.; Fellner, C. Pharmacotherapy of Gaucher disease: Current and future options. Pharm. Ther. 2018, 43, 274–309. [Google Scholar]
- Davidson, B.A.; Hassan, S.; Garcia, E.J.; Tayebi, N.; Sidransky, E. Exploring genetic modifiers of Gaucher disease: The next horizon. Hum. Mutat. 2018, 39, 1739–1751. [Google Scholar] [CrossRef] [PubMed]
- Gündner, A.L.; Duran-Pacheco, G.; Zimmermann, S.; Ruf, I.; Moors, T.; Baumann, K.; Jagasia, R.; van de Berg, W.D.J.; Kremer, T. Path mediation analysis reveals GBA impacts Lewy body disease status by increasing α-synuclein levels. Neurobiol. Dis. 2019, 121, 205–213. [Google Scholar] [CrossRef] [PubMed]
- Cullen, V.; Sardi, S.P.; Ng, J.; Xu, Y.H.; Sun, Y.; Tomlinson, J.J.; Kolodziej, P.; Kahn, I.; Saftig, P.; Woulfe, J.; et al. Acid β-glucosidase mutants linked to gaucher disease, parkinson disease, and lewy body dementia alter α-synuclein processing. Ann. Neurol. 2011, 69, 940–953. [Google Scholar] [CrossRef]
- Zimran, A.; Elstein, D. Management of Gaucher disease: Enzyme replacement therapy. Pediatr. Endocrinol. Rev. 2014, 12, 82–87. [Google Scholar] [PubMed]
- Shemesh, E.; Deroma, L.; Bembi, B.; Deegan, P.; Hollak, C.; Weinreb, N.J.; Cox, T.M. Enzyme replacement and substrate reduction therapy for Gaucher disease. Cochrane Database Syst. Rev. 2015, 2015, CD010324. [Google Scholar] [CrossRef]
- Ye, H.; Hill, J.; Gucinski, A.C.; Boyne, M.T.; Buhse, L.F. Direct site-specific glycoform identification and quantitative comparison of glycoprotein therapeutics: Imiglucerase and velaglucerase alfa. AAPS J. 2015, 17, 405–415. [Google Scholar] [CrossRef]
- The Subspecialty Group of Endocrinologic, Hereditary and Metabolic Diseases; The Society of Pediatrics, Chinese Medical Association; The Subspecialty Group of Hematology; The Society of Pediatrics, Chinese Medical Association; The Society of Medical Genetics, Chinese Medical Association; China Alliance for Rare Diseases. Expert consensus on diagnosis and treatment of pediatric Gaucher disease (2021). Chin. J. Pediatr. 2021, 59, 1025–1031. [Google Scholar] [CrossRef]
- Gupta, P.; Pastores, G. Spotlight on taliglucerase alfa in the treatment of pediatric patients with type 1 Gaucher disease. Pediatr. Health Med. Ther. 2017, 8, 73–81. [Google Scholar] [CrossRef]
- Tian, W.; Ye, Z.; Wang, S.; Schulz, M.A.; Van Coillie, J.; Sun, L.; Chen, Y.-H.; Narimatsu, Y.; Hansen, L.; Kristensen, C.; et al. The glycosylation design space for recombinant lysosomal replacement enzymes produced in CHO cells. Nat. Commun. 2019, 10, 1785. [Google Scholar] [CrossRef]
- Braulke, T.; Carette, J.E.; Palm, W. Lysosomal enzyme trafficking: From molecular mechanisms to human diseases. Trends Cell Biol. 2024, 34, 198–210. [Google Scholar] [CrossRef]
- Seo, J.; Oh, D.-B. Mannose-6-phosphate glycan for lysosomal targeting: Various applications from enzyme replacement therapy to lysosome-targeting chimeras. Anim. Cells Syst. 2022, 26, 84–91. [Google Scholar] [CrossRef]
- Yeeprae, W.; Kawakami, S.; Yamashita, F.; Hashida, M. Effect of mannose density on mannose receptor-mediated cellular uptake of mannosylated O/W emulsions by macrophages. J. Control. Release 2006, 114, 193–201. [Google Scholar] [CrossRef]
- Ben Bdira, F.; Artola, M.; Overkleeft, H.S.; Ubbink, M.; Aerts, J.M.F.G. Distinguishing the differences in β-glycosylceramidase folds, dynamics, and actions informs therapeutic uses. J. Lipid Res. 2018, 59, 2262–2276. [Google Scholar] [CrossRef]
- Macharoen, K.; Li, Q.; Márquez-Escobar, V.A.; Corbin, J.M.; Lebrilla, C.B.; Nandi, S.; McDonald, K.A. Effects of kifunensine on production and N-glycosylation modification of butyrylcholinesterase in a transgenic rice cell culture bioreactor. Int. J. Mol. Sci. 2020, 21, 6896. [Google Scholar] [CrossRef] [PubMed]
- Gunasekaran, N.D.; Jayasankaran, C.; Justin Margret, J.; Krishnamoorthy, M.; Srisailapathy, C.R.S. Evaluation of recurrent GNPTAB, GNPTG, and NAGPA variants associated with stuttering. Adv. Genet. 2021, 2, e10043. [Google Scholar] [CrossRef] [PubMed]
- Brumshtein, B.; Salinas, P.; Peterson, B.; Chan, V.; Silman, I.; Sussman, J.L.; Savickas, P.J.; Robinson, G.S.; Futerman, A.H. Characterization of gene-activated human acid-β-glucosidase: Crystal structure, glycan composition, and internalization into macrophages. Glycobiology 2010, 20, 24–32. [Google Scholar] [CrossRef]
- Gonzalez, D.E.; Turkia, H.B.; Lukina, E.A.; Kisinovsky, I.; Dridi, M.F.B.; Elstein, D.; Zahrieh, D.; Crombez, E.; Bhirangi, K.; Barton, N.W.; et al. Enzyme replacement therapy with velaglucerase alfa in Gaucher disease: Results from a randomized, double-blind, multinational, Phase 3 study. Am. J. Hematol. 2013, 88, 166–171. [Google Scholar] [CrossRef]
- Nyman, E.; Lindgren, I.; Lövfors, W.; Lundengård, K.; Cervin, I.; Sjöström, T.A.; Altimiras, J.; Cedersund, G. Mathematical modeling improves EC50 estimations from classical dose–response curves. FEBS J. 2015, 282, 951–962. [Google Scholar] [CrossRef] [PubMed]
- Tekoah, Y.; Tzaban, S.; Kizhner, T.; Hainrichson, M.; Gantman, A.; Golembo, M.; Aviezer, D.; Shaaltiel, Y. Glycosylation and functionality of recombinant β-glucocerebrosidase from various production systems. Biosci. Rep. 2013, 33, e00071. [Google Scholar] [CrossRef]
- Berger, J.; Stirnemann, J.; Bourgne, C.; Pereira, B.; Pigeon, P.; Heraoui, D.; Froissart, R.; Rapatel, C.; Rose, C.; Belmatoug, N.; et al. The uptake of recombinant glucocerebrosidases by blood monocytes from type 1 Gaucher disease patients is variable. Br. J. Haematol. 2012, 157, 274–277. [Google Scholar] [CrossRef]
- National Medical Products Administration. Pharmacopoeia of the People’s Republic of China (2025 Edition) IV.; China Medical Science Press: Beijing, China, 2025. [Google Scholar]
- Beutler, E. Enzyme replacement in gaucher disease. PLoS Med. 2004, 1, e21. [Google Scholar] [CrossRef]
- Nascimento, C.R.; Rodrigues Fernandes, N.A.; Gonzalez Maldonado, L.A.; Rossa Junior, C. Comparison of monocytic cell lines U937 and THP-1 as macrophage models for in vitro studies. Biochem. Biophys. Rep. 2022, 32, 101383. [Google Scholar] [CrossRef]
- Van Patten, S.M.; Hughes, H.; Huff, M.R.; Piepenhagen, P.A.; Waire, J.; Qiu, H.; Ganesa, C.; Reczek, D.; Ward, P.V.; Kutzko, J.P.; et al. Effect of mannose chain length on targeting of glucocerebrosidase for enzyme replacement therapy of Gaucher disease. Glycobiology 2007, 17, 467–478. [Google Scholar] [CrossRef] [PubMed]
- Platt, F.M. Emptying the stores: Lysosomal diseases and therapeutic strategies. Nat. Rev. Drug Discov. 2017, 17, 133–150. [Google Scholar] [CrossRef] [PubMed]
- Wollman, J.; Wanniarachchi, K.; Pradhan, B.; Huang, L.; Kerkvliet, J.G.; Hoppe, A.D.; Thiex, N.W. Mannose receptor (MRC1) mediates uptake of dextran by bone marrow–derived macrophages. Mol. Biol. Cell 2024, 35, ar153. [Google Scholar] [CrossRef]
- Feng, R.; Zhu, L.; Heng, X.; Chen, G.; Chen, H. Immune Effect Regulated by the Chain Length: Interaction between Immune Cell Surface Receptors and Synthetic Glycopolymers. ACS Appl. Mater. Interfaces 2021, 13, 36859–36867. [Google Scholar] [CrossRef] [PubMed]
- Sato, Y.; Beutler, E. Binding, internalization, and degradation of mannose-terminated glucocerebrosidase by macrophages. J. Clin. Investig. 1993, 91, 1909–1917. [Google Scholar] [CrossRef]
- Kallemeijn, W.W.; Scheij, S.; Hoogendoorn, S.; Witte, M.D.; Herrera Moro Chao, D.; van Roomen, C.P.A.A.; Ottenhoff, R.; Overkleeft, H.S.; Boot, R.G.; Aerts, J.M.F.G. Investigations on therapeutic glucocerebrosidases through paired detection with fluorescent activity-based probes. PLoS ONE 2017, 12, e0170268. [Google Scholar] [CrossRef] [PubMed]
- Feinberg, H.; Jégouzo, S.A.F.; Lasanajak, Y.; Smith, D.F.; Drickamer, K.; Weis, W.I.; Taylor, M.E. Structural analysis of carbohydrate binding by the macrophage mannose receptor CD206. J. Biol. Chem. 2021, 296, 100368. [Google Scholar] [CrossRef]
- Kerz, M.; Folarin, A.; Meleckyte, R.; Watt, F.M.; Dobson, R.J.; Danovi, D. A novel automated high-content analysis workflow capturing cell population dynamics from induced pluripotent stem cell live imaging data. SLAS Discov. 2016, 21, 887–896. [Google Scholar] [CrossRef] [PubMed]
- Abe, A.; Kelly, R.; Kollmeyer, J.; Hiraoka, M.; Lu, Y.; Shayman, J.A. The secretion and uptake of lysosomal phospholipase A2 by alveolar macrophages. J. Immunol. 2008, 181, 7873–7881. [Google Scholar] [CrossRef] [PubMed]


| Potency Level | Run | Relative Potency | Relative Bias | ||||
|---|---|---|---|---|---|---|---|
| Mean | Upper Confidence | Lower Confidence | Mean | Upper Confidence | Lower Confidence | ||
| 50% | 8 | 51.10% | 52.76% | 49.45% | 2.2% | 5.4% | 1.1% |
| 80% | 8 | 81.80% | 83.32% | 80.28% | 2.3% | 4.0% | 0.3% |
| 100% | 8 | 102.01% | 105.59% | 98.43% | 2.0% | 5.5% | 1.6% |
| 125% | 8 | 124.74% | 127.14% | 122.33% | 0.2% | 1.6% | 2.2% |
| 200% | 8 | 199.79% | 204.48% | 195.10% | 0.1% | 2.2% | 2.5% |
| Potency Level | Run | GSD | CIGSD | GCV | CIGCV |
|---|---|---|---|---|---|
| 50% | 8 | 1.0494 | 1.0905 | 4.9% | 9.0% |
| 80% | 8 | 1.0279 | 1.0507 | 2.8% | 5.1% |
| 100% | 8 | 1.0536 | 1.0983 | 5.4% | 9.8% |
| 125% | 8 | 1.0291 | 1.0528 | 2.9% | 5.3% |
| 200% | 8 | 1.0357 | 1.0651 | 3.6% | 6.5% |
| Samples | Mean | RSD |
|---|---|---|
| DS1 | 104.83% | 2.36% |
| DS2 | 102.00% | 4.10% |
| DP1 | 101.40% | 0.74% |
| DP2 | 104.60% | 3.67% |
Disclaimer/Publisher’s Note: The statements, opinions and data contained in all publications are solely those of the individual author(s) and contributor(s) and not of MDPI and/or the editor(s). MDPI and/or the editor(s) disclaim responsibility for any injury to people or property resulting from any ideas, methods, instructions or products referred to in the content. |
© 2026 by the authors. Licensee MDPI, Basel, Switzerland. This article is an open access article distributed under the terms and conditions of the Creative Commons Attribution (CC BY) license.
Share and Cite
Wang, L.; Xu, K.; Lyu, P.; Hu, X.; Li, J. Quantitative and Comparative Assessment of Recombinant Human β-Glucocerebrosidase Uptake Bioactivity Using a Stable hMMR-Expressing CHO Cell Model. Molecules 2026, 31, 235. https://doi.org/10.3390/molecules31020235
Wang L, Xu K, Lyu P, Hu X, Li J. Quantitative and Comparative Assessment of Recombinant Human β-Glucocerebrosidase Uptake Bioactivity Using a Stable hMMR-Expressing CHO Cell Model. Molecules. 2026; 31(2):235. https://doi.org/10.3390/molecules31020235
Chicago/Turabian StyleWang, Lyuyin, Kaixin Xu, Ping Lyu, Xinyue Hu, and Jing Li. 2026. "Quantitative and Comparative Assessment of Recombinant Human β-Glucocerebrosidase Uptake Bioactivity Using a Stable hMMR-Expressing CHO Cell Model" Molecules 31, no. 2: 235. https://doi.org/10.3390/molecules31020235
APA StyleWang, L., Xu, K., Lyu, P., Hu, X., & Li, J. (2026). Quantitative and Comparative Assessment of Recombinant Human β-Glucocerebrosidase Uptake Bioactivity Using a Stable hMMR-Expressing CHO Cell Model. Molecules, 31(2), 235. https://doi.org/10.3390/molecules31020235