Article

Peroxidase Sensor Based on Electroactive Ce3+-Phytic Acid-Cu2+@Cu Composite

1
Key Laboratory of Food Science and Engineering of Heilongjiang Ordinary Higher Colleges, College of Food Engineering, Harbin University of Commerce, Harbin 150000, China
2
Postdoctoral Research Workstation of Northeast Asia Service Outsourcing Research Center, Harbin University of Commerce, Harbin 150028, China
3
College of Life Science and Technology, Mudanjiang Normal University, Mudanjiang 157011, China
*
Author to whom correspondence should be addressed.
Molecules 2026, 31(19), 3448; https://doi.org/10.3390/molecules31193448
Submission received: 7 January 2026 / Revised: 10 February 2026 / Accepted: 17 February 2026 / Published: 28 September 2026
(This article belongs to the Section Electrochemistry)

Abstract

Peroxide is a vital oxidant that can quickly kill bacteria, viruses, and fungi in food and ensure food safety. However, excessive intake will stimulate the gastrointestinal tract, cause abdominal pain and vomiting, and its strong oxidation will also destroy the vitamin and protein structure in food. Cerium-based nanomaterials exhibit good biocompatibility and strong chemical stability, and have significant application value in biological detection. Cu nanoparticles were deposited on the surface of a glassy carbon electrode (GCE) by potentiostatic deposition. The Ce3+/PA-Cu2+@Cu/GCE sensor was constructed by etching and complexing Cu2+ with phytic acid (PA) to form a PA-Cu3+ coordination film. By X-ray diffraction (XRD) and Fourier Transform Infrared (FT-IR), the structure of composite material on the electrode surface was characterized. Electrochemical test results: Cu time of electrodeposition 700 s, PA embellishment 60 min, Ce3+ coordination 60 min, and H2O2 Reaction 15 min. The detection linearity range of the sensor for hydrogen peroxide is 0.1–100 μmol/L, detection limit is 0.89 μmol/L, and there was good selectivity, sensitivity and reproducibility (RSD = 1.013%) and stability (retention of 84% response at 28 days).

1. Introduction

As a class of chemicals with strong oxidizing properties, peroxides are widely used as disinfectants and preservatives in the field of food processing. They extend the shelf life of packaged food by inhibiting the metabolic activities of microorganisms. However, excessive use of this substance may bring many risks. In food production, the illegal addition of excessive peroxide will not only lead to the decomposition of vitamins, proteins and other nutrients, but also damage the digestive tract mucosa, causing abdominal pain and vomiting [1]. Therefore, the detection of peroxide is of great significance to protecting food safety, environmental health and industrial production safety. Common detection methods include titration, chromatography, fluorescence, chemiluminescence, spectrophotometry and electrochemical methods. Among them, electrochemical detection, as an analytical technology, has the basic characteristics of fast response, high sensitivity and easy operation, and has received wide attention. Comparing the advantages and disadvantages of different methods, it can be seen that the electrochemical method has the best comprehensive performance. Therefore, this paper identifies the electrochemical method as the main research method for manufacturing various H2O2 detection electrodes.
Electrochemical biosensors mainly use the specific three-dimensional structure of biological small molecules and their specific identification ability of the corresponding substrates to convert the concentration-related parameters of the target object to be tested into electrical signal parameters, and then record the generated signals and process them [2,3,4]. The specificity of biomolecular identification determines the high selectivity of electrochemical biosensors, which have the advantages of speed, strong specificity, sensitivity and easy miniaturization. It has attracted wide attention from researchers in the analysis and detection of peroxide [5,6,7,8]. The surface of the biosensor needs to modify enzyme-active substances or construct a nanofilm structure with simulated enzyme activity. The simulated enzyme materials used to build H2O2 electrochemical sensors include precious metals, metal oxides, carbon nanomaterials and metal organic frameworks (MOFs), etc. Compared with natural enzyme biosensors, electrochemical sensors based on analog enzymes and their composites can amplify the sensing signal, reduce the redox potential of H2O2, improve sensitivity and enhance stability. A copper-based metal organic skeleton (mof) has the advantages of rich metal potential, large specific surface area, simple synthesis process, etc., and is a promising sensing material. Yong Li [9] prepared silver-doped copper oxide nanocomposites (Ag@CuO) by electrostatic spinning method, and obtained nanoparticles with honeycomb structure through heat treatment. Material characterization shows that the nanocomposite has high purity and excellent electrocatalytic properties. Experiments show that compared with pure CuO modified electrodes, the voltammetry response of Ag@CuO-modified carbon slurry electrodes (CPE) is 3 times better, and it has significant catalytic activity for H2O2 oxidation. The detection performance of the sensor reaches sensitivity 1982.14 μA (mmol·L−1), detection limit 0.01 μmol·L−1 (S/N = 3), and a linear coverage of 0.05 μmol· L−1 to 1.5 mmol L−1. This method was successfully used to determine H2O2 in canned coconuts, with a recovery rate of 98.7% to 102.3%, verifying its practical application value. Cerium-based materials (such as CeO2 and Ce-MOFs) have abundant oxygen vacancy, strong Ce3+/Ce4+ valence conversion ability, and high oxygen storage capacity. They can simulate peroxidase activity, accelerate H2O2 decomposition reaction, and improve electrocatalytic performance. Manibalan G et al. [10] developed silver (Ag)-doped CeO2/Ag2O-modified glass carbon electrode (Ag-CeO2/Ag2O/GCE) as a non-enzymatic electrochemical sensor, which is used for sensitive and selective detection of H2O2 to show excellent electrocatalytic activity. This is due to the increase in active sites and the enhancement of electron transfer. The sensor has a high sensitivity of 2.728 µA cm−2µM−1, which is significantly better than the undoped CeO2/GCE (0.0404 µA cm−2µM−1). In the wide linear detection range of 1 × 10⁻⁸~0.5 × 10⁻³ m, the detection limit (LOD) and quantitative limit (LOQ) are 6.34 µm and 21.1 µm, respectively. The sensor also shows excellent selectivity, the least interference from ordinary analytes, and at the same time, has storage stability, reproducibility, and repeatability of color. Phytic acid (PA), as a natural organic polyphosphoric acid compound, contains six phosphate ester bonds in its molecule, and has an extremely strong complexing ability. It can form stable complexes with various metal ions (such as Ce3+, Cu2+, etc.). Meanwhile, its unique structure can regulate the microstructure of materials, and increase their specific surface area and stability. It can also serve as a proton transfer medium to accelerate the progress of catalytic reactions. Lili Yang et al. [11] prepared a PA-PEDOT-CuNPs nanocomposite material modified glassy carbon electrode for enzyme-free glucose detection. PA-doped PEDOT provides a highly conductive and large specific surface area substrate, promoting the uniform growth of CuNPs and enabling direct oxidation of glucose. The detector has a linear range of 5–403 μM, a sensitivity of 79.27 μA μM−1 cm−2, a detection limit of 0.28 μM, and a response time of less than 4 s. Studies have shown that phytic acid can form stable complexes with Cu ions, regulate the morphology and properties of Cu-based materials, and be used to construct electrochemical sensors for detecting target molecules. Ce-based composites have shown great potential in peroxidase sensing due to their excellent catalytic performance.
Therefore, in this study, a multilayer nanostructure system based on GCE was adopted. Under a constant potential, Cu nanoparticles (with a particle size of 20–50 nm) were deposited on the glassy carbon electrode, providing a highly conductive substrate. The three-dimensional network structure can significantly increase the density of active sites. Due to the strong coordination between the phosphate group and Cu2+, the PA-Cu2+ coordination film can form a dense protective film, which not only prevents the oxidation and aggregation of Cu but also controls the electrostatic adsorption rate of Ce3+ on the film surface, making it an active center for the oxidation of H2O2. This study explored the synergistic catalytic mechanism among Ce3+, phytic acid and Cu2+@Cu by constructing an enzyme-free peroxidase sensor, and investigated the detection performance and practical application value of the sensor for H2O2, aiming to provide new ideas and experimental basis for the development of high-performance and low-cost peroxidase sensors.

2. Results

2.1. Results Analysis of H2O2 Electrochemical Sensor Based on Electroactive Ce3+-Phytic Acid-Cu2+@Cu Composite

Cu nanoparticles electrodeposited on glassy carbon electrode (GCE) were chosen as the signal source to obtain Cu/GCE modified electrode. Then, phytic acid (PA) and Ce3+ were alternately adsorbed onto the electrode via a self-assembly method to obtain Ce3+/PA-Cu2+@Cu/GCE. When H2O2 exists, Ce3+ is oxidized to achieve highly sensitive detection of H2O2 in milk. The specific test analysis is as follows.

2.1.1. XRD Analysis of Ce3+-Phytic Acid-Cu2+@Cu Composite

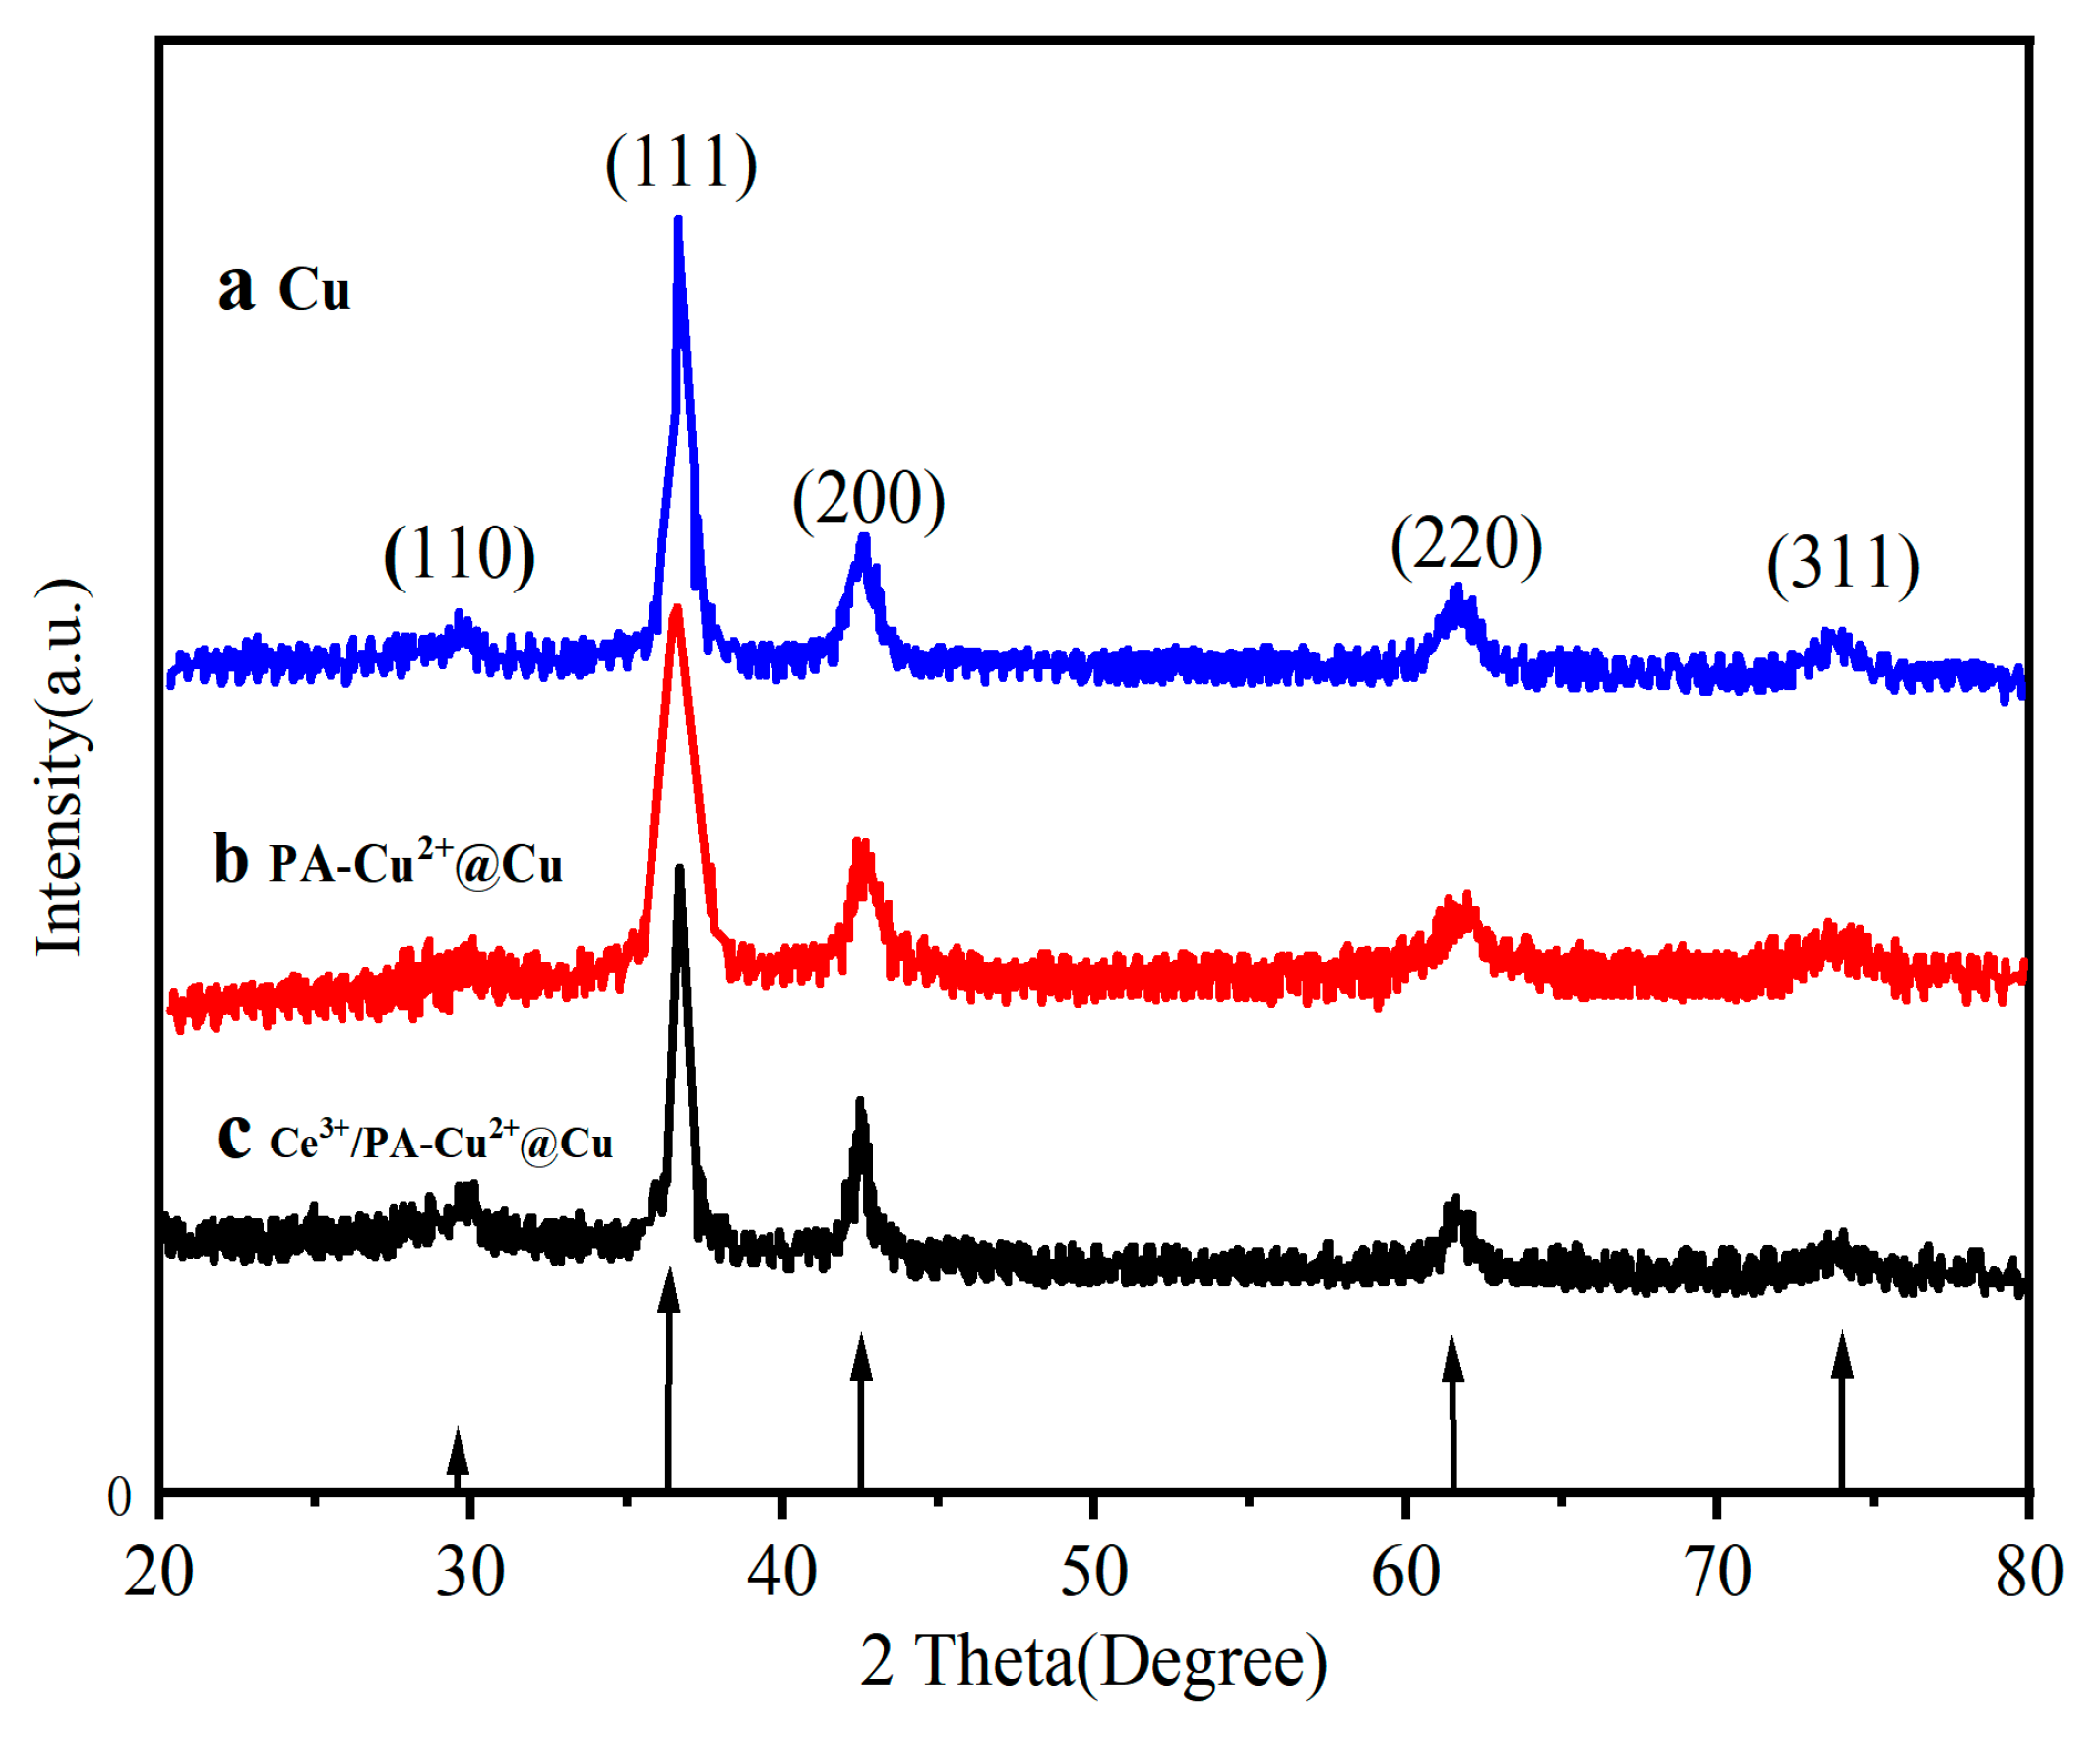
XRD tests were conducted on Cu, PA-Cu2+@Cu, and Ce3+/PA-Cu2+@Cu nanocomposite powders, respectively, and the results are shown in Figure 1. The characteristic diffraction peaks of pure copper powder at 2θ = 337.3°, 42.5°, and 63.2° correspond to (111), (200), and (220) crystal planes of copper face-centered cubic structure (PDF #89-2838), respectively. The sharp peaks and high intensity indicate that the material has good crystallinity. When copper nanoparticles are contacted with PA to form PA-Cu2+@Cu composites, the intensity of the characteristic copper diffraction peak decreases obviously, which is attributed to the selective etching caused by the coordination of carboxylic acid groups in PA molecules with copper surfaces. By chelating Cu2+ to form soluble complexes, PA helps rebuild the surface of copper nanoparticles, thereby weakening their crystalline integrity.
After Ce3+ was introduced, the XRD pattern of Ce3+/PA-Cu2+@Cu showed that the diffraction peak intensity of Cu decreased further, which could be attributed to the synergistic effect of Ce3+ and PA. On the one hand, Ce3+ was adsorbed on PA-Cu2+@Cu surface by electrostatic interaction, forming the ternary Ce3+/PA-Cu2+@Cu complex. Ce3+/PA-Cu2+@Cu ternary complex enhances the chemical etching of copper; on the other hand, the hydrolysis of Ce3+ produces a local acidic microenvironment, which accelerates the oxidation dissolution of copper. Notably, no Ce-related diffraction peaks were observed in the diffraction pattern, suggesting that Ce3+ may exist as amorphous or highly dispersed nanoparticles, or embedded in PA-Cu2+ lattice structures. These results indicate that continuous Ce [12] treatment of PA can effectively adjust the surface structure of copper nanoparticles, and construct porous nanostructures through chemical etching and coordination, providing more active sites for subsequent electrocatalytic reactions.

2.1.2. Infrared Spectrum Analysis of Ce3+-Phytic Acid-Cu2+@Cu Composite and Phytic Acid

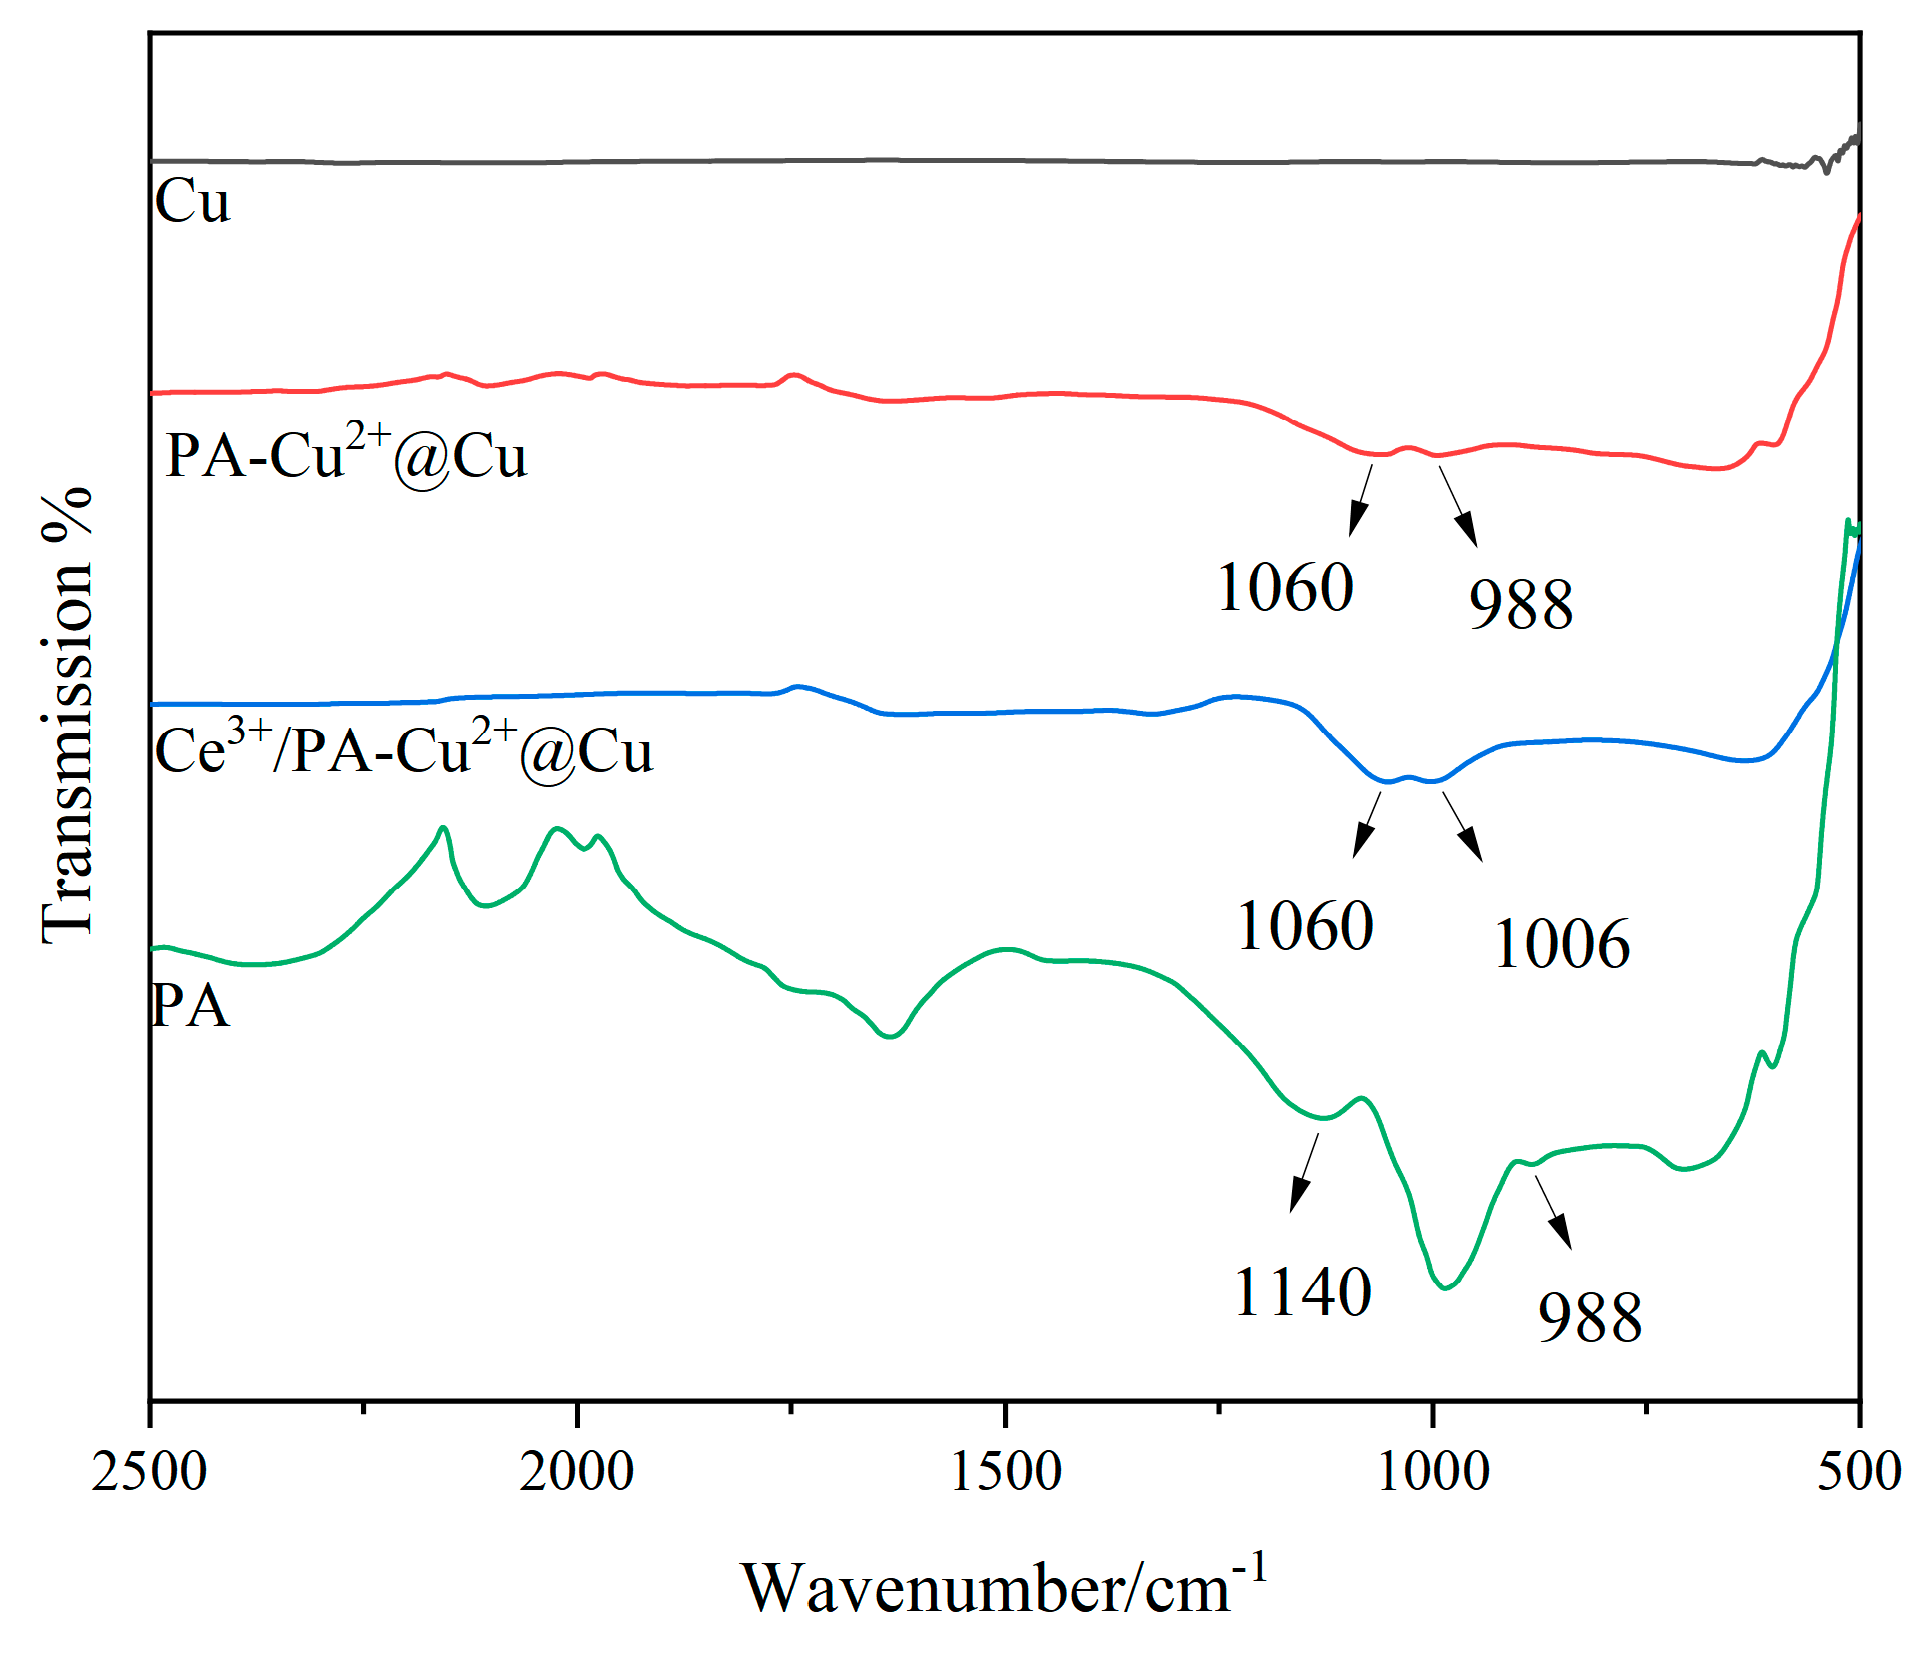
Figure 2 shows infrared spectra of Cu, PA-Cu2+@Cu, Ce3+/PA-Cu2+@Cu nanocomposite powders and PA. Pure copper has no characteristic absorption peak in the range of 400–4000 cm−1, indicating that organic functional groups do not modify its surface. When Cu reacts with PA to form the PA-Cu2+@Cu composite material, the characteristic peak of PA appears in the spectrum. The symmetrical stretching vibration of the P=O bond in PA causes the peak at 1140 cm−1. After coordination with Cu, this peak is red-shifted to 1060 cm−1, resulting in an increase in the P=O bond length and a decrease in the vibrational frequency. In addition, the absorption peak at 988 cm−1 corresponds to the stretching vibration of P-O-C bond, reflecting the anchoring effect of PA molecule on the copper surface. After further introduction of Ce3+, the spectrum of Ce3+/PA-Cu2+@Cu shows a shift from 988 cm−1 to 1006 cm−1, which can be attributed to the coordination of Ce3+ with phosphate groups in PA. The high coordination number of Ce3+ forms polycomplexes with carboxylate and phosphate of PA through electrostatic interaction, resulting in the redistribution of electron cloud density and an increase in vibration frequency of P-O bond. Meanwhile, the hydroxyl peak intensity at 3420 cm [13] increases, indicating that the hydrolysis of Ce−1 introduces additional surface hydroxyl groups.
This result complements XRD analysis; IR spectra confirm the successful modification of PA and Ce3+, while XRD reveals surface structural changes in copper nanoparticles. They verify the controllable synthesis of Ce3+/PA-Cu2+@Cu electrode and provide a structural basis for optimizing electrocatalytic performance.

2.1.3. Characterization of CV Cycle Curve of Ce3+-Phytic Acid-Cu2+@Cu Composite Modified Electrode

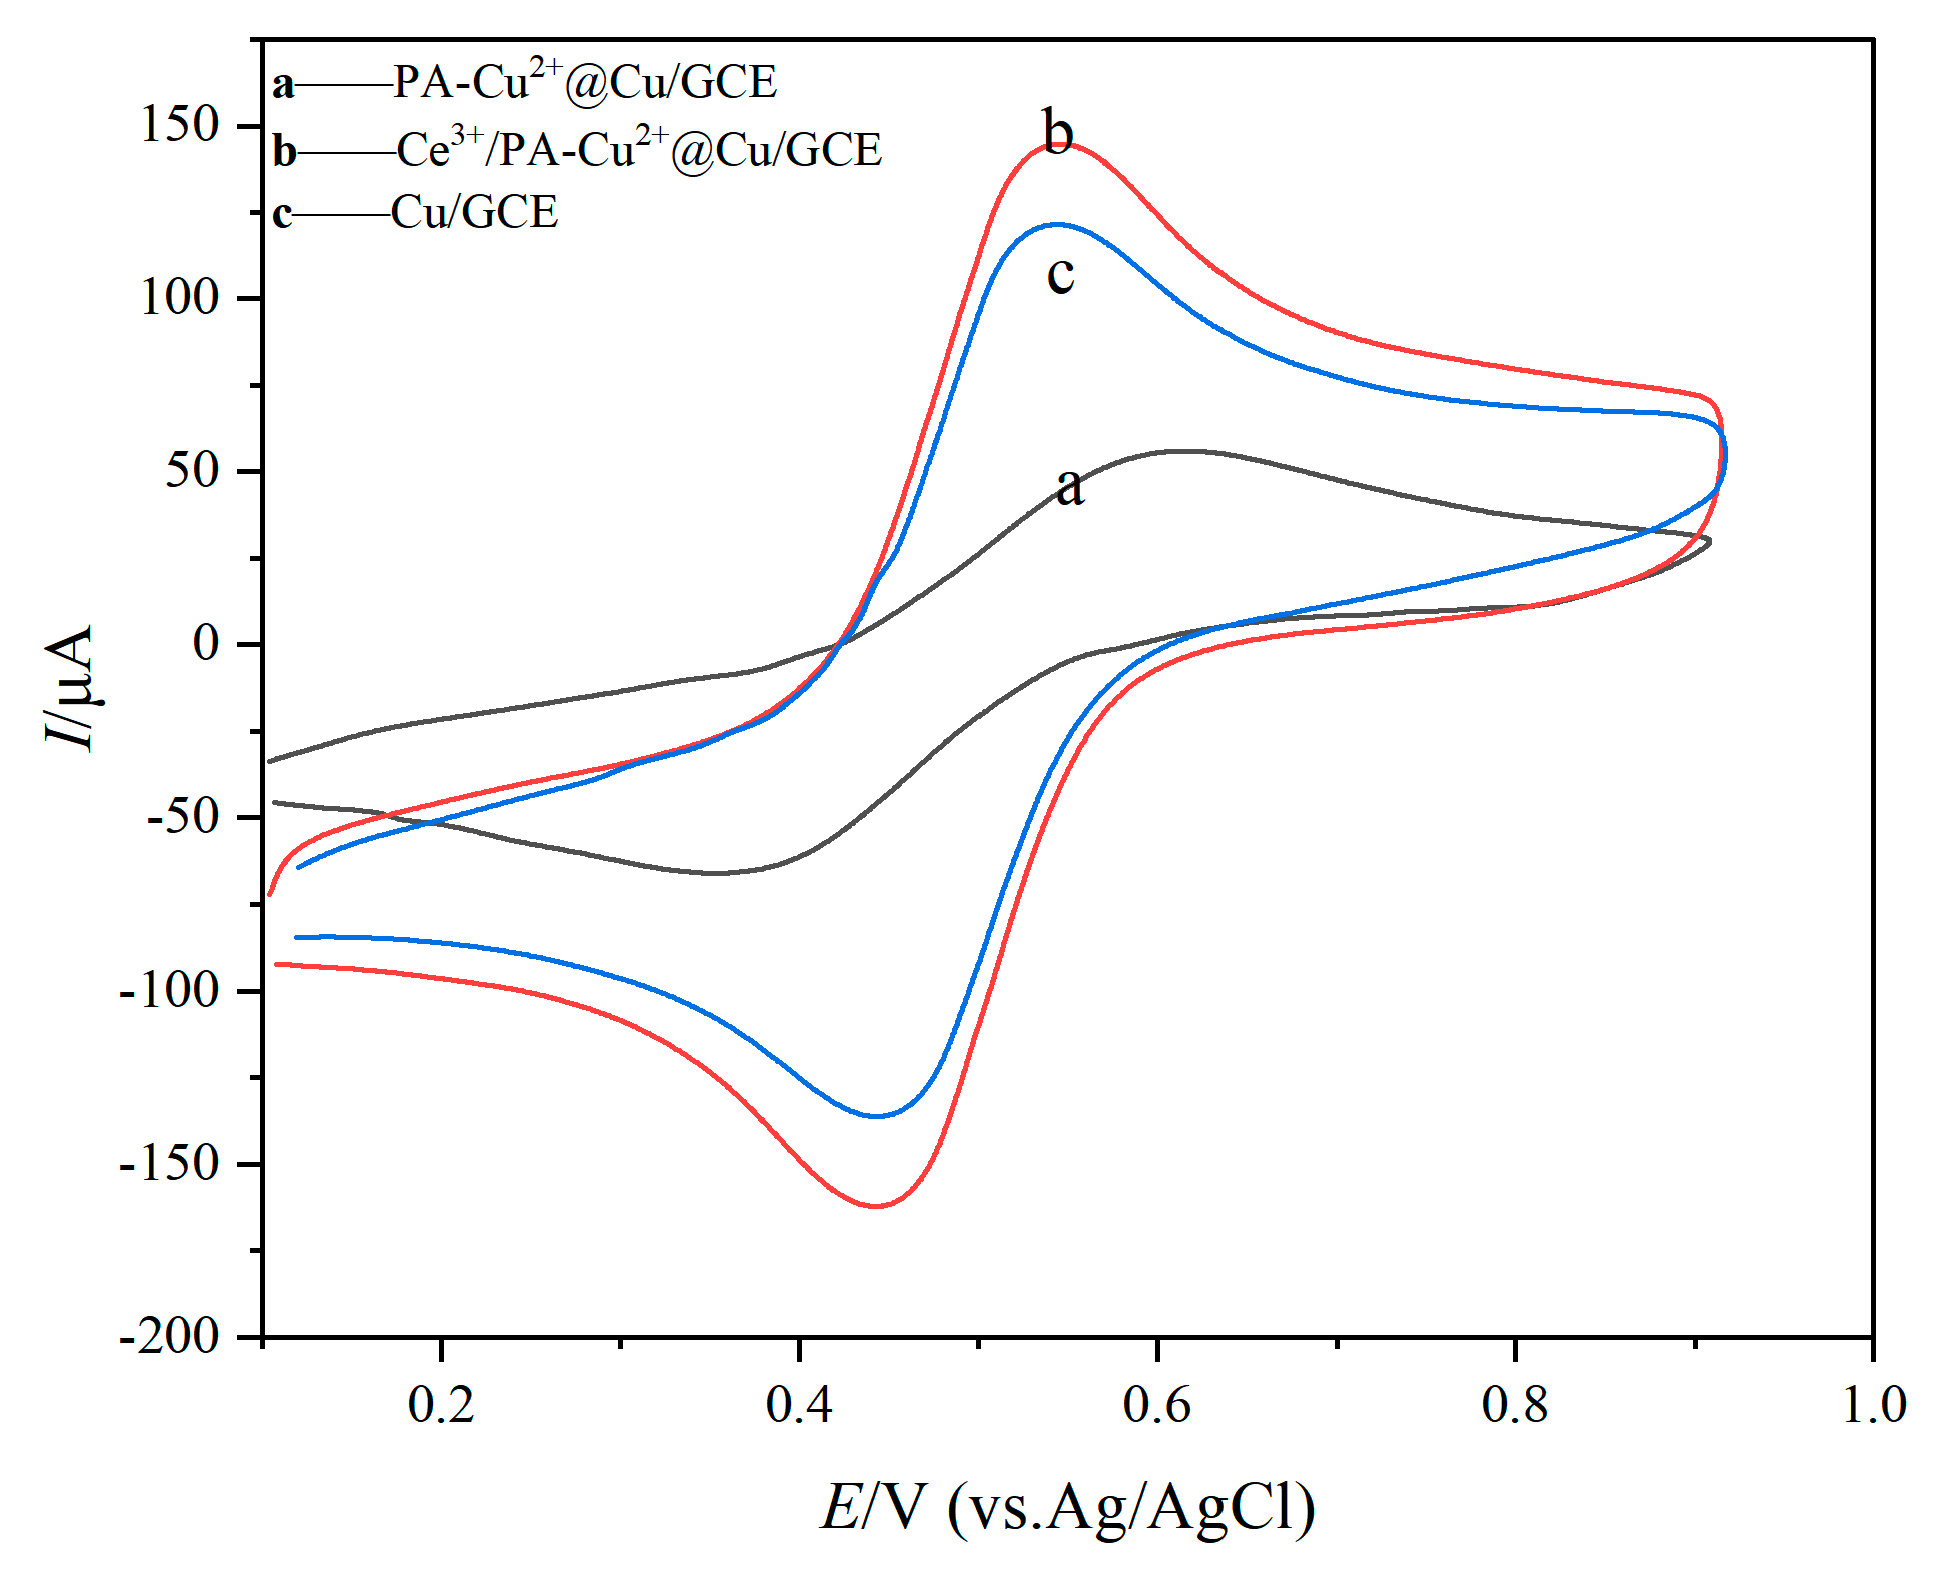
As shown in Figure 3, respectively, Cu/GCE, PA-Cu2+@Cu/GCE, Ce3+/PA-Cu2+@Cu/GCE for the working electrode, in the 5.0 mmol·L−1 K3[Fe(CN)6] of 0.1 mol·L−1 KCl in solution at 50 mV/s CV plot recorded at the scan rate of 0 to 1.0 V. Cu/GCE exhibits a pair of symmetrical redox peaks, indicating that the quasi-reversible reaction of [Fe(CN)6]3−/4− couple occurs on Cu surface [14]. The peak oxidation current of PA-Cu2+@Cu/GCE decreases after PA is compounded. This is attributed to electrostatic repulsion between carboxylic acid groups in PA molecules, which hinders the diffusion-mediated mass transfer of [Fe(CN)6]3−/4−. It is noteworthy that the CV curve of Ce3+/PA-Cu2+@Cu/GCE shows a significantly improved electrical response, which is attributed to the fact that the high conductivity of Ce3+ accelerates the electron transport and reduces the charge transfer resistance (Rct)(verified by EIS); the complex formed by Ce3+ and PA provides more active sites for this pair of electrons and increases the effective area of the electrode.
XRD and FT-IR analysis confirmed this result: Ce3+ not only optimized the charge state at the electrode surface but also improved electron transfer efficiency through structural adjustment, laying the electrochemical foundation for subsequent H2O2 electrocatalytic detection.

2.1.4. Characterization of Ce3+-Phytic Acid-Cu2+@Cu Composite Modified by EIS

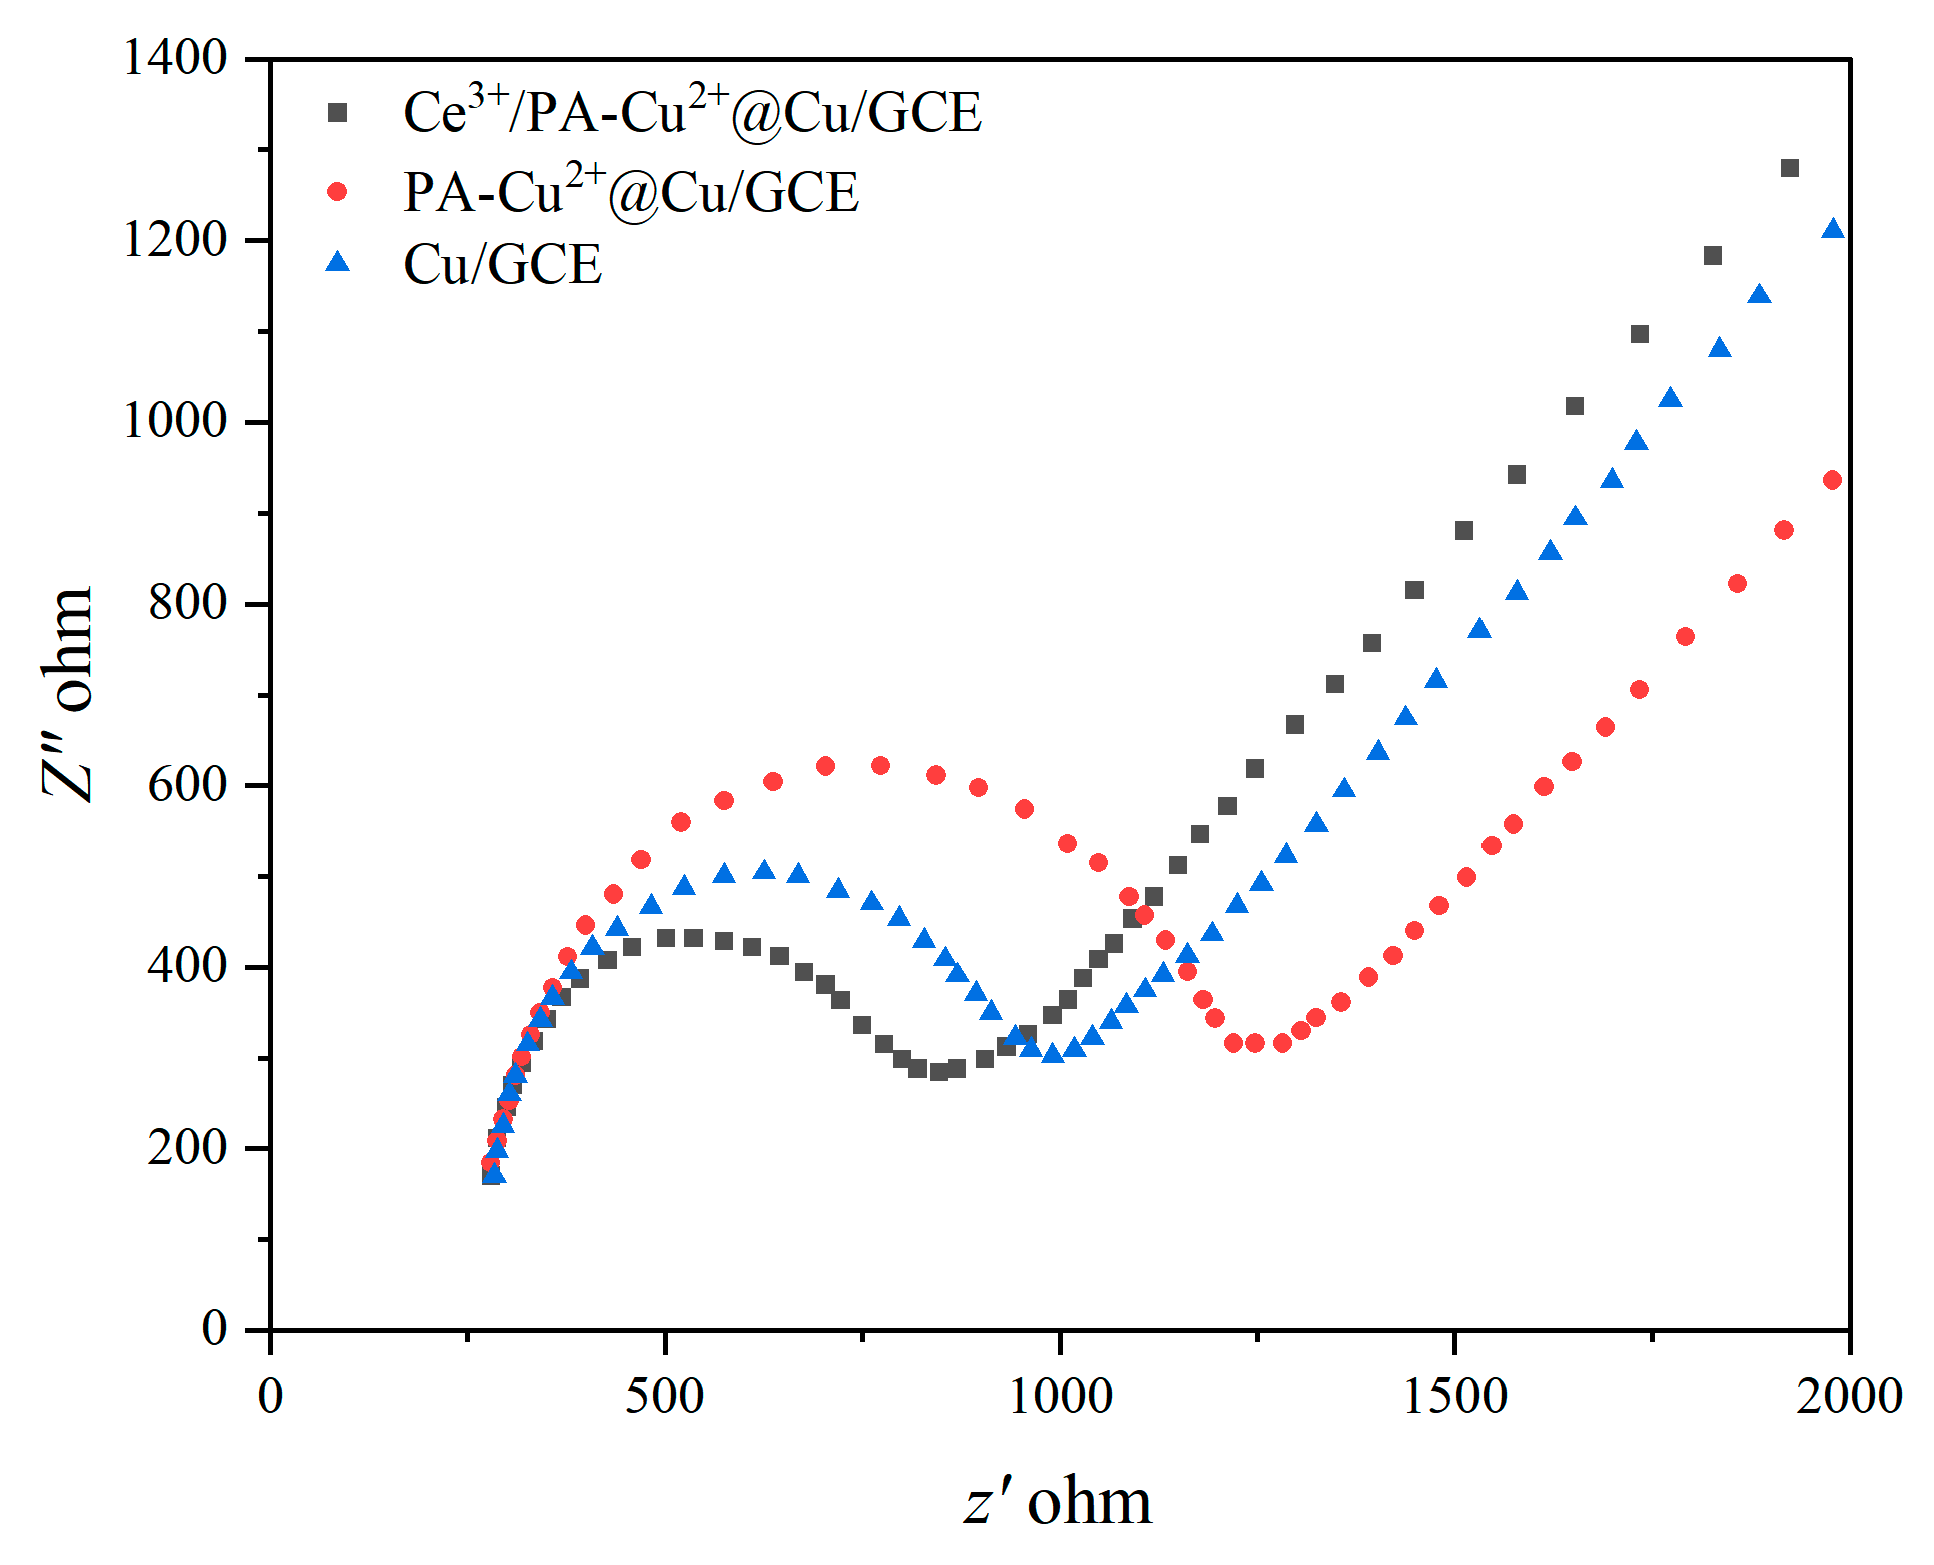
Figure 4 shows electrochemical impedance spectroscopy (EIS) of Cu/GCE, PA-Cu2+@Cu/GCE, Ce3+/PA-Cu2+@Cu/GCE as working electrodes in 5.0 mmol·L−1 K3[Fe(CN)6] in 0.1 mol·L−1 KCl solution. The semicircular diameter in the high-frequency region corresponds to the charge-transfer resistance (Ret), while the diagonal in the low-frequency region reflects ion-diffusion behavior [15]. When Cu/GCE modified PA, the Ret of PA-Cu2+@Cu/GCE increased and the semicircular diameter increased by 76%. This phenomenon is due to the strong coordination of carboxylic acid groups in PA molecules: PA chelates with Cu2+ to form a dense, insulating layer that hinders the diffusion and mass transfer of [Fe(CN)6]3−/4−. In addition, electrostatic repulsion caused by the negative charge of PA further reduces mobility. It is worth noting that the Ret value for Ce3+/PA-Cu2+@Cu/GCE is 30% lower than that for pure Cu/GCE. This optimization is due to the synergistic effect of Ce3+ and PA. Ce3+ neutralizes the negative charge of PA by electrostatic adsorption and promotes the diffusion of charge pairs. Ce3+ complexation with PA promotes the surface reconstruction of copper and the formation of a porous structure, which increases the effective reaction area. These results are consistent with the CV analysis, which verifies that Ce3+ can significantly improve the electrode’s electron transfer efficiency through charge modulation, conductivity enhancement, and structure optimization.

2.2. Feasibility of Ce3+-Phytic Acid-Cu2+@Cu Composite Electrochemical Sensor for H2O2 Detection

2.2.1. Feasibility Analysis of Ce3+-Phytic Acid-Cu2+@Cu Composite Electrochemical Sensor for H2O2 Detection Verified by Cyclic Voltammetry

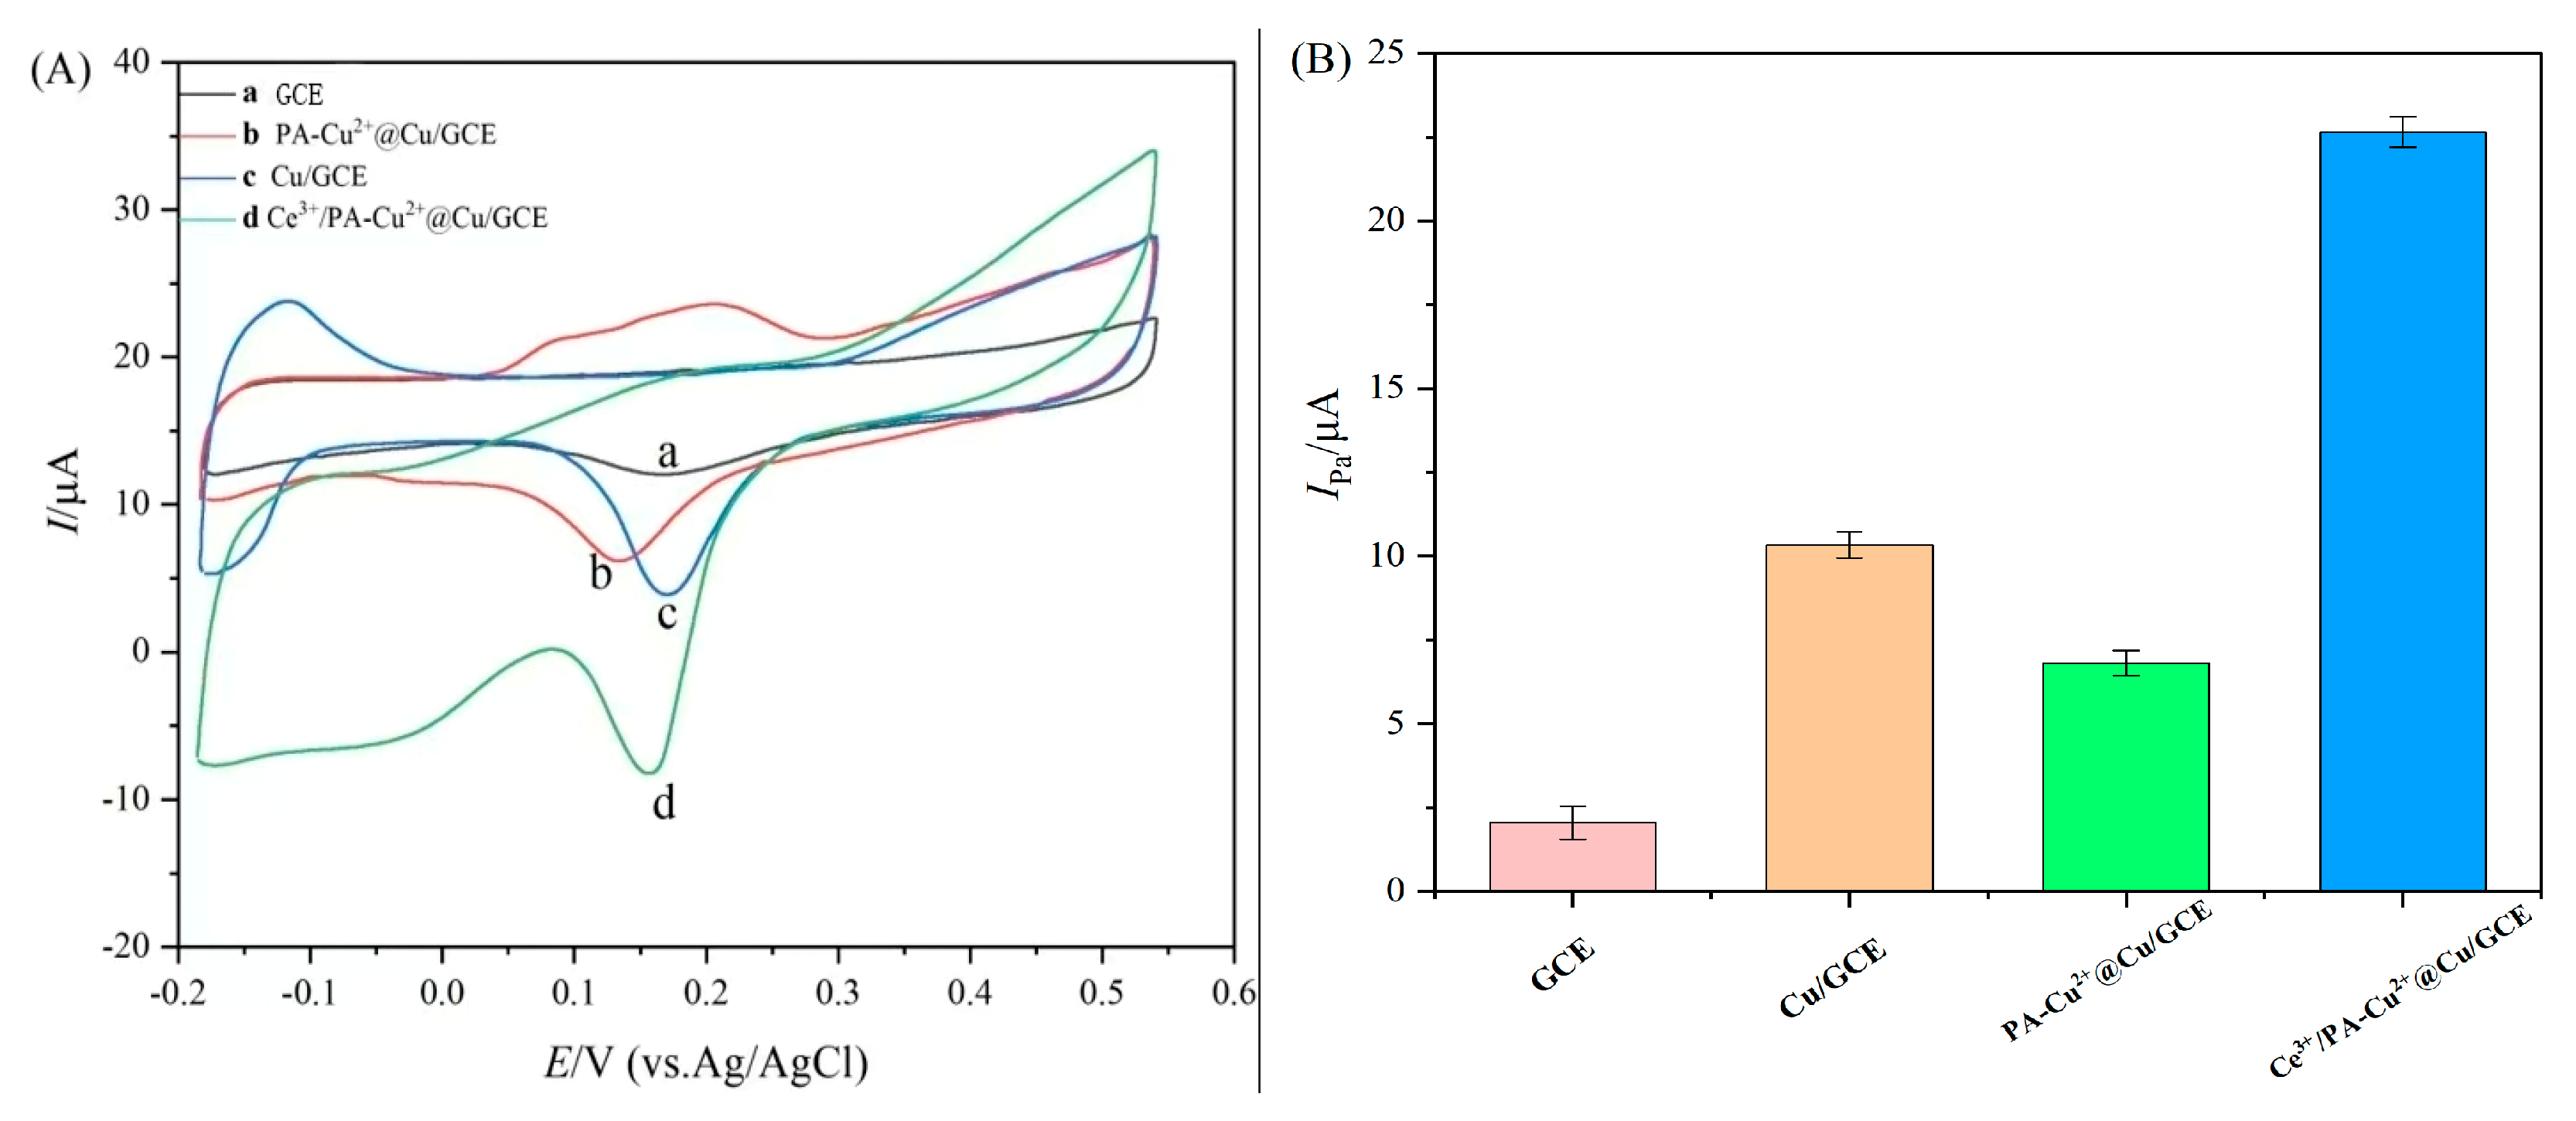
As shown in Figure 5A, the electrochemical responses of bare GCE, Cu/GCE, PA-Cu2+@Cu/GCE, and Ce3+/PA-Cu2+@Cu/GCE modified electrodes in H2O2 solution were tested by CV in 0.1 mol L−1 PBS containing 50 μmol H2O2. The test results show that the oxidation peak (EPa) of bare GCE is approximately 0.45 V, and the reduction peak (EPc) is about −0.05 V. The peak potential difference ΔEP is approximately 0.50 V. No characteristic redox peaks were observed within the scanning range, indicating that it lacks electrocatalytic activity for the target analyte. The Cu/GCE electrode shows a distinct oxidation peak, with the peak current increasing. EPa is approximately 0.40 V, EPc is about 0.00 V, and ΔEP ≈ 0.40 V. This is attributed to the excellent electrocatalytic performance of Cu nanoparticles. However, it can be more obviously observed that after the PA-Cu2+@Cu/GCE nanoparticles combined with phytic acid, EPa positively shifted to 0.50 V, EPc negatively shifted to −0.10 V, ΔEP ≈ 0.60 V, and at the same time, the CV response value to H2O2 showed a downward trend. This might be due to the fact that PA forms a non-conductive molecular film on the surface of Cu. It is worth noting that H2O2 exhibits the maximum redox peak at Ce3+/PA-Cu2+@Cu/GCE, with the peak current being the highest among all electrodes. The oxidation peak current approaches 35 μA, and the reduction peak current also exceeds −10 μA. The strongest indicates that the introduction of Ce3+ further enhances the catalytic activity and electron transfer rate. The results above confirm that Ce3+/PA-Cu2+@ Cu/GCE has the best catalytic effect for the determination of H2O2.
The histogram in Figure 5B shows the trend of peak oxidation current (IPa) for each electrode: Ce3+/PA-Cu2+@Cu/GCE has IPa values 12 times higher than bare GCE, 2 times higher than Cu/GCE, and 3.4 times higher than PA-Cu2+@Cu/GCE, which means that Cu nanomaterials modified on the surface of glassy carbon electrode not only improve the electron conduction efficiency, but also provide a rich attachment site for PA, which can be used to coordinate with Cu/GCE superficial Cu binding, and while further chelating Cu2+, Ce3+ has excellent redox activity and catalytic performance. It is enriched on the electrode surface by combining with the remaining phosphoric acid group of PA, and this not only increases the number of catalytic sites, but also uses Ce3+ as the high catalytic activity of itself further accelerates the redox reaction of target molecules and finally makes the peak current reach the maximum value. The graph shows the current trend in variation during electrode preparation and H2O2 detection, demonstrating that the experiment is feasible.

2.2.2. Feasibility Analysis of Ce3+-Phytic Acid-Cu2+@Cu Composite Electrochemical Sensor for H2O2 Detection Verified by Square Wave Voltammetry

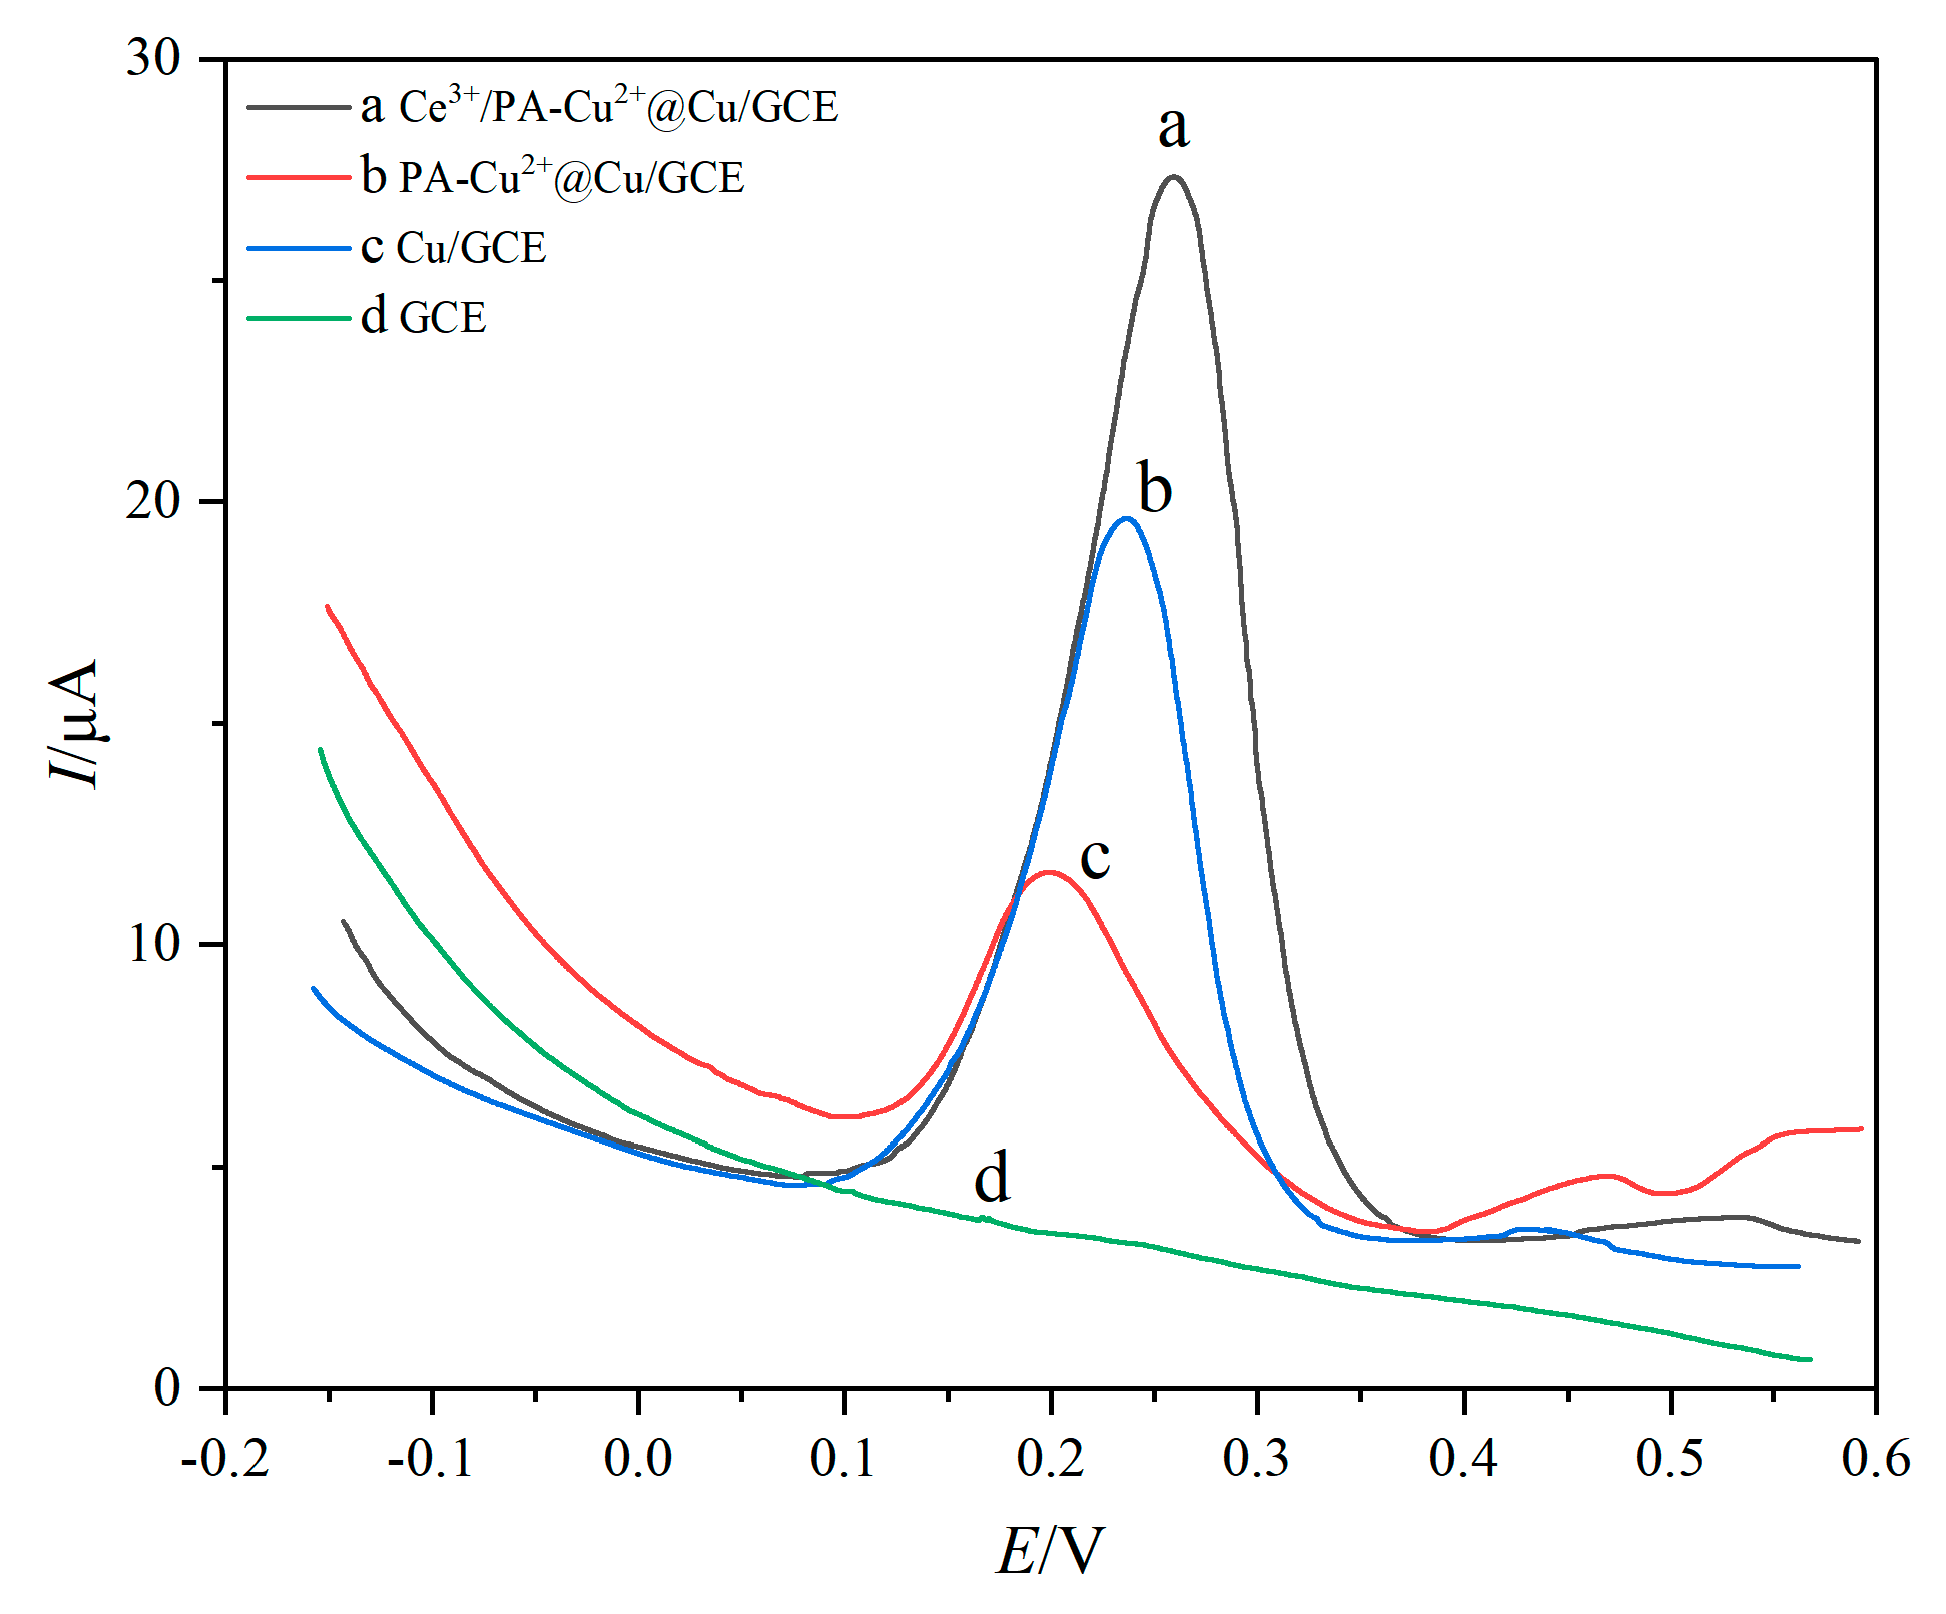
Figure 6 shows SWV images of GCE, Cu/GCE, PA-Cu2+@Cu/GCE, Ce3+/PA-Cu2+@Cu/GCE in H2O2 solution to Ag/AgCl saturation KCl as a reference electrode. It can be observed that when only GCE bare electrode is used, the corresponding SWV curve does not have oxidation peak current, which indicates that bare electrode has no electrochemical activity; for the Cu/GCE electrode, an oxidation peak was shown at 0.20 V in SWV, indicating that Cu physically adheres to GCE, which has a clear signal for the detection of H2O2; when PA and Cu/GCE form PA-Cu2+@Cu/GCE electrode, the oxidation peak site is at 0.23 V, and the oxidation peak current value in SWV curve decreases, which indicates that the conductivity of Cu2+ decreases due to PA covering, which is consistent with the trend expressed in CV image. Finally, we can clearly observe that the oxidation peak on the Ce3+/PA-Cu2+@Cu/GCE electrode at the 0.26 V oxidation peak site is the largest, which indicates that the appearance of Ce3+ produces electron transfer between ion valence states. Meanwhile, the introduction of Ce3+/PA-Cu2+@Cu/GCE enhances the conductivity of Cu2+ nanomaterials, which is also consistent with CV images, indicating that the catalytic effect of H2O2 determination on Ce3+/PA-Cu2+@Cu/GCE electrode is the best [16].

2.3. Optimization of Preparation Conditions for Ce3+-Phytic Acid-Cu2+@Cu Composite Electrochemical Sensor

2.3.1. Time Optimization Conditions for Electrodeposition of Cu

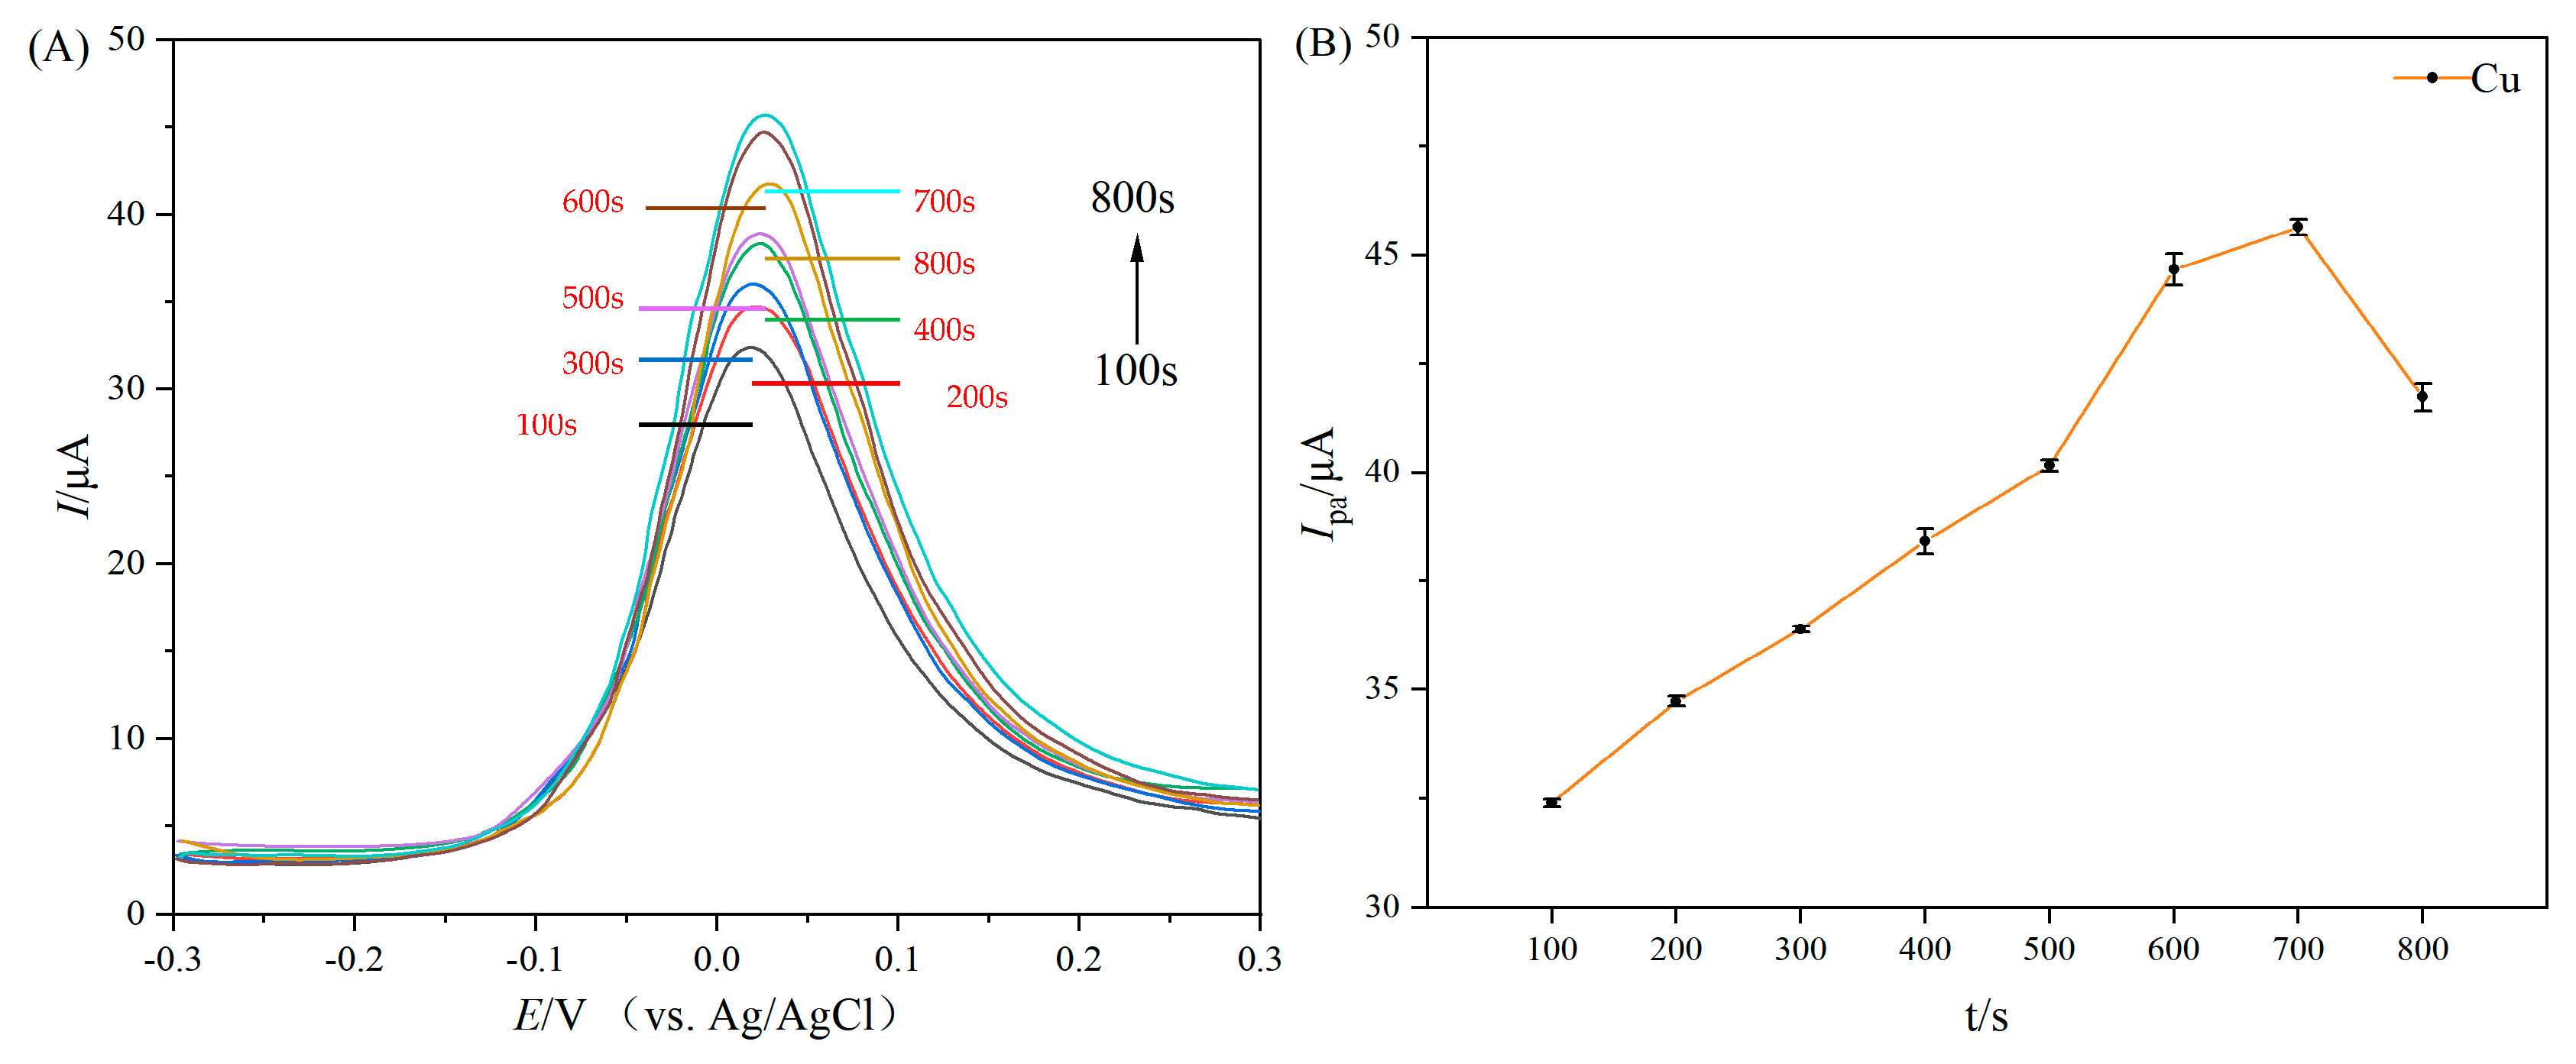
According to Section 4.6.1, the time for Cu electrodeposition is optimized. Figure 7 shows the SWV diagram of time optimization for the electrodeposition of Cu and the broken-line diagram of oxidation peak current (Ip) versus time (t). The figure shows that the oxidation peak current of Cu/GCE gradually increases with increasing deposition time from 100 s to 700 s. This phenomenon is attributed to the nucleation and growth of copper nanoparticles during electrodeposition. In the initial stage, copper nucleates on the GCE surface in an island-like structure, and the density of active sites is relatively low. With the extension of deposition time, copper particles gradually agglomerate to form continuous thin films, which makes the effective reaction area increase. After deposition time exceeds 700 s, the oxidation peak current begins to decrease. This transition is due to structural defects caused by excessive thickening of the deposited layer, increase in porosity and coarsening of grains in the thick film, thus reducing the number of active sites; increase in porosity between the deposited layer and GCE will also reduce the number of active sites; and weakening of bonding force between the deposited layer and GCE will lead to partial copper detachment. Therefore, 700 s was determined to be the optimal electrodeposition time, at which the electrode exhibited the highest catalytic oxidation efficiency for H2O2.

2.3.2. Optimization of Soaking Time of Phytic Acid Solution

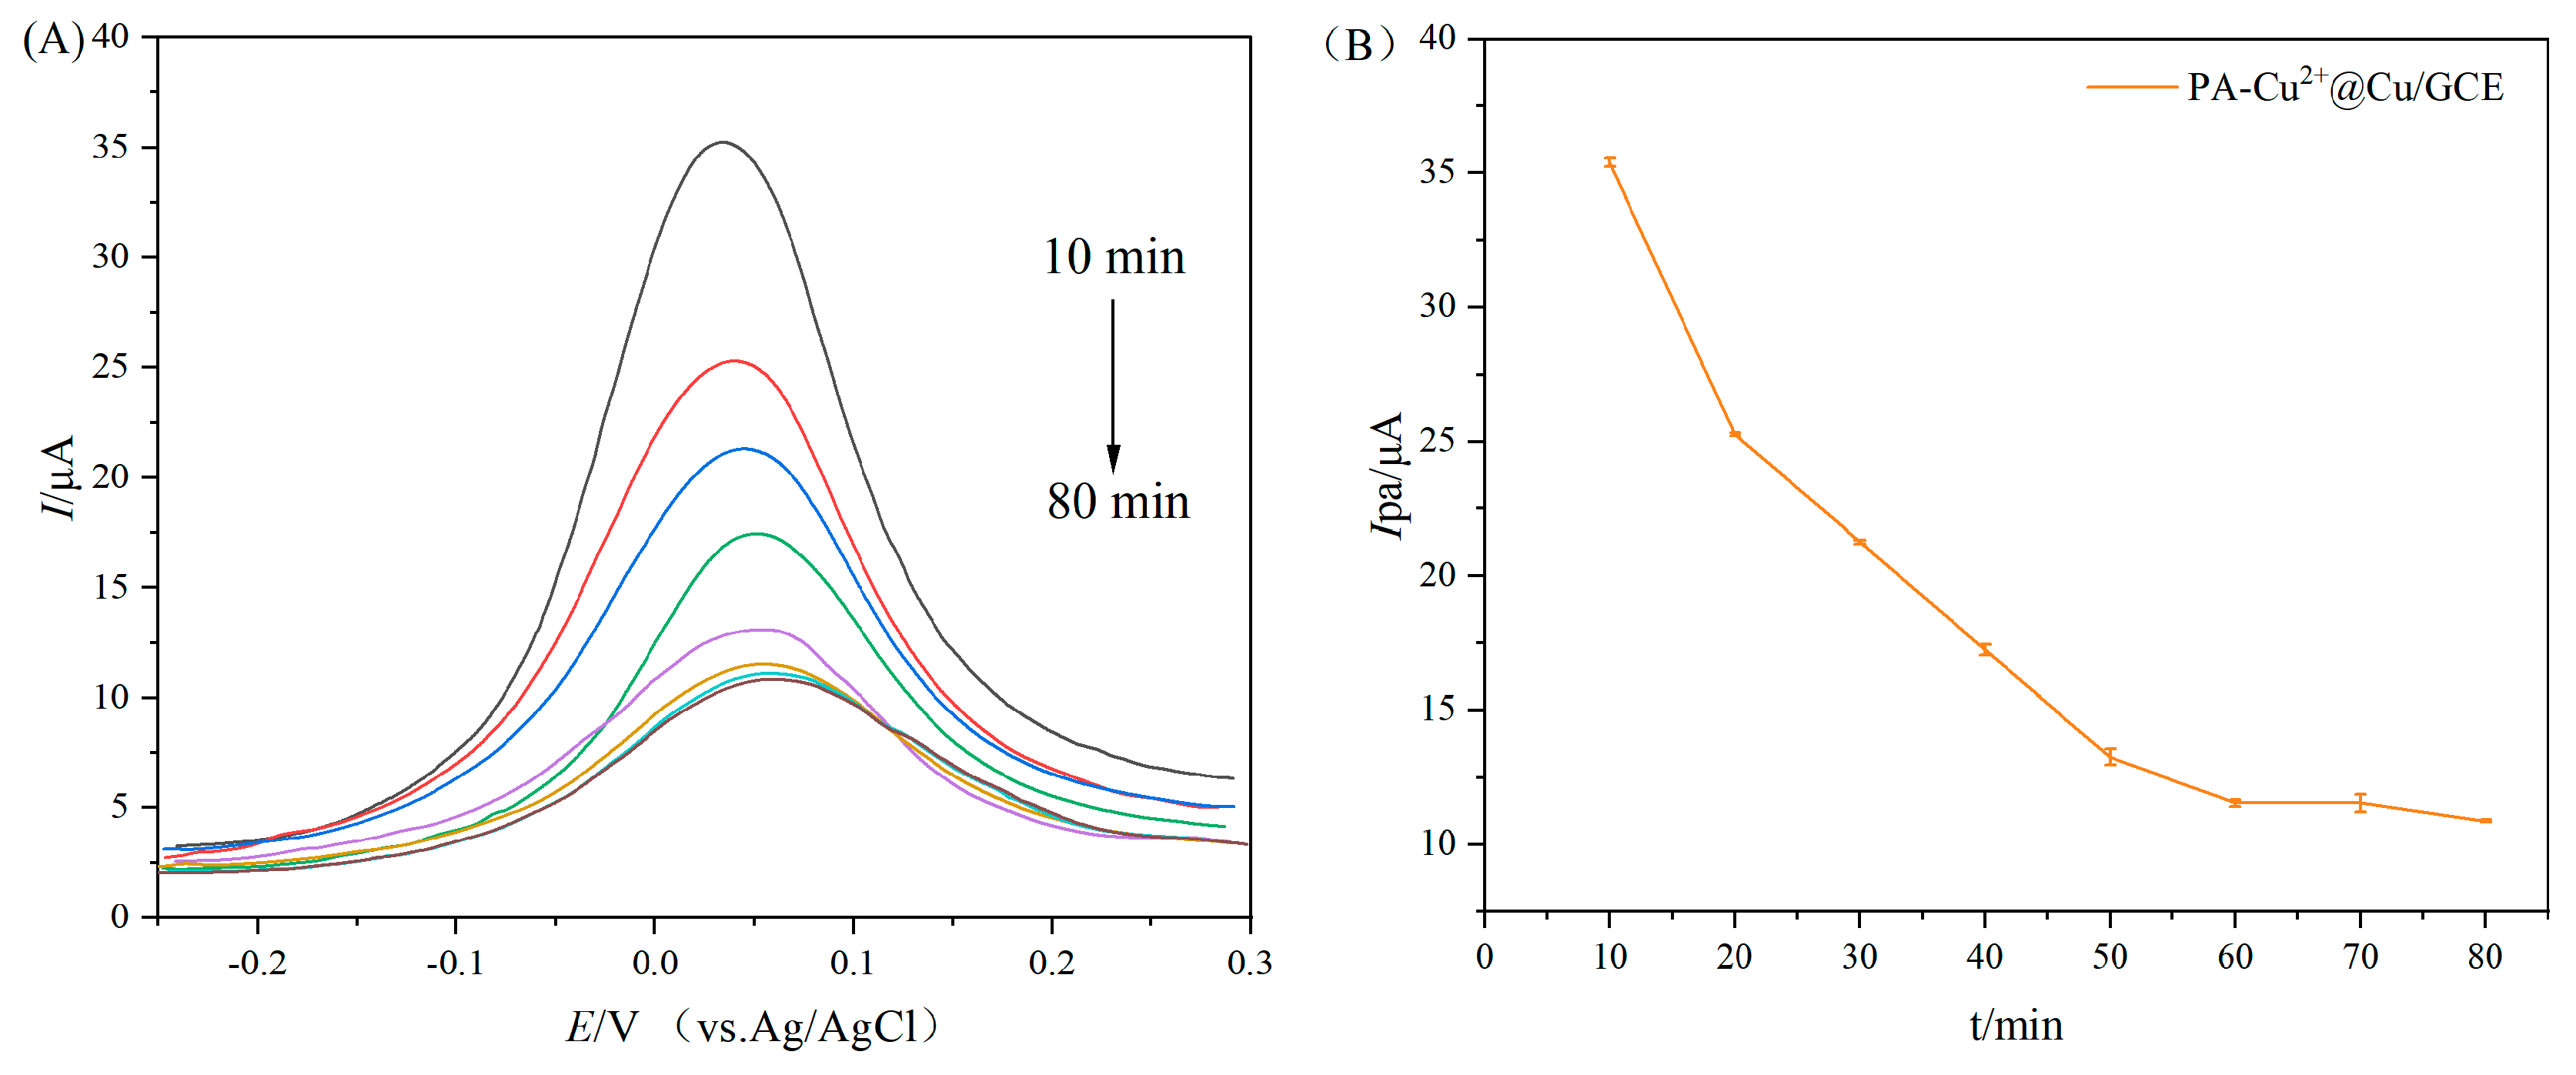
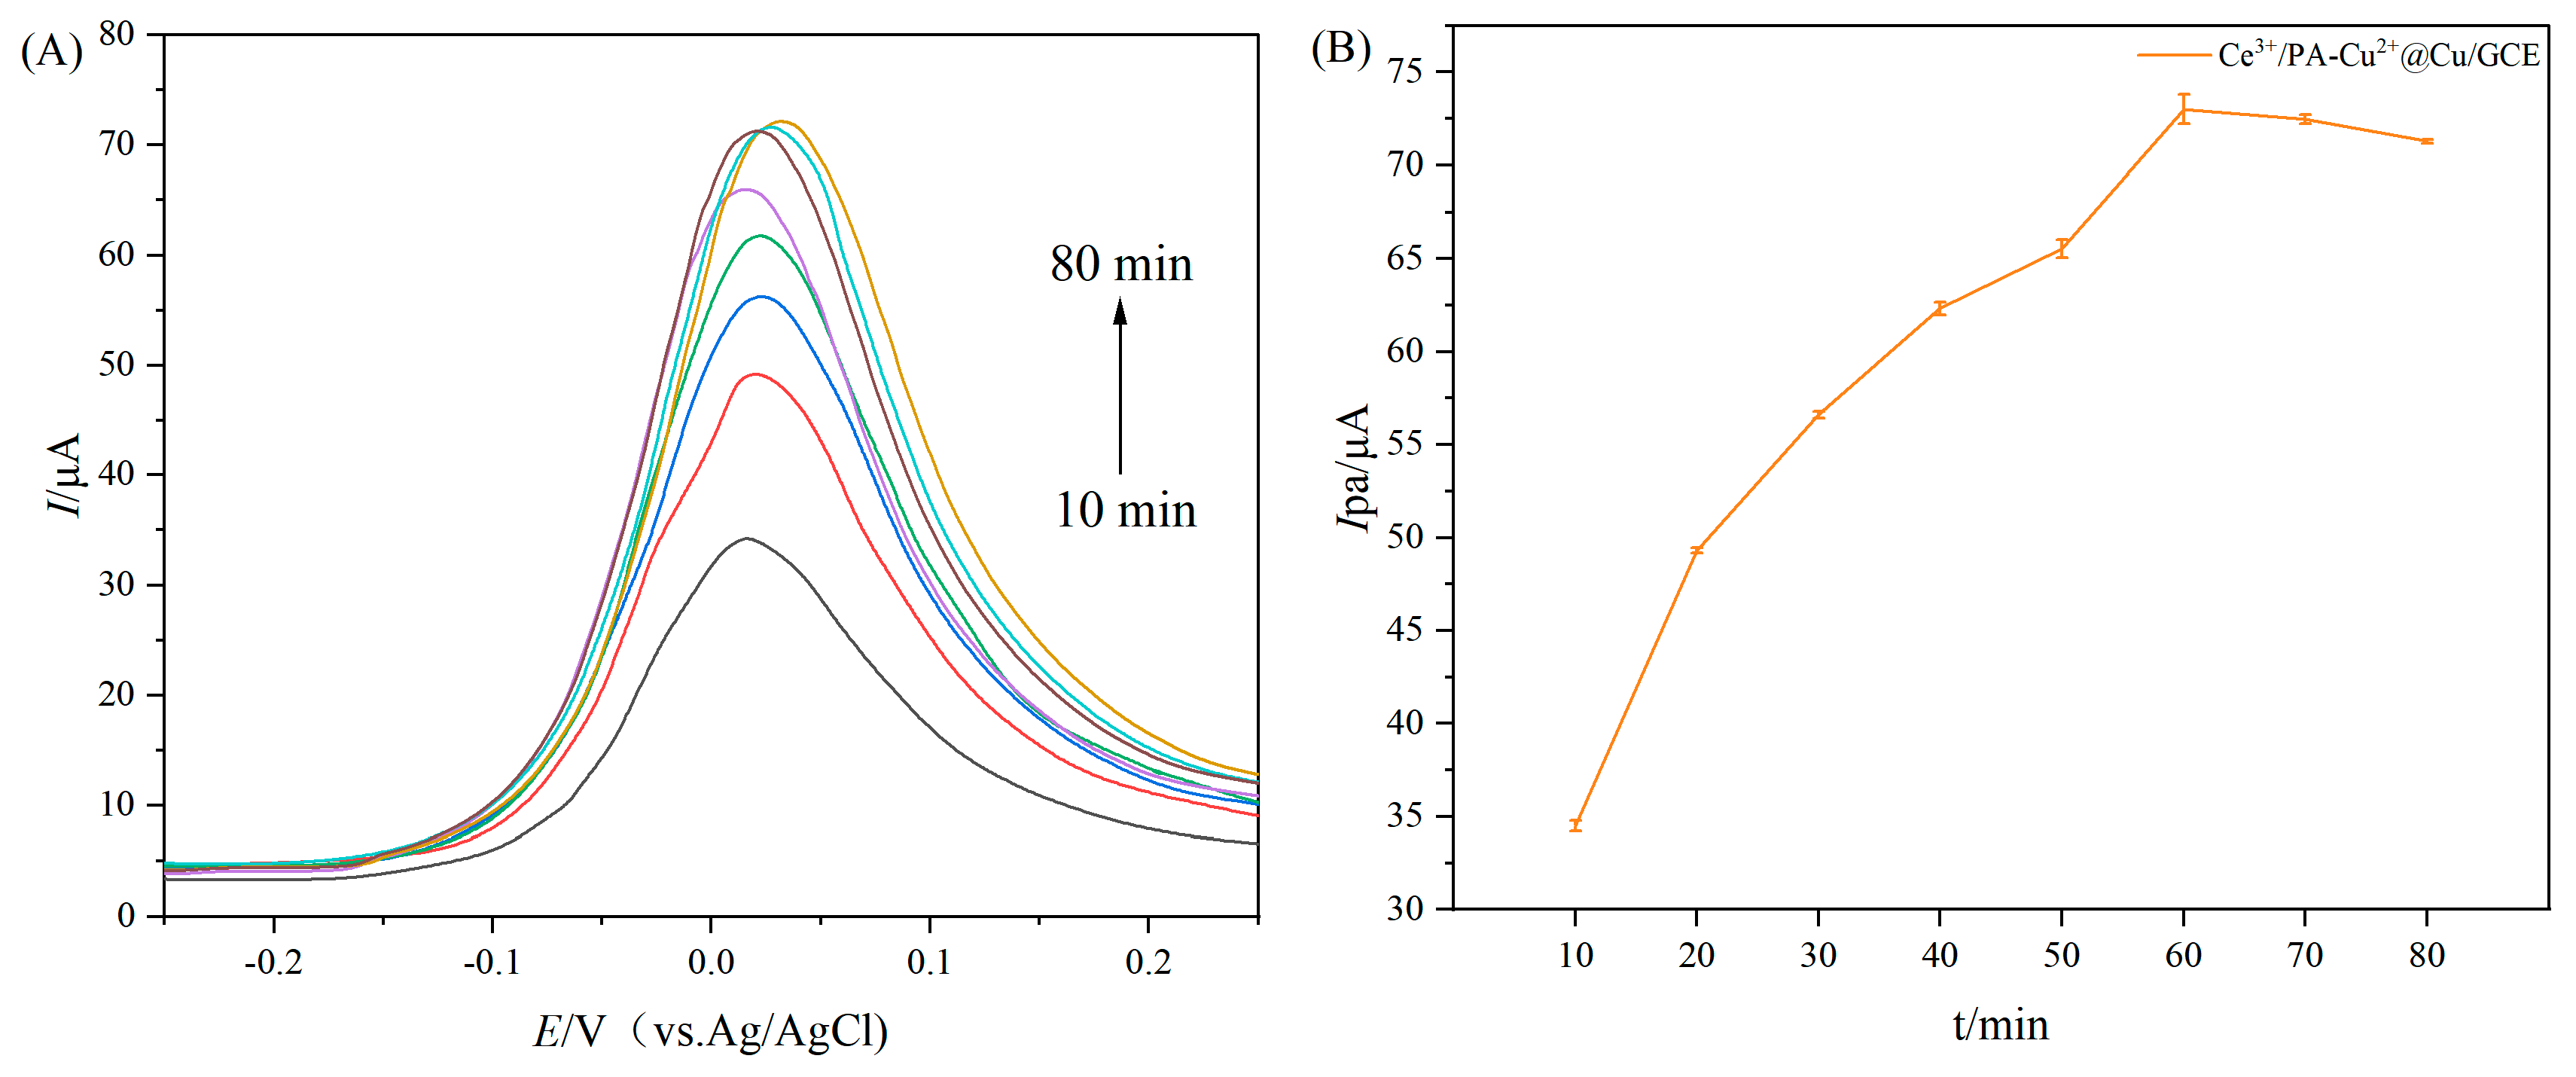
According to Section 4.6.2, the immersion time of the phytic acid solution was optimized. The results are shown in Figure 8. With the reaction time increasing from 10 min to 60 min, the peak oxidation current of PA-Cu2+@Cu/GCE gradually decreased, reflecting the layer-by-layer adsorption of PA molecules on the copper surface. When the reaction time exceeds 45 min, PA molecules form a multilayer adsorption via chelation, forming a dense, insulating layer on the copper surface that hinders the diffusion and mass transfer of H2O2. When the reaction time reaches 60 min, the oxidation peak current tends to stabilize, indicating that the coordination etching process of PA and copper reaches a dynamic equilibrium. At this time, PA molecules thoroughly coat Cu nanoparticles through coordination, forming PA-Cu2+@Cu structure. When the reaction time reaches 80 min, the current shows no significant change, indicating that the PA etching process has been completed and that excessive PA adsorption has no further effect on the electrode characteristics. Therefore, 60 min is selected as the optimal reaction time for PA-Cu2+@Cu/GCE.

2.3.3. Ce3+ Recombination Time Optimization

According to Section 4.6.3, the reaction time of Ce3+ is optimized. The results are shown in Figure 9. When the modification time is 10–60 min, the peak oxidation current of Ce3+/PA-Cu2+@Cu/GCE gradually increases, reflecting the layer-by-layer adsorption process on its surface. Ce3+ is adsorbed on the carboxylic acid group of PA through electrostatic action at 10–30 min, forming monolayer coverage. When the modification time exceeds 45 min, Ce3+ forms a ternary complex with PA through coordination, and the electron mobility increases. When the modification time reached 60 min, the oxidation current peak reached its maximum, indicating that Ce3+ adsorption had saturated. When the modification time was extended to 80 min, the current decreased slightly, due to decreased active sites resulting from excessive Ce3+ aggregation, and the rate was affected. Therefore, Ce3+ reaction time of 60 min was selected as the optimum reaction time.

2.3.4. Optimization of Reaction Time of Ce3+-Phytic Acid-Cu2+@Cu Composite to H2O2

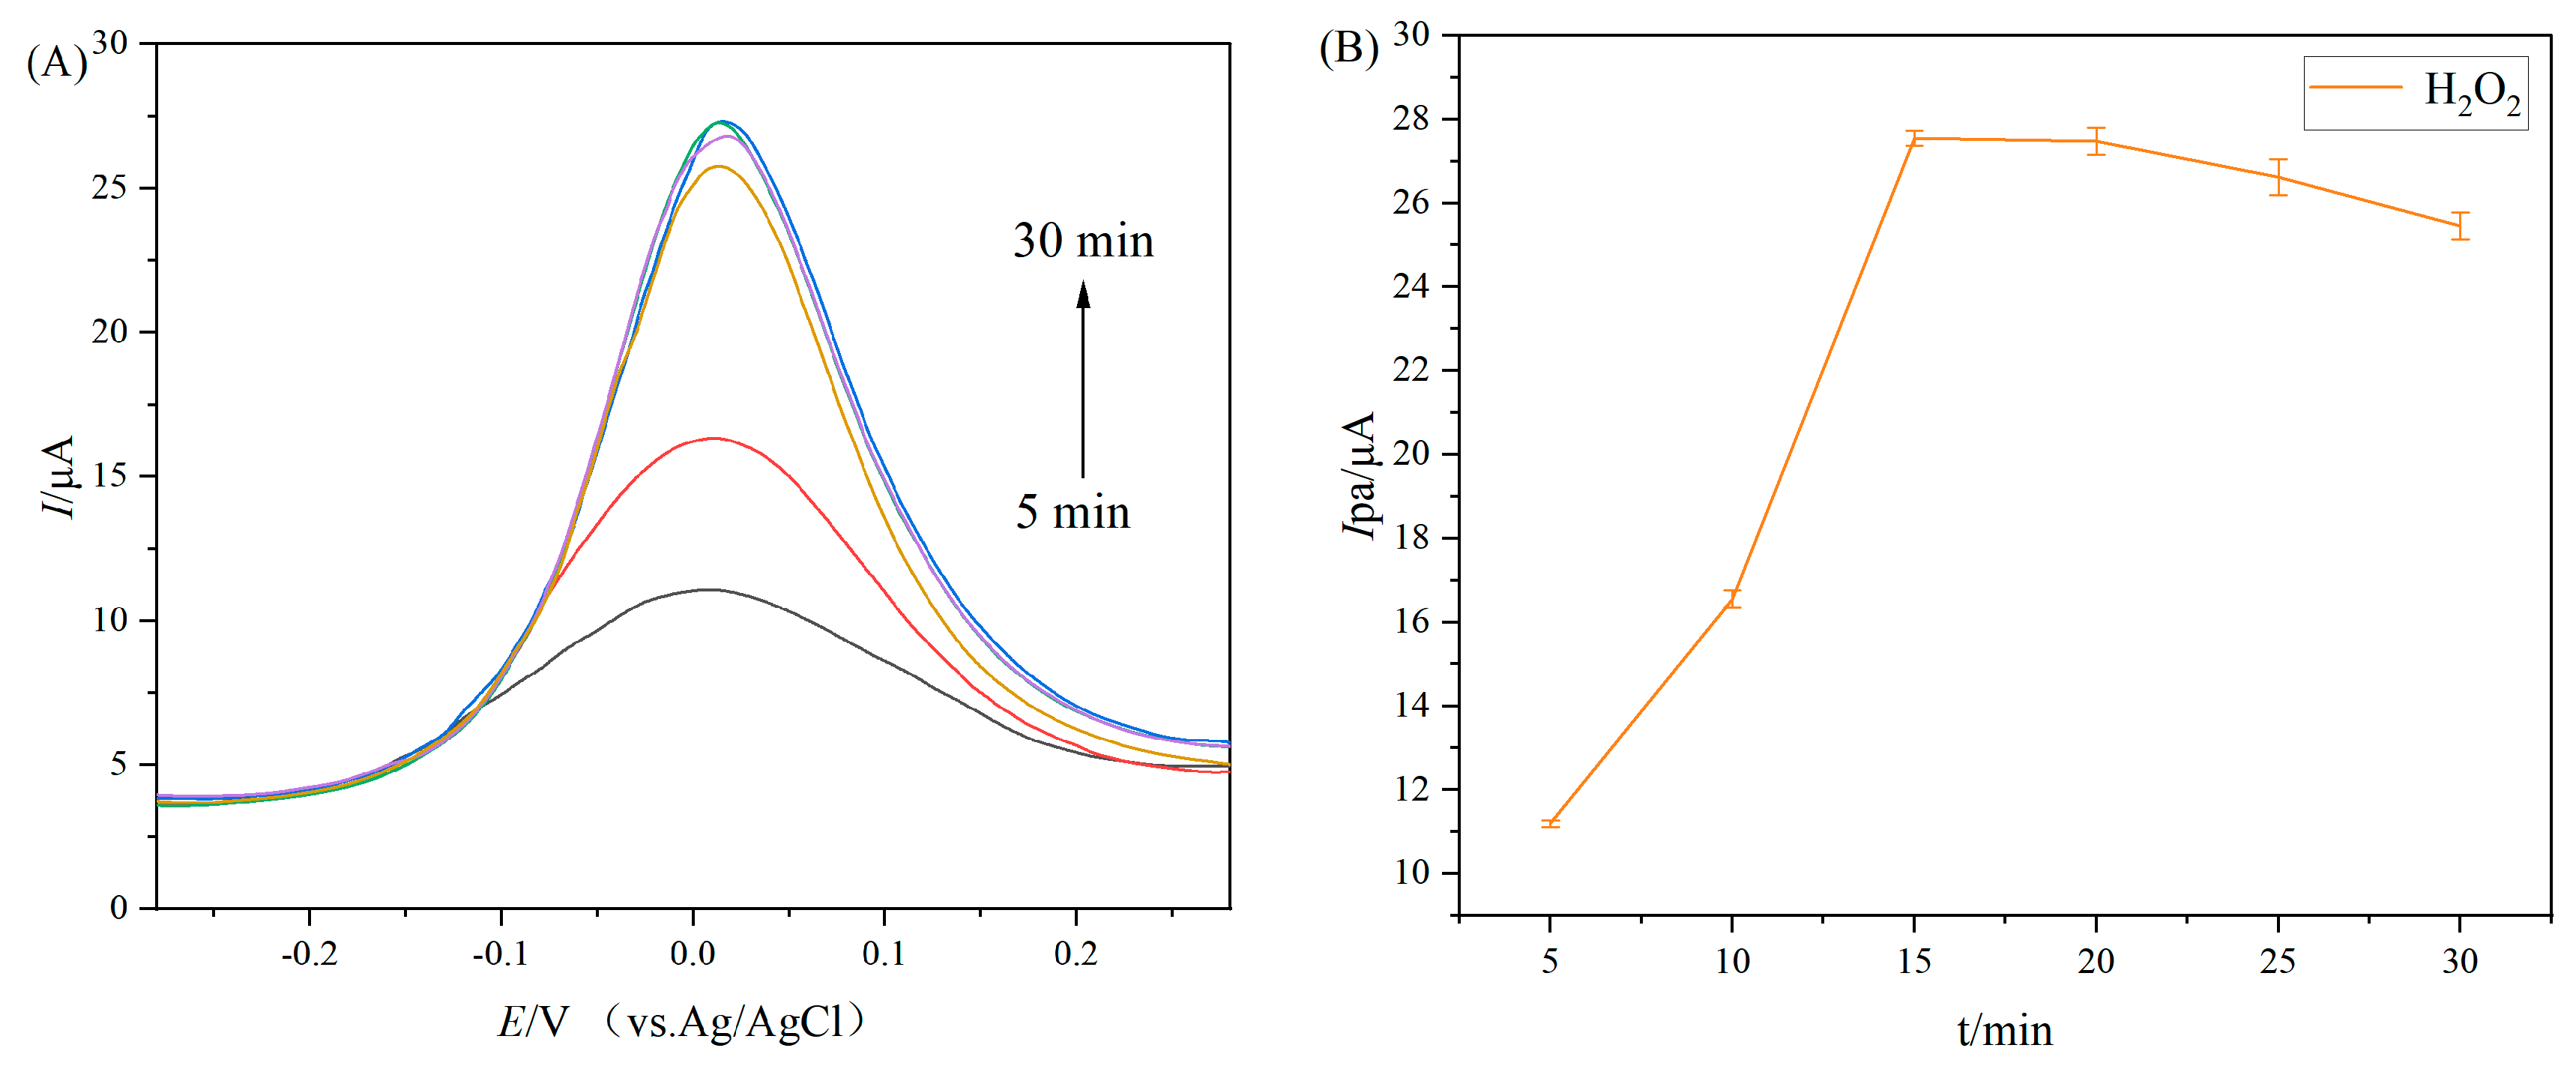
According to Section 4.6.4, select a different time to optimize H2O2, carry out SWV test on it and plot the curve. The results are shown in Figure 10. In 5–10 min, the oxidation of Ce3+ increases the charge density at the electrode surface, which is beneficial for the diffusion and mass transfer of H2O2. When the reaction time was 15 min, the oxidation current peak reached its maximum, indicating that the reaction between Ce3+ and H2O2 had reached dynamic equilibrium. At this time, Ce3+/4+ mixed oxide layer was formed on the electrode surface, which accelerated the electron transfer during the redox cycle. When the reaction time was 30 min, the current decreased slightly due to surface passivation and the aggregation and reduction of active sites caused by excessive Ce4+ accumulation. Therefore, 15 min was chosen as the reaction time of H2O2.

2.4. Linear Range and Detection Limit Analysis of Ce3+/PA-Cu2+@Cu/GCE for H2O2 Detection

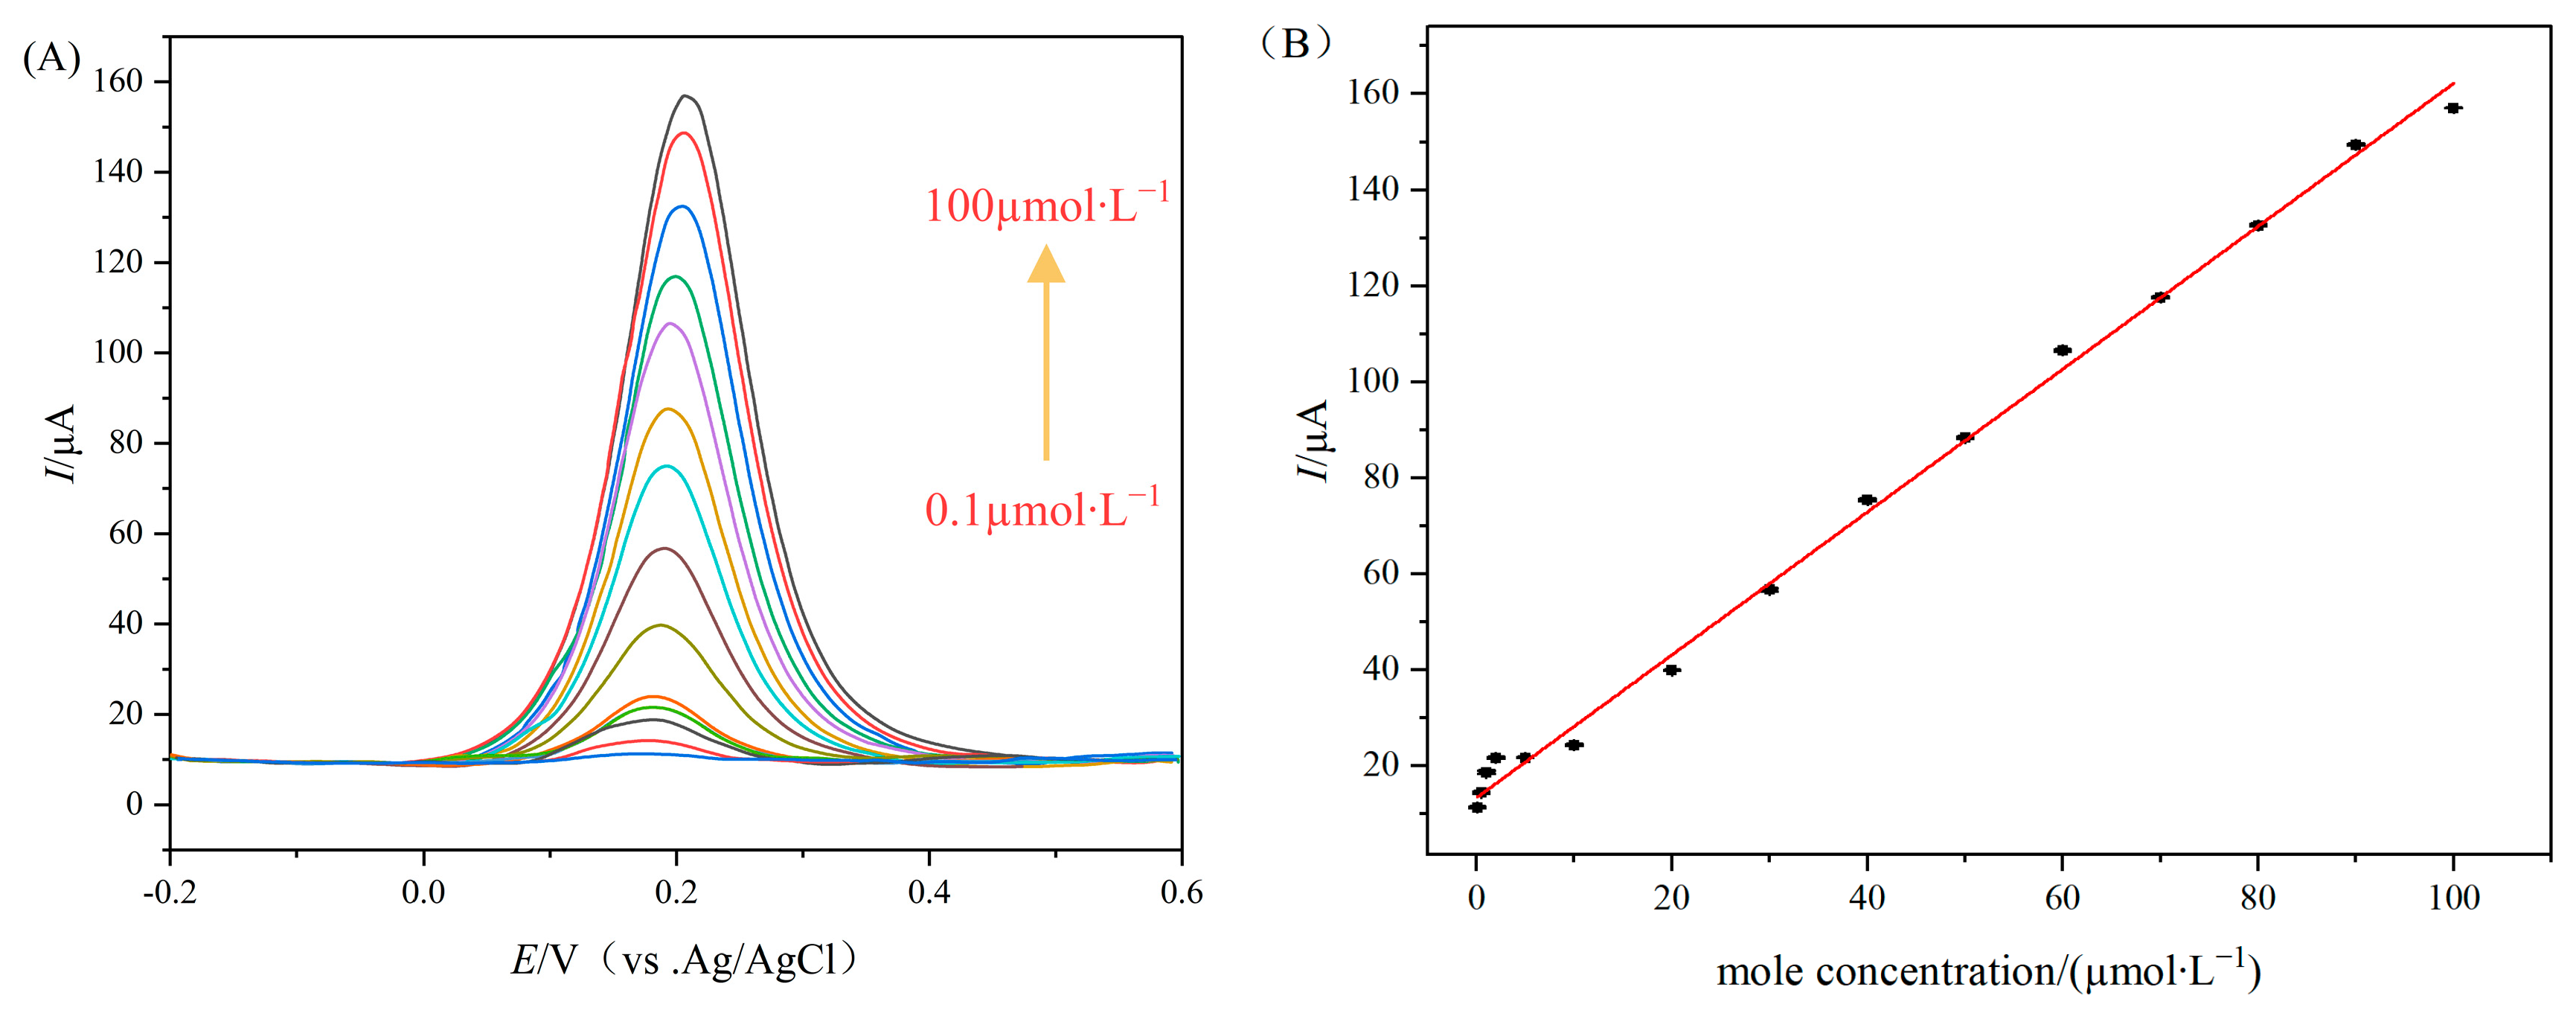
To systematically evaluate the performance of Ce3+/PA-Cu2+@Cu/GCE sensors for detecting H2O2, electrodes were tested over the H2O2 concentration range of 0.1 μmol·L−1 to 100 μmol L−1 using optimized experimental parameters. The study was conducted using the DPV method in 0.1 mol·L−1 PBS (pH 6.8) and the results are shown in Figure 11. It should be noted that the peak oxidation current (vs. Ag/AgCl) of Ce3+/PA-Cu2+@Cu/GCE electrode at 0.21 V increased significantly with the increase in H2O2 concentration. In the range of 0.1 μmol·L−1–100 μmol·L−1, the peak oxidation current (IPa) has a good linear relationship with H2O2 concentration, and its linear equation is as follows:
I P a ( μ A ) = 1.46 C ( μ m o l · L − 1 ) + 13.34
Correlation coefficient R2 = 0.99. At S/N = 3, the limit of detection (LOD) is 0.89 μmol∙L−1, which is much lower than traditional enzyme-based sensors and has a wider detection range than many nanomaterial-based sensors. The detection limit reaches micromolar value, which is attributed to the high conductivity of copper nanoparticles and the synergistic effect of Ce3+/PA coordination network: copper nanoparticles provide a direct electron transfer pathway, Ce3+/Ce4+ redox coupling, H2O2 adsorption and activation enhance the electron transfer pathway. In addition, the sensor has a high sensitivity of 1.46 μA/(μmol∙L−1), which is attributed to the direct modification of copper nanoparticles as a signal source on the electrode surface, providing a direct electron transport path, so that electrons can be transferred more efficiently, thus enhancing the signal output, making the sensitivity better, indicating that the surface adsorption step controls the catalytic process.

2.5. Interference Substance Pair H2O2 Impact of Test Results

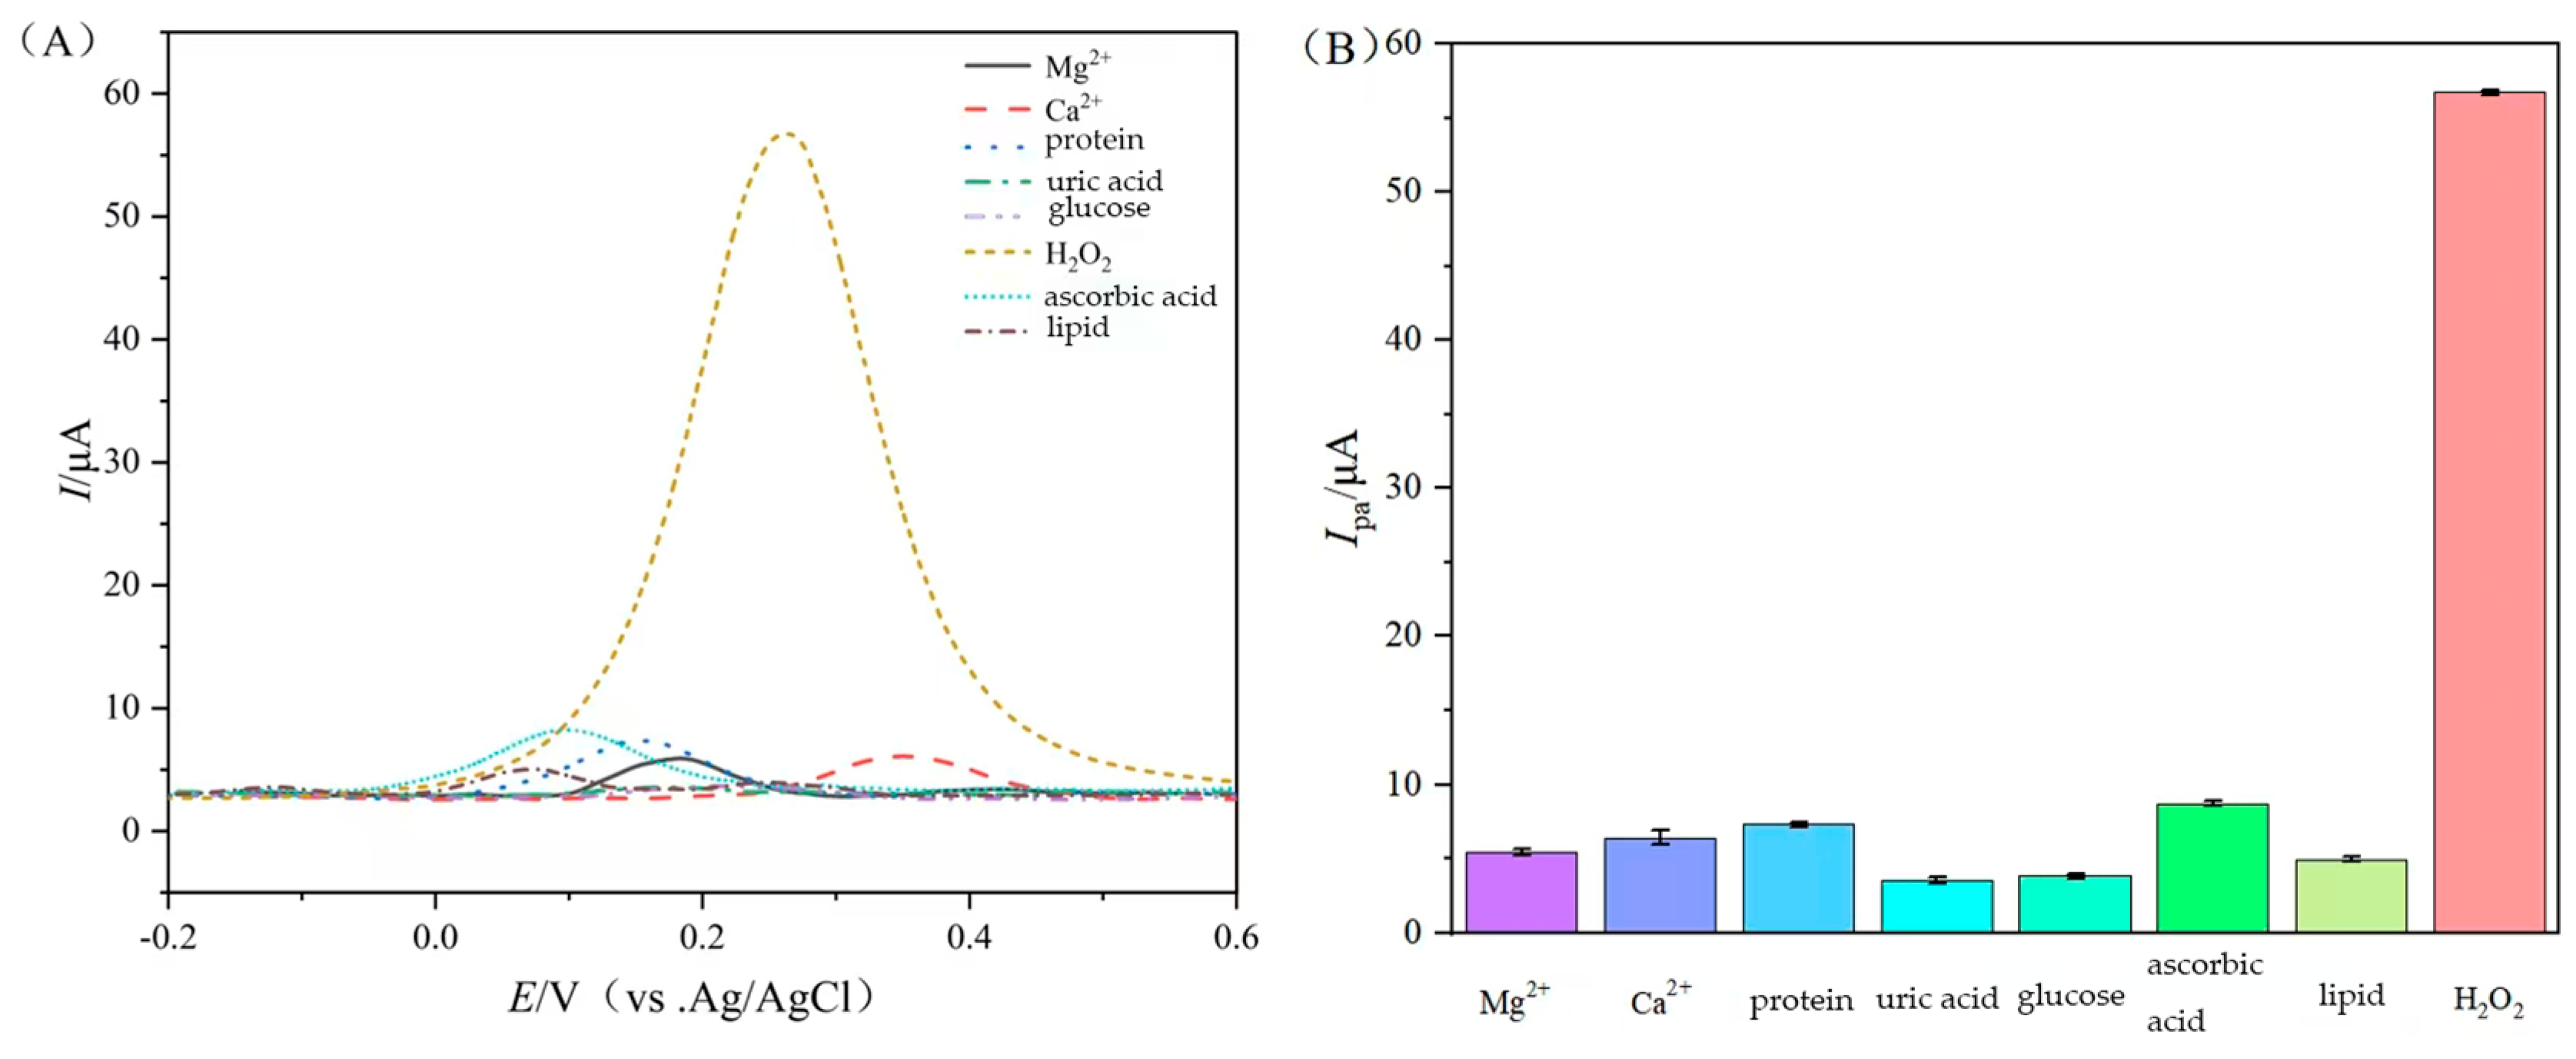
According to Section 4.7, selectivity tests were conducted on the sensor to examine whether the Ce3+/PA-Cu2+@Cu/GCE detection of H2O2 is affected by other substances. The results are shown in Figure 12, and the current response of the oxidation of interfering ions is lower than that of 10 μA, and H2O2 can be achieved at 56 μA. Obviously, with Ce3+/PA-Cu2+ @Cu/GCE constructed using the prepared composite nanomaterials, the sensor can effectively resist the interference of different substances, but also can selectively detect H2O2. Ce3+/PA-Cu2+@Cu/GCE energy and H2O2 for the specific reaction, and the change of the electrochemical signal of the sensor shows that the electrochemical sensor established in this experiment has a relatively good selectivity.

2.6. Reproducibility and Stability Analysis of Ce3+/PA-Cu2+@Cu/GCE

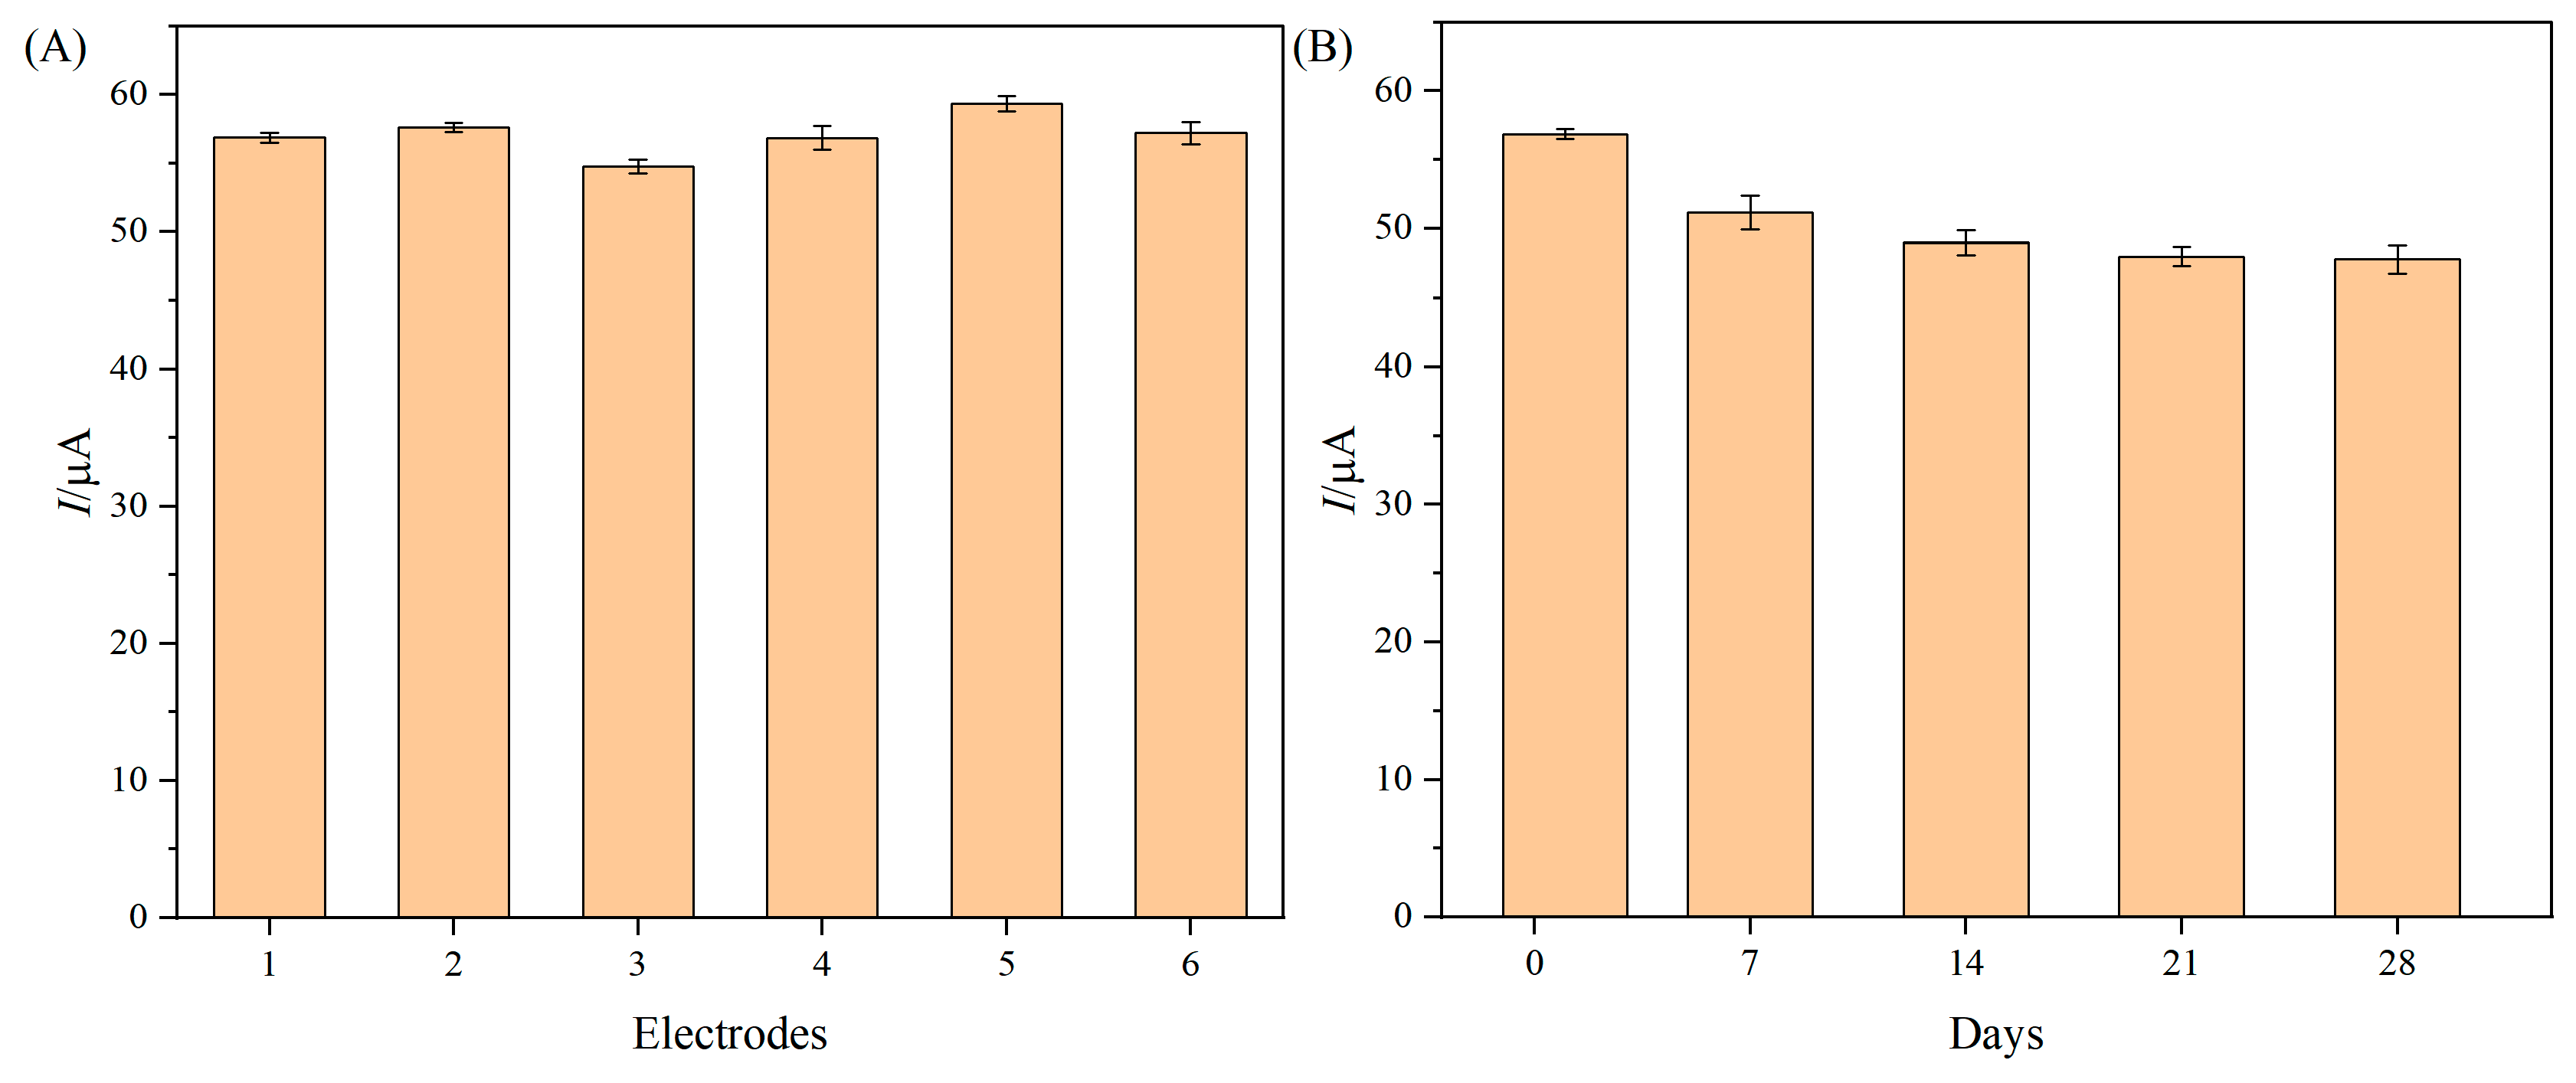
The reproducibility and stability of Ce3+/PA-Cu2+@Cu/GCE electrode were tested. See 4.9 for details. The results are shown in Figure 13. According to image (A), the current response differences among sensors are minimal, with an RSD of only 1.013%, indicating excellent reproducibility. According to the image (B), the peak current signal of H2O2 gradually decreases with the increase in storage time, and the decrease in amplitude is the largest in the first cycle. Then, the reduction in speed slows down, but even on the 28th day, the H2O2 current signal is still about 84%. The current retention rate of the sensor is 89.0% after 7 days in 60 °C oven and 88.6% after 7 days in 90% humidity. This study shows that Ce3+/PA-Cu2+@Cu/GCE has relatively good reproducibility and stability.

3. Discussion

In this study, a constant potential deposition method was used GCE surface preparation of copper nanoparticles, complexing Cu2+ by phytic acid (PA) etching was formed into a coordination film, and then Ce3+ was immobilized to construct a three-layer modified electrode. Through XRD, FT-IR characterization confirms the successful synthesis of the material by CV, EIS the electron transfer characteristics of the electrode interface were analyzed. Optimize and determine the best process conditions: cu time of electrodeposition 700 s, PA embellishment 60 min, Ce3+ coordination 60 min, H2O2 Reaction 15 min. The detection linearity range of the sensor for hydrogen peroxide is 0.1–100 μmol/L, detection limit is 0.89 μmol/L, good selectivity, sensitivity and reproducibility (RSD = 1.013%) and stability (retention of 84% response at 28 days).

4. Materials and Methods

4.1. Materials and Instruments

Sodium hydroxide (NaOH), ammonium sulfate ((NH4)2SO4), H2O2 (36–38%), phytic acid (PA), cerium nitrate hexahydrate (Ce(NO3)3), phosphate buffer solution (PBS, pH = 6.8).
X-ray diffractometer (Ultima IV, Rigaku Corporation, Tokyo, Japan), Fourier Transform Infrared spectrometer (NICOLETIS10, Thermo Fisher Scientific, Waltham, MA, USA), and electrochemical workstation (CHI 660E, CH Instruments Inc., Shanghai, China).

4.2. Pretreatment of Working Electrode

Polishing bare glassy carbon electrode (GCE): take a little polishing powder (Al2O3, particle size 0.05 μm) on the polishing plate (suede), drop a small amount of deionized water, and mix well with the insulating part of the glassy carbon electrode. After Al2O3 suspension is formed on a polishing disc, holding the glassy carbon electrode vertically, exerting uniform force on the elbow of the arm to make the glassy carbon electrode move slowly in suede, wherein the path is an ‘8’ shape, polishing the glassy carbon electrode for 2–3 min, grinding clockwise for about 100 circles, performing ultrasonic treatment in deionized water and ethanol solution for 30 s, respectively (power is 500 w), drying the electrode at room temperature after removing Al2O3 powder on the surface of the glassy carbon electrode and finishing pretreatment. Go to the next step [17].

4.3. Construction of Electroactive Ce3+-Phytic Acid-Cu2+@Cu Composite Electrochemical Sensor

4.3.1. Construction of Cu/GCE

Pretreat the electrode according to the Section 4.2. Immerse the pretreated polished GCE electrode in a mixture of 0.01 mol·L−1 CuSO4 and 0.5 mol·L−1 (NH4)2SO4, then apply a constant potential of−0.25 V (vs. Ag/AgCl) using potentiostatic chronoamperometry (It), and deposit for 700 s to form a copper nanoparticle-modified layer.

4.3.2. Construction of Phytic Acid-Cu2+@Cu/GCE Composite

The resulting Cu/GCE electrode was immersed in 10 mM phytic acid (PA) solution and incubated in a constant-temperature incubator at 37 °C for 1 h. After the reaction is complete, the resulting composite is gently washed with ultrapure water to remove unbound free phytic acid molecules and to prepare PA-Cu2+@Cu/GCE composites.

4.3.3. Construction of Ce3+/Phytic Acid-Cu2+@Cu/GCE Composite Sensor

The PA-Cu2+@Cu/GCE electrode was immersed in 20 mM Ce(NO3)3 solution, incubated at 37 °C for 1 h, and washed with ultrapure water to remove excess ions adsorbed on the surface, yielding the Ce3+/PA-Cu2+@Cu/GCE ternary composite electrochemical sensor.

4.4. Testing and Characterization of Cerium-Based Nanocomposites

4.4.1. X-Ray Diffractometer (XRD) Determination Method

To analyze the surface morphology of the cerium-based nanocomposites prepared above, X-ray diffraction (XRD) was used. XRD test can effectively characterize the crystal structure, elemental composition, and micro-morphology of adsorption materials, and qualitatively and quantitatively analyze the materials [18]. Phase analysis was performed using an Ultima IV X-ray diffractometer from Rigaku, equipped with a Cu Kα source (λ = 1.5406 A). The parameters were set as follows: the scanning range 2θ was 5°~80°, the step size was 0.02°, and the scanning speed was 4°/min. Experimental data were analyzed using JADE 6.5 software and integrated with the International Crystal Database (ICSD) for matching and structural refinement.

4.4.2. Fourier Transform Infrared (FT-IR) Determination Method

Fourier Transform Infrared spectroscopy (FT-IR) can qualitatively identify chemical components, reveal molecular binding characteristics, and functional group structure information [19]. In this study, the cerium-based nanocomposites were tested by a Thermo Scientific NICOLETIS10 Fourier Transform Infrared spectrometer equipped with DTGS detector and KBr beam splitter, scanning range 4000–200 cm−1, resolution 4 cm−1, scanning cycle 32 times. Cerium-based nanocomposites were tested. The sample was prepared by the KBr tabletting method: 1–2 mg of adsorbent powder and 200 mg of dried KBr crystals were placed in an agate mortar, ground thoroughly, and stirred (10 min) to a particle size of 2 μm, and then maintained at a pressure of 10 MPa for 3 min using a tabletting machine until transparent flakes were formed. The prepared samples were pretreated in a vacuum oven (60 °C, 2 h) for spectrum acquisition. At the end of the experiment, Origin 2021 software was used to perform baseline correction and peak position resolution on the data, and functional group assignment analysis was performed in combination with the OMNIC spectrum library. To eliminate external interference, all studies were conducted in a test chamber at constant temperature and humidity (25 ± 1 °C, 45% RH), and the average spectrum of each sample was calculated from the three spectral bands.

4.4.3. Determination Method of Electrochemical Cyclic Voltammetry (CV)

A three-electrode system was used, in which a glassy carbon electrode (GCE, ϕ = 3 mm) modified by cerium-based nanocomposite was used as the working electrode, Ag/AgCl as reference electrode, platinum column as auxiliary electrode, and 0.1 mol·L−1 KCl solution (containing 5.0 mmol·L−1 K3[Fe(CN)6]) as electrolyte. Cyclic voltammetry (CV) was performed using a CHI 660E electrochemical workstation with a scan rate of 100 mV·s−1 and a measurement potential range of −0.2 V to 1 V (vs. Ag/AgCl). Before testing, each electrode was run through an unloaded electrolyte to a stable baseline, and an average curve was recorded over three consecutive cycles for formal testing.

4.4.4. Electrochemical AC Impedance (EIS) Measurement Method

A three-electrode working system (same as Section 4.4.3) was adopted, electrochemical impedance spectroscopy (EIS) was used to characterize the electrode interface resistance, and 5.0 mol L−1 K3[Fe(CN)6] and 5.0 mol L−1 K4[Fe(CN)6] 0.1 mol L−1 KCl were used as electrolyte solution, frequency range was selected from 10−2 to 105 Hz, AC amplitude was 5 mV, and open circuit potential was 0.2 V (vs. Ag/AgCl). RLC equivalent circuit model, including solution resistance (Rs), charge transfer resistance (Rct), and double layer capacitance (Cdl) was fitted, and impedance spectrum was analyzed by ZSimpWin software. By comparing changes in the charge transfer resistance (Rct) at the electrode surface with the image characteristics, the influence of the modified layer on the electron transfer process at the electrode interface was evaluated, and the loading state of the functional materials was preliminarily determined. Calibrate the electrochemical workstation before testing, and perform cyclic voltammetry scanning (100 mV·s−1) in blank electrolyte to confirm that the background current of electrodes is stable (≤10 μA). Test each electrode in parallel three times and take the average value.

4.5. Feasibility of Cerium-Based Nanocomposite Electrochemical Sensor for H2O2 Detection

4.5.1. Cyclic Voltammetry to Verify the Feasibility of Cerium-Based Nanocomposite Electrochemical Sensor for H2O2 Detection

In preliminary experiments, a pH 6.8 and CV scan rate of 100 mV·s−1 were determined for phosphate-buffered saline (PBS). CV was used to evaluate the catalytic performance of different modified electrodes for H2O2, and the test was performed in a three-electrode system (as in Section 4.4.3). The electrolyte was 50 μmol L−1 H2O2 in 0.1 mol L−1 PBS (pH 6.8), cycled 5 times over the potential range of −0.2 V to 0.6 V (vs. Ag/AgCl) (third curve for analysis). To verify the feasibility of detection, different modified electrodes were compared simultaneously. The data were recorded using CHI 660E workstation software, and the experimental results were plotted using Origin 2021 software.

4.5.2. Square Wave Voltammetry to Verify the Feasibility of Cerium-Based Nanocomposite Electrochemical Sensor for H2O2 Detection

Square wave voltammetry (SWV) was used to evaluate the detection performance of the modified electrode for H2O2. The test was carried out in a three-electrode system (same as Section 4.4.3), and the electrolyte solution was 0.1 mol L−1 PBS (pH = 6.8) containing 50 μmol L−1 H2O2. SWV parameters were set as follows: potential window: −0.3 V~0.3 V (vs. Ag/AgCl), pulse amplitude: 4 mV, sweep amplitude: 25 mV, frequency: 15 Hz. To verify the feasibility of detection, a comparison experiment using different modified electrodes with the same index was conducted. The oxidation peak currents were recorded on a CHI 660E electrochemical workstation, baseline-corrected, and peak-fitted using Origin 2021.

4.6. Optimization of Construction Conditions of Electroactive Ce3+-Phytic Acid-Cu2+@Cu Composite Electrochemical Sensor

To obtain the best analytical performance of the H2O2 biosensor method based on the Ce3+/PA-Cu2+@Cu/GCE electrode, under the pre-experimental conditions, the substrate solution was selected as a PBS buffer solution (pH 6.8) with a H2O2 concentration of 50 μmol∙L−1, and the SWV parameters were set to potential window: −0.3 V~0.3 V (vs. Ag/AgCl), pulse amplitude: 4 mV, scan amplitude: 25 mV, and frequency: 15 Hz. Under the conditions, different factors were optimized, respectively.

4.6.1. Time Optimization of Cu Electrodeposition

Cu/GCE electrode was prepared according to Section 4.3.1. The oxidation peak current value of SWV in the substrate solution was used as index. The immersion time of fixed phytic acid solution was 60 min, Ce3+ complex time was 60 min, H2O2 reaction time was 10 min, and different electrodeposition times (100 s, 200 s, 300 s, 400 s, 500 s, 600 s, 700 s, 800 s) were optimized.

4.6.2. Optimization of Soaking Time of Phytic Acid Solution

PA-Cu2+@Cu/GCE electrode was prepared by Section 4.3.2. Taking the oxidation peak current value of SWV to substrate solution as index, the fixed electrodeposition time of Cu was 600 s, Ce3+ recombination time was 60 min, and H2O2 reaction time was 10 min. Different immersion times (10 min, 20 min, 300 min, 400 min, 50 min, 60 min, 70 min, 80 min) of phytic acid solution were optimized, respectively.

4.6.3. Ce3+ Recombination Time Optimization

Ce3+/PA-Cu2+@Cu/GCE electrode was prepared by Section 4.3.3. Taking the oxidation peak current value of SWV to substrate solution as index, the fixed electrodeposition time of Cu was 600 s, the immersion time of phytic acid solution was 60 min, and the reaction time of H2O2 was 10 min. The Ce3+ recombination times (10 min, 20 min, 300 min, 400 min, 50 min, 60 min, 70 min, 80 min) were optimized.

4.6.4. Optimization of Reaction Time of Ce3+-Phytic Acid-Cu2+@Cu Composite to H2O2

On the basis of the pre-experiment, the oxidation peak current of SWV to the substrate solution was taken as index, the time of Cu electrodeposition was fixed at 600 s, the immersion time in phytic acid solution was 60 min, and the Ce3+ recombination time was 60 min. The reaction time with H2O2 substrate was optimized, respectively (5 min, 10 min, 15 min, 20 min, 25 min, 30 min).

4.7. The Linear Range and Detection Limit of Cerium-Based Nanocomposite Electrochemical Sensors for H2O2 Detection

To explore the analytical performance of the sensor for H2O2 detection, under the optimized optimal experimental conditions, the cerium-based nanocomposite electrochemical sensor was placed in a 10 mmol∙L−1 PBS buffer (pH = 6.8) containing different concentrations of H2O2 (ranging from 0.1 μmol∙L−1 to 100 μmol∙L−1) solution for reaction. The electrochemical signal was detected by differential pulse voltammetry (DPV), and the oxidation peak current value was recorded. Each concentration point was tested in parallel three times, and the average response value was taken. DPV test parameters: potential window: −0.2 V to 0.8 V (vs. Ag/AgCl); pulse amplitude: 50 mV; scanning step size: 4 mV; pulse width: 50 ms.

4.8. The Influence of Interfering Substances on the Detection Results of H2O2

In practical applications, selectivity is one of the key performance indicators of sensors. To evaluate the specificity of the sensor in detecting H2O2 in this study and determine whether other substances would interfere with it, we selected representative interfering substances related to common components in milk beverages, including common inorganic ions (Ca2+, Mg2+), glucose, uric acid, lipids, proteins and ascorbic acid. Prepare 10 mmol∙L−1 PBS buffer solution containing H2O2 (pH = 6.8) and buffer solution containing interfering ions, respectively. Make the concentration ratio of the interfering substance to H2O2 100:1. In the study, differential pulse voltammetry (DPV) was used, and the parameters were the same as those in Section 4.7. Before each test, the sensor is stabilized in the solution for 30 s, and then a DPV scan is performed and the oxidation peak current value is recorded. Analyze the results to determine the influence of different interfering substances on the sensor.

4.9. Detection of Reproducibility and Stability of Cerium-Based Nanocomposite Electrochemical Sensors

To evaluate the consistency among sensor packages, six glassy carbon electrodes (GCE, ϕ = 3 mm) were selected for this experiment and pretreated according to the method described in 4.2. Cerium-based nanocomposite electrochemical sensors were fabricated in parallel according to the optimized parameters, and DPV analysis was conducted in PBS electrolyte containing 20 μmol∙L−1 H2O2 (pH value 6.8) (with a potential difference window of 0.2–0.8 V (vs. Ag/AgCl), pulse amplitude 50 mV, scanning step size 4 mV. Calculate the relative standard deviation (RSD) of the response currents of the six electrodes to check the reproducibility.
In addition, the improved electrode was sealed in silica gel desiccant and stored in a light-proof area (25 ± 2 °C, humidity ≤ 40% RH), activated with blank PBS solution, and the current response to PBS buffer solution containing 20 μmol∙L−1 H2O2 solution was measured on days 1, 7, 14, 21, and 28. Use the same DPV parameters. Long-term stability is evaluated by calculating the current retention rate.

Author Contributions

B.D.: Conceptualization, methodology, writing—review and editing. M.L. (Minrong Li): Writing and visualization. M.L. (Mingyu Li): Writing and visualization. Y.W.: Supervision and project administration. J.J.: Experimentation and data curation. Y.L.: Formal analysis. All authors have read and agreed to the published version of the manuscript.

Funding

The present study was supported by the Heilongjiang Provincial Education Department Youth Innovation Talent Project (2023-KYYWF-1063) and 2025 Heilongjiang Province Ecological and Environmental Protection Scientific Research Project (HST2025S010).

Institutional Review Board Statement

Not applicable.

Informed Consent Statement

Not applicable.

Data Availability Statement

The original contributions presented in this study are included in the article. Further inquiries can be directed to the corresponding author(s).

Conflicts of Interest

The authors declare no conflicts of interest. The funders had no role in the design of the study; in the collection, analyses, or interpretation of data; in the writing of the manuscript; or in the decision to publish the results.

References

  1. Hsu, C.-L.; Chang, K.-S.; Kuo, J.-C. Determination of hydrogen peroxide residues in aseptically packaged beverages using an amperometric sensor based on a palladium electrode. Food Control 2007, 19, 223–230. [Google Scholar] [CrossRef] [Scilit]
  2. Chiu, T.-C.; Huang, C.-C. Aptamer-Functionalized Nano-Biosensors. Sensors 2009, 9, 10356–10388. [Google Scholar] [CrossRef] [Scilit] [PubMed]
  3. Sehit, E.; Drzazgowska, J.; Buchenau, D.; Yesildag, C.; Lensen, M.; Altintas, Z. Ultrasensitive nonenzymatic electrochemical glucose sensor based on gold nanoparticles and molecularly imprinted polymers. Biosens. Bioelectron. 2020, 165, 112432. [Google Scholar] [CrossRef] [Scilit] [PubMed]
  4. Fan, X.; Wang, S.; Li, Z.; Wang, Y.; Fan, X.; Yu, L. An Electrochemiluminescence Biosensor for the Determination of Mercury Ion via Dual-Amplification Strategy. J. Braz. Chem. Soc. 2020, 31, 2620–2627. [Google Scholar] [CrossRef] [Scilit]
  5. Xu, X.; Niu, X.; Li, X.; Li, Z.; Du, D.; Lin, Y. Nanomaterial-based sensors and biosensors for enhanced inorganic arsenic detection: A functional perspective. Sens. Actuators B Chem. 2020, 315, 128100. [Google Scholar] [CrossRef] [Scilit]
  6. Zong, C.; Jin, X.; Liu, J. Critical review of bio/nano sensors for arsenic detection. Trends Environ. Anal. Chem. 2021, 32, e00143. [Google Scholar] [CrossRef] [Scilit]
  7. Qian, L.; Durairaj, S.; Prins, S.; Chen, A. Nanomaterial-based electrochemical sensors and biosensors for the detection of pharmaceutical compounds. Biosens. Bioelectron. 2021, 175, 112836. [Google Scholar] [CrossRef] [Scilit] [PubMed]
  8. Kim, D.-M.; Go, M.-J.; Lee, J.; Na, D.; Yoo, S.-M. Recent Advances in Micro/Nanomaterial-Based Aptamer Selection Strategies. Molecules 2021, 26, 5187. [Google Scholar] [CrossRef] [Scilit] [PubMed]
  9. Li, Y.; Yin, P.; Zhang, Y.; Zhang, R. Synthesis of honeycomb Ag@CuO nanoparticles and their application as a highly sensitive and electrocatalytically active hydrogen peroxide sensor material. Anal. Methods 2022, 14, 4842–4850. [Google Scholar] [CrossRef] [Scilit] [PubMed]
  10. Manibalan, G.; Murugadoss, G.; Krishnamoorthy, D.; Dharuman, V.; Peera, S.G. Sensitive and Selective Electrochemical Detection of Hydrogen Peroxide Using a Silver-Incorporated CeO2/Ag2O Nanocomposite. Biosensors 2025, 15, 617. [Google Scholar] [CrossRef] [Scilit] [PubMed]
  11. Yang, L.; Wang, H.; Lü, H.; Hui, N. Phytic acid doped poly(3,4-ethylenedioxythiophene) modified with copper nanoparticles for enzymeless amperometric sensing of glucose. Microchim. Acta 2019, 187, 49. [Google Scholar] [CrossRef] [Scilit] [PubMed]
  12. Hamid, A.J.; Hadi, M.-M.; Ahmad, R.; Sanaz, H.; Ehsan, A. Development of an electrochemical sensor based on Ce3+ and CuO for the determination of amaranth in soft drinks. Microchem. J. 2022, 183, 108081. [Google Scholar]
  13. Costantino, F.; Ienco, A.; Gentili, P.L.; Presciutti, F. Synthesis, X-ray Powder Structure, and Photophysical Properties of Three New Ce(III) Sulfate-Diaminotetraphosphonate-Based Coordination Polymers. Cryst. Growth Des. 2010, 10, 4831–4838. [Google Scholar] [CrossRef] [Scilit]
  14. Zhang, T.; Liu, J.; Wang, D.; Zhao, Z.; Wei, Y.; Cheng, K.; Jiang, G.; Duan, A. Selective catalytic reduction of NO with NH3 over HZSM-5-supported Fe–Cu nanocomposite catalysts: The Fe–Cu bimetallic effect. Appl. Catal. B Environ. 2014, 148, 520–531. [Google Scholar] [CrossRef] [Scilit]
  15. Li, R.; Liang, H.; Zhu, M.; Lai, M.; Wang, S.; Zhang, H.; Ye, H.; Zhu, R.; Zhang, W. Electrochemical dual signal sensing platform for the simultaneous determination of dopamine, uric acid and glucose based on copper and cerium bimetallic carbon nanocomposites. Bioelectrochemistry 2021, 139, 107745. [Google Scholar] [CrossRef] [Scilit] [PubMed]
  16. Bolzán, A.E. Electrodeposition of copper on glassy carbon electrodes in the presence of picolinic acid. Electrochim. Acta 2013, 113, 706–718. [Google Scholar] [CrossRef] [Scilit]
  17. Liu, S.; Yu, Y.; Ni, K.; Liu, T.; Gu, M.; Wu, Y.; Du, G.; Ran, X. Construction of a novel electrochemical sensor based on biomass material nanocellulose and its detection of acetaminophen. RSC Adv. 2022, 12, 27736–27745. [Google Scholar] [CrossRef] [Scilit] [PubMed]
  18. Zhou, T.; Chen, T.; Qi, Z.; Sun, J.; Niu, Z.; Li, X.; Ma, T.; Kong, X.; Zhao, L.; Lin, J.; et al. A high selectivity and low detection limit carbon monoxide sensor based on Au-GO/Co-ZnO composite material. Microsyst. Nanoeng. 2025, 11, 177. [Google Scholar] [CrossRef] [Scilit] [PubMed]
  19. Brza, M.A.; Aziz, S.B.; Anuar, H.; Ali, F.; Dannoun, E.M.; Mohammed, S.J.; Abdulwahid, R.T.; Al-Zangana, S. Tea from the drinking to the synthesis of metal complexes and fabrication of PVA based polymer composites with controlled optical band gap. Sci. Rep. 2020, 10, 18108. [Google Scholar] [CrossRef] [Scilit] [PubMed]
Figure 1. XRD spectra of Cu, PA-Cu2+@Cu, Ce3+/PA-Cu2+@Cu.
Molecules 31 03448 g001
Figure 2. FTIR spectra of Cu, PA-Cu2+@Cu, Ce3+/PA-Cu2+@Cu and PA.
Molecules 31 03448 g002
Figure 3. CV cycling profiles of Cu/GCE, PA-Cu2+@Cu/GCE, Ce3+/PA-Cu2+@Cu/GCE.
Molecules 31 03448 g003
Figure 4. EIS curves for Cu/GCE, PA-Cu2+@Cu/GCE, Ce3+/PA-Cu2+@Cu/GCE.
Molecules 31 03448 g004
Figure 5. (A) CV plots of GCE, Cu/GCE, PA-Cu2+@Cu/GCE, Ce3+/PA-Cu2+@Cu/GCE in H2O2 solution and (B) histogram of oxidation peak current value (IPa).
Molecules 31 03448 g005
Figure 6. SWV profiles of GCE, Cu/GCE, PA-Cu2+@Cu/GCE, Ce3+/PA-Cu2+@Cu/GCE in H2O2 solution.
Molecules 31 03448 g006
Figure 7. (A) Time-optimized SWV plot of electrodeposited Cu and (B) its oxidation peak current value (Ip) plotted against time (t).
Molecules 31 03448 g007
Figure 8. (A) Time-optimized SWV plot of PA-Cu2+@Cu/GCE and (B) its oxidation peak current value (Ip) plotted against time (t).
Molecules 31 03448 g008
Figure 9. (A) SWV plots of Ce3+ composite at different times and (B) its oxidation peak current value (Ip) plotted against time (t).
Molecules 31 03448 g009
Figure 10. (A) Reaction time optimized SWV plot for H2O2 and (B) its oxidation peak current value (Ip) plotted against time (t).
Molecules 31 03448 g010
Figure 11. (A) DPV detection curves of Ce3+/PA-Cu2+@Cu/GCE for different concentrations of H2O2 and (B) the fitted linear relationship of IPa (peak current) for different concentrations of H2O2 being oxidized.
Molecules 31 03448 g011
Figure 12. (A) Plot of DPV response of interferers to the sensor and (B) histogram of Ipa of different interfering species for corresponding conditions.
Molecules 31 03448 g012
Figure 13. (A) DPV measurement of 20 μmol∙L−1 H2O2 by the same sensor prepared with different electrodes; and (B) DPV measurement of H2O2 oxidation peak currents by the modified electrodes after different days at room temperature.
Molecules 31 03448 g013
Disclaimer/Publisher’s Note: The statements, opinions and data contained in all publications are solely those of the individual author(s) and contributor(s) and not of MDPI and/or the editor(s). MDPI and/or the editor(s) disclaim responsibility for any injury to people or property resulting from any ideas, methods, instructions or products referred to in the content.