Article

Optimization and HPLC-DAD Characterization of Phenolic Compounds and Antioxidant Activity in Ferula communis L. Inflorescence


1
Functional Ecology and Environmental Engineering Laboratory, Faculty of Sciences and Techniques, Sidi Mohamed Ben Abdellah University, Fez P.O. Box 2202, Morocco
2
Laboratory of Applied Organic Chemistry, Faculty of Sciences and Techniques, Sidi Mohamed Ben Abdellah University, Fez P.O. Box 2202, Morocco
3
Biotechnology, Environment, Agri-Food and Health Laboratory, Faculty of Sciences Dhar El Mahraz, Sidi Mohamed Ben Abdellah University, Fez P.O. Box 2202, Morocco
*
Author to whom correspondence should be addressed.
Molecules 2026, 31(13), 2235; https://doi.org/10.3390/molecules31132235
Submission received: 9 April 2026 / Revised: 1 May 2026 / Accepted: 7 May 2026 / Published: 25 June 2026

Abstract

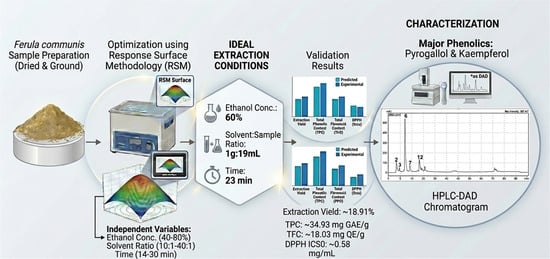
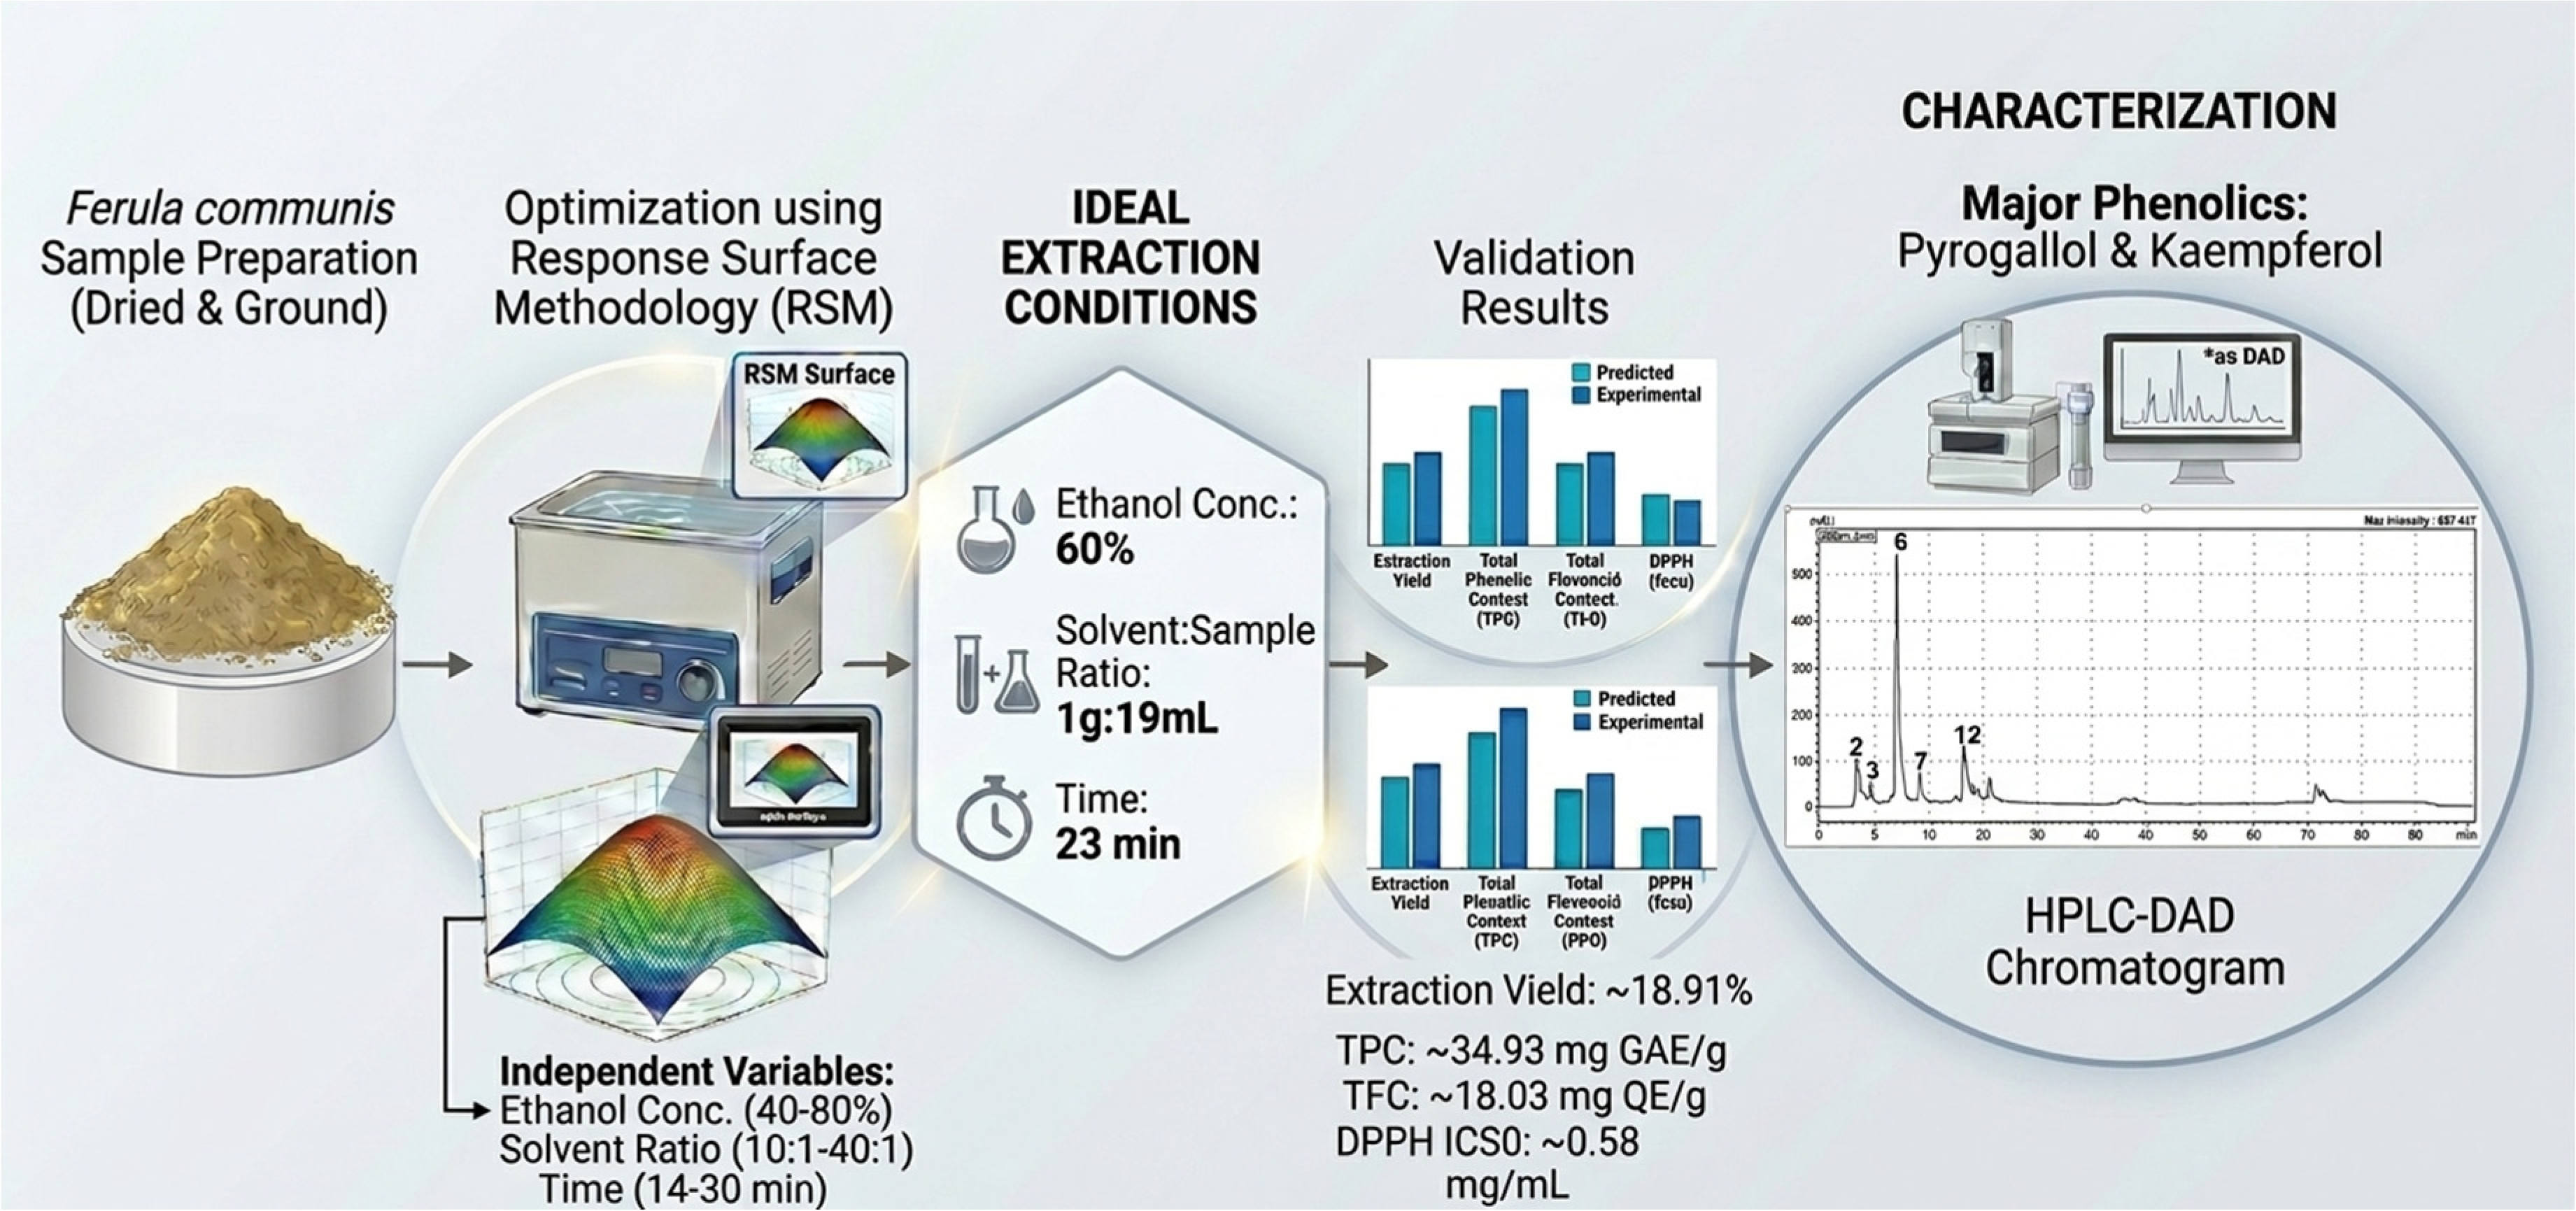
An ultrasound-assisted extraction method combined with response surface methodology was applied to optimize the extraction of phenolic compounds and evaluate the antioxidant capacity of Ferula communis inflorescence. Response surface methodology with a central composite design was used to optimize the process. As independent variables, ethanol concentration (40–80% v/v), solvent-to-sample ratio (10–40 mL/g), and extraction time (14–30 min) were assessed. A solid-to-liquid ratio of 19 mL/g, a 60% ethanol concentration, and a 23 min extraction duration were the ideal extraction parameters. The extraction yield, total phenolic content (TPC), total flavonoid content (TFC), and DPPH radical scavenging capacity (IC50) were predicted to be 18.91%, 34.93 mg GAE/g, 18.03 mg QE/g, and 0.58 mg/mL, respectively, under these optimized conditions. The efficacy of the central composite design in optimizing polyphenol extraction from F. communis was validated by experimental results that closely matched the predicted values. Eleven phenolic compounds were identified by HPLC-DAD, with pyrogallol and kaempferol being the most prevalent components. These results suggest that F. communis may represent a promising source of bioactive compounds with potential antioxidant applications.

Graphical Abstract

1. Introduction

The genus Ferula, belonging to the Apiaceae family, comprises approximately 180–185 species and is widely distributed from the Mediterranean region to Central Asia [1,2]. In Morocco, six Ferula species have been observed—F. communis, F. cossoniana, F. gouliminensis, F. sauvagei, F. atlantica, and F. tingitana—with different and variable geographic distributions [3]. The accumulation of oleo-gum-resins in the roots and stems of Ferula species gives them a strong bitter taste and strong odor, which is mostly caused by sulfur-containing substances and other bioactive phytochemicals [4].
Ferula communis L. (giant fennel), locally known as “Elboubale”, “Fassough” or “Ouffale”, is an abundant latex-producing perennial reaching 1 to 3 m in height. The species occurs in two chemotypes: a toxic form rich in ferulenol, responsible for anticoagulant and hemorrhagic effects; and a non-toxic form containing ferutinin, a sesquiterpene ester with estrogenic activity. F. communis is of considerable biological and therapeutic interest. It has been demonstrated that this plant exhibits biological activities such as antioxidant, antibacterial, antifungal, and anticancer effects [5,6,7]. These activities vary depending on the chemical composition of the extracts from the part of the plant used [8,9]. Furthermore, it has been demonstrated that F. communis is characterized by its presence of flavonoids and polyphenols [10]. These bioactive molecules have natural antioxidant potential [11,12]. Although F. communis is a promising source of bioactive compounds, this species remains insufficiently scientifically explored, particularly with regard to optimizing extraction conditions, detailed characterization of its phenolic compounds, and evaluation of its biological activities. Most phytochemical and biological studies conducted on F. communis have primarily focused on the roots, which are rich in secondary metabolites. In contrast, other plant organs, such as stems, seeds, and particularly inflorescences, remain poorly characterized from a biochemical perspective, representing a gap in the current literature on this species. Furthermore, conventional extraction methods, such as maceration and Soxhlet extraction present several limitations in terms of extraction efficiency, solvent consumption, and the preservation of thermolabile bioactive compounds. Ultrasound-assisted extraction (UAE) represents a particularly effective alternative, as it enhances the extraction yield of phenolic compounds while reducing extraction time and energy consumption. However, this method requires a rigorous statistical approach. Hence the use of Response Surface Methodology (RSM), which enables the simultaneous optimization of multiple independent variables and the modeling of their interactions.
To the best of our knowledge, this study represents one of the few attempts to optimize the extraction of phenolic compounds from the inflorescence of F. communis using a combined UAE–RSM approach. The novelty of this work lies in (i) the valorization of a relatively underexplored plant organ from a species of high medicinal interest, (ii) the application of a rigorous optimization methodology, and (iii) the development of a predictive model for the production of phenolic-rich extracts from this species.
In this context, the present study aims to optimize extraction conditions in order to maximize the yield of bioactive compounds, as well as to evaluate the antioxidant activity of the extracts, with a view to their potential use in the cosmetic, pharmaceutical, and medicinal fields. To this end, a Central Composite Design (CCD) experimental plan, coupled with Response Surface Methodology (RSM), was applied to study the combined effect of three key variables, namely extraction time, solvent-to-solid ratio (mL/g), and ethanol concentration (%), on the yield of phenolic compounds and antioxidant activity. In addition, the phenolic compounds were quantified and characterized using high-performance liquid chromatography coupled with a diode array detector (HPLC-DAD), enabling qualitative and quantitative analysis of the phenolic profile of the optimized extracts.

2. Results

2.1. Experimental Design Matrix and Results

The experimental plan and the corresponding observed values for each response are presented in Table 1.

2.2. Analysis of Variance (ANOVA) and Model Fitting

The statistical significance and adequacy of the developed polynomial models were evaluated using analysis of variance (ANOVA). The results are summarized in Table 2.
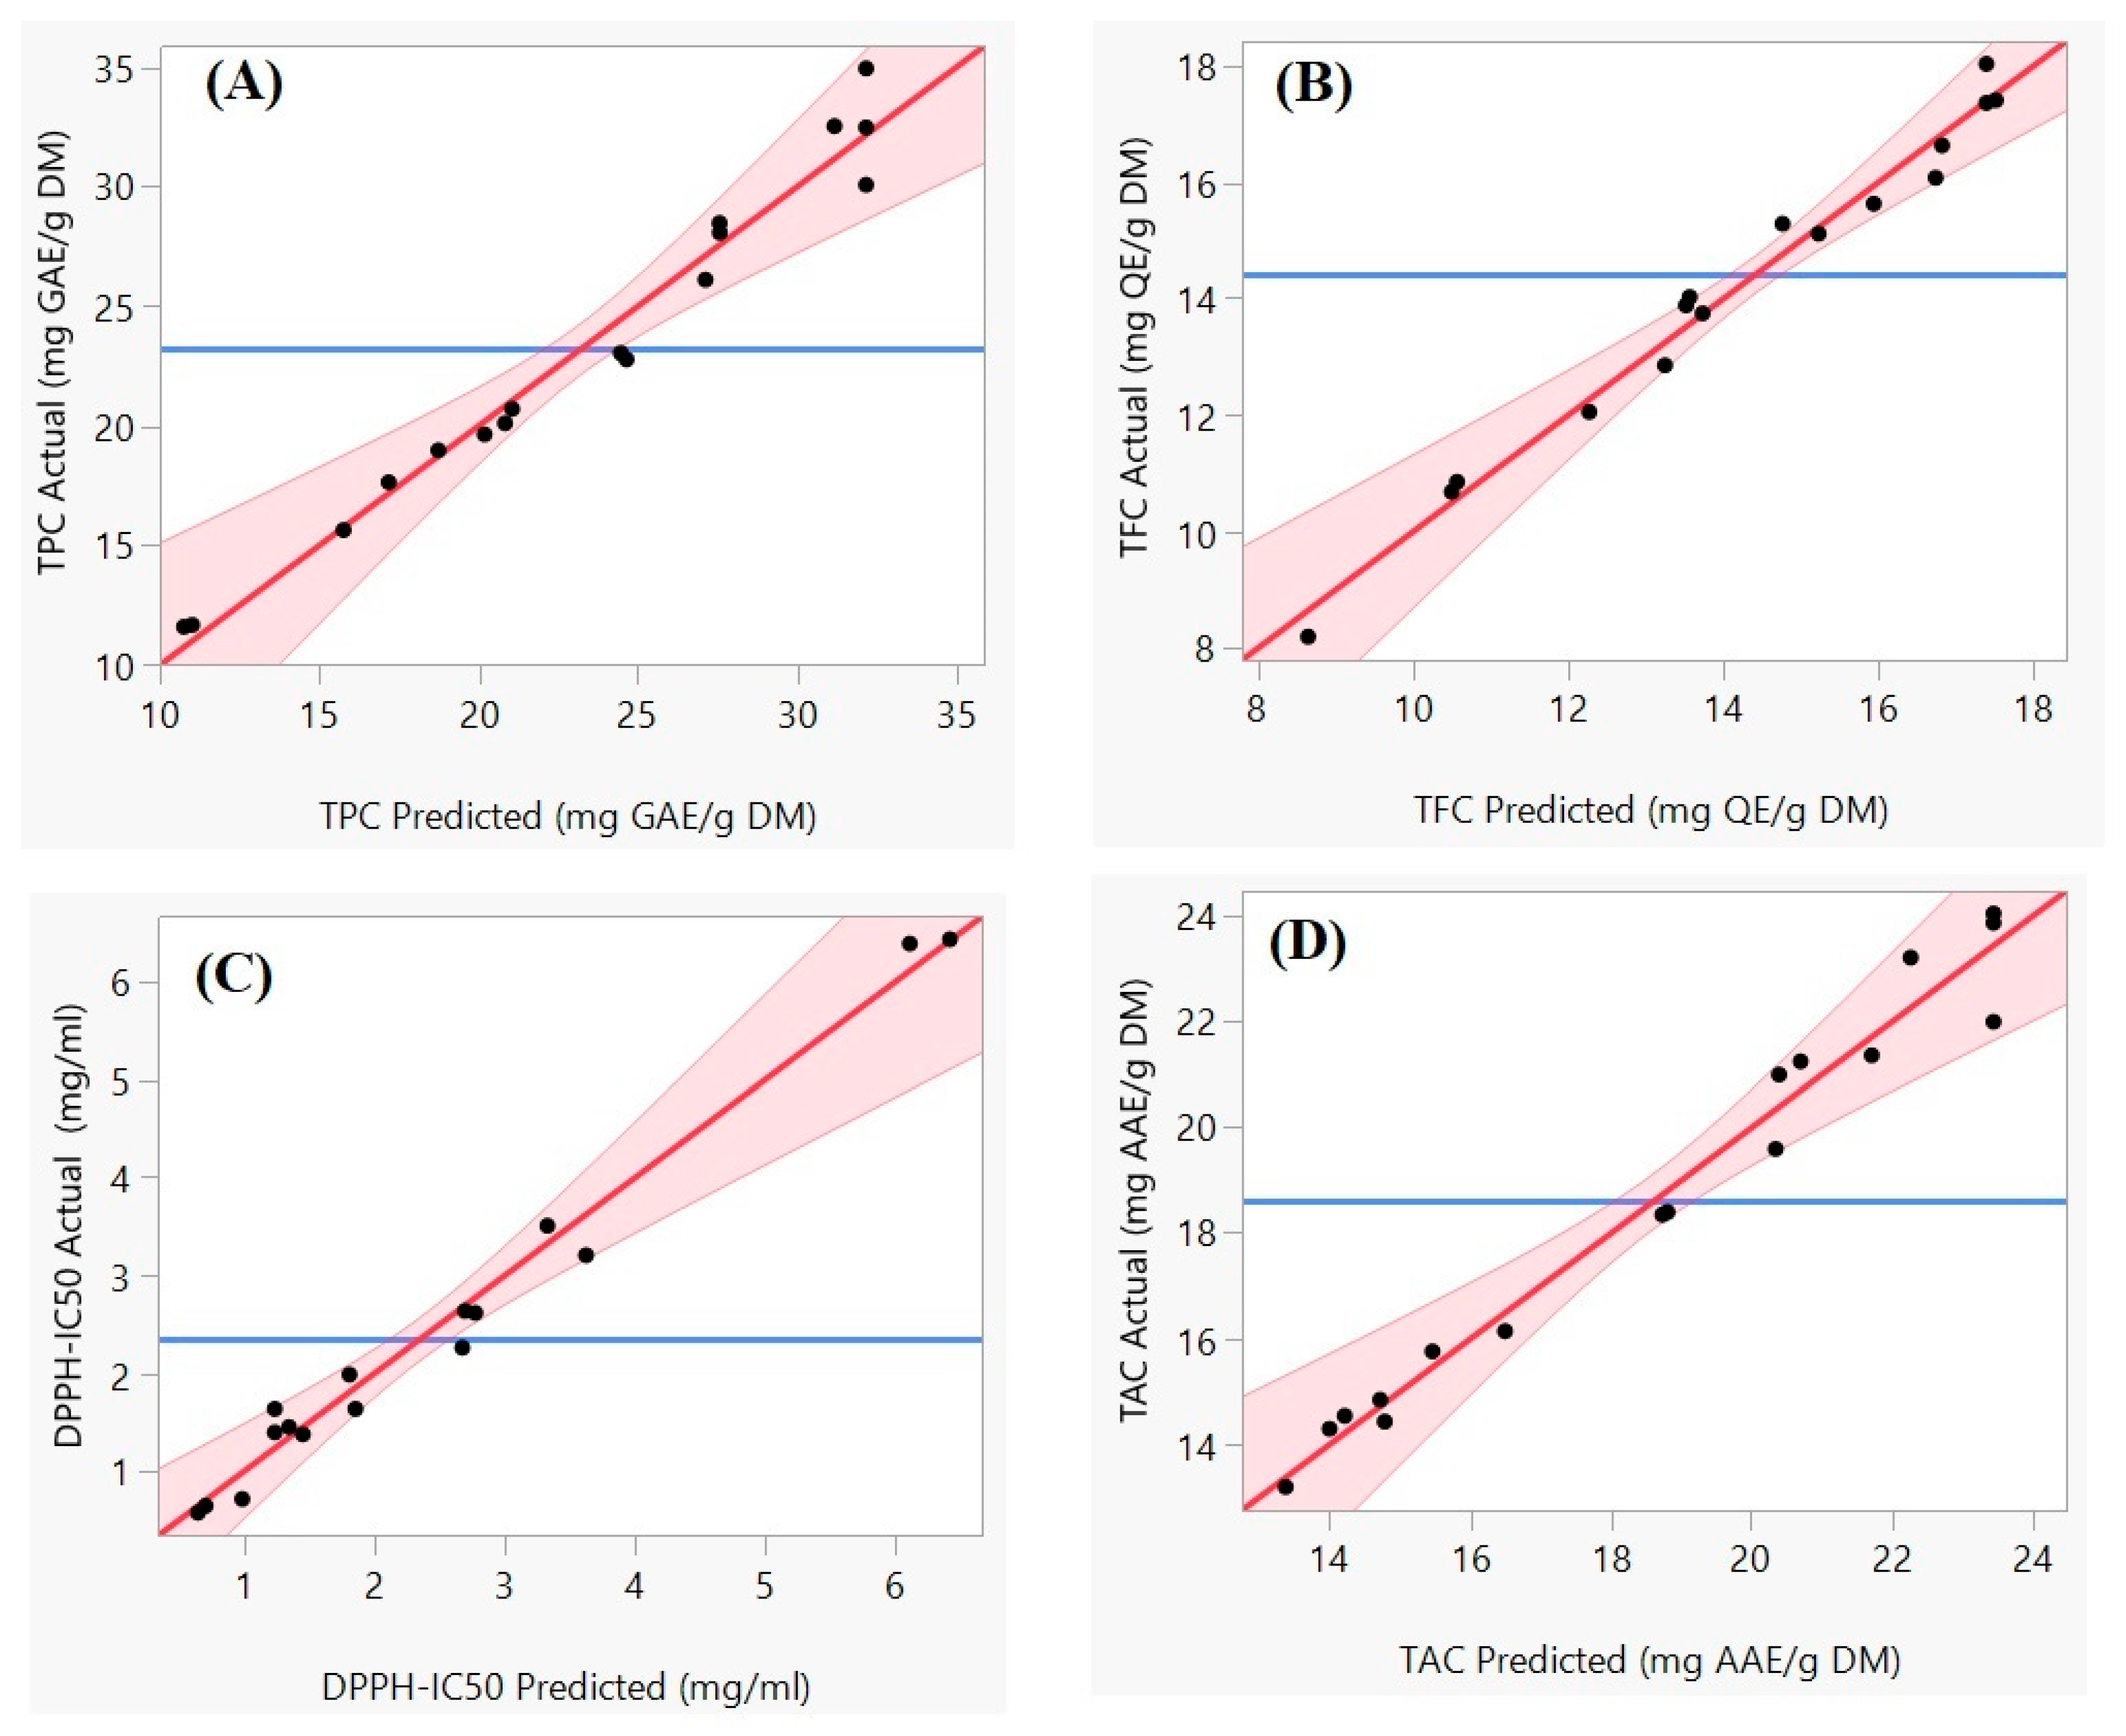
The ANOVA results indicate that the regression models for all four responses are highly significant, as evidenced by their low p-values (<0.0001). Furthermore, the lack of fit test was used to assess the model’s adequacy. The p-values for lack of fit (0.81, 0.13, 0.09, and 0.77) are all greater than 0.05, indicating that the lack of fit is not significant relative to the pure error. This confirms that the developed second-order models are adequate and robust for predicting the responses within the experimental domain. The high coefficients of determination (R2) (0.97, 0.98, 0.98, and 0.97 for TPC, TFC, DPPH-IC50, and TAC, respectively) confirm an excellent correlation between the experimental data and the predicted values. To further validate the robustness of the models, the adjusted R2 (R2adj) was evaluated. The models yielded high R2adj values of 0.93 (TPC), 0.96 (TFC), 0.95 (DPPH-IC50), and 0.94 (TAC), which are very close to their corresponding R2 values, indicating that the models are highly significant. Additionally, the predictive capability of the models for new observations was assessed using the predicted R2 (R2pred), which were found to be 0.85, 0.77, 0.85, and 0.86 for TPC, TFC, DPPH-IC50, and TAC, respectively. For all four responses, the reasonable agreement between R2adj and R2pred (a difference of less than 0.20) mathematically substantiates the high predictive power of the developed second-order models. The goodness-of-fit for each model was visually confirmed by plotting the actual (experimental) values against the model-predicted values (Figure 1). The repeatability of the ultrasound-assisted extraction process and the magnitude of pure experimental error were evaluated using the central point replicates (Runs 15, 16, and 17 in Table 1). While slight variations are inherently expected when extracting bioactive compounds from complex and heterogeneous biological matrices such as plant inflorescences, the variation remained strictly within acceptable limits. For instance, the Relative Standard Deviation (RSD) for the Total Phenolic Content (TPC) at the central point was calculated to be 7.48%, with TFC, DPPH-IC50, and TAC showing RSDs of 2.2%, 9.0%, and 4.9%, respectively. Because these values are below the generally accepted threshold of 10% for phytochemical extractions, the method demonstrates good repeatability.
As shown in Figure 1, the data points are tightly clustered around the 45° line, indicating a strong linear relationship between observed and predicted values. This provides further confirmation of the high predictive power of the models, in agreement with the high R2 values.

2.3. Analysis of Factor Effects and Regression Models

The estimated regression coefficients, along with their statistical significance (p-values), are detailed in Table 3. These coefficients quantify the effect of each factor and their interactions on the responses. The final predictive equations were constructed by retaining only the statistically significant terms (p < 0.05) from the full second-order polynomial model. No formal model reduction was performed, as the full model already demonstrated excellent adequacy (non-significant lack of fit, R2 > 0.97 for all responses). Table 3 therefore reports the complete set of estimated coefficients from the full model, with non-significant terms explicitly identified, allowing for the direct identification of the factors and interactions that significantly contribute to each response.

2.4. Model for Total Phenolic Content (TPC)

The significant terms (p < 0.05) are Intercept (β0), Time (β1), ETOH Conc. (β2), and the quadratic terms Time211), ETOH Conc.222), and S/M Ratio233). The final predictive equation in terms of coded factors is:
YTPC = 32.15 + 1.55X1 + 3.26X2 − 6.15X12 − 4.26X22 − 4.82X32
The linear effects showed that extraction time (β1 = +1.55) and ethanol concentration (β2 = +3.26) exerted significant positive influences on total phenolic content, with the ethanol concentration being the most influential factor, indicating that increasing these parameters initially enhances phenolic extraction, whereas the solvent-to-material ratio (β3) did not present a significant linear effect (p > 0.05). In contrast, none of the interaction terms (β12, β13, β23) were statistically significant, suggesting that the extraction factors act independently on TPC, which simplifies the optimization process. Furthermore, all quadratic terms (β11, β22, β33) were significant and strongly negative, revealing a pronounced curvature in the response surface and confirming the existence of optimal levels for each factor, beyond which further increases in extraction time, ethanol concentration, or solvent-to-material ratio lead to a reduction in TPC yield.

2.5. Model for Total Flavonoid Content (TFC)

The significant terms are Intercept (β0), Time (β1), ETOH Conc. (β2), the interaction Time ∗ S/M Ratio (β13), and the quadratic terms Time211) and ETOH Conc.222). The equation is:
YTFC = 17.39 + 1.61X1 + 1.10X2 − 0.79X1X3 − 2.26X12 − 2.55X22
The linear effects indicated that, similarly to TPC, extraction time (β1 = +1.61) and ethanol concentration (β2 = +1.10) had significant positive influences on total flavonoid content, thereby enhancing flavonoid extraction. A significant and negative interaction was observed between extraction time and the solvent-to-material ratio (β13 = −0.79), revealing an antagonistic effect whereby the positive impact of increasing extraction time is reduced at higher solvent-to-material ratios, and vice versa. In addition, the quadratic terms for time211 = −2.26) and ethanol concentration222 = −2.55) were both significant and negative, indicating the presence of optimal levels for these factors, beyond which further increases lead to a decrease in flavonoid extraction efficiency.

2.6. Model for DPPH-IC50

The significant terms are Intercept (β0), Time (β1), ETOH Conc. (β2), S/M Ratio (β3), the interaction Time ∗ ETOH Conc. (β12), and the quadratic terms Time211) and ETOH Conc.222). The equation is:
YDPPH-IC50 = 1.24 − 0.61X1 − 1.49X2 + 0.43X3 + 1.01X1X2 + 0.83X12 + 0.90X22
The linear effects showed that extraction time (β1 = −0.61) and ethanol concentration (β2 = −1.49) had significant negative effects, which is desirable, as increasing these factors leads to lower IC50 values, indicating higher antioxidant capacity, whereas the solvent-to-material ratio (β3 = +0.43) had a significant positive effect, suggesting that higher solvent ratios may lead to a decrease in antioxidant performance. A significant and positive interaction was observed between time and ethanol concentration (β12 = +1.01), revealing a strong antagonistic effect in which the combined increase in both factors partially offsets their individual benefits, highlighting the need for an optimal balance. Additionally, the quadratic terms for time211 = +0.83) and ethanol concentration222 = +0.90) were significant and positive, indicating that exceeding the optimal levels of these factors result in an increase in IC50, thereby diminishing antioxidant activity.

2.7. Model for Total Antioxidant Capacity (TAC)

The significant terms are Intercept (β0), Time (β1), ETOH Conc. (β2), and all three quadratic terms (β11, β22, β33). The equation is:
YTAC = 23.43 + 0.79X1 − 0.96X2 − 3.84X12 − 2.14X22 − 2.24X32
The linear effects showed that extraction time (β1 = +0.79) had a significant positive influence on total antioxidant capacity (TAC), indicating that longer extraction times favor higher TAC values, whereas ethanol concentration (β2 = −0.96) exerted a significant negative effect. This contrasting behavior suggests that increasing ethanol concentration reduces TAC, implying that the compounds mainly responsible for total antioxidant capacity are preferentially extracted using more polar solvents with lower ethanol content, in direct contrast to the trends observed for TPC and TFC. No interaction terms were statistically significant, indicating independent effects of the studied factors on TAC. Furthermore, all quadratic terms (β11, β22, β33) were significant and negative, confirming the existence of optimal levels for each factor beyond which TAC decreases.

2.8. Parameter Optimization

2.8.1. Response Surface and Contour Plot Analysis

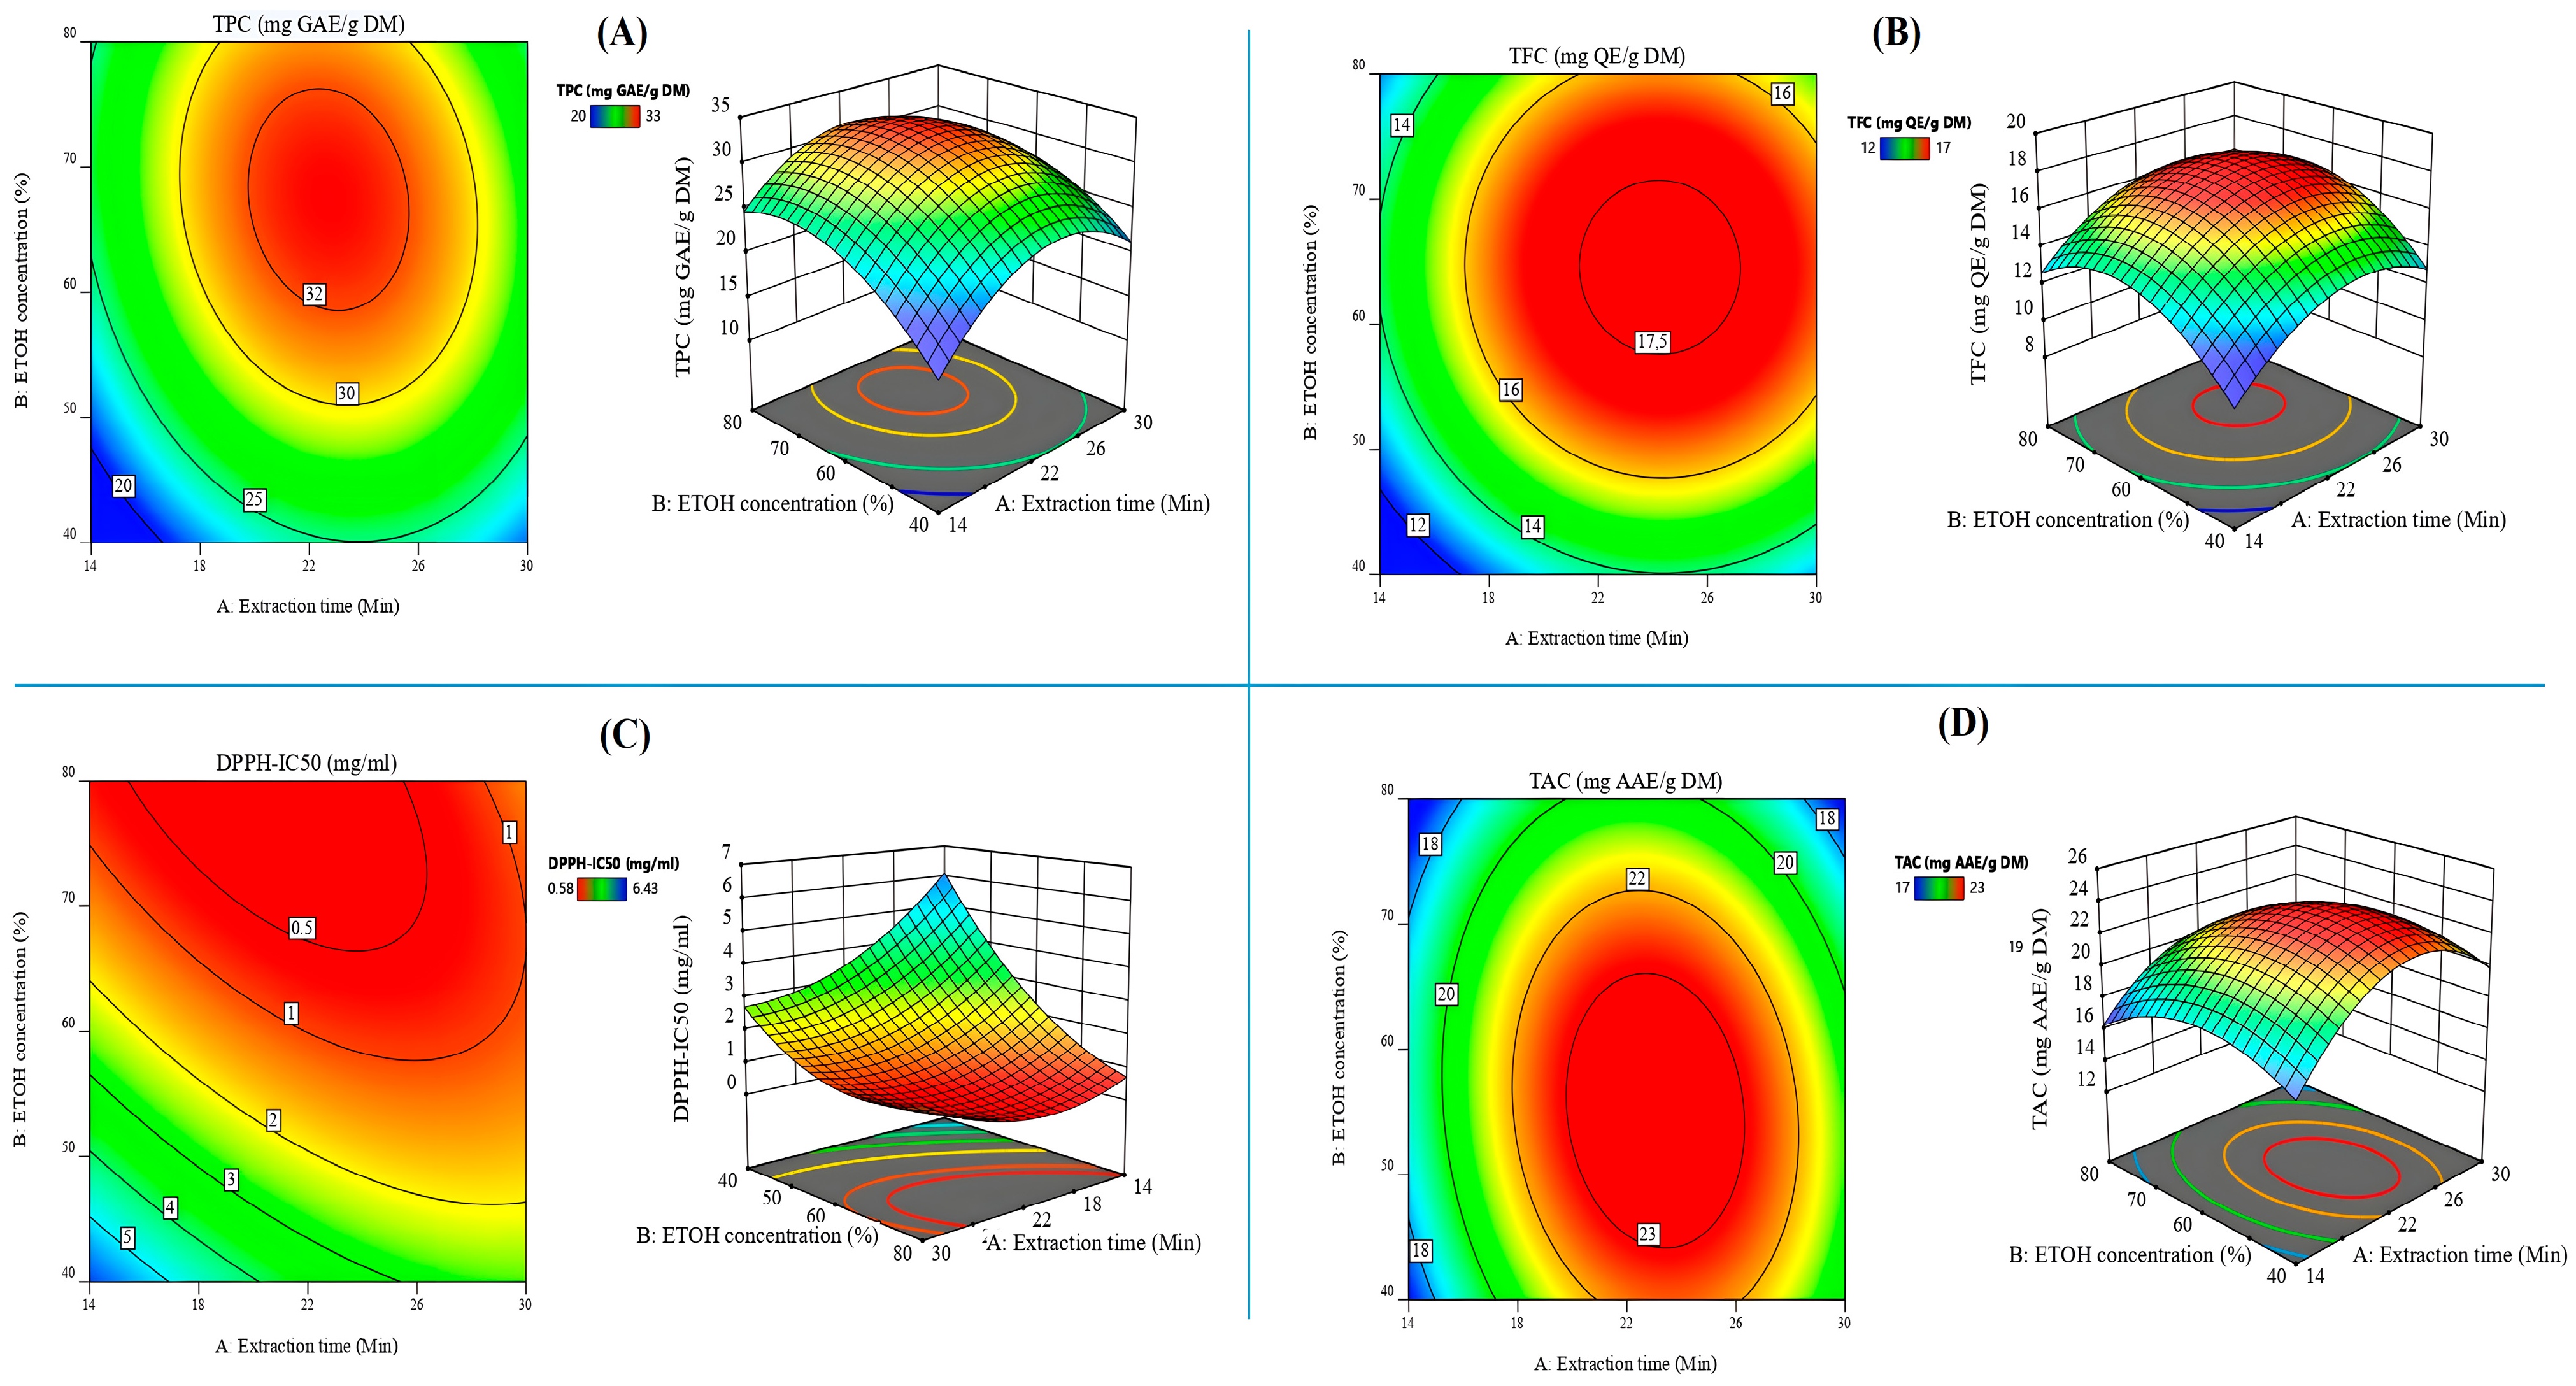
To visualize the effects of the factors and identify optimal regions, 2D contour plots and 3D response surfaces were generated. For clarity, the response was plotted against the two most influential factors (Time and ETOH Concentration), while the third factor (S/M Ratio) was held constant at its optimal level for each specific response.
Based on the analysis of these plots (Figure 2), the following optimal ranges were identified from the response surface models for each individual response, For total phenolic content (TPC), an optimal yield of approximately 32 mg GAE/g DW was achieved using a solvent-to-material ratio of 21, an extraction time ranging between 19 and 25 min, and an ethanol concentration between 58% and 76%. Concerning total flavonoid content (TFC), a maximum yield of about 17.5 mg QE/g DW was obtained at a solvent-to-material ratio of 24, an extraction time between 21 and 27 min, and an ethanol concentration ranging from 57% to 71%. Regarding antioxidant activity evaluated by the DPPH assay, a minimum IC50 value of approximately 0.5 mg/mL was achieved using a solvent-to-material ratio of 10, an extraction time between 15 and 26 min, and an ethanol concentration between 66% and 80%. Finally, the total antioxidant capacity (TAC) reached approximately 23 mg AAE/g DW under optimal conditions corresponding to a solvent-to-material ratio of 19, an extraction time ranging from 18 to 26 min, and an ethanol concentration between 44% and 66%. These intervals represent model-based predictions derived from the fitted second-order polynomials.

2.8.2. Desirability Function Analysis for Individual Optimization

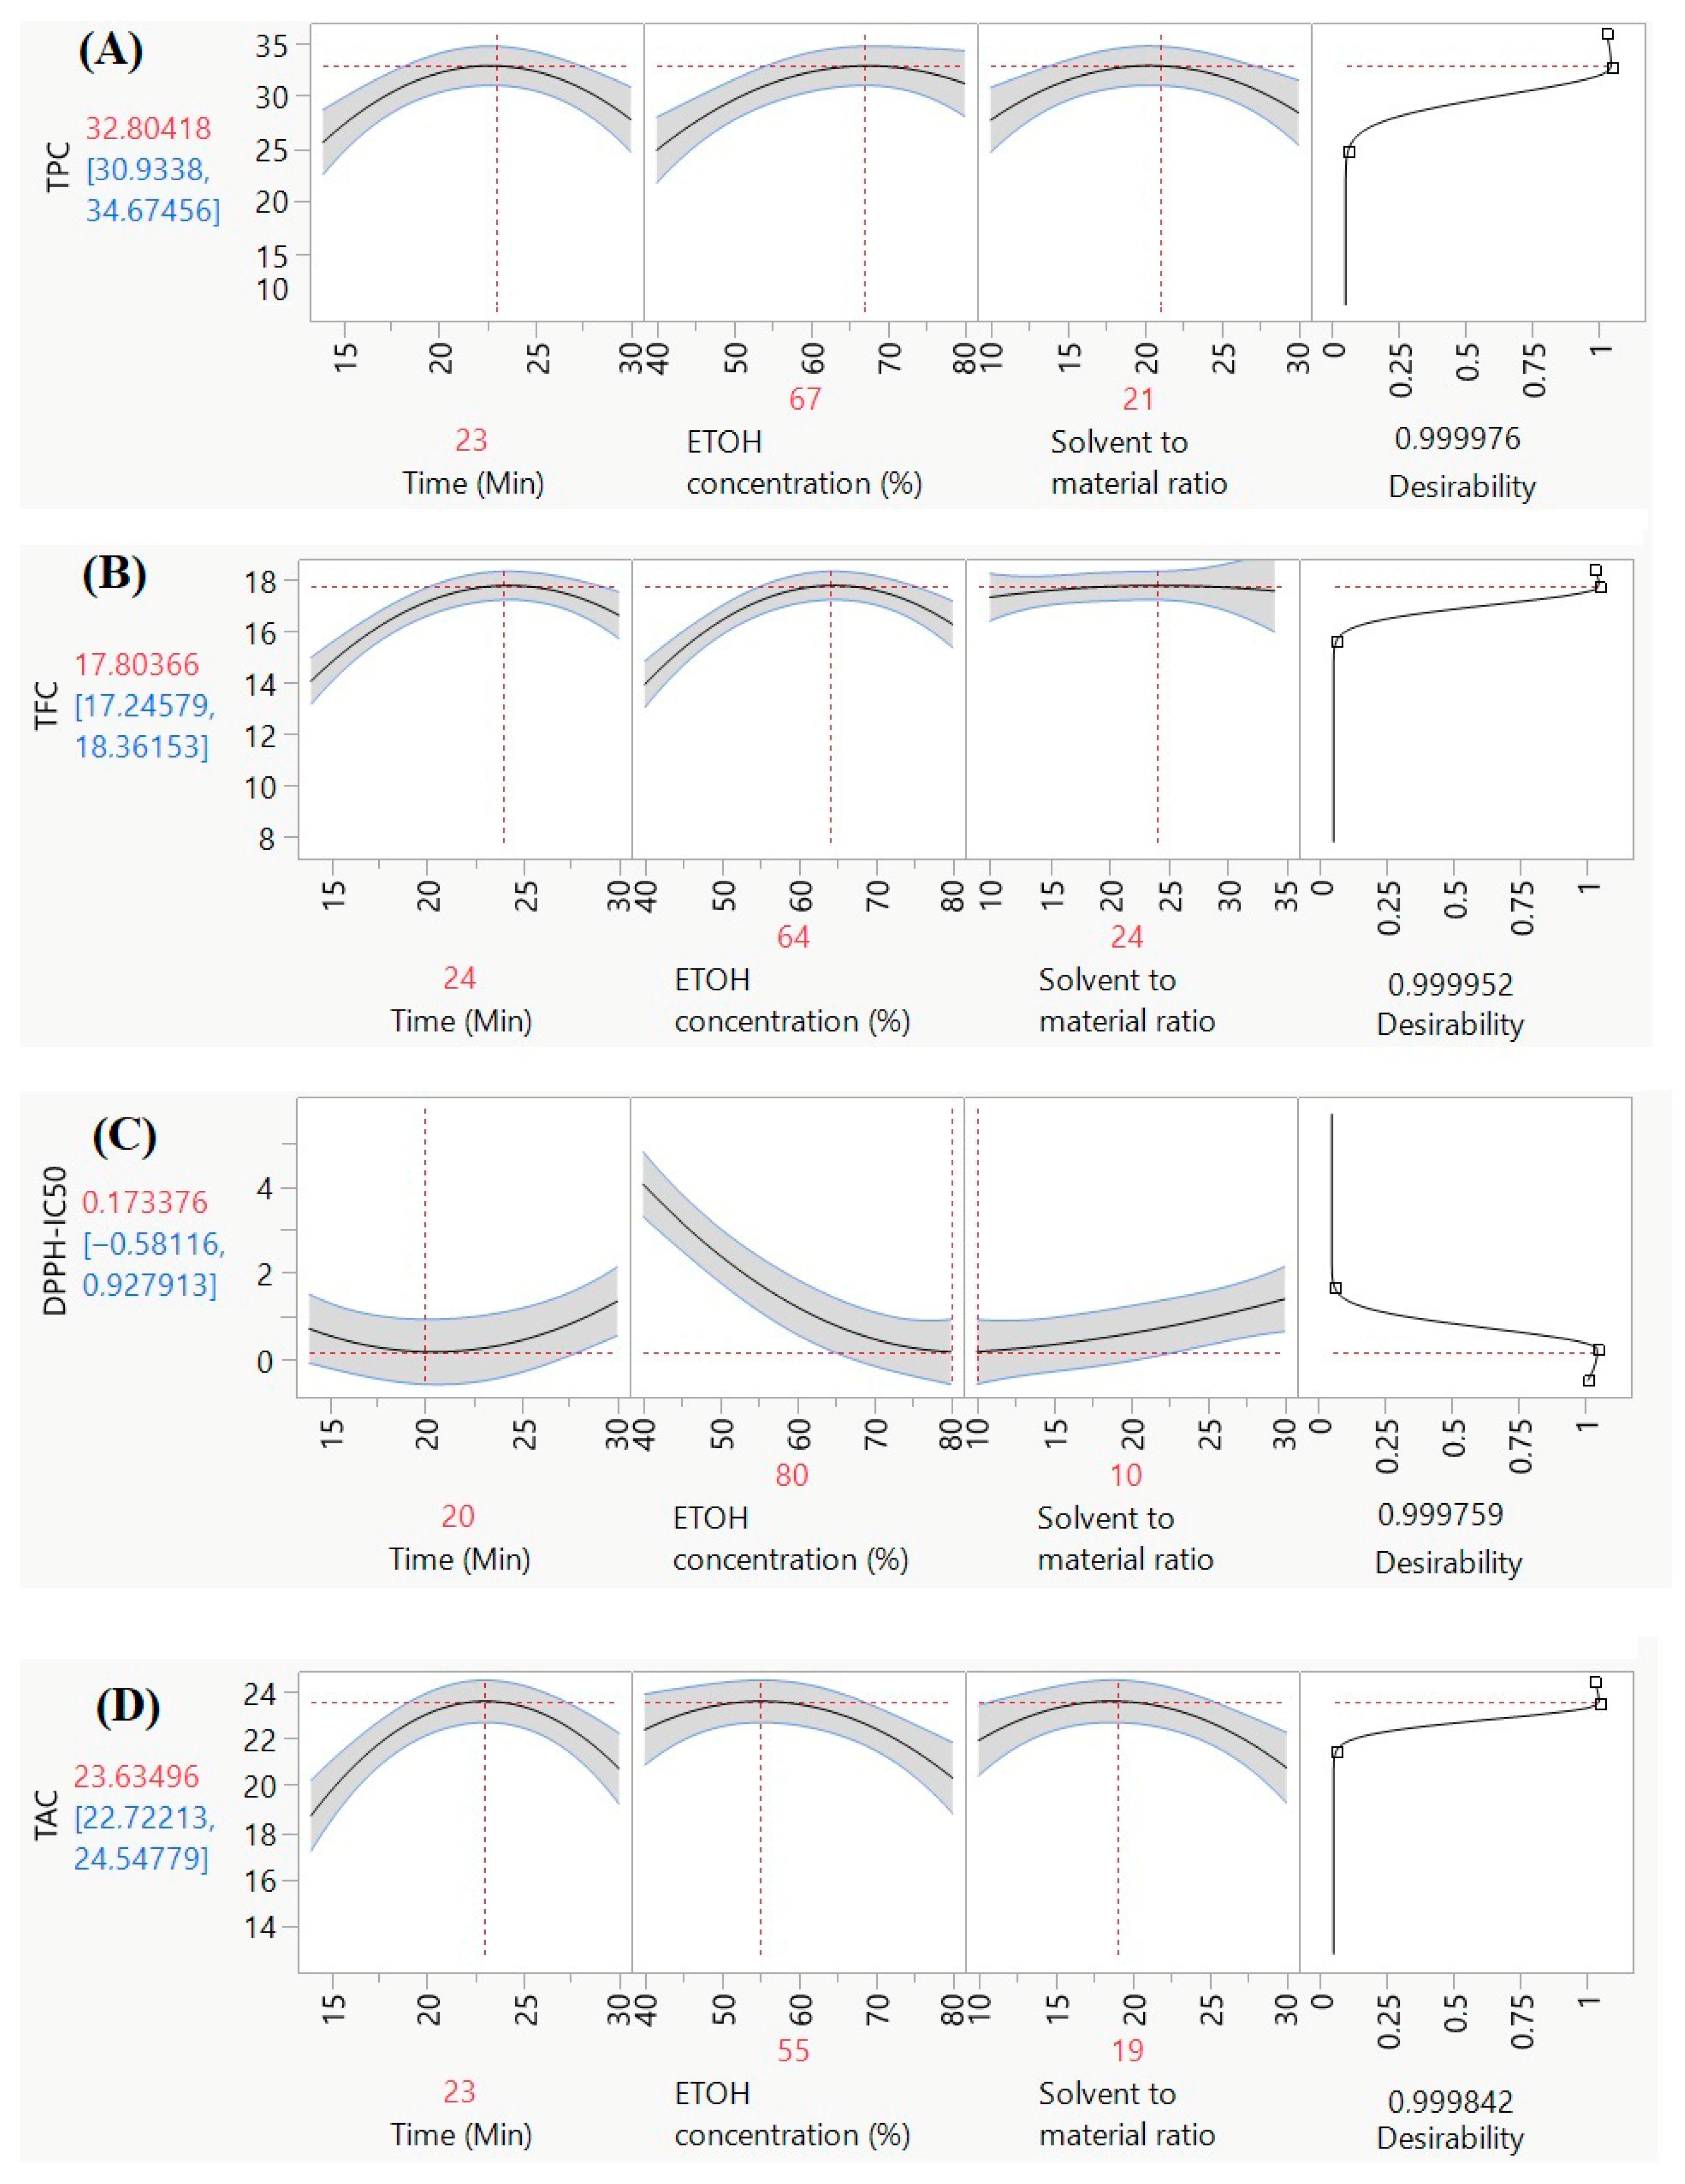
To precisely determine the optimal conditions, a desirability function analysis was performed. Figure 3 shows the desirability profiles for optimizing each response individually.
The optimal extraction conditions leading to a desirability score close to 0.99 were determined for each response. The maximum total phenolic content (TPC) of 32.8 mg GAE/g DW was achieved at an extraction time of 23 min, an ethanol concentration of 67%, and a solvent-to-material ratio of 21. Similarly, the total flavonoid content (TFC) was maximized to 17.8 mg QE/g DW under conditions of 24 min extraction time, 64% ethanol, and a solvent-to-material ratio of 24. Regarding antioxidant activity, the lowest DPPH IC50 value (0.17 mg/mL) was obtained at an extraction time of 20 min, with 80% ethanol and a solvent-to-material ratio of 10. Finally, the total antioxidant capacity (TAC) reached a maximum value of 23.6 mg AAE/g DW when the extraction was performed for 23 min using 55% ethanol and a solvent-to-material ratio of 19.

2.8.3. Simultaneous (Multi-Response) Optimization

The individual optimization results show a conflict in the optimal conditions. Specifically, minimizing DPPH-IC50 requires a high ethanol concentration (80%) and a low solvent ratio (10), whereas the other three responses (TPC, TFC, TAC) are optimized under moderate conditions (55–67% ethanol, ratio of 19–24).
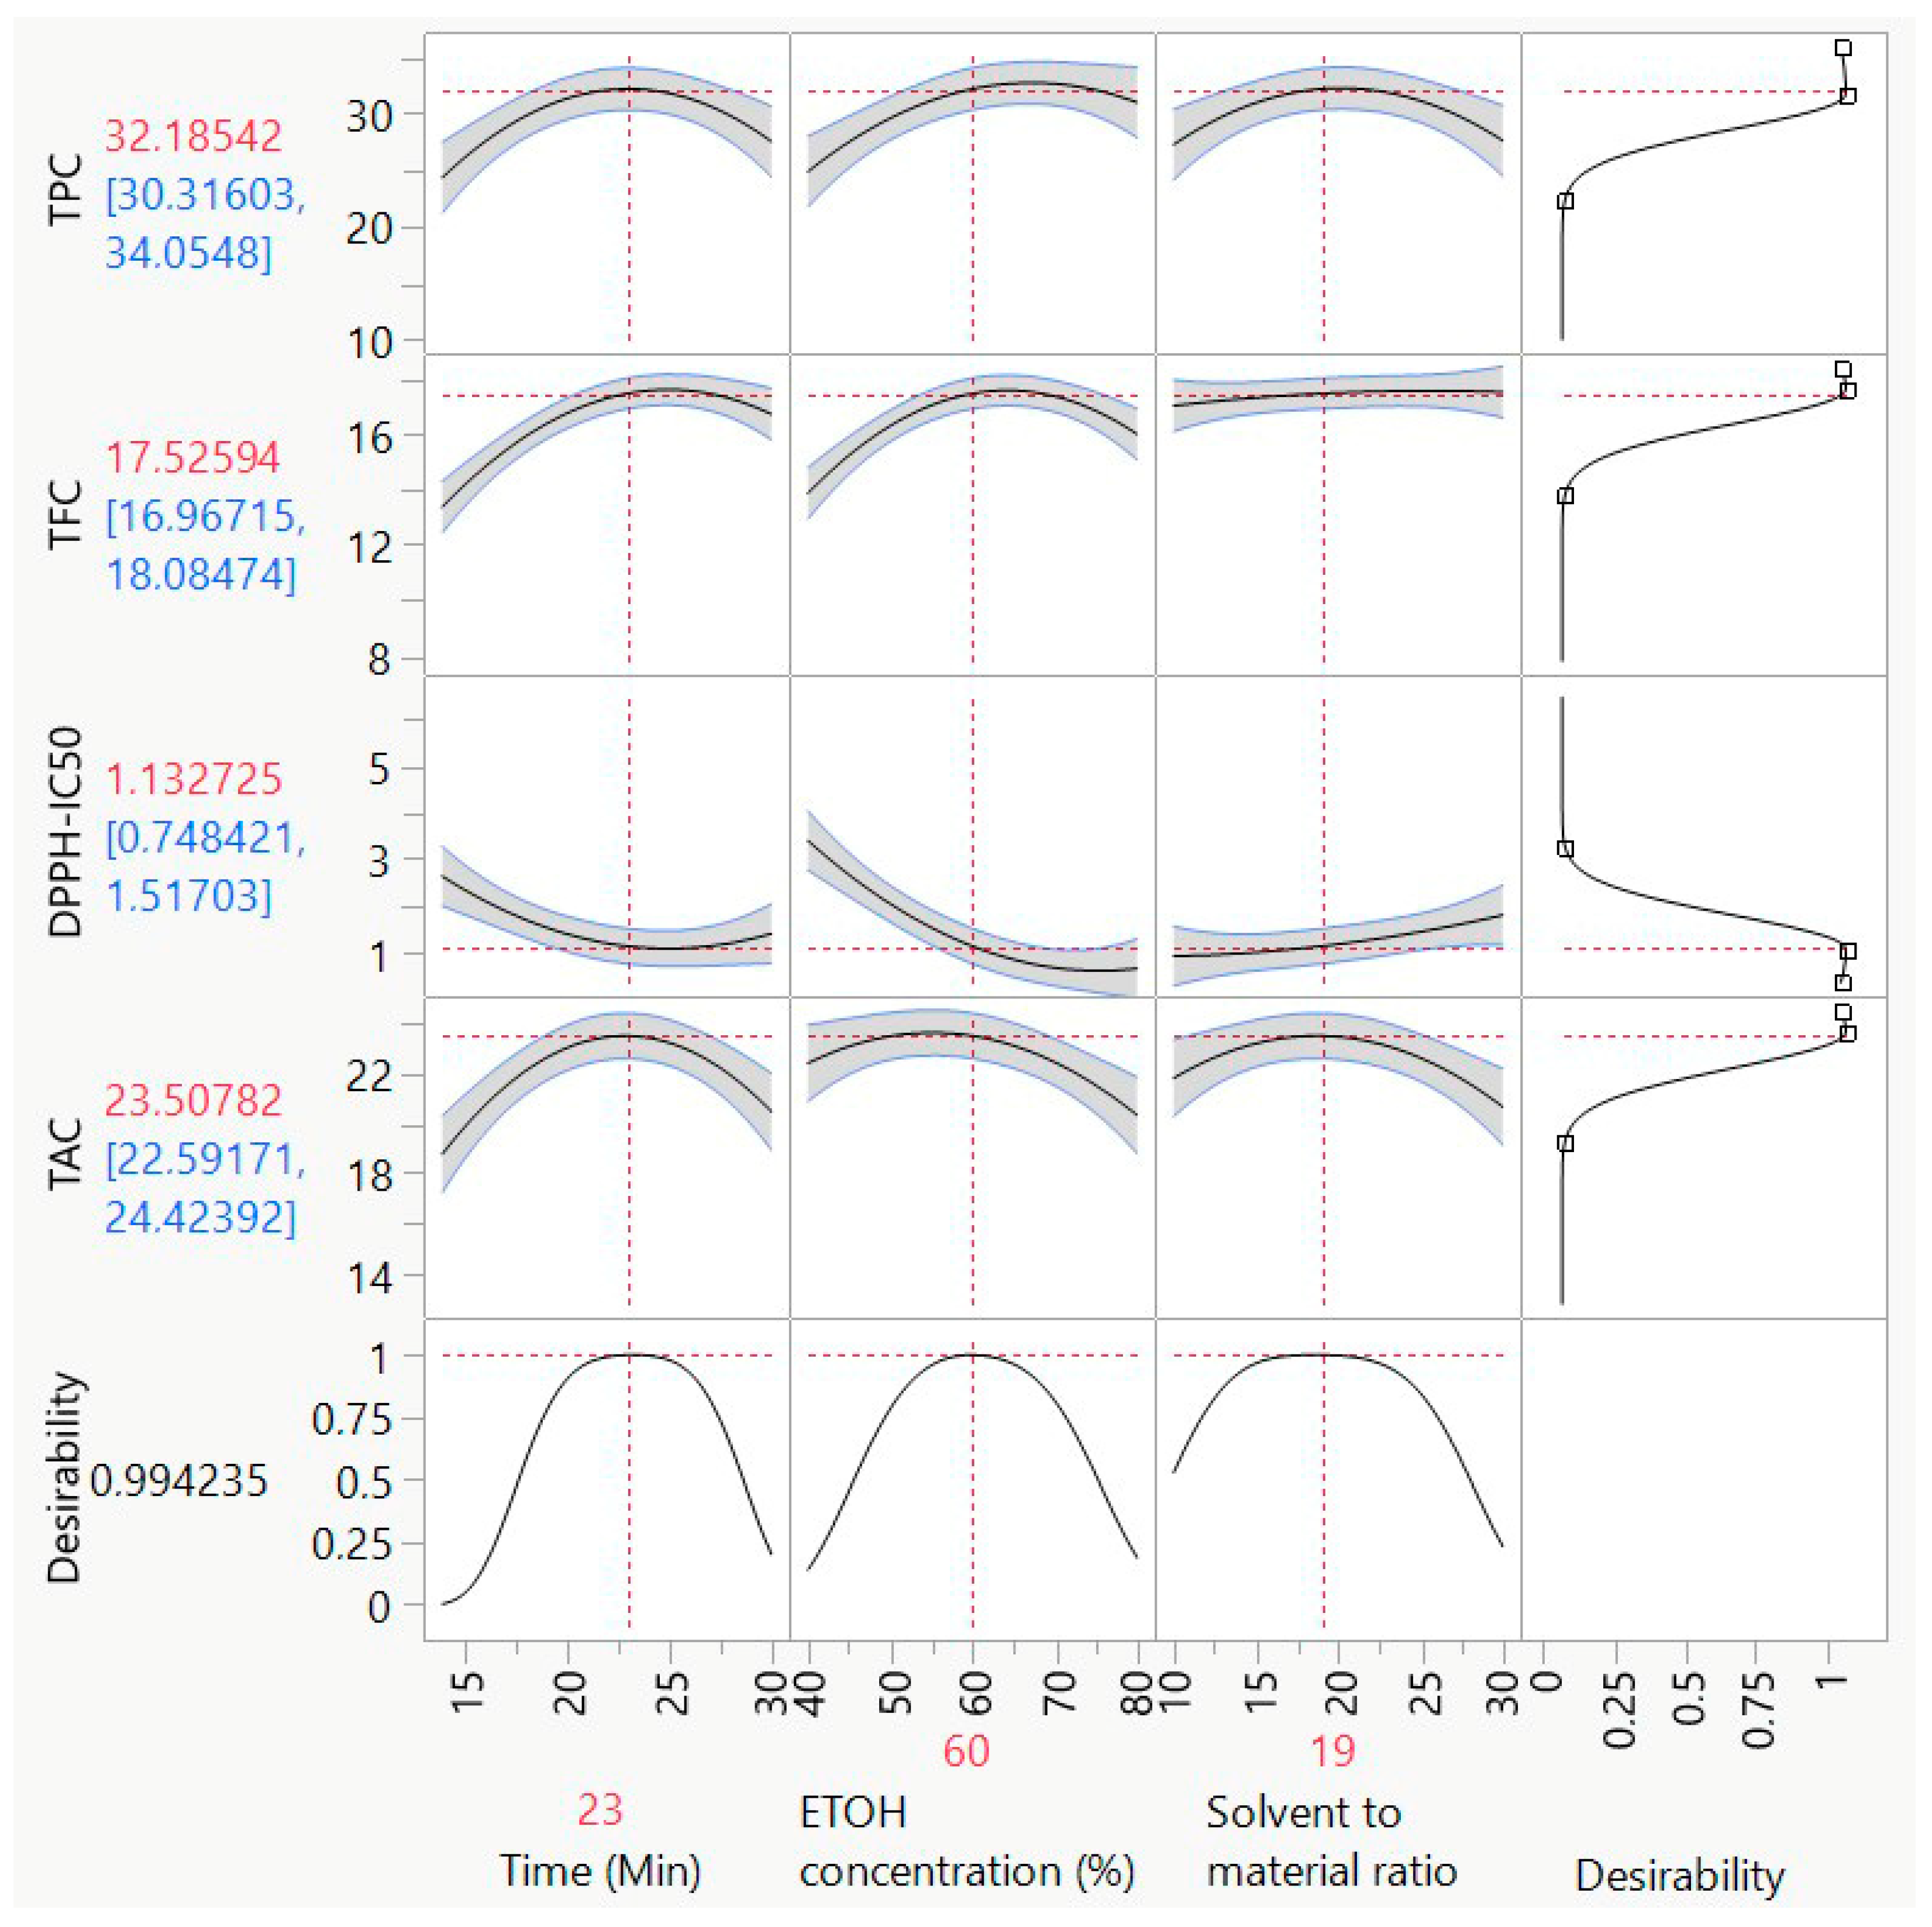
Therefore, a simultaneous optimization was conducted using the desirability tool to find a single set of compromise conditions that would provide the best possible outcome across all four responses. The desirability profile for this multi-response optimization is shown in Figure 4. While this approach is highly beneficial for TPC, TFC, and TAC, it results in a slight compromise (a less-than-ideal value) for the DPPH-IC50 response.
The optimal conditions for the simultaneous optimization of all four responses were determined as an extraction time of 23 min, an ethanol concentration of 60%, and a solvent-to-material ratio of 19. Under these conditions, a composite desirability of 0.994 was achieved, indicating the best compromise for maximizing phenolic and flavonoid contents as well as total antioxidant capacity, while maintaining strong radical scavenging activity.

2.8.4. Experimental Validation of the Optimal Conditions

To evaluate the predictive accuracy of the established models, an experimental validation was conducted for the four targeted responses (TPC, TFC, DPPH-IC50, and TAC). These confirmation tests were performed using the simultaneous optimal conditions derived from the RSM analysis: an extraction time of 23 min, 60% ethanol, and a solvent-to-material ratio of 19. As shown in Table 4, the experimental data closely matched the model-predicted values. This strong correlation between the theoretical and observed results verifies the reliability and robustness of the mathematical approach. Ultimately, these findings confirm that the RSM models are both statistically valid and highly practical for predicting how extraction parameters influence the recovery of bioactive compounds.

2.9. Phytochemical Analysis of F. communis Extract

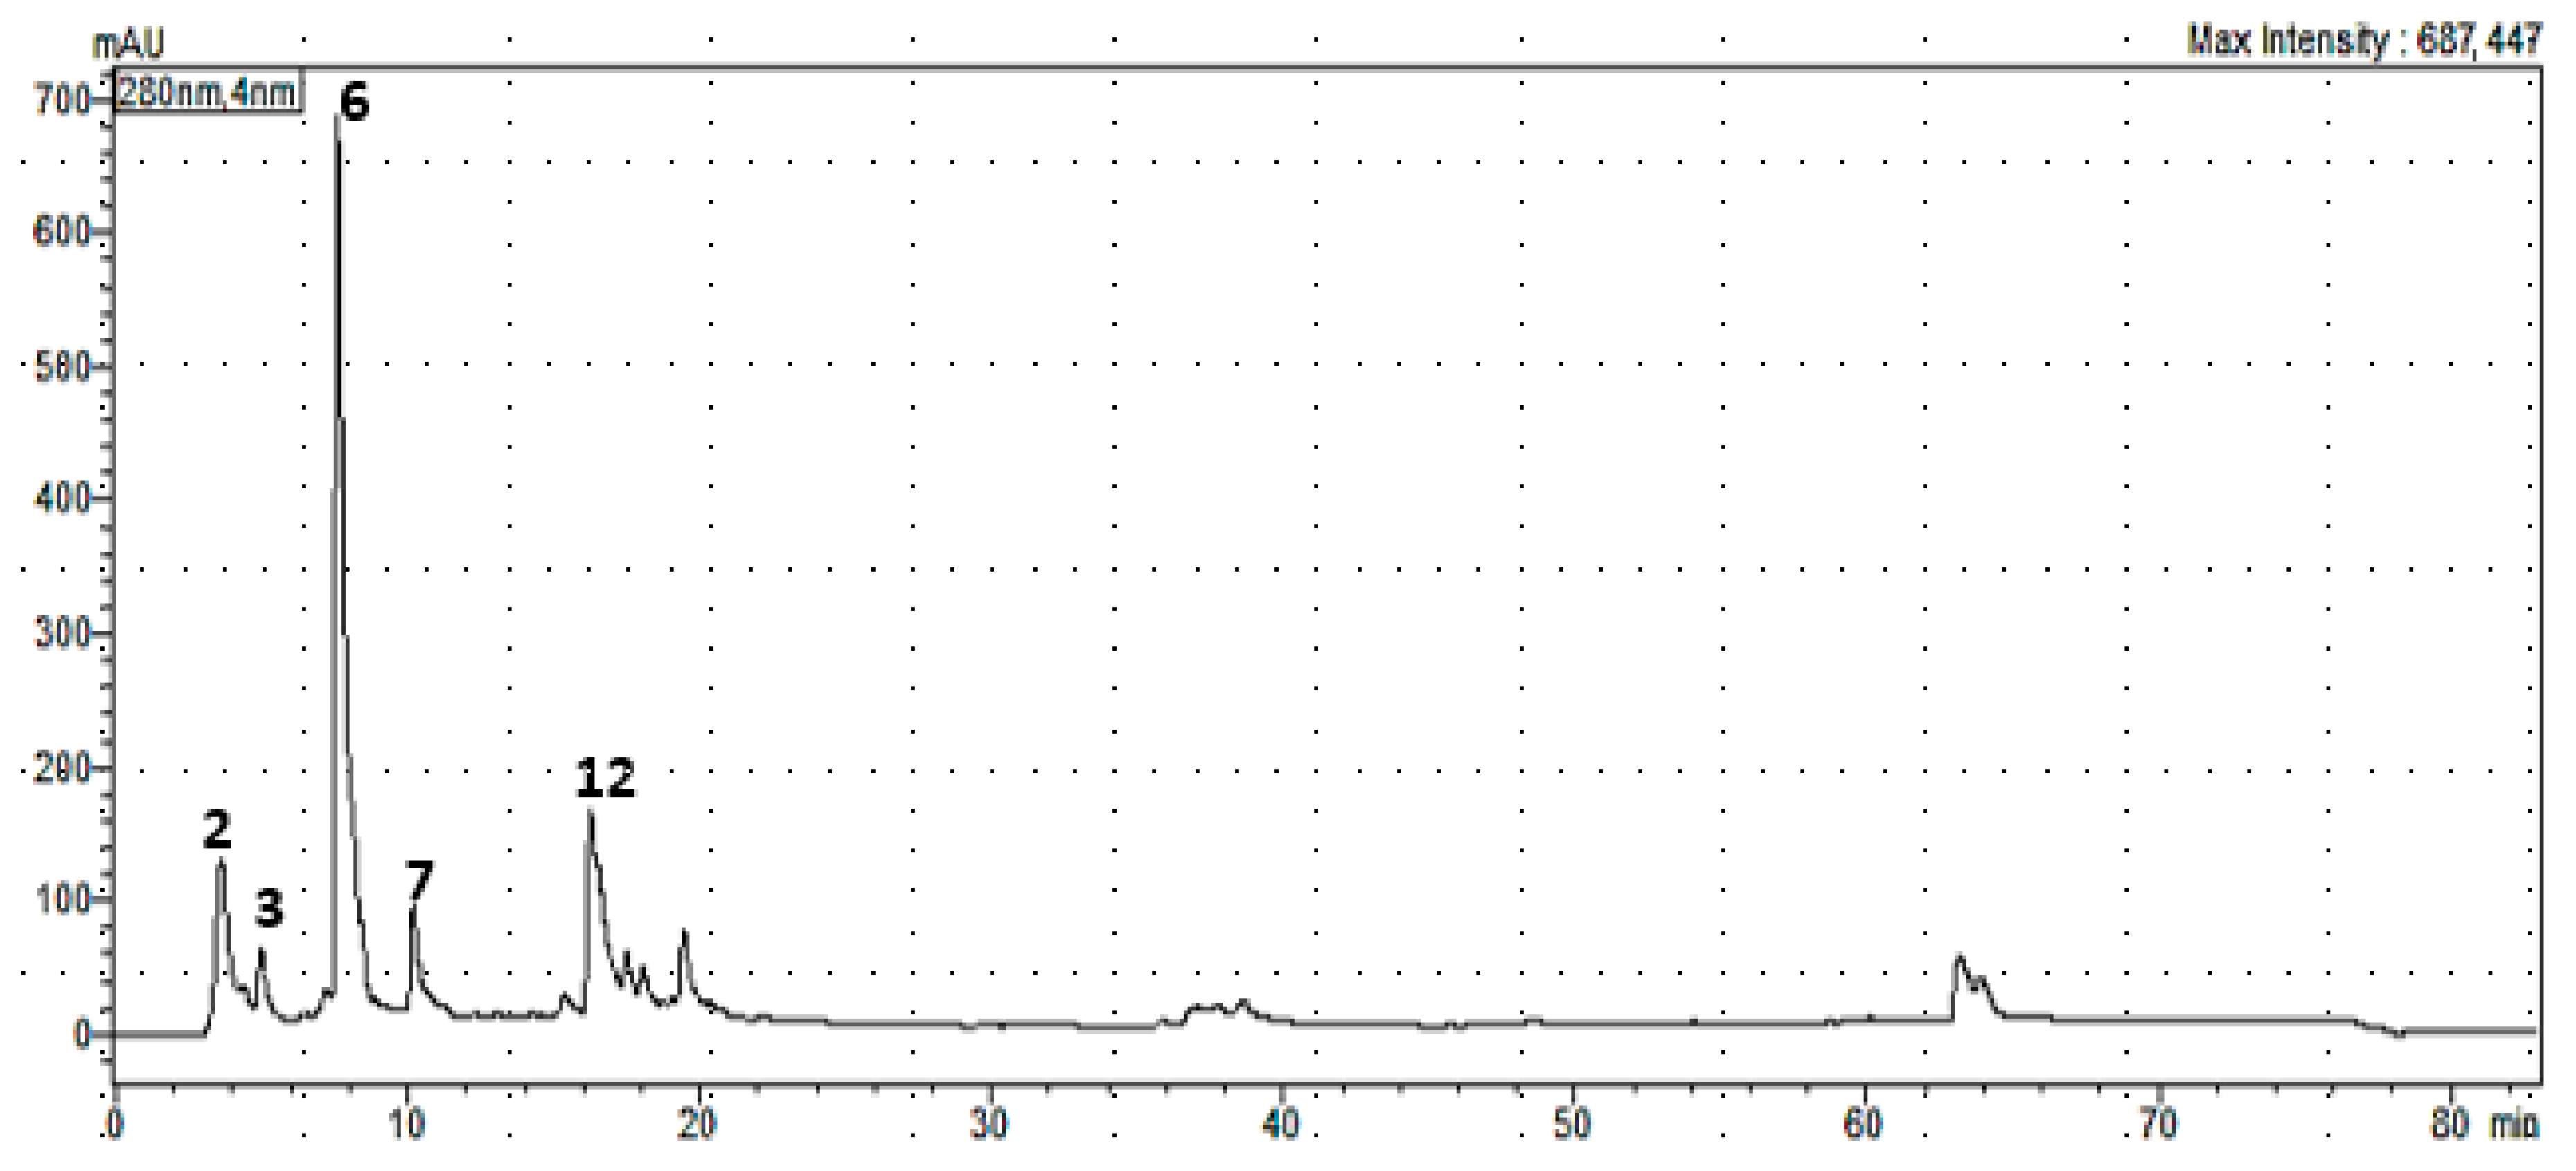
Using HPLC-DAD, eleven phenolic compounds were identified and quantified in the inflorescence of F. communis, namely: pyrogallol, gallic acid, catechol, kaempferol, protocatechuic acid, syringic acid, coumaric acid, ferulic acid, vanillic acid, rutin, and quercetin (Figure 5).
The identification of compounds was performed by comparing their retention times with those of authentic standards. As shown in Table 5, the extract was characterized by the presence of pyrogallol, gallic acid, catechol, protocatechuic acid, syringic acid, coumaric acid, ferulic acid, and vanillic acid, along with flavonoids such as kaempferol, rutin, and quercetin. Among the detected compounds, kaempferol exhibited the highest concentration, followed by pyrogallol, rutin, and ferulic acid.

3. Discussion

3.1. Phytochemical Composition

The optimization of extraction conditions suggests that intermediate extraction time, moderate ethanol concentration, and an appropriate solvent-to-solid ratio favor the efficient recovery of polyphenols from the plant material. These three parameters have a significant impact on extraction yield; however, some degree of interaction between them may exist, highlighting the importance of optimizing them in combination to maximize phenolic compound content while reducing extraction time and solvent consumption. Ref. [13] have confirmed the benefits of combining several factors, including the use of ethanol solutions, time optimization, and the ultrasonic extraction process at Centella asiatica. This method has made it possible to obtain particularly high levels of phenolic compounds and flavonoids. Furthermore, although several studies have addressed the optimization of polyphenol extraction, limited information is available regarding its application in Ferula species, which may justify further investigation.
Our results show that the maximum yield of phenolic compounds, using optimal extraction conditions (67% ethanol, 23 min extraction time, and a solid–solvent ratio of 1:21), is in the range of 32.8 mg GAE/g DW and 17.8 mg QE/g DW for polyphenols and flavonoids, respectively. Similar levels have been reported in plants such as Rhus typhina [14] and Phyllanthus emblica [15], which are recognized for their richness in phenolic compounds and their significant antioxidant and antimicrobial activities.
Analysis of our results reveals that the extraction of polyphenols and flavonoids is influenced by the nature of the solvent used and by the percentage of ethanol in the hydroalcoholic extraction solvent; this percentage determines the solubility of polyphenols through its effect on the polarity of the extraction medium. Thus, the highest yields were obtained when the hydroalcoholic mixture had intermediate polarities between 60 and 67%, combined with a solid–liquid ratio of 1/20. At this concentration, the solvent promotes the solubilization of phenolic compounds with different polarities. Polyphenols, which have a wide variety of structures and polarities, are best extracted with a hydroalcoholic solvent that allows both slightly hydrophilic and slightly hydrophobic molecules, such as flavonoids, to be extracted efficiently.
F. communis leaves polyphenol content (91.5 ± 3.01 mg GAE/g) was observed in [10] and is significantly higher than that obtained for the inflorescence in the present study (34 mg GAE/g). This is consistent with data in the literature reporting heterogeneity in the distribution of metabolites within different plant organs [16]. Leaves are generally richer in secondary metabolites than other organs. This is because leaves, which are directly exposed to UV rays, oxidation, and environmental stress, tend to concentrate higher levels of phenolic compounds to defend themselves against adverse conditions. Furthermore, the high content of secondary metabolites in leaves in general, and phenolic compounds in particular, can be explained by their high photosynthetic activity, which provides the precursors necessary for the synthesis of secondary metabolites. Finally, the relatively low polyphenol content of inflorescence could be linked to their function, which is more oriented towards the synthesis of pigments and attractive compounds in order to better ensure pollination.

3.2. Antioxidant Activity of the Inflorescence of F. communis

We demonstrated the antioxidant activity of the extracts using two different tests: the DPPH test and the TAC test. The anti-radical capacity measured by DPPH (IC50 = 0.17 mg/mL) was obtained with a hydroalcoholic solvent composed of 80% ethanol. With the TAC test, the antioxidant capacity measured is 23.6 mg AAE/g DW obtained with a 55% ethanolic extract. This difference can be explained by the nature of the tests used. The DPPH assay evaluates the ability of a compound to scavenge free radicals through electron and hydrogen atom donation, leading to their neutralization. This activity is mainly related to molecular structure, particularly the presence of phenolic groups, and is often observed in compounds soluble in low-polarity solvents. In contrast, the TAC test, which measures the total antioxidant capacity of the extract, involves more polar compounds that are better extracted at lower alcohol concentrations, such as in a 55% ethanol solvent.
Furthermore, our results also showed that the solvent that yielded the highest polyphenol content (67% ethanol) was not the one with the best antioxidant activity. This can be explained by the fact that the antioxidant activity of polyphenols varies depending on their chemical structure and their ability to interact with free radicals or oxidizing agents. In addition, the antioxidant activity observed may be attributed to other non-phenolic antioxidant compounds. Others [17] have shown in other species that the polarity of the solvent used plays a crucial role in the recovery of bioactive compounds and in the biological activities of the extracts.
The strong antioxidant activity observed in this study can be mainly attributed to the presence of powerful radical scavengers such as gallic acid and pyrogallol. In addition, flavonoids such as kaempferol may contribute significantly to the overall antioxidant capacity through electron transfer mechanisms, suggesting a synergistic effect among different classes of phenolic compounds.
Finally, all these results highlight the importance of an optimization approach that includes both the yield of bioactive compounds and the biological activity of the extracts.

3.3. Phytochemical Analysis of the Extract

Qualitative and quantitative analysis of the hydroethanolic extract of F. communis inflorescence, performed by HPLC-DAD, enabled us to identify 11 phenolic compounds, including tannic acid, pyrogallol, gallic acid, catechol, hydroxytyrosol, caffeic acid, as well as numerous aromatic acids, such as protocatechuic acid, syringic acid, p-coumaric acid, ferulic acid, and vanillic acid. To the best of our knowledge, this is the first study reporting the identification of these phenolic compounds in the inflorescence of F. communis.
These compounds identified in our extract belong to two different families: those of hydroxybenzoic acids represented by gallic, protocatechuic, syringic, vanillic, tannic, pyrogallol, and catechol acids; and hydroxycinnamic acids represented by caffeic, p-coumaric, and ferulic acids. The simultaneous presence of these two families shows that the studied extract has a very significant chemical richness, which may be associated with relevant bioactive properties of the extract, supporting its potential applications in different sectors such as cosmetics and agri-food. Indeed, beyond the well-documented antioxidant properties of these compounds [10]. Other potential properties have been attributed to it, such as antimicrobial, anti-inflammatory, astringent, anti-cancer, major antioxidant, and neuroprotective properties [5,6,11].
Our analyses show that Ferula inflorescence is an attractive source of bioactive compounds (phenols and flavonoids), which are frequently associated with antioxidant, antimicrobial, and even enzyme-inhibiting properties, hence the interest in pharmaceutical, nutraceutical, or cosmetic applications of extracts from the plant studied, especially since other important metabolites have been identified in other organs of this plant. Ref. [5] reported the presence of bioactive sesquiterpenes with notable antibacterial properties, such as ferulene, ferchromone, elemicin, feselol, and daucane ester, in the rhizomes of F. communis, confirming the potential of this species.

4. Material and Methods

4.1. Sample Preparation

Inflorescence of F. communis was collected in March 2025 from Taounate city in Morrocco. Mr. Eloutassi Noureddine, from the Laboratory of Engineering, Electrochemistry, Modeling and Environment, Faculty of Sciences Dhar El Mahraz, Sidi Mohamed Ben Abdellah University (USMBA), Fez, Morocco, carried out the botanical identification. A voucher specimen was deposited under the reference number FAA/120325/01. The aerial parts were washed, shade-dried at room temperature to constant weight for seven days, ground using an electric grinder and sieved to obtain a fine powder. The resulting powders were stored at 4 °C until further analysis. The extraction was carried out using ultrasound-assisted extraction (UAE), by varying three experimental parameters: ethanol concentration, solid-to-solvent ratio (w/v), and sonication time. The extraction was carried out using a VWR USC 300 TH ultrasonic cleaner bath operating at a power of 200 W and a frequency of 45 kHz. During this ultrasound-assisted extraction, three experimental parameters were varied: ethanol concentration, solid-to-solvent ratio (w/v), and sonication time. This methodological choice is supported by the well-established efficiency of ultrasound-assisted extraction in releasing phenolic compounds and other bioactive metabolites [18].

4.2. Determination of Total Phenolic Content (TPC)

The Folin–Ciocalteu reagent was used to determine the total phenolic content concentration as described by [19] with modifications. Briefly, 200 μL of each extract was mixed with 1000 μL of 10% Folin–Ciocalteu reagent and incubated for 5 min at room temperature (25 ± 2 °C). After neutralization with 800 μL of 7.5% sodium carbonate solution, the mixture was incubated for an additional 2 h. The absorbance was measured at 765 nm using a UV–visible spectrophotometer. Gallic acid (0–100 μg/mL) was used as a standard to produce a linear calibration curve. The obtained results were expressed as mg gallic acid equivalents per gram (mg GAE/g DW).

4.3. Determination of Total Flavonoid Content (TFC)

The total flavonoid content of the extracts was determined by a colorimetric method using aluminum chloride [20]. Briefly, 0.25 mL of the extract was mixed with 75 µL of 5% NaNO2 and 150 µL of a 10% methanolic AlCl3 solution. After 6 min, NaOH (1 M) was added to the mixture and the final volume was adjusted to 3 mL with distilled water. The absorbance was then determined at 510 nm. A quercetin standard calibration curve was used to carry out the quantification, and the findings were represented as mg of quercetin equivalents per gram of extract (mg QE/g).

4.4. Antioxidant Activity

4.4.1. DPPH Radical Activity Scavenging Assay

The antioxidant activity of F. communis extract was tested for its ability to neutralize the 2,2-diphenyl-1-picrylhydrazyl (DPPH) radical [21]. Briefly, 1975 μL of a 60 µM methanolic DPPH solution were mixed with 25 µL of each extract. Following a half-hour incubation period in the dark at a temperature of 14.0 ± 2.0 °C, the mixture’s absorbance at 517 nm was determined. The following formula was used to calculate the percentage of inhibition:
I [ % ] = ( A 0 A s ) A 0 × 100
w h e r e   A s is the sample’s absorbance and A0 is the absorbance of the negative control.
IC50 values were determined by interpolation from the concentration–response curve, using linear regression between inhibition percentages and extract concentrations. The IC50 was defined as the concentration required to inhibit 50% of DPPH radicals.

4.4.2. Total Antioxidant Capacity (TAC)

The total antioxidant capacity of the extracts was assessed spectrophotometrically by the phosphomolybdenum method according to the procedure described by [22]. A total of 200 µL of each sample extract was mixed with 2 mL reagent solution (0.6 M H2SO4, 28 mM Sodium phosphate and 4 mM Ammonium molybdate). The mixtures were incubated at 95 °C for 90 to 120 min, and the absorbance was measured at 700 nm. A standard ascorbic acid calibration curve (0–200 µg/mL) was used for quantification, and the total antioxidant capacity (TAC) was expressed in milligrams of ascorbic acid equivalents per gram of dry matter (mg AAE/g DW).

4.5. HPLC-DAD Analysis

The chemoprofiling of the inflorescence extract of F. communis, obtained under the globally optimized extraction conditions predicted by the desirability function, was investigated using a reverse-phase high-performance liquid chromatography coupled with a diode array detector (HPLC-DAD). Before being analyzed by HPLC (Shimadzu, model [DGU-20A5R], Kyoto, Japan), the extracts (10 mg) were diluted in 1 mL of 80 percent methanol and filtered through 0.45 µm filters (Diode Array Detector) at a temperature of 40 °C, and Wakosil C18HG (5 mm, 4.6 × 150mm) was used to separate phenolic chemicals. Using a binary solvent combination made up of 50/50 methanol and acetonitrile and water acidified with 0.2 percent phosphoric acid (solvent A), the elution was performed in gradient mode (solvent B). After re-equilibrating for 12 min to the initial composition, a linear gradient was run from 96 percent (A) and 4 percent (B) to 50 percent (A) and 50 percent (B) for 40 min. It switched to 40 percent (A) and 60 percent for 5 min (B). It alternated between 0% (A) and 100% for 15 min (B). Each sample was injected at a volume of 20 µL at a flow rate of 1 mL/min for the mobile phase. The standard components, notably tannic acid, pyrogallol, gallic acid, catechol, hydroxytyrosol, caffeic acid, kaempferol, tyrosol, protocatechuic acid, syringic acid, coumaric acid, ferulic acid, vanillic acid, oleuropein, rutin, quercetin, and rosmarinic acid, were dissolved in HPLC-grade methanol. The phenolic components were identified through absorption spectra and retention time with the standard compounds used [23].

4.6. Experimental Design

The chosen experimental design was a central composite design with three factors. To ensure the reliability and estimate the pure experimental error, four replicates were performed at the central point of the domain, leading to a total of 17 experimental runs.

4.7. Mathematical Modeling

A second-order polynomial equation was postulated to model the relationship between the independent factors and the measured responses. The general form of the equation is:
Y = β0 + β1X1 + β2X2 + β3X3 + β11X12 + β22X22 + β33X32 + β12X1X2 + β13X1X3 + β23X2X3 + ε
In this model, Y represents the predicted response variable, corresponding to total phenolic content (TPC), total flavonoid content (TFC), DPPH IC50, or total antioxidant capacity (TAC). The term β0 denotes the intercept coefficient of the model, while β1, β2, and β3 represent the linear coefficients associated with the independent variables. The coefficients β11, β22, and β33 describe the quadratic effects, whereas β12, β13, and β23 account for the interaction effects between the studied factors. The variables X1, X2, and X3 correspond to the coded values of the independent factors, namely extraction time, ethanol concentration, and solvent-to-material ratio. Finally, ε represents the random error term of the model.

4.8. Statistical Analyses

The statistical significance of the developed models was evaluated using the F-test derived from analysis of variance (ANOVA). Student’s t-test was applied to assess the significance of the regression coefficients, while the goodness of fit of the models was evaluated using the coefficient of determination (R2). Statistical analyses were performed using JMP® Pro software (version 17) and Design-Expert (version 12), which were employed for experimental design, data analysis, and optimization procedures. A confidence level of 95% was adopted, and p-values lower than 0.05 were considered statistically significant. The F-test was also used for comparing group means. Results are expressed as mean ± standard deviation (SD).
Measurements of total phenolic content (TPC), total flavonoid content (TFC), DPPH radical scavenging activity, total antioxidant capacity (TAC), and HPLC quantification were performed in triplicate as analytical replicates (n = 3). Results were expressed as mean ± standard deviation (SD).

5. Conclusions

The present study constitutes the first systematic investigation of the phenolic composition and antioxidant potential of F. communis inflorescence extracts using an optimized UAE-RSM approach, thereby filling a significant gap in the phytochemical characterization of this underexplored organ.
The optimization of extraction conditions by the central composite design method demonstrated that solvent polarity plays a determining role in the extraction yield of phenolic compounds. The hydroalcoholic mixture composed of 67% ethanol yielded the highest total polyphenol and flavonoid contents. This result underlines the importance of systematic parameter optimization over conventional approaches and provides a reproducible and transferable extraction protocol, directly applicable in laboratory and industrial settings.
The antioxidant activity results, obtained by two complementary methods the DPPH free radical scavenging test (IC50 = 0.17 mg/mL) and the total antioxidant capacity (23.6 mg AAE/g DW) confirmed the significant antioxidant potential of the studied extracts. The variations observed between the two methods reflect the chemical diversity of the antioxidant compounds present, with different phenolic fractions contributing distinctly to hydrogen atom transfer and electron transfer mechanisms.
The phenolic profile established by HPLC-DAD revealed a rich and diverse composition, with eleven identified compounds belonging to the hydroxycinnamic and hydroxybenzoic acid families. The predominance of kaempferol and pyrogallol provides a biochemical basis for the observed biological activities and supports the traditional medicinal uses attributed to this species. The simultaneous presence of less polar compounds such as ferulic acid, and vanillic acid further enriches the bioactive profile of the inflorescence and suggests a broad spectrum of potential biological activities worthy of further investigation.
Taken together, these results demonstrate that F. communis inflorescence extract exhibits a notable enrichment in phenolic compounds and a significant in vitro antioxidant potential. However, it should be emphasized that these findings are preliminary in nature, and that practical applications in the nutraceutical, pharmaceutical, and cosmetic sectors cannot be claimed at this stage. Further research is needed, including the complete identification and structural characterization of bioactive compounds, the validation of biological activities through in vitro and in vivo experimental models, and a thorough evaluation of the safety profile and potential toxicity of the extracts.
From a broader perspective, this work contributes to the valorization of a Mediterranean plant resource and opens several research avenues, including the in vitro and in vivo evaluation of specific biological activities, the identification of synergistic effects between the identified phenolic compounds, and the development of functional formulations based on standardized extracts. Future studies should also examine the seasonal and geographical variability of the phenolic composition, as well as the bioavailability and stability of the identified compounds under processing conditions.

Author Contributions

M.L.: Writing—original draft, Visualization, Resources, Investigation, Formal analysis, Data curation, Conceptualization. N.O.: Writing—original draft, Data curation, Investigation, Formal analysis, Conceptualization. M.F.: Writing—review and editing, Formal analysis, Software, Supervision, Conceptualization. K.F.: Investigation, Data curation. M.M.: Writing—review and editing, Supervision, Validation. L.E.G.: Writing—review and editing, Supervision, Validation, Resources, Conceptualization. K.M.: Writing—review and editing, Supervision, Validation, Resources, Conceptualization. All authors have read and agreed to the published version of the manuscript.

Funding

This research received no external funding.

Institutional Review Board Statement

Not applicable.

Informed Consent Statement

Not applicable.

Data Availability Statement

Data will be made available on request.

Conflicts of Interest

The authors declare that they have no known competing financial interests or personal relationships that could have appeared to influence the work reported in this paper.

References

  1. Wariss, H.M.; Yang, L.; Ahmad, S.; Yaseen, A.; Riaz, M.; Tariq, A.; Li, W. The ethnomedicinal, pharmacological, and phytochemical potential of Ferula sinkiangensis K.M.Shen: An updated and comprehensive review. J. Ethnopharmacol. 2026, 354, 120444. [Google Scholar] [CrossRef] [PubMed]
  2. Salehi, M.; Naghavi, M.R.; Bahmankar, M. A review of Ferula species: Biochemical characteristics, pharmaceutical and industrial applications, and suggestions for biotechnologists. Ind. Crops Prod. 2019, 139, 111511. [Google Scholar] [CrossRef]
  3. Elalaoui-Faris, E.F.; Cauwet-Marc, A.-M. Nombre chromosomique de quelques espèces de férules marocaines (Ferula, Apiaceae). Flora Mediterr. 2006, 16, 341–354. [Google Scholar]
  4. Khayat, M.T.; Alharbi, M.; Ghazawi, K.F.; Mohamed, G.A.; Ibrahim, S.R.M. Ferula sinkiangensis (Chou-AWei, Chinese Ferula): Traditional Uses, Phytoconstituents, Biosynthesis, and Pharmacological Activities. Plants 2023, 12, 902. [Google Scholar] [CrossRef] [PubMed]
  5. Al-Yahya, M.A.; Muhammad, I.; Mirza, H.H.; El-Feraly, F.S. Antibacterial constituents from the rhizomes of Ferula communis. Phytother. Res. 1998, 12, 335–339. [Google Scholar] [CrossRef]
  6. Mamoci, E.; Cavoski, I.; Simeone, V.; Mondelli, D.; Al-Bitar, L.; Caboni, P. Chemical composition and in vitro activity of plant extracts from Ferula communis and Dittrichia viscosa against postharvest fungi. Molecules 2011, 16, 2609–2625. [Google Scholar] [CrossRef] [PubMed]
  7. Yirdaw, B.; Kassa, T. Preliminary phytochemical screening and antibacterial effects of root bark of Ferula communis (Apiaceae). Vet. Med. Sci. 2023, 9, 1901–1907. [Google Scholar] [CrossRef] [PubMed]
  8. Maggi, F.; Papa, F.; Dall’Acqua, S.; Nicoletti, M. Chemical analysis of essential oils from different parts of Ferula communis L. growing in central Italy. Nat. Prod. Res. 2016, 30, 806–813. [Google Scholar] [CrossRef] [PubMed]
  9. Rahali, F.Z.; Lamine, M.; Gargouri, M.; Rebey, I.B.; Hammami, M.; Sellami, I.H. Metabolite profiles of essential oils and molecular markers analysis to explore the biodiversity of Ferula communis: Towards conservation of the endemic giant fennel. Phytochemistry 2016, 124, 58–67. [Google Scholar] [CrossRef] [PubMed]
  10. Kavaz, D.; Faraj, R.E.K.E. Investigation of composition, antioxidant, antimicrobial and cytotoxic characteristics from Juniperus sabina and Ferula communis extracts. Sci. Rep. 2023, 13, 7193. [Google Scholar] [CrossRef] [PubMed]
  11. Ahmadi, E.; Rezadoost, H.; Alilou, M.; Stuppner, H.; Farimani, M.M. Purification, structural characterization and antioxidant activity of a new arabinogalactan from Dorema ammoniacum gum. Int. J. Biol. Macromol. 2022, 194, 1019–1028. [Google Scholar] [CrossRef] [PubMed]
  12. Nouioura, G.; Tourabi, M.; Tahraoui, A.; El-Yagoubi, K.; Maache, S.; Elfatemi, H.; Lyoussi, B.; Derwich, E.H. Assessment of the acute and subacute toxicity of the aqueous extract of Moroccan Ferula communis fruit in a mouse model. Saudi Pharm. J. 2023, 31, 101701. [Google Scholar] [CrossRef] [PubMed]
  13. Hiranpradith, V.; Therdthai, N.; Soontrunnarudrungsri, A.; Rungsuriyawiboon, O. Optimisation of Ultrasound-Assisted Extraction of Total Phenolics and Flavonoids Content from Centella asiatica. Foods 2025, 14, 291. [Google Scholar] [CrossRef] [PubMed]
  14. Cocîrlea, M.D.; Simionescu, N.; Călin, T.; Gatea, F.; Badea, G.I.; Vamanu, E.; Oancea, S. Box–Behnken Design-Based Optimization of Extraction Parameters of Phenolics, Antioxidant Activity, and In Vitro Bioactive and Cytotoxic Properties of Rhus typhina Fruits. Appl. Sci. 2024, 14, 11096. [Google Scholar] [CrossRef]
  15. Suryani, M.; Yulyana, A.; Sumaiyah, S.; Fitri, K.; Lubis, L.D.; Daulay, W.; Surbakti, C.; Astyka, R.; Lubis, M.F. Microwave-assisted extraction enhances the antioxidant and anti-diabetic activities of polyphenol-rich Phyllanthus emblica fruit extract. Discov. Food 2025, 5, 244. [Google Scholar] [CrossRef]
  16. Bahetjan, Y.; Muhaxi, M.; Pang, K.; Kizaibek, M.; Tang, H.; Sefidkon, F.; Yang, X. Chemistry, Bioactivity, and Prediction of the Quality Marker (Q-Marker) of Ferula Plants in China: A Review. Molecules 2023, 28, 5191. [Google Scholar] [CrossRef] [PubMed]
  17. Zekkori, B.; Bentayeb, A.; Ed-Dra, A.; Filali, F.R.; Sbai, A.; Chlif, N.; El Omari, M.; Khallouki, F. Effect of Hydro-Alcohol Solvent Polarity on the Antioxidant, Antibacterial and Anti-Inflammatory Activities of Four Moroccan Lettuce Varieties (Lactuca sativa L.): A Comparative Study. Carpathian J. Food Sci. Technol. 2021, 13, 133–149. [Google Scholar] [CrossRef]
  18. González-Silva, N.; Nolasco-González, Y.; Aguilar-Hernández, G.; Sáyago-Ayerdi, S.G.; Villagrán, Z.; Acosta, J.L.; Montalvo-González, E.; Anaya-Esparza, L.M. Ultrasound-Assisted Extraction of Phenolic Compounds from Psidium cattleianum Leaves: Optimization Using the Response Surface Methodology. Molecules 2022, 27, 3557. [Google Scholar] [CrossRef] [PubMed]
  19. Lamuela-Ravents, R.M. 2,6-di-tert-butyl-4-hydroxytoluene. Methods Enzymol. 1999, 299, 152–178. [Google Scholar]
  20. Dewanto, V.; Wu, X.; Adom, K.K.; Liu, R.H. Thermal processing enhances the nutritional value of tomatoes by increasing total antioxidant activity. J. Agric. Food Chem. 2002, 50, 3010–3014. [Google Scholar] [CrossRef] [PubMed]
  21. Brand-Williams, W.; Cuvelier, M.E.; Berset, C. Use of a Free Radical Method to Evaluate Antioxidant Activity. LWT Food Sci. Technol. 1995, 30, 25–30. [Google Scholar] [CrossRef]
  22. Prieto, P.; Pineda, M.; Aguilar, M. Spectrophotometric Quantitation of Antioxidant Capacity through the Formation of a Phosphomolybdenum Complex: Specific Application to the Determination of Vitamin E. Anal. Biochem. 1999, 269, 337–341. [Google Scholar] [CrossRef] [PubMed]
  23. Ghomari, O.; Sounni, F.; Massaoudi, Y.; Ghanam, J.; Kaitouni, L.B.D.; Merzouki, M.; Benlemlih, M. Phenolic profile (HPLC-UV) of olive leaves according to extraction procedure and assessment of antibacterial activity. Biotechnol. Rep. 2019, 23, e00347. [Google Scholar] [CrossRef] [PubMed]
Figure 1. Plots of actual vs. predicted values for (A) TPC, (B) TFC, (C) DPPH-IC50, and (D) TAC.
Molecules 31 02235 g001
Figure 2. 2D contour plots and 3D response surface plots for the four responses—TPC (A), TFC (B), DPPH-IC50 (C), and TAC (D)—as a function of extraction time and ethanol concentration, with the solvent-to-material ratio held constant at its optimal value for each response.
Molecules 31 02235 g002
Figure 3. Desirability profiles for the individual optimization of the four responses: TPC (A), TFC (B), DPPH-IC50 (C), and TAC (D).
Molecules 31 02235 g003
Figure 4. Desirability profile for the simultaneous optimization of the four responses (TPC, TFC, DDPH-IC50, and TAC).
Molecules 31 02235 g004
Figure 5. HPLC-DAD chromatogram of F. communis ethanolic extract and standards at 280 nm, showing the main identified phenolic compounds: (2) pyrogallol, (3) gallic acid, (6) caffeic acid, (7) kaempferol, and (12) ferulic acid.
Molecules 31 02235 g005
Table 1. Central composite design matrix with experimental results for TPC, TFC, DPPH-IC50, and TAC.
Run No.Time (min)ETOH Conc. (%)Solvent-to-Solid RatioTPC (mg GAE/g DW)TFC (mg QE/g DW)DPPH-IC50 (mg/mL)TAC (mg AAE/g DW)
114401011.598.206.3914.84
214403011.6710.696.4314.43
314801018.9710.860.6514.29
414803020.7012.861.9914.54
530401017.6314.032.6418.35
630403015.6312.063.5116.14
730801019.6315.111.4615.76
830803020.1015.292.6213.19
914602023.0313.892.2618.40
1030602028.4716.071.3820.99
1122402022.7713.753.2123.21
1222802032.5215.630.5819.59
1322601026.1016.630.7221.36
1422603028.0717.411.6421.24
1522602034.9317.361.4021.99
1622602030.0717.361.6523.86
1722602032.4718.031.6424.04
TPC—Total Phenolic Content; TFC—Total Flavonoid Content; DPPH-IC50—DPPH radical scavenging capacity (IC50), half-maximal inhibitory concentration; TAC—Total Antioxidant Capacity.
Table 2. ANOVA results for the second-order models of TPC, TFC, DPPH-IC50, and TAC.
ResponseSource of VariationDFSum of SquaresMean SquareF-Ratiop-Value
TPCRegression9796.2488.4725.790.0001
Residual724.023.43
Lack of fit512.182.440.410.8169
Pure Error211.845.92
Total16820.26
R20.97
R2adj0.93
R2pred0.85
TFCRegression9121.6113.5144.08<0.0001
Residual72.150.31
Lack of fit51.850.372.470.1313
Pure Error20.300.15
Total16123.76
R20.98
R2adj0.96
R2pred0.77
DPPH-IC50Regression947.125.2436.11<0.0001
Residual71.020.15
Lack of fit50.970.199.730.0958
Pure Error20.040.02
Total1648.13
R20.98
R2adj0.95
R2pred0.85
TACRegression9215.6423.9629.08<0.0001
Residual75.770.82
Lack of fit53.190.640.490.7731
Pure Error22.581.29
Total16221.41
R20.97
R2adj0.94
R2pred0.86
Table 3. Estimated regression coefficients for the predictive models.
TermCoeff.TPCTFCDPPH-IC50TAC
Estimatep-ValueEstimatep-ValueEstimatep-ValueEstimatep-Value
Interceptβ032.15<0.0001 *17.39<0.0001 *1.24<0.0001 *23.43<0.0001 *
Time (X1)β11.550.0330 *1.61<0.0001 *−0.610.0014 *0.790.0279 *
ETOH Conc. (X2)β23.260.0008 *1.100.0004 *−1.49<0.0001 *−0.960.0124 *
S/M Ratio (X3)β30.220.71260.350.08850.430.0087 *−0.510.1216
X1 × X2β12−1.240.0994−0.060.75241.010.0001 *−0.640.0874
X1 × X3β13−0.420.5433−0.790.0051 *0.080.5645−0.580.1116
X2 × X3β230.510.45750.210.32490.200.18310.040.9103
X12β11−6.150.0010 *−2.260.0003 *0.830.0093 *−3.840.0002 *
X22β22−4.260.0071 *−2.550.0001 *0.900.0062 *−2.140.0063 *
X32β33−4.820.0038 *−0.220.52870.180.4536−2.240.0050 *
* Statistically significant at the 95% confidence level (p < 0.05).
Table 4. Predicted and experimental values for the test point realized under optimal simultaneous parameters.
TPC (mg GAE/g DW)TFC (mg QE/g DW)DPPHIC50 (µg/mL)TAC (mg AAE/g DW)
ParametersOptimal Parameters ValuesPredicted Value aExperimental Value bPredicted Value aExperimental Value bPredicted Value bExperimental Value aPredicted Value bExperimental Value a
Time (min)2332.18 ± 1.8731.66 ± 2.5917.52 ± 0.5618.26 ± 3.211.13 ± 0.380.95 ± 0.4423.5 ± 0.9221.75 ± 4.16
ETOH conc. (%)60
Solvent to material ratio19
a The predicted value is given with the standard deviation of the response calculated from the model. b The observed value is the average of three replicates with standard error.
Table 5. HPLC analysis phenolic compounds in F. communis inflorescence extracts (mg/g extract).
StandardsRTInflorescence
Pyrogallol3.411.05 ± 0.31
Gallic acid5.410.53 ± 0.34
Catechol6.240.22 ± 0.00
kaempferol10.681.56 ± 0.13
Protocatechuic acid12.540.28 ± 0.12
Syringic acid13.250.16 ± 0.03
Coumaric acid15.160.18 ± 0.17
Ferulic Acid17.560.69 ± 0.12
Vanillic acid18.560.51 ± 0.06
Rutin22.470.93 ± 0.60
Quercetin27.490.05 ± 0.06
Values are presented as mean ± standard deviation of three independent experiments (n = 3). RT: retention time.
Disclaimer/Publisher’s Note: The statements, opinions and data contained in all publications are solely those of the individual author(s) and contributor(s) and not of MDPI and/or the editor(s). MDPI and/or the editor(s) disclaim responsibility for any injury to people or property resulting from any ideas, methods, instructions or products referred to in the content.