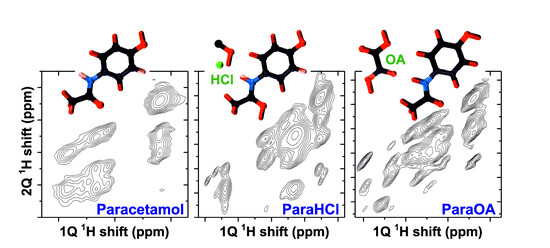
Article

1H–1H Interatomic Distances in Paracetamol-Based Structures Unveiled by Double-Quantum NMR and DFT Calculations


Department of Chemistry, Stockholm University, SE-106 91 Stockholm, Sweden
*
Author to whom correspondence should be addressed.
Current address: Laboratory of Physical Chemistry, Latvian Institute of Organic Synthesis, 1006 Riga, Latvia.
Current address: Department of Chemistry, National Institute of Technology Tiruchirappalli, Tiruchirappalli 620015, India.
Molecules 2026, 31(10), 1584; https://doi.org/10.3390/molecules31101584
Submission received: 17 April 2026 / Revised: 29 April 2026 / Accepted: 5 May 2026 / Published: 9 May 2026
(This article belongs to the Section Physical Chemistry)

Abstract

The crystal structures of monoclinic paracetamol, its cocrystal with oxalic acid (ParaOA), and its HCl monohydrate salt (ParaHCl) were refined by density functional theory (DFT) calculations and contrasted with the initial X-ray diffraction (XRD) structures. Two independent, but largely consistent, assessments were made: (i) comparisons between 1H and 13C chemical shifts obtained from magic-angle spinning (MAS) nuclear magnetic resonance (NMR) experiments and those predicted by plane-wave DFT calculations before and after geometry optimization; (ii) direct 1H–1H distance evaluations by a recently introduced NMR crystallography method that offers straightforward structure assessments due to interatomic-distance constraints from one double-quantum–single-quantum (2Q–1Q) 1H NMR correlation experiment. For both the 1H/13C chemical shift and 1H–1H distance assessments, the geometry-optimized ParaHCl structure offered a markedly better match than the initial XRD structure, while the XRD structure of paracetamol revealed excellent agreement with the NMR data, with only marginal improvements offered by the DFT optimization. The XRD-derived structure of ParaOA also agreed well with the NMR chemical shift/distance constraints: While the computed 13C chemical shifts showed better agreement with those from MAS NMR, slightly larger discrepancies were observed for the 1H chemical shifts and the 1H–1H distances. We also discuss the chemical shifts and present the first 1H and 13C MAS NMR-peak assignments for the ParaHCl and ParaOA structures.

Graphical Abstract

1. Introduction

Access to reliable and efficient structure-determination tools is paramount for the development of new active pharmaceutical ingredients (APIs) in powdered forms. While X-ray diffraction (XRD) largely meets those requirements, it is well-known that it often provides unreliable proton positions even from single crystals, which is particularly problematic when studying weak noncovalent interactions, such as hydrogen [1,2,3,4,5,6,7] and tetrel [8,9] bonds in supramolecular aggregates, yet intermolecular interactions often govern the crystal structure, such as in salts and co-crystals [10,11] that are often employed for more efficient API administration. Although neutron diffraction offers accurate H positions, it is often not available for routine applications, whereas electron diffraction is prone to damage the structures of organic molecules. Moreover, diffraction-based techniques are normally of limited utility for probing disordered structures. Here, the utilization of 1H magic-angle-spinning (MAS) nuclear magnetic resonance (NMR) experimentation is an attractive alternative tool, largely thanks to its comparatively high NMR-signal sensitivity and applicability to well-ordered and amorphous materials [12,13,14,15,16]. Over the past two decades, solid-state 1H NMR utilization has increased significantly in pharmaceutical research due to the availability of steadily increasing MAS rates for suppressing the otherwise spectral-resolution-limiting effects of magnetic 1H–1H dipolar interactions, which are mediated directly through space and depend on the inverse cube of the interatomic 1H–1H distance [12,13,14,15].
Despite these advances, however, interferences among the vast number of mutually dipolar-coupled 1H spins in structures have severely compromised accurate de novo 1 H–1H distance determinations. Rather, the “NMR crystallography” branch has primarily relied on structure validations by contrasting experimental 1H, 13C, or 15N chemical shifts with those calculated from a crystal structure model refined by density functional theory (DFT) calculations [17,18,19,20,21,22,23,24]. While such procedures have indeed proven very powerful, they do not offer direct internuclear distance constraints. Several NMR crystallography studies utilizing advanced dipolar-based NMR techniques are nevertheless reported to date, most of which involve 2D NMR experimentation that recovers (“recouples”) dipolar interactions in pairs of nuclear spins that are otherwise largely or partially suppressed by MAS [12,13,14,15], where we henceforth focus only on homonuclear 1H–1H dipolar interactions/distances. Typically, these strategies rely on monitoring the 2D NMR-signal buildup of dipolar-driven 1H polarization transfers or double-quantum (2Q) coherences (2QC) [12,13,14,15,25,26,27,28,29,30,31,32,33] for progressively increasing dipolar recoupling periods to sample the spin dynamics, which in general demands acquiring several 2D NMR spectra and the subsequent integration of all relevant 2D NMR-peak intensities. Besides the experimental efforts, the extraction of precise 1H–1H internuclear distances is far from trivial for the strongly coupled multi-spin 1H systems of organic molecules. Current options rely either on time-consuming multi-spin spin-dynamics simulations that by necessity must be limited to analyzing only a few 1H sites (≲10) of the model structure to be validated [30,31,32] or by phenomenological approaches to approximate the spin dynamics [27,28,29]. At the price of limiting the information, however, selective dipolar recoupling of a specifically targeted spin pair may be employed [34,35,36].
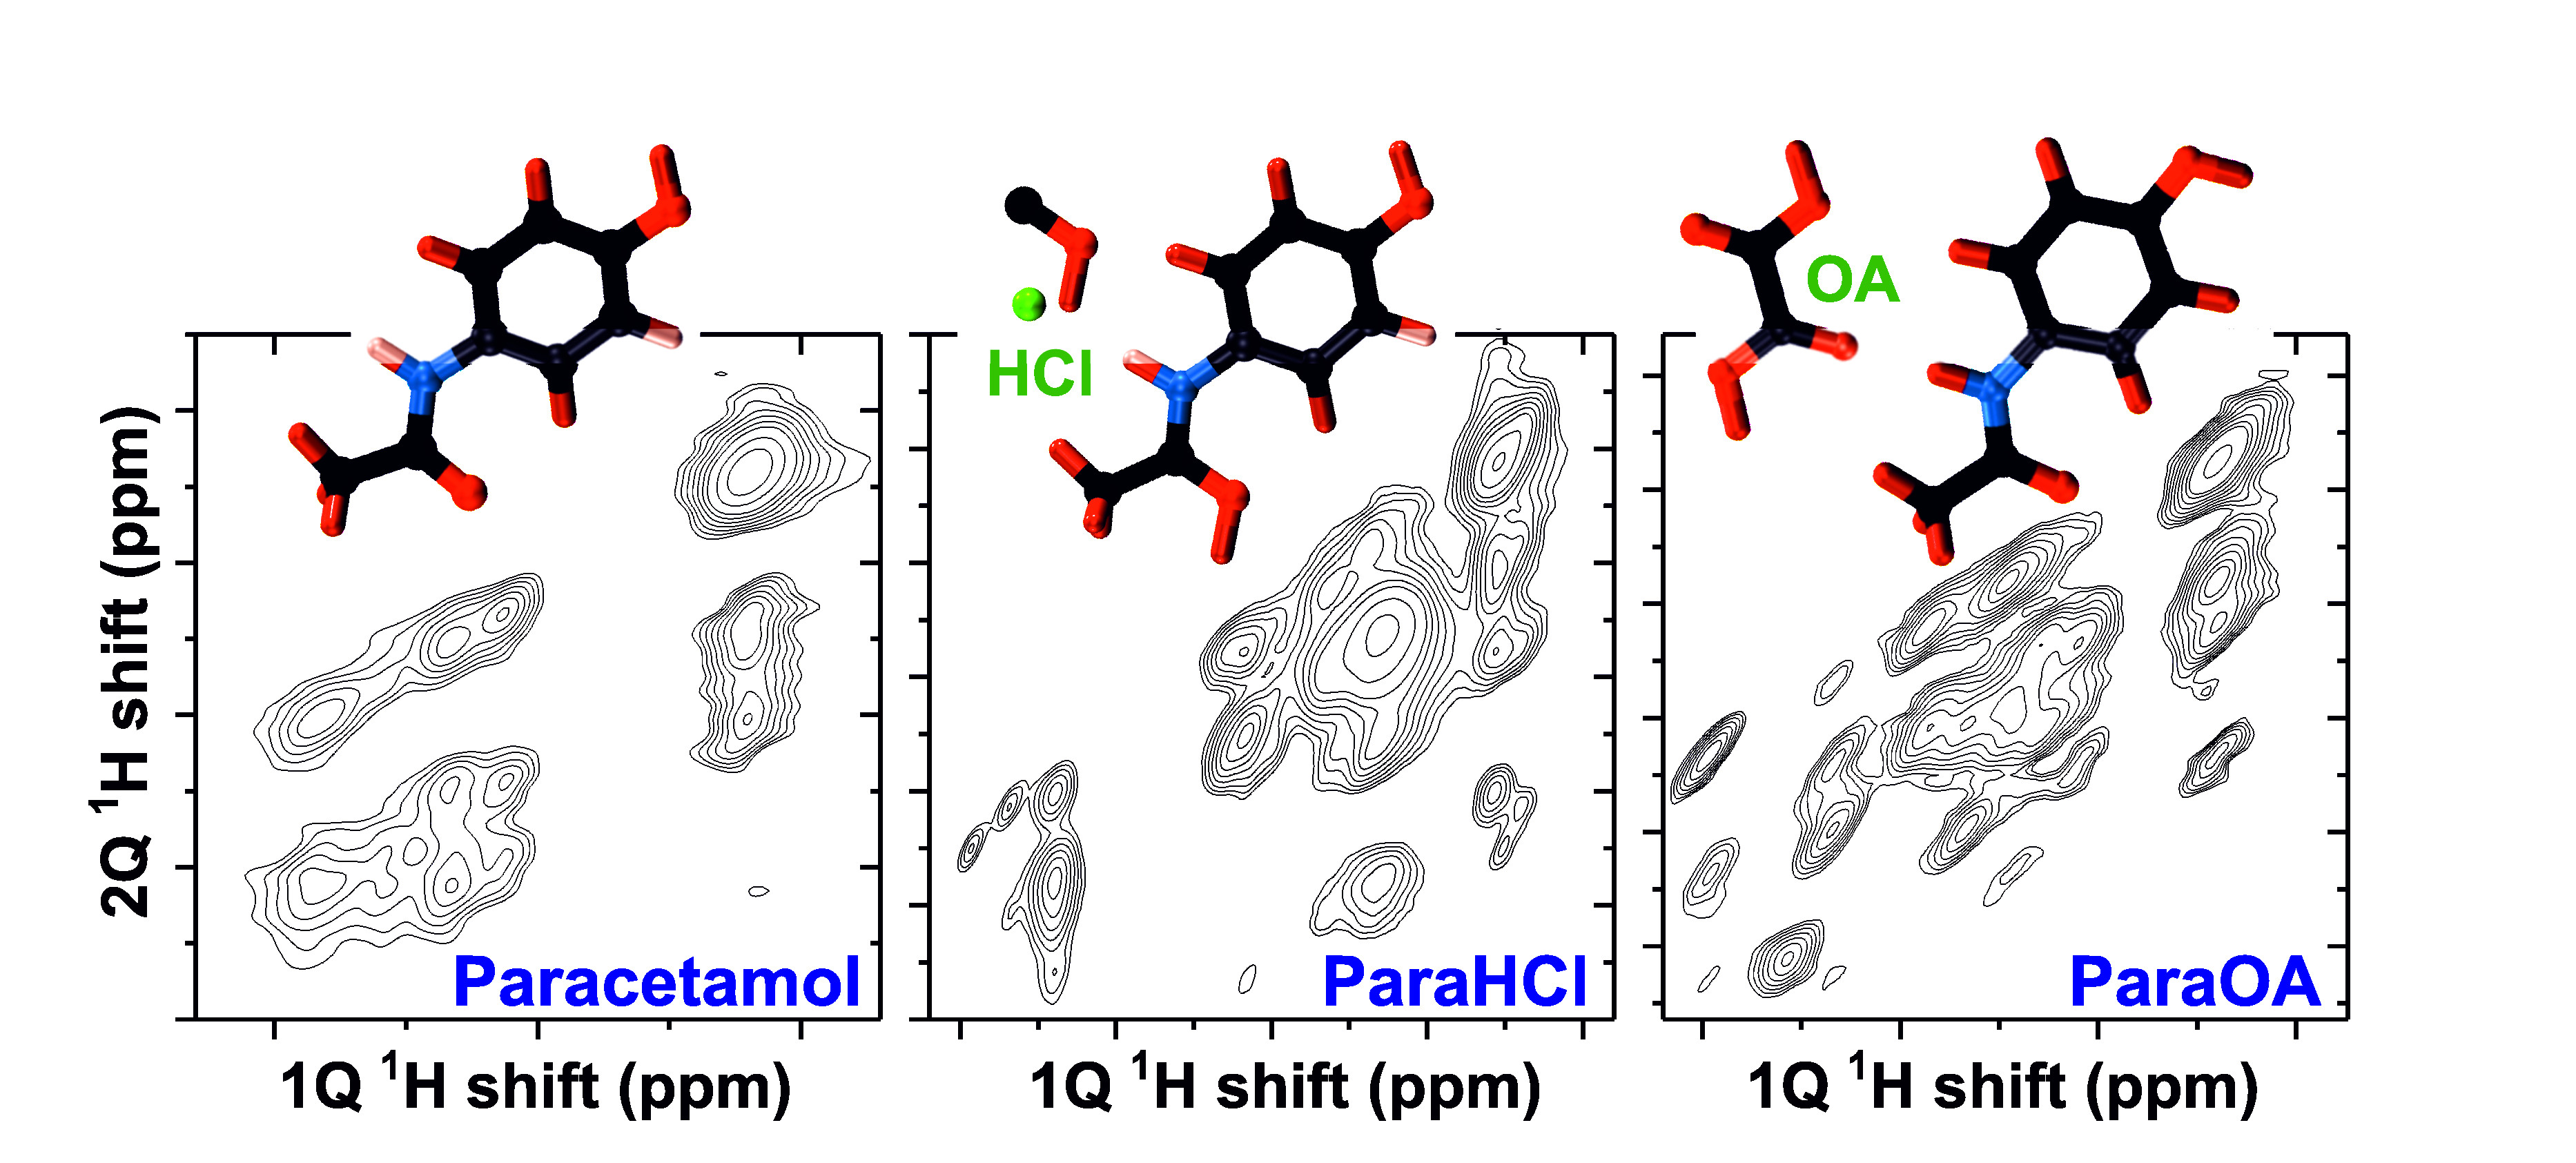
Herein, we exploit direct 1H–1H distance constraints offered by a recently introduced NMR crystallography method that features some decisive advantages: It only involves analyses of one sole double-quantum–single-quantum (2Q–1Q) 1H correlation NMR spectrum [37,38], for which its integrated peak intensities may be used to readily validate any structure model obtained from experiments (e.g., XRD) or computational modeling. The method is general and has thus far been applied to probe 1H–31P and 1H–1H distances in the Ca phosphate mineral monetite [37], along with 1H–31P, 1H–13C and 1H–1H distances in phosphoserine and its Ca salt [38]. Despite its advantages, encompassing the alleviation of the “dipolar truncation” phenomenon that compromises determinations of long interatomic distances of two distant nuclear sites that are strongly dipolar-coupled to other neighbors [13,14,31], the NMR crystallography method has received little attention. To hopefully spread the utilization of this method, Section 2.5 outlines the procedure and discusses practical aspects specific for 1H–1H distance analyses, which partially complement and expand the information given in refs. [37,38].
N-acetyl-para-aminophenol ( C 8 H 9 NO 2 ) is colloquially referred to as acetaminophen or paracetamol and constitutes one of the most commonly utilized APIs for reducing fever and pain. The mechanical properties of paracetamol powder make it difficult to compact into tablets, however, which has prompted the search for alternative formulations to enable efficient compaction, encompassing cocrystals [39] or salts [40]. Although salt formation is the most frequently employed route for API administration, it was not accomplished until recently for paracetamol [40]. Herein, we investigate the structures of monoclinic paracetamol, which is the most stable of the three polymorphs and is henceforth abbreviated as Para (Figure 1a), along with its hydrochloride monohydrate salt [40] (Figure 1b) and oxalic acid (OA) cocrystal [39] (Figure 1c), herein referred to as ParaHCl and ParaOA, respectively. Both facilitate tablet manufacture thanks to their higher plasticity [39,40]. We examine and refine three previously reported XRD-derived structures of Para [41], ParaHCl [40], and ParaOA [39]. They were refined by DFT calculations, whose improvements were assessed against the experimental 2Q–1Q 1H NMR constraints, as well as by the conventional approach of contrasting the NMR-derived 1H and 13C chemical shifts with those predicted by DFT calculations using the Gauge-Including Projector Augmented Wave (GIPAW) approach [17,18,19,20,21,22]. For the ParaHCl and ParaOA structures, the 1H/13C chemical shifts and their site assignments are, to the best of our knowledge, reported for the first time.

2. Results and Discussion

2.1. 13C and 1H NMR Spectra

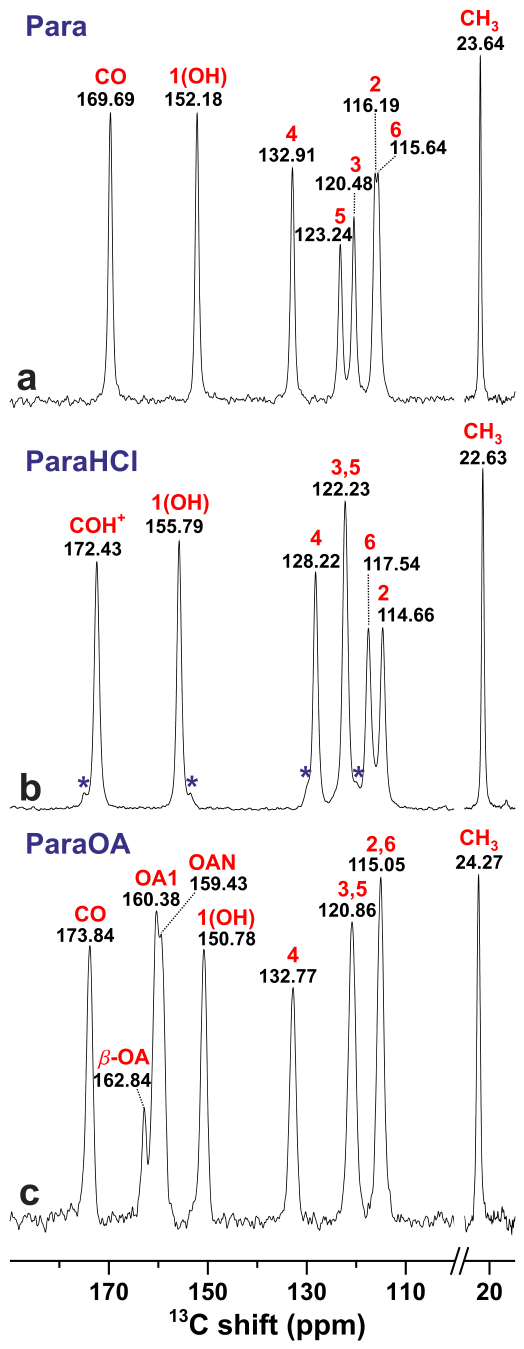
Figure 2 shows cross-polarization (CP) MAS (CPMAS) 13C NMR spectra recorded from the paracetamol-based samples, revealing overall well-resolved resonances across the entire spectral regions, encompassing the high-ppm 13CO range (>150 ppm) to the spectral region of aromatic 13C (100–135 ppm) and aliphatic 13C H 3 (30–35 ppm) sites. Not surprisingly, the very similar electronic environments of the aromatic 13C sites produce close 13C chemical shifts, where the degree of NMR signal overlap varies among the sites and specimens: While the two 13C3 and 13C5 resonances are well-resolved in the NMR spectrum from Para (Figure 2a), they overlap completely in the spectra recorded from the ParaHCl and ParaOA specimens (Figure 2b,c). Likewise, both 13C2/13C6 NMR peaks are superimposed in the NMR spectrum from ParaOA, whereas they are barely resolved in that from Para but well separated in the spectrum associated with the ParaHCl specimen.
Although Figure 2 supports the inference from powder XRD about nearly phase-pure specimens, minor impurities are evident from the 13C CPMAS NMR spectra of ParaHCl and ParaOA. Several small NMR peaks, such as those at 174.9 and 153.5 ppm, could be traced to the by powder XRD (PXRD) identified bis(Para)HCl phase; see Section 3.2. The 13C CPMAS NMR recorded from the ParaOA specimen reveals a minor signal at δ C = 162.9 ppm (Figure 2c), and its origin is discussed below.
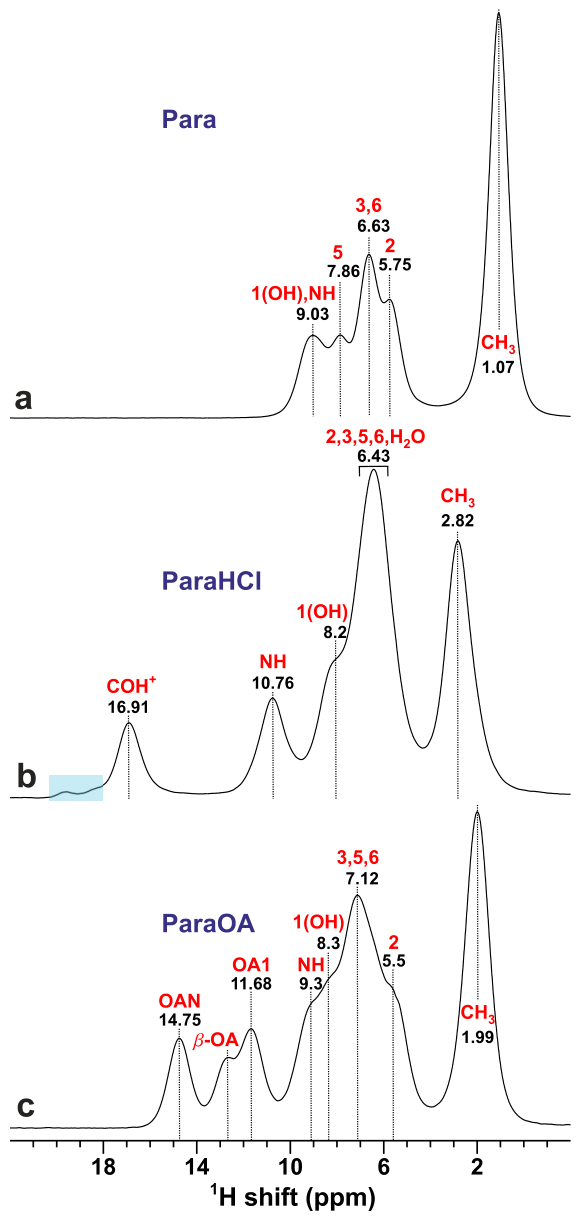
Figure 3 displays the 1H NMR spectra recorded at 14.1 T using a fast MAS rate of 60.0 kHz, which is sufficiently rapid for suppressing most of the otherwise substantial resonance broadening from homonuclear 1H–1H dipolar interactions [12,13,14,15]. All three spectra clearly resolve the C 1 H 3 NMR signals found at the lowest chemical shifts (1–3 ppm), as well as all resonances from the OA-stemming COO 1 H sites and the acidic protons of ParaHCl appearing in the high-ppm range of >12 ppm. However, the aromatic protons resonating in the 5–9 ppm shift range are poorly resolved. The highest 1H chemical shifts ( δ H ) are observed for the 1( O 1 H) and N 1 H sites ( δ H 9 ppm), which overlap significantly in the NMR spectra recorded from Para (Figure 3a) and ParaOA (Figure 3c) but are well-resolved in that from ParaHCl, which reveals a markedly higher N 1 H shift at δ H 10.8 ppm (Figure 3b). In contrast, the 1 H 2 O resonance of ParaHCl overlaps completely with those from the aromatic protons.
The presence of a minute impurity in the ParaHCl sample, as hinted from the 13C NMR spectrum (Figure 2b), is confirmed by the 1H MAS NMR counterpart of Figure 3b: Several small peaks (e.g., at 18.3 and 19.6 ppm) may be identified, which we attribute to MAS-induced ParaHCl·H 2 O→bis(Para)HCl dehydration during prolonged sample spinning. Moreover, the 1H MAS NMR spectrum of ParaOA reveals well-resolved COO 1 H NMR peaks at 11.7 ppm (1HOA1) and 14.8 ppm (1HOAN) from the two distinct carboxy sites of the OA moiety, notwithstanding that both partially overlap with another NMR signal at δ H 12.7 ppm (Figure 3c). The latter was unambiguously shown by 2Q–1Q 1H correlation NMR to stem from a separate phase (Section 2.2). It is attributed to the metastable β -OA polymorph [42], which apparently forms during fast MAS from the minor α -OA · 2 H 2 O content of the ParaOA specimen identified by PXRD (Section 3.2). We are not aware of experimental 13C or 1H chemical shifts reported for the β -OA phase, but our DFT calculations predicted δ H = 13.7 ppm and δ C = 163.2 ppm. Incidentally, the latter shift is not only essentially identical to that of 162.8 ppm of Figure 3c but also to the shift of α -OA · 2 H 2 O (163.1 ppm) [43], implying that the 13C NMR spectrum alone cannot discriminate between the β -OA and α -OA · 2 H 2 O phases. Nonetheless, the 1H MAS and 2Q–1Q NMR spectra strongly suggest the presence of a minor β -OA component ( δ H = 12.7 ppm) but the absence of α -OA · 2 H 2 O [44], which produces an NMR peak at a distinctly different shift of δ H = 16.6 ppm [43].

2.2. 2Q–1Q 1H Correlation NMR Spectra

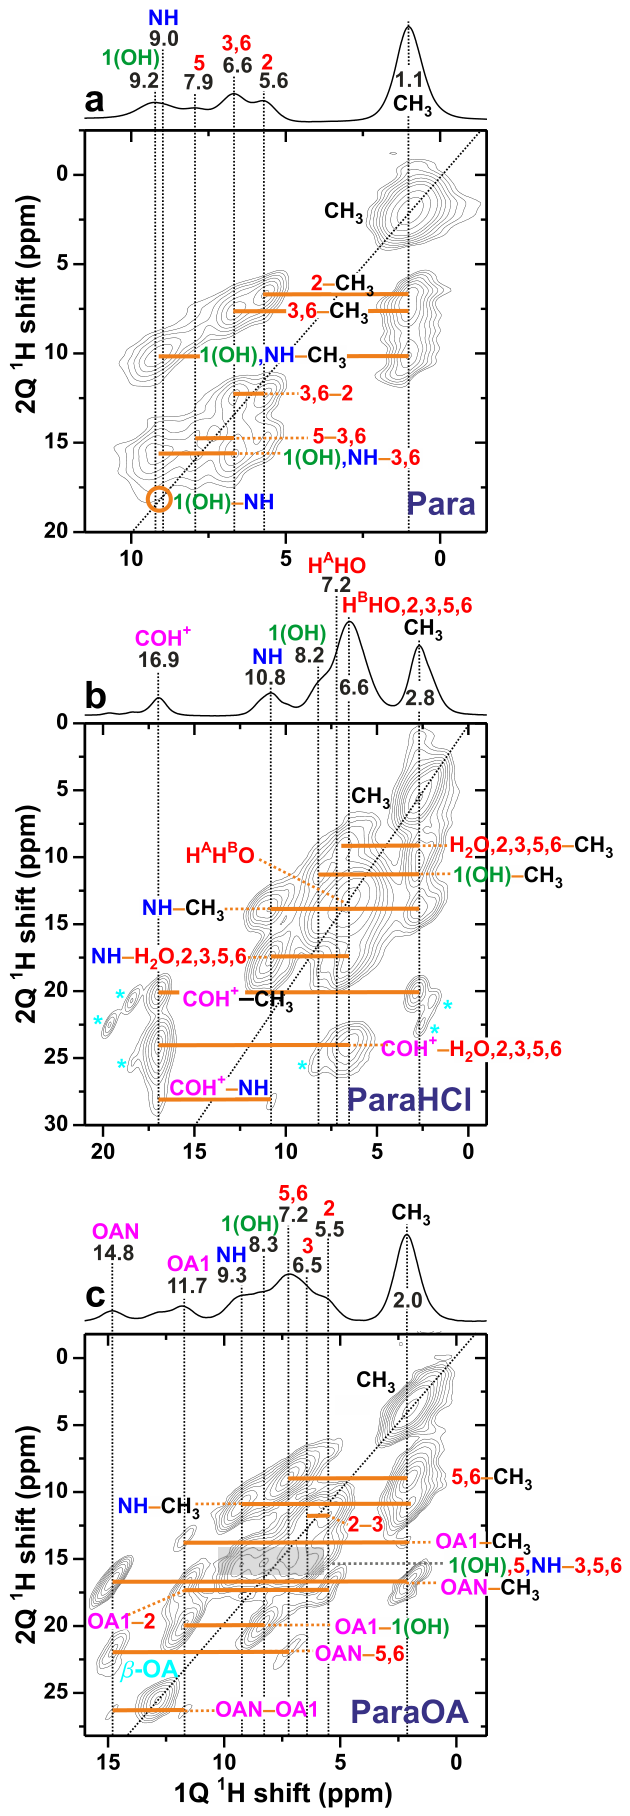
Figure 4 presents the 2Q–1Q 1H NMR spectra of the paracetamol-based specimens, recorded at fast MAS and a very short 2QC excitation interval of τ exc = 16.67 µs to enable a quantitative 1H–1H distance analysis [37,38] (Section 2.5). The spectra also offered valuable 1H NMR peak assignments, as discussed further in Section 2.3. A close proximity between two 1 H j and 1 H k sites that resonate at the corresponding chemical shifts δ H j and δ H k along the horizontal/direct “1Q dimension” ( δ 1 Q ) is evidenced by two 2D NMR peaks appearing at the spectral coordinates { δ 2 Q j k , δ H j } and { δ 2 Q j k , δ H k }, where the 2QC shift, δ 2 Q j k = δ H j + δ H k , appears along the vertical/indirect “2Q dimension” ( δ 2 Q ) of the 2D NMR spectrum [12,13,14].
While spatial proximities between two crystallographically distinct proton sites with different chemical shifts generate two 2D NMR peaks for each 2QC, however, two nearby equivalent protons—such as the C 1 H 3 protons of the paracetamol moiety—only produce one NMR peak at { δ 2 Q , δ 1 Q } = {2 δ H j , δ H j } [12,13,14] (Figure 4). Notwithstanding the limited spectral resolution from the aromatic protons, correlations between the C H 3 sites with each of the NH, H2, H3, H5, and H6 protons are evident in the 2Q–1Q NMR spectrum from Para (Figure 4a). In the 2D NMR spectra obtained from the ParaHCl specimen shown in Figure 4b, the intense C 1 H 3 autocorrelation signal partially overlaps with the 2Q correlation peak beneath that involves methyl and aromatic protons. Additional significant spectral overlaps also occur around the autocorrelation diagonal among signals from aromatic protons and the 1 H 2 O 2Q signal around { δ 2 Q , δ 1 Q } = { 13.0, 6.5} ppm.
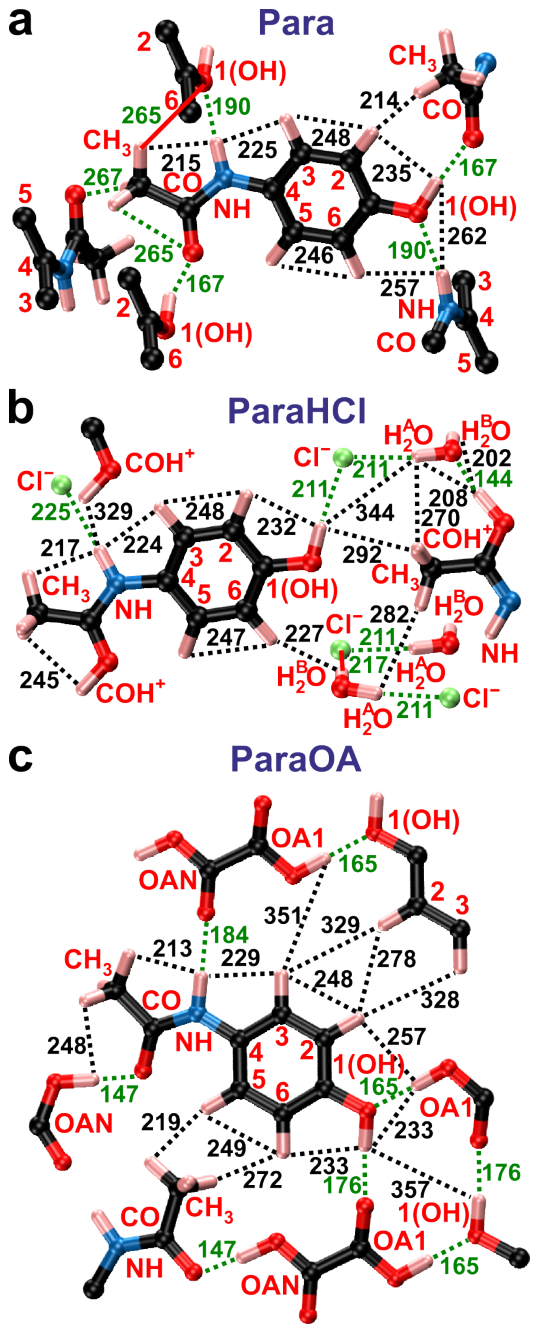
Note that the 2Q–1Q 1H–1H signal associated with the intermolecular NH⋯1(OH) H bond indicated in Figure 5a is barely discernible in Figure 4a due to its expected low intensity and its overlap with the strong N 1 H⋯H3/H6 correlation peak. The NH⋯1(OH) intermolecular contact of Para (Figure 5a) is superseded by one close intramolecular C H 3 CO H + proximity and one longer intermolecular NH⋯CO H + contact in the ParaHCl structure (Figure 5b), as indeed evidenced by the respective 2QC correlations at δ 2 Q = 19.9 ppm and δ 2 Q = 28.1 ppm in Figure 4b. Likewise, the ParaOA structure involves two types of H bonds between the paracetamol and diacid moieties (Figure 5c): While that of NHHOAN is comparatively long (386 pm) and is not detected in the 2Q–1Q NMR spectrum, the other involves the HOA1 and 1(OH) protons separated by 233 pm and manifested by the 2Q NMR peaks at δ 2 Q = 19.9 ppm (Figure 4c). This 1H–1H correlation stems from two intermolecular H-bonds, 1OH⋯A1OH (165 pm) and 1OH⋯A1O (176 pm). The structural organization of the paracetamol and OA moieties also implies a comparatively short distance between the methyl protons and the HOAN molecular fragment (Figure 5c), as manifested by the two 2Q correlation signals at δ 2 Q = 16.8 ppm. In contrast, the long C H 3 HOA1 distance (346 pm) is revealed by the very weak 2Q correlation signals at δ 2 Q = 13.7 ppm in Figure 4c.
The asterisks in Figure 4b mark the 2Q–1Q NMR peaks from the bis(para)HCl impurity (cf. Figure 3b). Notably, the absence of additional 2Q–1Q NMR correlations involving those protons and any ParaHCl-associated proton site unambiguously proves their presence in separate particles of the powder, as does the auto-correlation signal at δ 2 Q = 25.5 ppm in Figure 4c, which stems from the β -OA impurity.
We conclude that the 2Q–1Q 1H NMR spectra agree qualitative well with the XRD-derived structures of refs. [39,40,41], whose DFT-refined counpterparts are depicted schematically in Figure 5. The quantitative aspects are discussed in Section 2.6.

2.3. NMR-Peak Assignments

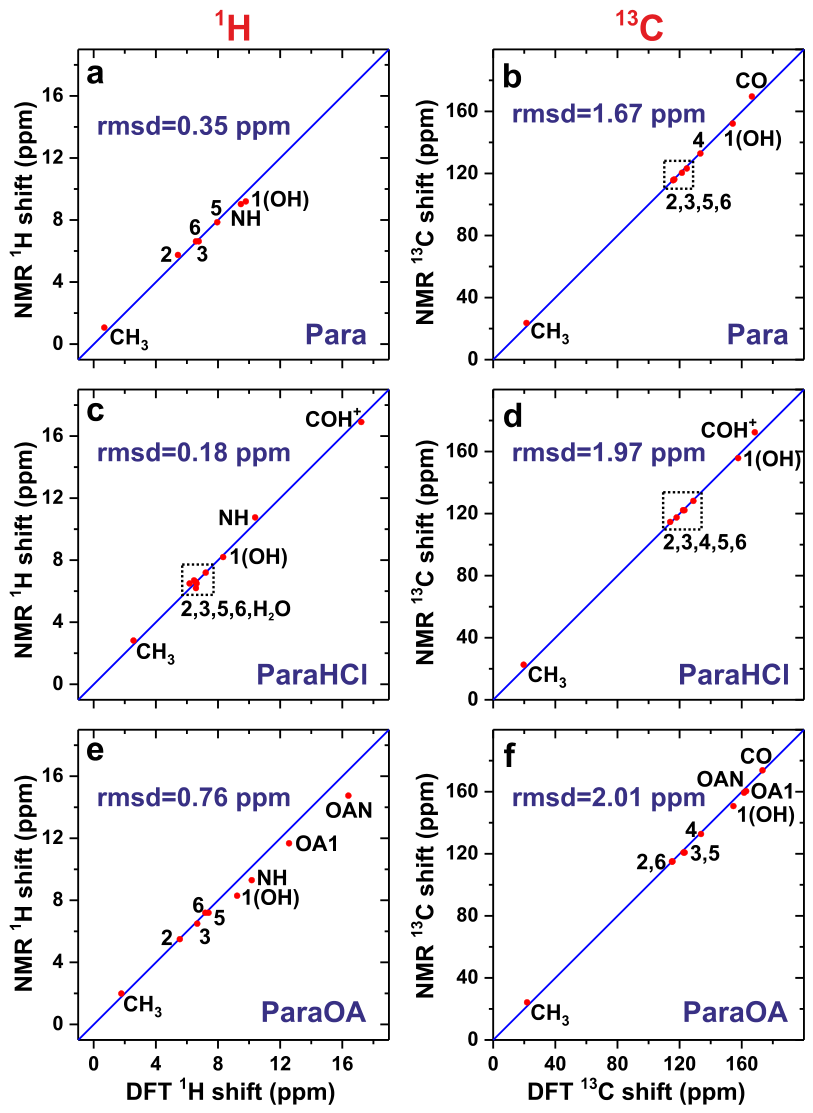
Table 1 contrasts the 1H and 13C chemical shifts obtained from NMR with those calculated by the GIPAW/DFT of the XRD-derived crystal structure before (“XRD”) and after (“DFT”) geometry optimization by DFT. Figure 6 plots the experimental NMR-derived { δ C } and { δ H } data against their respective GIPAW/DFT predictions of the DFT-refined structures. Every 13C chemical shift from all three specimens was assigned to its respective C site by using the chemical shift/site mapping that minimized the difference between the experimental and DFT-derived chemical shifts, whereas NMR peak assignments to the 1H sites were assisted both by DFT calculations and the 2D NMR experiments, as illustrated below. To the best of our knowledge, the 1H/13C chemical shifts and their site assignments are reported for the first time for the ParaHCl and ParaOA structures.
The results for the monoclinic Para structure obtained from the DFT-based assignment of Table 1 corroborate the resonance assignments reported earlier by Zhou and Rienstra [46]. Both the { δ C } and { δ H } datasets herein and in ref. [46] are in excellent agreement, typically within 0.3 and 0.1 ppm for each 13C as well as 1H site, respectively, which are well within the experimental uncertainties anticipated from NMR work from two distinct laboratories. Notably, however, our DFT calculations also offer unambiguous discrimination within each pair of {2, 6} and {3, 5} sites for 13C and 1H, which could not be uniquely discriminated in previous HETCOR NMR studies [46,47,48]. Likewise, the DFT-assisted assignments of the chemical shifts with their C2/C6 and H2/H6 sites (Figure 5) resolve the 180° ambiguity of the benzene-ring orientation also for the ParaHCl and ParaOA structures.
As is evident from the 1H MAS NMR spectrum obtained from Para (Figure 3a), our assignments are only ambiguous for two pairs of protons, viz., H3/H6 and 1OH/NH. The latter two resonances were discriminated by the 2Q–1Q correlation NMR spectrum in Figure 4a, from which we deduced that the lower 1H chemical shift of δ H = 9.0 ppm is associated with the amide proton, while that of δ H = 9.2 ppm stems from the O 1 H group, whose shift is slightly lower than δ H = 9.5 ppm, as deduced in ref. [46] from 1 H{ 13 C} HETCOR experiments. Only the shifts of the H3/H6 pair could not be unambiguously assigned due to the too close values of the NMR shifts (Table 1), while the 2Q–1Q NMR spectrum also did not permit sufficient resolution for discriminating H3 from H6.
Most 1H chemical shifts extracted from the MAS NMR spectrum of ParaHCl were readily assigned by the DFT calculations, except for those of the aromatic H2–H6 sites and the two crystallographically distinct 1 H 2 O protons, all of which contribute to the essentially Gaussian NMR peak around 6.4 ppm (Figure 3b). The two distinct 1 H 2 A O and 1 H 2 B O resonances at 6.6 and 7.2 ppm (Table 1), respectively, were identified uniquely from the 2Q–1Q 1H NMR spectrum (Figure 4b), whereas 13 C{ 1 H} HETCOR NMR greatly assisted in the assignments of aromatic protons H2–H6. The H2 and H6 sites were identified from their respective chemical-shift correlations with their neighboring 13C sites, as deduced from the HETCOR 2D NMR spectrum (Figure S2). Unfortunately, the degenerate 13C3 and 13C5 chemical shifts did not admit unique assignments of the 2D HETCOR NMR peaks at δ H = 6.7 ppm and δ H = 6.5 ppm to the H3 and H5 sites. Each of those was attributed to H3 and H5 solely on the basis of their very close matches with the respective DFT-derived values of 6.62 and 6.46 ppm (Table 1).
For the 1H NMR-peak assignments of the ParaOA cocrystal (Figure 3c), all of the aromatic proton-stemming resonances and their assignments to sites H1–H6 were offered by the 2Q–1Q 1H NMR spectrum shown in Figure 4c. A close inspection of the 1H NMR peakshape in the 8–9 ppm range of Figure 3c confirms the presence of an NMR peak at ≈8.3 ppm, as also evidenced by the 2Q–1Q NMR spectrum of Figure 4c. The attribution of the NMR signal at δ H = 8.3 ppm to N 1 H was made from the DFT-derived δ H value, noting that, although the DFT calculations overestimated 1( O 1 H) and N 1 H chemical shifts by ≈0.9 ppm, they retain the order of δ H ( OH ) < δ H ( NH) (Table 1).

2.4. DFT-Predicted Chemical Shifts Versus NMR

Table 1 also lists the difference between the calculated and experimental chemical shifts for each 1H or 13C site j:
Δ H j [ α ] = δ H j [ α ] δ H j [ NMR ] , with α = { XRD , DFT } ,
Δ C j [ α ] = δ C j [ α ] δ C j [ NMR ] , with α = { XRD , DFT } .
As anticipated, initial DFT refinements of the H atom positions improve the subsequent GIPAW/DFT chemical-shift predictions, as reflected in overall lower root mean square deviations (rmsd) observed across each { Δ H j [ DFT]} and { Δ C j [ DFT]} set relative to their respective { Δ H j [ XRD]} and { Δ C j [ XRD]} counterparts (Table 1), except for the 1H shifts of ParaOA (vide infra). Figure 6 presents correlation plots of the experimental chemical shifts against the predictions from GIPAW/DFT.
Notwithstanding the well-known problems to obtain precise proton positions by XRD, they appear to be accurate in the XRD-derived structure of the monoclinic Para structure of ref. [41], as suggested by the minor improvements of the calculated 13C and 1H chemical shifts after DFT refinements of the H coordinates: The rmsd is reduced from 2.6 ppm (XRD) to 1.7 ppm (DFT) across the ensemble of 13C chemical shifts, whereas the rmsd for the predicted 1H chemical shifts of Para revealed only a marginal reduction from 0.38 ppm (XRD) to 0.35 ppm (DFT). We also performed DFT optimizations and GIPAW/DFT calculations of a previously reported structure deduced from neutron diffraction [49]. However, both the 13C and 1H chemical shifts of the methyl group deviated significantly more to the NMR shifts than those of the XRD structure of ref. [41].
Significant improvements in the δ H and δ C predictions resulted upon the DFT optimization of the XRD-derived ParaHCl structure [40]. It appears to have several questionable H-atom coordinates, as mirrored in the significant reduction in the rmsd with respect to the experimental δ H data from 6.0 ppm to only 0.18 ppm after DFT optimization, which is also markedly lower than any of the DFT-refined Para and ParaOA structures (Figure 6). The main improvements are observed for the aromatic 1H5 chemical shift along with those of the H 2 O molecule. Drastic improvements also resulted for the δ C predictions of ParaHCl: A substantial rmsd value of 9.7 ppm of the XRD structure was reduced to 2.0 ppm after DFT optimization. However, the unusually large rmsd for the 13C chemical shifts originates primarily from the staggering error of Δ C [ XRD ] = 25 ppm observed for the 13C H 3 group (Table 1). Nonetheless, even when omitting that result from the rmsd evaluation, a sizable rmsd of 4.5 ppm remains for the { Δ C j [ DFT]} set.
The DFT refinements of the ParaOA structure only improved the agreement between the calculated and experimental 13C shifts slightly, while the 1H counterparts revealed an even larger discrepancy of rmsd = 0.76 ppm compared to the shifts predicted from the initial XRD structure of rmsd = 0.58 ppm (Table 1). These apparent discrepancies are resolved by the 1H–1H distance analysis that confirmed a slightly worse agreement of the DFT structure relative to the NMR experiments (Section 2.6.4). Besides potential bearings from inaccuracies in the reported unit-cell parameters (see Section 3.5), we have no obvious explanation for the larger deviations observed after DFT refinement, which concern primarily the H sites involved in H bonding, i.e., the 1OH, NH and the two COOH sites of OA. Yet, these discrepancies remained significant and of comparable magnitude among several DFT optimizations with different functionals and input parameters.
However, the unexpected finding for ParaOA has an important message, namely the utility of contrasting chemical-shift predictions before and after geometry optimization, which (surprisingly) is normally not evaluated in published studies. Such evaluations offer a diagnostic tool by verifying the (degree of) improvements following the geometry optimization by DFT, where only minor improvements in accordance with the experimental chemical shifts confirm the good quality even of the input structure (as for Para herein), while an unexpected increased discrepancy might suggest problems related to the DFT calculations.

2.5. 1H–1H Distance Analysis Procedure

This section recapitulates the interatomic-distance-based NMR crystallography method of refs. [37,38], which is utilized and commented further herein. The dipolar coupling constant of two given structural sites m and n of one 1Hj1Hk pair with an internuclear distance r m n j k is given by [12,13,14]
b ( H m j H n k ) = K HH r m n j k 3 , with K HH = μ 0 γ H 2 / 8 π 2 [ units of Hz ] ,
where j and k refer to protons selected from two formally equal or distinct functional groups. Here, μ 0 is the permeability of the vacuum, and γ H is the magnetogyric ratio of 1H [12,13,14]. The expression for the squared effective dipolar coupling constant, b eff 2 ( H j H k ), depends on whether the two proton sites are chemically equivalent (which may stem from a crystallographic equivalence or rapid molecular dynamics) or nonequivalent ( j k ):
b eff 2 ( H j H k ) = m = 1 M j n = 1 M k b 2 ( H m j H n k ) , for j k m < n M j b 2 ( H m j H n j ) , for j = k . .
Owing to its ( r m n j k ) 6 dependence, the b eff 2 ( H j H k ) value is predominantly dictated by the shortest H m j H n k distances. The choices of M j and M k are somewhat arbitrary, where our evaluations employed all distances up to 1.0 nm to reach well-converged b eff 2 ( H j H k ) values.
Note that the 2Q–1Q NMR experiments involve active dipolar recoupling/restoration by an rf-pulse sequence that generates an effective 2Q Hamiltonian with a scaled dipolar coupling constant [12,13,14,45,50], κ b ( H m j H n k ) , for which its precise value κ < 1 is equal for all dipolar interactions but this becomes immaterial because the scaling factor is canceled in the structural analysis (e.g., see Equations (4) and (6) below). Provided that the 2Q–1Q correlation 1H NMR spectrum is acquired with a sufficiently short 2QC excitation period, then b eff 2 ( H j H k ) is directly proportional to the integrated 2D NMR spectral intensity generated by all H m j H n k pairs in the structure. “Sufficiently short” means, in practice, that every integrated 2D NMR spectral intensity from a H m j H n k pair should remain ≲1/3 of the maximum intensity observed from a 2D spectrum recorded with a longer τ exc value. We define the fractional intensity, f NMR ( H j H k ), as the ratio between the integrated 2D NMR-peak intensity, I ( H j H k ) , and the total integrated 2D NMR spectral intensity ( I tot ) [37,38]:
f NMR ( H j H k ) = I ( H j H k ) / I tot ,
The { f NMR ( H j H k )} set is normalized to unity:
j , k f NMR ( H j H k ) = 1 .
Each I ( H j H k ) value was determined from the average 2D NMR peak volume across several independent integrations, each obtained over a rectangular frequency domain.
The value of f NMR ( H j H k ) extracted from the 2Q–1Q 1H NMR experiment may be contrasted with that calculated for any structural model derived by experiments or modeling [37,38]:
f α ( H j H k ) = b eff 2 ( H j H k ) / b eff 2 ( tot ) , with α = { DFT , XRD } ,
where b eff 2 ( tot) is the squared total dipolar interaction between all 1H–1H pair interactions in the structure:
b eff 2 ( tot ) = j , k b eff 2 ( H j H k ) .
Herein, we consider both the XRD-derived crystal structures for the paracetamol-based structures and their DFT-optimized counterparts, where a comparison of the results from Equations (4) and (6) offers a direct quantitative assessment of the validity of the evaluated structure model (Section 2.5.2).

2.5.1. Effective 1H–1H Distances

An “effective” interatomic distance, r eff α ( H j H k ), may be calculated for each H j H k pair in a structure according to [37,38]:
r eff α ( H j H k ) = M j k K HH 2 b eff 2 ( H j H k ) 1 / 6 , with α = { XRD , DFT } ,
where K HH is given by Equation (2), and M j k is the multiplicity of the set of largest dipolar coupling constants b 2 ( H m j H n k ) out of all terms in the sum of Equation (3) [37,38]. For instance, M j k = 3 for the methyl group of paracetamol. Each value of r eff XRD ( H j H k ) or r eff DFT ( H j H k ) extracted via Equation (8) is typically very similar to the shortest interatomic distance within the {H m j H n k } set encountered in the respective XRD- and DFT-derived structure. The exact r eff ( H j H k ) value may be slightly longer or shorter [37,38], however, because it depends on the precise number of proton pairs included in the sum of Equation (3) to reach convergence.
Likewise, an effective H j H k distance may be obtained from the { f NMR ( H j H k ) } data extracted from the 2Q–1Q 1H NMR experiment provided that it is evaluated against a given “reference” structure, for which its b eff 2 ( tot) result is effectively equated with I tot of Equation (4) such that each fractional intensity may be converted into a b eff 2 ( H j H k ) value according to [37,38]
b eff 2 ( H j H k ) = f NMR ( H j H k ) b eff 2 ( tot ) .
Inserting the NMR-derived b eff 2 ( H j H k ) value into Equation (8) then yields the associated effective distance r eff NMR ( H j H k ) , which we stress should not be overinterpreted because the precise value is biased to the particular reference structure (herein, XRD or DFT) from which b eff 2 ( tot) was calculated and used in Equation (9).

2.5.2. Structure Validation

For a straightforward validation and assessment of the quality of the XRD- and DFT-derived structures, Table 2 lists the respective correlation coefficient ( R 2 ) of each set of fractional intensities { f XRD ( H j H k ) } and f DFT ( H j H k ) calculated from Equation (6) with respect to the set of experimental fractional NMR intensities obtained from Equation (4):
R 2 ( α ) = 1 N j k 1 j , k f α ( H j H k ) f NMR ( H j H k ) 2 , with α = { XRD , DFT } ,
Here, N j k = N j k Var { f NMR ( H j H k ) } , where N j k is the number of distinct jk pairs entering the sum for the given Para, ParaHCl, or ParaOA structure, and Var { f NMR ( H j H k ) } is the variance of the { f NMR ( H j H k ) } set. Whenever the 2D NMR spectral resolution did not admit sufficient signal-separation among distinct H j H k pairs, they were grouped together (Table 2), which was also accounted for in the accompanying XRD and DFT analyses via Equations (6) and (7). Note that despite limiting the statistics by offering fewer experimental distance constraints, validation of the model structure against the experiment is nevertheless perfectly feasible. Indeed, provided that a decent number of distance constraints (5–10) is available, the accuracy of { f NMR ( H j H k ) } data from larger groups of H sites is normally higher than expanding the distance set using additional but more uncertain integrated intensities from strongly overlapping NMR signals.
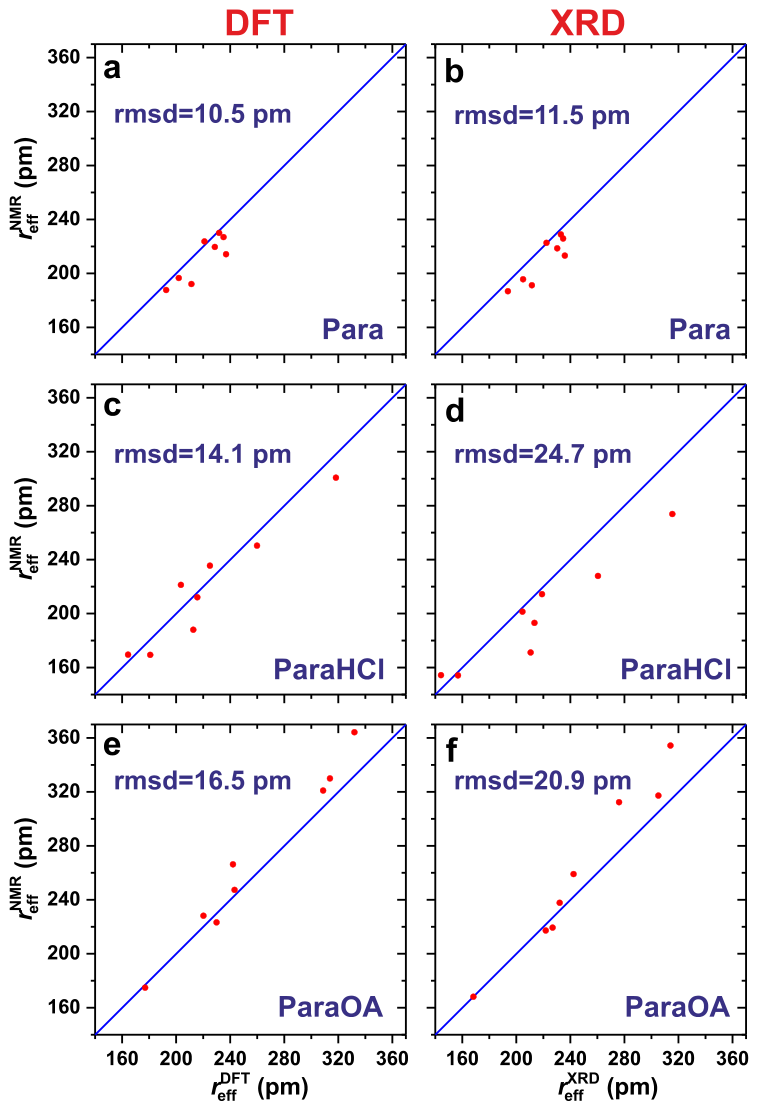
The effective-distance sets { r eff XRD ( H j H k )} and { r eff DFT ( H j H k )} generated for each XRD-/DFT-derived structure of Para, ParaHCl, and ParaOA are listed in Table 2, together with the NMR-derived counterpart, { r eff NMR ( H j H k )}. The associated correlation plots are shown in Figure 7. For every H j H k pair in each structure, Table 2 also presents the deviation between the effective distance of each XRD and DFT structure, r eff XRD and r eff DFT , relative to the value of r eff NMR ,
Δ r eff α ( H j H k ) = r eff α ( H j H k ) r eff NMR ( H j H k ) , with α = { XRD , DFT } ,
as well as the rmsd over the entire set { Δ r eff α ( H j H k ) } for each XRD/DFT method and Para, ParaHCl, or ParaOA structure. Note that although the R 2 ( α ) and rmsd{ Δ r eff α } results normally provide identical conclusions, in the rare scenarios of discrepancies (Section 2.6.4), we recommend using the more accurate R 2 ( α ) value calculated from Equation (10).
Notably, the distance analysis may produce significant discrepancies between the two r eff NMR ( H j H k ) values extracted by reference to each XRD or DFT structure. This occurs when there is a large deviation between the f NMR ( H j H k ) value and that from either XRD [ f XRD ( H j H k ) ] or DFT [ f DFT ( H j H k ) ] (or both), which is typically reflected in comparatively low R 2 ( XRD) and/or R 2 ( DFT) values of ≲ 0.90 . If f NMR ( H j H k ) is larger (smaller) than that of f α ( H j H k ) calculated from the XRD/DFT structure, then the r eff NMR ( H j H k ) value will be shorter (longer) than the effective distance of the model/reference structure, signifying that the latter distance is overestimated (underestimated). Significant discrepancies were only observed for the ParaHCl structure model. Below, we only discuss the precise effective-distances values of the XRD and DFT structures, while the r eff NMR data listed in Table 2 only serves the purpose of giving Δ r eff α ( H j H k ) assessments via Equation (11), while indicating if the 1H–1H distance consistent with the NMR experiment is longer or shorter than that of the XRD/DFT structure.

2.6. 1H–1H Distance Results

2.6.1. Results on Para

While a close inspection of the 2Q–1Q 1H NMR spectrum of Para (Figure 4a) enabled discrimination of the close chemical shifts of 9.0 ppm and 9.2 ppm of the NH and 1(OH) sites, respectively, the significant overlap of all correlation signals from those sites prevented the 1H–1H distance analysis of each individual site. Hence, those two proton sites were grouped together in Table 2, as were the H3 and H6 protons with equal chemical shifts at δ H = 6.6 ppm (Table 1).
Along the findings of marginally improved GIPAW/DFT chemical-shift predictions upon structure refinement by DFT, essentially equal discrepancies are observed for each { r eff XRD } and { r eff DFT } dataset relative to the NMR counterpart, both yielding rmsd values of ≈11 pm [Equation (11)] and very high and equal correlation coefficients of R 2 = 0.98 from Equation (10); see Table 2 and Figure 7. Altogether, this confirms the unusually high accuracy of the H positions of the XRD structure of ref. [41]. The two largest discrepancies in any individual effective distance are observed for the C H 3 H3/H6 pair with Δ r eff XRD = 20 pm, along with the H2⋯H3/H6 pair with Δ r eff XRD = 23 pm, none of which was reduced by the DFT optimization (Table 2).
We now focus on the effective distances of various proton pairs, r eff ( H j H k ) . The shortest interatomic distances encountered in each DFT-refined structure of Para, ParaHCl, or ParaOA are given in Figure 5. Carefully distinguish the individual interatomic distance of a selected proton pair, r ( H m j H n k ), from its “effective” counterpart, r eff ( H j H k ) [Equation (8)], which is the aggregate value of the entire { r ( H m j H n k )} distance set encountered in the underlying structure model. As expected, the methyl protons of Para manifest the shortest effective distance of all pairs (≈177 pm), which is derived from the three {176, 178, 179} pm distances of the DFT-refined structure. The second shortest effective distance occurs for the group of C H 3 NH/1OH pairs with r eff DFT = 193 pm. By inspecting the DFT structure of Para, one may conclude that most 2Q NMR peak intensities at δ 2 Q = 10 ppm (Figure 4a) stem from the intramolecular C H 3 NH contact of 215 pm (Figure 5a), while the intermolecular C H 3 1OH distance is much longer (266 pm) and thereby contributing markedly less to the 2D NMR spectral intensity. We note that the 2D NMR peak intensities scale as ( r m n j k ) 6 ; see Section 2.5. All remaining proton-pair effective distances listed in Table 2 are longer than 200 pm, most of which involve either the methyl protons or the three-bond contacts of the aromatic protons, such as H2⋯H3 and H5⋯H6. What is notable is also the unexpectedly short intermolecular H5⋯H5 effective distance of ≈221 pm, which stems from the preferred relative orientations of two neighboring paracetamol molecules in the crystal structure.

2.6.2. Bearings from Methyl-Group Dynamics

The dipolar interaction is sensitive to molecular dynamics: It averages to zero for (infinitely) fast MAS or rapid unrestricted molecular dynamics, while anisotropic motions reduce the (effective) dipolar coupling constant to a finite value [12,13,14,31]. It is well-known that the rapid rotational motion of X CH 3 moieties around the X–C axis—or three-site jumps between the protons—scales each 1H–1H interaction to an effective value of 1 / 2 relative to that of the dipolar coupling constant for an immobile CH 3 group [12,31]. Hence, accurate interatomic-distance analyses of the integrated 2Q–1Q NMR intensities must account for molecular motion. Unfortunately, that is only straightforward in the two limiting cases when the dynamics is either rapid or absent altogether. The crystal structure governs the presence/absence of rotation of the CH 3 group, where, for instance, Zhou and Rienstra [46] observed variable degrees of motional averaging among the methyl moieties of ibuprofen.
The methyl-group rotation (or three-site jump) in the Para structure appears to be neither absent nor free but is presumably strongly restricted, as suggested by the slightly lower fractional intensity obtained from NMR ( f NMR ) of the 1H–1H interactions relative to the f XRD and f DFT counterparts calculated from the atomic coordinates in the absence of any dynamics (Table 2). The discrepancy is nonetheless much lower than that for a rapid free rotation or three-site jump, which would scale the static b eff 2 ( H j H k ) value by the factor (1/2)2 = 1/4 As depicted in Figure 5a, all three methyl protons in Para are H-bonded to nearby O atoms, which likely hinders their mobility. Notably, a significant CH 3 mobility may be ruled out from the markedly reduced R 2 ( DFT ) = 0.74 value resulting if instead assuming a fast three-site jump of the H sites when evaluating Equations (6) and (10).
In contrast, there are no H bonds involving CH 3 in the ParaHCl structure (Figure 5b), while only two of the CH 3 protons of ParaOA are involved in H bonding (Figure 5c). Indeed, the markedly lower f NMR ,   f XRD , and f DFT values relative to those for Para (Table 2) suggest highly mobile methyl protons in both ParaHCl and ParaOA structures, for which our distance analyses assumed a rapid three-site jump model of the methyl group. Note that the effective dipolar interaction between the three C H 3 sites and an external H site is equal in the two scenarios of three static methyl protons and a rapid three-site jump model.

2.6.3. Results of ParaHCl

The overall stronger NMR-signal overlap of the 2Q–1Q NMR signals from the aromatic protons of both ParaHCl and ParaOA structures required more extensive groupings of the integrated signal intensities shown in Figure 4b,c and the distance sets included in the sum of Equation (6). As expected from the significant improvements of the δ H data from GIPAW/DFT calculations upon DFT optimization of the ParaHCl structure, the latter model agrees better with the 1H–1H distance constraints from NMR, with the correlation coefficient increasing from R 2 (XRD ) = 0.82 to R 2 (DFT ) = 0.90 , while the rmsd across the distance sets reduced from 25 pm to 14 pm (Table 2 and Figure 7).
Notwithstanding a clear improvement upon DFT optimization, however, the structure still deviates markedly to the NMR experiment. Owing to the insufficient NMR-signal discrimination of the central region of the 2Q–1Q 1H NMR spectrum recorded from ParaHCl (Figure 4b), all 1H1–1H6 and the 1 H 2 O correlation signals were grouped together. Table 2 reveals that this net fractional intensity accounts for ≈42% of the entire 2D NMR signal and even more for the DFT (≈51%) and XRD (≈63%) structures. The remaining deviations also account for the significant variations in the r eff NMR ( H j H k ) value for most H j H k pairs as evaluated against the respective XRD and DFT structures. The H A H B distance is the overall shortest (as expected), followed by numerous distances involving water/aromatic and aromatic/aromatic proton pairs that range between 227 and 248 pm (Figure 5b). Here, the main improvements by DFT stem from an expansion of each O–HA/O–HB bond length from 82/85 pm of the XRD structure to 99 pm for both bonds after DFT optimization, altogether expanding the 1 H A 1 H B distance from 131 pm in the XRD structure to 157 pm in the DFT counterpart. These atom adjustments largely account for the markedly improved 1 H A O 1 H B chemical-shift predictions by GIPAW/DFT (Table 1).
Likewise, slight adjustments of the CO H + , NH, and C H 3 positions by the DFT calculations that accounted for the significantly improved δ H values (Table 1) also underpin the better agreement of the effective CO H + NH and NH⋯C H 3 distances to the NMR experiments. Here, the shortest CO H + NH distance contracted from 344 pm in the XRD structure [40] to 329 pm upon DFT optimization (Figure 5b), while the NH⋯C H 3 distance contracted slightly by 3 pm. Nonetheless, although this minor structural alteration significantly improved the agreement with NMR, the slightly lower DFT-derived values of f DFT (NH⋯C H 3 ) = 0.050 than that of f NMR (NH⋯C H 3 ) = 0.055 (Table 2) imply that the “real” NH⋯C H 3 distance remains a few pm shorter than that of 217 pm in the DFT structure of Figure 5b and the corresponding r eff DFT = 216 pm value shown in Table 2; see Section 2.5.2.
The ParaHCl structure is stabilized by H bonds involving paracetamol, water, and the chloride anion [40], encompassing the following bonds that appear in a sheet, shown in the structure fragment of Figure 5b: CO H + H 2 O (144 pm); 1(OH)⋯ Cl (211 pm); NH Cl (225 pm). The Cl anions also form H bonds with each water proton, with the H A Cl (211 pm) and H B Cl (217 pm) bonds appearing within the sheet and interconnecting neighboring sheets, respectively. The DFT optimization relaxed the proton positions such that the H bond shortened and the proton became more centered between the two electronegative atoms. For example, the ≈15 pm O–HA/HB bond’s lengthening (vide supra) was accompanied by a nearly equalshortening of the H A Cl (228 pm) and H B Cl (231 pm) distances encountered in the XRD structure [40].

2.6.4. Results on ParaOA

Both XRD-derived ParaOA structures before and after DFT optimization overall agree well with the NMR experiments. Yet, as hinted from the slight degradation in the GIPAW/DFT-computed 1H chemical shifts from the DFT-optimized structure relative to its XRD counterpart (notwithstanding an improved match for the 13C shifts; Section 2.4), Table 2 reveals a slightly lower R 2 (DFT ) = 0.96 correlation coefficient than that of R 2 (XRD ) = 0.98 for the XRD structure. Hence, the 1H–1H distance analysis resolves the contradicting conclusions from the 1H and 13C chemical shift data, confirming an overall very similar quality of the DFT and XRD structures, yet with a slight preference of the latter. Although the rmsd of the effective-distance set associated with the DFT structure is slightly lower (16 pm) than that of the XRD structure (20 pm), it is evident from Table 2 and Figure 7 that this resulted from a significant improvement only for two long distances—C H 3 HOA1, and the intramolecular HOA1⋯HOAN distance—both of which are markedly longer in the DFT-optimized structure—whereas all other 1H–1H distances reveal a nearly equal, or even worse, match with the NMR experiments as compared to the XRD structure, thereby accounting for the overall higher R 2 correlation coefficient for the XRD structure.
Note that the two intense C H 3 H5/H6 and C H 3 NH correlations partially overlap in the 2Q–1Q NMR spectrum of Figure 4c. They were grouped together and also omitted from the distance analysis because the observed NMR fractional intensity ( f NMR = 0.39 ) is substantially lower than those of both XRD/DFT structures (0.58/0.56). We have no convincing explanation for this observation. In order to avoid a large error propagation into all other distances, we proceeded by omitting that fractional intensity from normalization Equation (5). If included, a significant reduction is observed for both correlation coefficients, R 2 (DFT ) = 0.87 and R 2 (XRD ) = 0.90 , but the conclusions remain, underscoring the robustness of the distance analysis for structural validations.
We now consider the paracetamol/OA intermolecular interactions evident in Figure 5c and confirmed by the 2Q–1Q NMR spectrum of Figure 4c. The relatively short 1(OH)⋯HOA1 effective distance stemming from the H-bonding of the 1(OH) and HOA1 moieties is overestimated and underestimated in the respective XRD and DFT structures to equal extents (8 pm). A close H2⋯HOA1 contact is also observed, which is underestimated slightly by both XRD and DFT structures relative to NMR, as is the effective C H 3 HOAN distance, where Table 2 reveals that the DFT optimization produced a larger discrepancy ( 24 pm) relative to the initial XRD structure ( 17 pm).

3. Materials and Methods

3.1. Sample Preparation

Acetaminophen/paracetamol (Form I, monoclinic; 99% purity) and α -oxalic acid (98% purity) were purchased from Sigma-Aldrich (Stockholm, Sweden), along with concentrated hydrochloric acid (37%) and ethyl acetate (99.9%) obtained from Merck KGa (Darmstadt, Germany). Paracetamol hydrochloride monohydrate (ParaHCl) was prepared according to refs. [40,51]. Paracetamol (0.100 mol, 15.12 g) was immersed in 70 mL concentrated HCl and stirred at room temperature (RT) for 12 h. The resulting salt was isolated by vacuum filtration and dried in a desiccator. The paracetamol–oxalic-acid cocrystal (ParaOA) was obtained as in ref. [52] via slurry formation by adding 3.5 mL of ethyl acetate to stoichiometric amounts (50.0 mmol each) of paracetamol (7.56 g) and α -OA (4.50 g) at RT under continuous stirring for 48 h. The resulting cocrystal was isolated by vacuum filtration and dried in a desiccator.

3.2. X-Ray Powder Diffraction

Powder XRD (PXRD) patterns were collected from the Para, ParaHCl, and ParaOA specimens using a Bruker D8 Discover diffractometer (Bruker, Bremen, Germany) equipped with a LYNXEYE position-sensitive detector, using Cu K α 1 , 2 radiation ( λ 1 = 154.06 pm; λ 2 = 154.44 pm) and Bragg–Brentano geometry with sample spinning. Each powder was loaded on zero-background Si plates, and all diffractograms were collected at RT over a 2 θ range of 5°–50°, employing a step size of 0.018° with 1.00 s per step, giving a total measurement time of ≈43 min per sample, respectively. Rietveld refinements were performed with the TOPAS software [53]. Figure S1 shows the diffractograms along with the Rietveld refinements.
No impurities were detected in the commercial Para specimen, whereas the ParaOA co-crystal was found to comprise 3.4 wt% of α -oxalic acid dihydrate ( α -OA · 2 H 2 O), which readily forms from the hygroscopic α -OA precursor; also see ref. [43]. As discussed in Section 2.1, however, essentially all of the α -OA · 2 H 2 O appeared to have transformed into the metastable β -OA phase during fast-MAS NMR experimentation. The as-prepared ParaHCl salt was also phase-pure but is unstable under ambient conditions and readily transforms into bis(acetaminophen) hydrochloride, abbreviated here as bis(Para)HCl and also referred to as acetaminophen hemihydrochloride [40,54]. Although a shorter PXRD experiment (8 min) over the same 2 θ range but a 0.02° step size and 0.2 s per step indeed evidenced a phase-pure ParaHCl sample, the ParaHCl→bis(Para)HCl transformation was detected (3.6 wt%) from the longer PXRD experiment described above, as well as during MAS NMR experimentation.

3.3. Solid State NMR

All solid-state NMR experiments were performed at ambient temperature using a Bruker Avance-III spectrometer (Bruker, Rheinstetten, Germany) at a magnetic field of 14.1 T that produces Larmor frequencies of −600.12 MHz for 1H and −150.91 MHz for 13C. 1.3 and 4.0 mm zirconia rotors were filled with powders of the Para, ParaHCl, and ParaOA specimens. Except for the 1H 13 C CPMAS NMR experiments that were performed with a 4 mm MAS probehead, all experiments utilized a 1.3 mm probehead and rotors undergoing MAS at the rate ν r = 60.00 kHz. Resonance offsets were minimized by positioning each radio-frequency (rf) carrier 1H/13C frequency at the center of the resonance region throughout. 1H and 13C chemical shifts are quoted relative to neat tetramethylsilane (TMS).
Quantitative Bloch-decay 1H NMR spectra were recorded with 90° radio-frequency (rf) pulses at the nutation frequency of ν H = 104 kHz. Relaxation delays ( τ relax ) of {160, 15, 200} s and {16, 8, 4} accumulated NMR-signal transients were acquired for {Para, ParaHCl, ParaOA}, respectively. Background signals from the NMR probehead/rotor were eliminated by subtracting the result from a separately acquired NMR spectrum from the empty rotor but with otherwise identical experimental parameters.
13C NMR spectra were recorded at ν r = 12.00 kHz by 1H 13 C CPMAS under the modified Hartmann–Hahn condition ν C ν H = ν r , with a contact period of τ CP = 1.25 ms, ν H = 35 kHz, and a linearly ramped [55] rf amplitude for 13C, i.e., ν C = 46 ± 3 kHz. Throughout the experiment, the 90° 1H pulse prior to CP operated at ν H 100 kHz and SPINAL-64 [56] proton decoupling at ν H 78 kHz was applied during 13C NMR-signal detection. The {512, 512, 1024} signal transients were acquired for the respective {Para, ParaHCl, ParaOA} specimens, with 15 s relaxation delays for Para and ParaOA and 30 s for ParaHCl.

3.4. 2D NMR Experiments

2Q–1Q 1H NMR correlation spectra were recorded with the 2D NMR protocol shown in Figure 1a of ref. [45]. The 2Q coherence (2QC) excitation/reconversion was accomplished by the shortest possible BaBa dipolar recoupling rf-pulse scheme, which extends over one sole rotor period [45,50], thereby giving 2Q excitation ( τ exc ) and reconversion ( τ rec ) intervals of τ exc =   τ exc = τ r = 16.67 µs, where τ r = ν r 1 is the rotor period. The 1H nutation frequency was ν H = 156 kHz for the 90° dipolar recoupling pulses of duration 1.60 µs. All 2D NMR acquisitions employed a spectral window of 32 kHz in the direct spectral dimension and rotor-synchronized 2QC evolution with Δ t 1 = { 3 τ r ,   4 τ r , 2 τ r } for {Para, ParaHCl, ParaOA}, respectively, along with {40, 66, 40} t 1 data points recorded and relaxation delays of {75, 15, 75} s. Note that these much shorter τ relax values used for the 2Q–1Q 1H NMR experiments relative to the Bloch-decay counterparts were required for practical reasons; we verified the absence of any significant differential relaxation among the various proton sites. The 2D datasets were zero-filled to 128 × 4096 ( t 1 ,   t 2 ) points for the experiments on Para and ParaHCl, and they were zero-filled to 256 × 4096 for ParaOA and apodized with 100 Hz Gaussian and 50 Hz Lorentzian broadening along the indirect and direct dimensions, respectively. For achieving absorptive 2D NMR peaks with frequency-sign discrimination along the indirect dimension, all 2D NMR acquisitions implemented the States procedure [57]. The 2D NMR spectra are shown with a lowest contour level of ≈2%.
A 13 C{ 1 H} 2D HETCOR NMR experiment was performed on the ParaHCl sample, employing 1H 13 C CP for τ CP = 250 µs established at the Hartmann–Hahn condition [58], ν C ν H = ν r , using ν H = 20 kHz and a ramped CP around ν C = 80 ± 13 kHz and a 2.4 µs 90° 1H pulse. The HETCOR NMR spectrum was recorded with τ relax = 16 s, and spectral windows of 65 kHz and 25 kHz were used in the 13C ( t 2 ) and 1H ( t 1 ) dimensions. The 50 t 1 values were collected with 96 accumulated transients per t 1 value and SPINAL-64 proton decoupling at ν H = 145 kHz during t 2 . The 2D NMR datasets were zero-filled to 1024 × 4096 ( t 1 ,   t 2 ) points and apodized by 200 and 50 Hz Lorentzian broadening along the t 1 and t 2 dimensions, respectively.

3.5. GIPAW/DFT Calculations

Geometry optimizations by first-principles DFT calculations were carried out with the CASTEP software (version 22.11) [59] using the XRD-derived unit-cell parameters reported in the literature [39,40,41]. The Perdew–Burke–Ernzerhof (PBE) functional [60] was employed with on-the-fly generated ultrasoft pseudopotentials [61] and a plane-wave basis set [62]. The Grimme D3 scheme with Becke-Johnson damping [63] was used for the dispersion correction. The XRD-derived Para (Form I, monoclinic; CCDC 754966) [41] and ParaHCl (monoclinic, CCDC 835705) [40] structures were refined by only adjusting the H atom positions and using fixed coordinates of all heavier atoms. Whereas no improvements resulted by also adjusting the coordinates of the latter atoms of those structures, that of ParaOA (monoclinic; CCDC 720368) [39] improved due to the all-atom refinements. Indeed, as opposed to the Para and ParaHCl structures, the (only available) reported ParaOA structure was derived from PXRD data, whose lower accuracy than single-crystal XRD results might involve less accurate cell parameters.
The chemical shielding values for 1H and 13C were calculated for all XRD structures before and after optimization using the GIPAW method [17,18,19,20,21,22]. For both DFT geometry optimizations and the GIPAW magnetic shielding parameter calculations, a plane-wave energy cut-off of 1000 eV was used along with a Monkhorst–Pack k-point grid and a maximum spacing of 0.05 Å 1 in the reciprocal space.
We utilize the chemical shift scale throughout, where low (high) chemical shifts correspond to shielded (deshielded) nuclei, and the isotropic chemical shift is given by [64,65,66]
δ S j δ S iso , j = 1 3 ( δ x x S j + δ y y S j + δ z z S j ) for S = { 1 H , 13 C } .
The GIPAW/DFT-derived principal values of the chemical shift tensor of spin-species S, { δ x x S j , δ y y S j , δ z z S j }, were calculated from the respective magnetic shielding values, { σ x x S j , σ y y S j , σ z z S j }, according to [20,21,22]
δ α α S j = σ ref S σ α α S j , with α α = { x x , y y , z z } and S = { 1 H , 13 C } .
All three structures employed the shielding-to-shift conversion terms σ ref H = 30.44 ppm and σ ref C = 171.70 ppm. Both were obtained from the intercept that minimized the difference between the experimental and calculated { δ H j } or { δ C j } values for the Para structure, yielding correlation coefficients of R 2 = 0.983 and R 2 = 0.998 for 1H and 13C, respectively.

4. Conclusions

By coupling DFT calculations with 1D and 2D MAS NMR experiments, the 1H and 13C chemical shifts and NMR-peak assignments were extracted from monoclinic paracetamol (Para), along with its HCl monohydrate salt (ParaHCl) and cocrystal with oxalic acid (ParaOA). The chemical shifts and their site assignments are, to our knowledge, reported for the first time, while those from Para were in excellent agreement with an earlier study [46]. Each original XRD-derived Para [41], ParaHCl [40], and ParaOA [39] crystal structure was refined by plane-wave DFT calculations. The GIPAW/DFT 1H and 13C chemical-shift predictions before and after geometry optimization were contrasted with the experimental shifts from MAS NMR. These evaluations revealed excellent agreement for the original Para structure, with only very minor improvements after geometry optimization by DFT, while the chemical shifts predicted from the XRD-derived ParaHCl structure exhibited poor agreement with the NMR shifts, which improved substantially upon DFT optimization. For ParaOA, on the other hand, the chemical-shift evaluations were inconclusive for the DFT and XRD structures, with a slightly worse (better) agreement for the δ H ( δ C ) values of the DFT-optimized structure with experiments.
The chemical-shift structural assessment protocol utilized herein has been well established for more than two decades [19,20,21,22,23]. While being straightforward, it does not involve direct distance constraints in the evaluation compared to that of the analysis of the fractional integrated 2D NMR spectral intensities of the 2Q–1Q correlation spectrum [Equation (4)]. The latter may be directly evaluated against the respective fractional effective dipolar coupling constants calculated from the structure model to be evaluated via Equations (3) and (6), thereby yielding a single figure of merit (i.e., R 2 ) on the quality of agreement. This analysis procedure is markedly less effort-intensive than earlier options for analyzing dipolar interactions by 2D correlation NMR, which required recording several 2D NMR spectra with increasing dipolar recoupling intervals, integrating all peak intensities and then contrasting the 2D NMR-signal buildup with results from either computationally demanding multi-spin simulations [30,31,32,33] or phenomenological, and thereby approximate, expressions [27,28,29]. We note that although not utilized herein, the procedure of Section 2.5 is also readily applied to heteronuclear 2D correlation NMR spectra [37,38], such as for assessing 1H–13C distances.
Although the direct comparison of fractional intensities/effective dipolar coupling constants is sufficient for gauging the quality of the evaluated structure model, the effective dipolar interaction may also be converted into an 1 H j 1Hk “effective distance” [Equation (8)], which is an aggregate property with a value close to the shortest 1Hj1Hk distance in the structure. Here, the deviation between the effective distance calculated from the reference structure and its NMR-derived counterpart conveys the extent of the over/under-estimation of the 1Hj1Hk distance in the reference structure. The main analysis obstacle is insufficient 2D NMR spectral resolution, which can nevertheless be mitigated by grouping H sites together in the structural analysis, thereby still enabling analysis but at the cost of reduced statistics underlying the R 2 correlation coefficient.
For our present structural assessments of the three paracetamol-derived structures, the distance-based analysis gave essentially identical conclusions as the validation based on chemical shifts, except for the ParaOA structure, where the distance analysis confirmed very similar qualities of the DFT and XRD structures yet with a slight preference of the latter structure. We attribute this unexpected result to the structural derivation from powder XRD data, which, despite an all-atom refinement by DFT, did not improve results, likely owing to inaccurate cell parameters that were not optimized by DFT. Moreover, despite significant improvement by the DFT optimization of the XRD-derived ParaHCl structure and an excellent DFT/NMR agreement in the 1H chemical shifts (rmsd = 0.18 ppm), the rather low correlation coefficient ( R 2 = 0.90 ) of the distance analysis suggests remaining discrepancies with respect to the 2D NMR distance constraints, of which we have no explanation. Besides overall supporting the validity of contrasting calculated and experimental chemical shifts, the 2Q–1Q 1H NMR analysis provides more direct insight into the differences in 1H–1H distances between the model structure (here, from XRD) and the NMR constraints.

Supplementary Materials

The following supporting information can be downloaded at https://www.mdpi.com/article/10.3390/molecules31101584/s1. Figure S1: Powder X-ray diffractograms of cocrystals and results from Rietveld refinements. Figure S2: { 1 H} 13 C HETCOR spectrum of ParaHCl. Table S1: Unit-cell parameters from Rietveld refinements.

Author Contributions

Conceptualization, B.S., D.M. and M.E.; methodology, B.S. and M.E.; software, M.B. and B.S.; formal analysis, M.B., B.S., D.M., T.M.N. and C.H.; investigation, M.B., B.S., D.M., T.M.N. and C.H.; resources, M.E.; writing—original draft preparation, M.B., T.M.N. and M.E.; writing—review and editing, M.B., B.S. and M.E.; visualization, B.S.; supervision, B.S. and M.E.; project administration, M.E.; funding acquisition, M.E. All authors have read and agreed to the published version of the manuscript.

Funding

This work was supported by the Knut and Alice Wallenberg Foundation (project 2019.0124) and, in part, by the Swedish Research Council (project VR 2022-03652). The computations were enabled by resources provided by the National Academic Infrastructure for Supercomputing in Sweden (NAISS), partially funded by the Swedish Research Council through grant agreement no. 2022-06725.

Institutional Review Board Statement

Not applicable.

Informed Consent Statement

Not applicable.

Data Availability Statement

Raw data are accessible from the following link: https://su.drive.sunet.se/s/DLgf9DKknAYtTZi (accessed on 28 April 2026).

Conflicts of Interest

There are no conflicts of interest to declare.

References

  1. Harris, R.K.; Jackson, P.; Merwin, L.H.; Say, B.J.; Hägele, G. Perspectives in High-Resolution Solid-State Nuclear Magnetic Resonance, with Emphasis on Combined Rotation and Multiple-Pulse Spectroscopy. J. Chem. Soc. Faraday Trans. 1988, 84, 3649–3672. [Google Scholar] [CrossRef] [Scilit]
  2. Gobetto, R.; Nervi, C.; Chierotti, M.R.; Braga, D.; Maini, L.; Grepioni, F.; Harris, R.K.; Hodgkinson, P. Hydrogen Bonding and Dynamic Behaviour in Crystals and Polymorphs of Dicarboxylic–Diamine Adducts: A Comparison between NMR Parameters and X-ray Diffraction Studies. Chem. Eur. J. 2005, 11, 7461–7471. [Google Scholar] [CrossRef] [Scilit]
  3. Yates, J.R.; Pham, T.N.; Pickard, C.J.; Mauri, F.; Armado, A.M.; Gil, A.M.; Brown, S.P. An Investigation of Weak CH⋯O Hydrogen Bonds in Maltose Anomers by a Combination of Calculation and Solid-State NMR Spectroscopy. J. Am. Chem. Soc. 2005, 127, 10216–10220. [Google Scholar] [CrossRef] [Scilit]
  4. Vogt, F.G.; Clawson, J.S.; Strohmeier, M.; Edwards, A.J.; Pham, T.N.; Watson, S.A. Solid-State NMR Analysis of Organic Cocrystals and Complexes. Cryst. Growth Des. 2009, 9, 2620–2626. [Google Scholar] [CrossRef] [Scilit]
  5. Scheiner, S. Identification of Spectroscopic Patterns of CH⋯O H-Bonds in Proteins. J. Phys. Chem. B 2009, 113, 10421–10427. [Google Scholar] [CrossRef] [Scilit]
  6. Uldry, A.C.; Griffin, J.M.; Yates, J.R.; Pérez-Torralba, M.; Santa Maria, M.D.; Webber, A.L.; Beaumont, M.L.L.; Samoson, A.; Claramunt, R.M.; Pickard, C.J.; et al. Quantifying Weak Hydrogen Bonding in Uracil and 4-Cyano-4-ethynylphenyl: A Combined Computational and Experimental Investigation of NMR Chemical Shifts in the Solid State. J. Am. Chem. Soc. 2008, 130, 945–954. [Google Scholar] [CrossRef] [Scilit] [PubMed]
  7. Bouzková, K.; Babinský, M.; Novosadorá, L.; Marek, R. Intermolecular Interactions in Crystalline Theobromine as Reflected in Electron Deformation Density and 13C NMR Chemical Shift Tensors. J. Chem. Theory Comput. 2013, 9, 2629–2638. [Google Scholar] [CrossRef] [Scilit]
  8. Bauzá, A.; Mooibroek, T.J.; Frontera, A. Tetrel-Bonding Interaction: Rediscovered Supramolecular Force? Angew. Chem. Int. Ed. 2013, 52, 12317–12321. [Google Scholar] [CrossRef] [Scilit] [PubMed]
  9. Southern, S.A.; West, M.S.; Bradshaw, M.J.Z.; Bryce, D.L. Experimental 13C and 1H Solid-State NMR Response in Weakly Tetrel-Bonded Methyl Groups. J. Phys. Chem. C 2021, 125, 2111–2123. [Google Scholar] [CrossRef] [Scilit]
  10. Rodrigues, M.; Baptista, B.; Lopes, J.A.; Sarraguça, M.C. Pharmaceutical Cocrystallization Techniques. Advances and Challenges. Int. J. Pharm. 2018, 547, 404–420. [Google Scholar] [CrossRef] [Scilit]
  11. Bolla, G.; Sarma, B.; Nangia, A.K. Crystal Engineering of Pharmaceutical Cocrystals in the Discovery and Development of Improved Drugs. Chem. Rev. 2022, 122, 11514–11603. [Google Scholar] [CrossRef] [Scilit]
  12. Duer, M.J. Solid-State NMR Spectroscopy: Principles and Applications; Blackwell Science: Oxford, UK, 2002. [Google Scholar]
  13. Schnell, I. Dipolar Recoupling in Fast-MAS Solid-State NMR Spectroscopy. Prog. Nucl. Magn. Reson. Spectrosc. 2004, 45, 145–207. [Google Scholar] [CrossRef] [Scilit]
  14. Brown, S.P. Probing Proton–Proton Proximities in the Solid State. Prog. Nucl. Magn. Reson. Spectrosc. 2007, 50, 199–251. [Google Scholar] [CrossRef] [Scilit]
  15. Le Marchand, T.; Schubeis, T.; Bonaccorsi, M.; Paluch, P.; Lalli, D.; Pell, A.J.; Andreas, L.B.; Jaudzems, K.; Stanek, J.; Pintacuda, G. 1H-Detected Biomolecular NMR under Fast Magic-Angle Spinning. Chem. Rev. 2022, 122, 9943–10018. [Google Scholar] [CrossRef] [Scilit]
  16. Li, M.; Xu, W.; Su, Y. Solid-State NMR Spectroscopy in Pharmaceutical Sciences. Trac. Trends Anal. Chem. 2021, 135, 116152. [Google Scholar] [CrossRef] [Scilit]
  17. Mauri, F.; Pfrommer, B.G.; Louie, S.G. Ab Initio Theory of NMR Chemical Shifts in Solids and Liquids. Phys. Rev. Lett. 1996, 77, 5300–5303. [Google Scholar] [CrossRef] [Scilit]
  18. Pickard, C.J.; Mauri, F. All-Electron Magnetic Response with Pseudopotentials: NMR Chemical Shifts. Phys. Rev. B. 2001, 63, 245101. [Google Scholar] [CrossRef] [Scilit]
  19. Harris, R.K.; Hodgkinson, P.; Pickard, C.J.; Yates, J.R.; Zorin, V. Chemical Shift Computations on a Crystallographic Basis: Some Reflections and Comments. Magn. Reson. Chem. 2007, 45, S174–S186. [Google Scholar] [CrossRef] [Scilit] [PubMed]
  20. Charpentier, T. The PAW/GIPAW Approach for Computing NMR Parameters: A New Dimension Added to NMR of Solids. Solid State Nucl. Magn. Reson. 2011, 40, 1–20. [Google Scholar] [CrossRef] [Scilit] [PubMed]
  21. Bonhomme, C.; Gervais, C.; Babonneau, F.; Coelho, C.; Pourpoint, F.; Azaïs, T.; Ashbrook, S.E.; Griffin, J.M.; Yates, J.R.; Mauri, F.; et al. First-Principles Calculation of NMR Parameters Using the Gauge Including Projector Augmented Wave Method: A Chemist’s Point of View. Chem. Rev. 2012, 112, 5733–5779. [Google Scholar] [CrossRef] [Scilit]
  22. Hodgkinson, P. NMR Crystallography of Molecular Organics. Prog. Nucl. Magn. Reson. Spectrosc. 2020, 118–119, 10–53. [Google Scholar] [CrossRef] [Scilit]
  23. Emsley, L. Spiers Memorial Lecture: NMR Crystallography. Faraday Discuss. 2025, 255, 9–25. [Google Scholar] [CrossRef] [Scilit] [PubMed]
  24. Paruzzo, F.M.; Hofstetter, A.; Musil, F.; De, S.; Ceriotti, M.; Emsley, L. Chemical Shifts in Molecular Solids by Machine Learning. Nat. Commun. 2018, 9, 4501. [Google Scholar] [CrossRef] [Scilit]
  25. Lange, A.; Seidel, K.; Verdier, L.; Luca, S.; Baldus, M. Analysis of Proton–Proton Transfer Dynamics in Rotating Solids and Their Use for 3D Structure Determination. J. Am. Chem. Soc. 2003, 125, 12640–12648. [Google Scholar] [CrossRef] [Scilit]
  26. Lange, A.; Schupp, T.; Petersen, F.; Carlomagno, T.; Baldus, M. High-Resolution Solid-State NMR Structure of an Anticancer Agent. ChemMedChem 2007, 2, 522–527. [Google Scholar] [CrossRef] [Scilit]
  27. Elena, B.; Emsley, L. Powder Crystallography by Proton Solid-State NMR Spectroscopy. J. Am. Chem. Soc. 2005, 127, 9140–9146. [Google Scholar] [CrossRef] [Scilit]
  28. Elena, B.; Pintacuda, G.; Mifsud, N.; Emsley, L. Molecular Structure Determination in Powders by NMR Crystallography from Proton Spin Diffusion. J. Am. Chem. Soc. 2006, 128, 9555–9560. [Google Scholar] [CrossRef] [Scilit] [PubMed]
  29. Salager, E.; Stein, R.S.; Pickard, C.J.; Elena, B.; Emsley, L. Powder NMR Crystallography of Thymol. Phys. Chem. Chem. Phys. 2009, 11, 2610–2621. [Google Scholar] [CrossRef] [Scilit] [PubMed]
  30. Aluas, M.; Tripon, C.; Griffin, J.M.; Filip, X.; Ladizhansky, V.; Griffin, R.G.; Brown, S.P.; Filip, C. CHHC and 1H–1H Magnetization Exchange: Analysis by Experimental Solid-State NMR and 11-Spin Density-Matrix Simulations. J. Magn. Reson. 2009, 199, 173–187. [Google Scholar] [CrossRef] [Scilit] [PubMed]
  31. Bradley, J.P.; Tripon, C.; Filip, C.; Brown, S.P. Determining Relative Proton–Proton Proximities from the Build-Up of Two-Dimensional Correlation Peaks in 1H Double-Quantum MAS NMR: Insight from Multi-Spin Density-Matrix Simulations. Phys. Chem. Chem. Phys. 2009, 11, 6941–6952. [Google Scholar] [CrossRef] [Scilit]
  32. Seyfarth, L.; Senker, J. An NMR Crystallographic Approach for the Determination of the Hydrogen Substructure of Nitrogen Bonded Protons. Phys. Chem. Chem. Phys. 2009, 11, 3522–3531. [Google Scholar] [CrossRef] [Scilit]
  33. Seyfarth, L.; Seyfarth, J.; Lotsch, B.V.; Schnick, W.; Senker, J. Tackling the Stacking Disorder of Melon—Structure Elucidation in a Semicrystalline Material. Phys. Chem. Chem. Phys. 2010, 12, 2227–2237. [Google Scholar] [CrossRef] [Scilit]
  34. Kobayashi, T.; Wang, Z.; Pruski, M. Homonuclear Dipolar Recoupling of Arbitrary Pairs in Multi-Spin Systems under Magic Angle Spinning: A Double-Frequency-Selective ZQ-SEASHORE Experiment. Solid State Nucl. Magn. Reson. 2019, 101, 76–81. [Google Scholar] [CrossRef] [Scilit]
  35. Potnuru, L.R.; Duong, N.T.; Ahlawat, S.; Raran-Kurussi, S.; Ernst, M.; Nishiyama, Y.; Agarwal, V. Accuracy of 1H–1H Distances Measured Using Frequency Selective Recoupling and Fast Magic-Angle Spinning. J. Chem. Phys. 2020, 153, 084202. [Google Scholar] [CrossRef] [Scilit]
  36. Duong, N.T.; Aoyama, Y.; Kawamoto, K.; Yamazaki, T.; Nishiyama, Y. Structure Solution of Nano-Crystalline Small Molecules Using MicroED and Solid-State NMR Dipolar-Based Experiments. Molecules 2021, 26, 4652. [Google Scholar] [CrossRef] [Scilit]
  37. Yu, Y.; Stevensson, B.; Pujari-Palmer, M.; Guo, H.; Engqvist, H.; Edén, M. The Monetite Structure Probed by Advanced Solid-State NMR Experimentation at Fast Magic-Angle Spinning. Int. J. Mol. Sci. 2019, 20, 6356. [Google Scholar] [CrossRef] [Scilit]
  38. Mathew, R.; Stevensson, B.; Edén, M. Refined Structures of O-Phospho-L-serine and Its Calcium Salt by New Multinuclear Solid-State NMR Crystallography Methods. J. Phys. Chem. B 2021, 125, 10985–11004. [Google Scholar] [CrossRef] [Scilit] [PubMed]
  39. Karki, S.; Friščić, T.; Fábián, L.; Laity, P.R.; Day, G.M.; Jones, W. Improving Mechanical Properties of Crystalline Solids by Cocrystal Formation: New Compressible Forms of Paracetamol. Adv. Mater. 2009, 21, 3905–3909. [Google Scholar] [CrossRef] [Scilit]
  40. Perumalla, S.R.; Shi, L.; Sun, C.C. Ionized Form of Acetaminophen with Improved Compaction Properties. CrystEngComm 2012, 14, 2389–2390. [Google Scholar] [CrossRef] [Scilit]
  41. Nelyubina, Y.V.; Glukhov, I.V.; Antipin, M.Y.; Lyssenko, K.A. “Higher Density Does Not Mean Higher Stability” Mystery of Paracetamol Finally Unraveled. Chem. Commun. 2010, 46, 3469–3471. [Google Scholar] [CrossRef] [Scilit] [PubMed]
  42. Derissen, J.L.; Smit, P.H. Refinement of the Crystal Structures of Anhydrous α- and β-Oxalic Acids. Acta Cryst. 1974, B30, 2240–2242. [Google Scholar] [CrossRef] [Scilit]
  43. Majhi, D.; Stevensson, B.; Nguyen, T.M.; Edén, M. 1H and 13C Chemical Shift–Structure Effects in Anhydrous β-Caffeine and Four Caffeine–Diacid Cocrystals Probed by Solid-State NMR Experiments and DFT Calculations. Phys. Chem. Chem. Phys. 2024, 26, 14345–14364. [Google Scholar] [CrossRef] [Scilit]
  44. Casati, N.; Macchi, P.; Sironi, A. Hydrogen Migration in Oxalic Acid Di-Hydrate at High Pressure? Chem. Commun. 2009, 19, 2679–2681. [Google Scholar] [CrossRef] [Scilit]
  45. Feike, M.; Demco, D.E.; Graf, R.; Gottwald, J.; Hafner, S.; Spiess, H.W. Broadband Multiple-Quantum NMR Spectroscopy. J. Magn. Reson. Ser. A 1996, 122, 214–221. [Google Scholar] [CrossRef] [Scilit]
  46. Zhou, D.H.; Rienstra, C.H. Rapid Analysis of Organic Compounds by Proton-Detected Heteronuclear Correlation NMR Spectroscopy with 40 kHz Magic-Angle Spinning. Angew. Chem. Int. Ed. 2008, 47, 7328–7331. [Google Scholar] [CrossRef] [Scilit]
  47. Damron, J.T.; Kersten, K.M.; Pandey, M.K.; Mroue, K.H.; Yarava, J.R.; Nishiyama, Y.; Matzger, A.J.; Ramamoorthy, A. Electrostatic Constraints Assessed by 1H MAS NMR Illuminate Differences in Crystalline Polymorphs. J. Phys. Chem. Lett. 2017, 8, 4253–4257. [Google Scholar] [CrossRef] [Scilit]
  48. Pugliese, A.; Toresco, M.; McNamara, D.; Iuga, D.; Abraham, A.; Tobyn, M.; Hawarden, L.E.; Blanc, F. Drug–Plymer Interactions in Acetaminophen/Hydroxypropylmethylcellulose Acetyl Succinate Amorphous Solid Dispersions Revealed by Multidimensional Multinuclear Solid-State NMR Spectroscopy. Mol. Pharm. 2021, 18, 3519–3531. [Google Scholar] [CrossRef] [Scilit] [PubMed]
  49. Wilson, C.C. Neutron Diffraction of p-Hydroxyacetanilide (Paracetamol): Libration or Disorder of the Methyl Group at 100 K. J. Mol. Struct. 1997, 405, 207–217. [Google Scholar] [CrossRef] [Scilit]
  50. Sommer, W.; Gottwald, J.; Demco, D.E.; Spiess, H.W. Dipolar Heteronuclear Multiple-Quantum NMR Spectroscopy in Rotating Solids. J. Magn. Reson. Ser. A 1995, 113, 131–134. [Google Scholar] [CrossRef] [Scilit]
  51. Srivastava, K.; Ahukla, A.; Karthnick, T.; Velaga, S.P.; Tandon, P.; Sinha, K.; Shimpi, M.R. Molecular Structure, Spectroscopic Signature and Reactivity Analyses of Paracetamol Hydrochloride Monohydrate Salt Using Density Functional Theory Calculations. CrystEngComm 2019, 21, 857–865. [Google Scholar] [CrossRef] [Scilit]
  52. Srivastava, K.; Shimpi, M.R.; Srivastava, K.; Tandon, P.; Sinha, K.; Velaga, S.P. Vibrational Analysis and Chemical Activity of Paracetamol-Oxalic Acid Cocrystal Based on Monomer and Dimer Calculations: DFT and AIM Approach. RSC Adv. 2016, 6, 10024–10037. [Google Scholar] [CrossRef] [Scilit]
  53. Coelho, A. TOPAS-Academic, V6; Coelho Software: Brisbane, Australia, 2016. [Google Scholar]
  54. Perumalla, S.R.; Sun, C.C. Confused HCl: Hydrogen Chloride or Hydrochloric Acid? Chem. Eur. J. 2012, 18, 6462–6464. [Google Scholar] [CrossRef] [Scilit] [PubMed]
  55. Metz, G.; Wu, X.L.; Smith, S.O. Ramped-Amplitude Cross Polarization in Magic-Angle-Spinning NMR. J. Magn. Reson. Ser. A 1994, 110, 219–227. [Google Scholar] [CrossRef] [Scilit]
  56. Fung, B.M.; Khitrin, A.K.; Ermolaev, K. An Improved Broadband Decoupling Sequence for Liquid Crystals and Solids. J. Magn. Reson. 2000, 142, 97–101. [Google Scholar] [CrossRef] [Scilit]
  57. States, D.J.; Haberkorn, R.A.; Ruben, D.J. A Two-Dimensional Nuclear Overhauser Experiment with Pure Absorption Phase in Four Quadrants. J. Magn. Reson. 1982, 48, 286–292. [Google Scholar] [CrossRef] [Scilit]
  58. Kolodziejski, W.; Klinowski, J. Kinetics of Cross-Polarization in Solid State NMR: A Guide for Chemists. Chem. Rev. 2002, 102, 613–628. [Google Scholar] [CrossRef] [Scilit]
  59. Clark, S.J.; Segall, M.D.; Pickard, C.J.; Hasnip, P.J.; Probert, M.I.J.; Refson, K.; Payne, M.C. First Principles Methods Using CASTEP. Z. Krist. 2005, 220, 567–570. [Google Scholar] [CrossRef] [Scilit]
  60. Perdew, J.; Burke, K.; Wang, Y. Generalized Gradient Approximation for the Exchange-Correlation Hole of a Many-Electron System. Phys. Rev. B. 1996, 54, 16533–16539. [Google Scholar] [CrossRef] [Scilit]
  61. Yates, J.R.; Pickard, C.J.; Mauri, F. Calculation of NMR Chemical Shifts for Extended Systems Using Ultrasoft Pseudopotentials. Phys. Rev. B 2007, 76, 024401. [Google Scholar] [CrossRef] [Scilit]
  62. Payne, M.C.; Teter, M.P.; Allan, D.C.; Arias, T.A.; Joannopoulos, J.D. Iterative Minimization Techniques for Ab Initio Total-Energy Calculations: Molecular Dynamics and Conjugate Gradients. Rev. Mod. Phys. 1992, 64, 1045–1097. [Google Scholar] [CrossRef] [Scilit]
  63. Grimme, S.; Ehrlich, S.; Goerigk, L. Effect of the Damping Function in Dispersion Corrected Density Functional Theory. J. Comput. Chem. 2011, 32, 1456–1465. [Google Scholar] [CrossRef] [Scilit]
  64. Maricq, M.M.; Waugh, J.S. NMR in Rotating Solids. J. Chem. Phys. 1979, 70, 3300–3316. [Google Scholar] [CrossRef] [Scilit]
  65. Haeberlen, U. High Resolution NMR in Solids. Selective Averaging; Academic Press: New York, NY, USA, 1976. [Google Scholar]
  66. Mason, J. Conventions for the Reporting of Nuclear Magnetic Shielding (or Shift) Tensors Suggested by Participants in the NATO ARW on NMR Shielding Constants at the University of Maryland, College Park, July 1992. Solid State Nucl. Magn. Reson. 1993, 2, 285–288. [Google Scholar] [CrossRef] [Scilit]
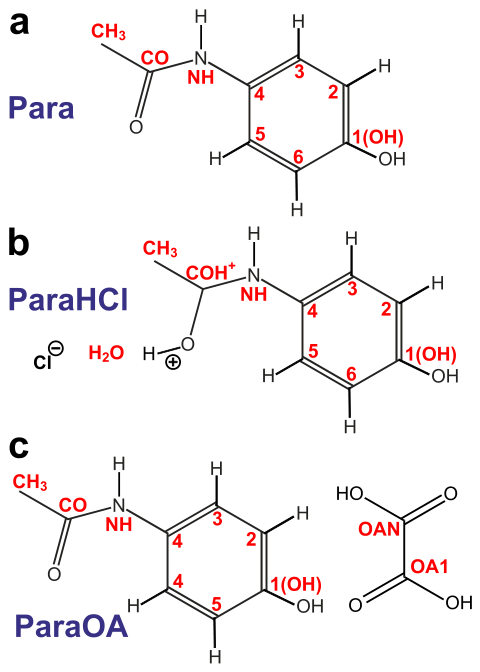
Figure 1. Molecular systems studied herein with their respective atom labeling of (a) paracetamol (“Para”), (b) paracetamol hydrochloride monohydrate salt (“ParaHCl”), and the (c) “ParaOA” cocrystal of paracetamol and oxalic acid (OA).
Molecules 31 01584 g001
Figure 2. 13C CPMAS NMR spectra acquired at 14.1 T and 12.00 kHz MAS from (a) Para, (b) ParaHCl, and the (c) ParaOA cocrystal. Each NMR peak was assigned to its respective 13C site identified in Figure 1 using DFT calculations. The chemical shift is specified by the number beneath (in ppm). The asterisks in (b) mark signals from a minor impurity attributed to bis(para)HCl; see Section 3.2. The resonance of a β -OA impurity is indicated in (c).
Molecules 31 01584 g002
Figure 3. 1H MAS NMR spectra recorded at 14.1 T and 60.0 kHz MAS from (a) Para, (b) ParaHCl, and the (c) ParaOA cocrystal. Each NMR peak is assigned to its respective 1H site shown in Figure 1 (Section 2.3), with the chemical shift at the peak maximum given by the number beneath (in ppm). The blue rectangle in (b) marks signals from a minor bis(para)HCl impurity. The resonance of a β -OA impurity is indicated in (c).
Molecules 31 01584 g003
Figure 4. 2Q–1Q 1H correlation NMR spectra recorded at 14.1 T and 60.00 kHz MAS from the (a) Para, (b) ParaHCl, and (c) ParaOA specimens by applying the BaBa recoupling sequence [45] for τ r = 16.67 µs to excite/reconvert 2QC. Each 2Q–1Q 1H correlation peak is assigned to its pair of nearby 1H sites in each 2D NMR spectrum, for which projection along the horizontal 1Q dimension is shown at the top, with each NMR peak assigned and the number beneath specifying the chemical shift in ppm. The circle in (a) indicates the intermolecular correlation expected for NH1(OH). The asterisks in (b) mark signals from a minor bis(para)HCl impurity, while the autocorrelation signal at δ 2 Q = 25.5 ppm in (c) originates from a β -OA impurity. The grey rectangle in (c) marks the group of heavily overlapping 1(OH)/H5/NH⋯H3/H5/H6 correlations.
Molecules 31 01584 g004
Figure 5. Fragments from the DFT-refined crystal structures of (a) Para, (b) ParaHCl, and (c) ParaOA. Each black dotted line marks the 1H–1H distance (in pm), while all green lines mark H-bond distances (pm) between the interconnected atom species.
Molecules 31 01584 g005
Figure 6. (a,c,e) 1H and (b,d,f) 13C chemical-shift correlations, where the results from NMR experiments (vertical axis) are plotted against those predicted by GIPAW/DFT (horizontal axis) for (a,b) Para, (c,d) ParaHCl, and (e,f) ParaOA. Each diagonal line represents the result of a perfect correlation, the deviation from which the as-indicated rmsd value was calculated.
Molecules 31 01584 g006
Figure 7. Correlation of the NMR-derived effective 1 H j 1Hk distance [ r eff NMR ( H j H k ) ] plotted against those calculated from the crystal structures (a,c,e) after DFT optimization [ r eff DFT ( H j H k ) ] of the initial (b,d,f) XRD structures [ r eff XRD ( H j H k ) ] of (a,b) Para [41], (c,d) ParaHCl [40], and (e,f) ParaOA [39]. The rmsd deviation is provided in each plot.
Molecules 31 01584 g007
Table 1. 1H and and DFT calculations a.
1H Chemical Shift (ppm)13C Chemical Shift (ppm)
  SiteNMRDFT( Δ H j )XRD( Δ H j )NMRDFT( Δ C j )XRD( Δ C j )
Para
  1 (OH)9.29.79 (0.59)9.32 (0.12)152.18154.21 (2.03)154.06 (1.88)
  25.755.42 (−0.33)5.31 (−0.44)116.19116.56 (0.37)115.82 (−0.37)
  3* 6.66.76 (0.16)6.67 (0.07)120.48121.49 (1.01)121.66 (1.18)
  4 132.91133.33 (0.42)134.26 (1.36)
  57.867.95 (0.09)7.90 (0.04)123.24124.62 (1.38)124.36 (1.12)
  6* 6.66.58 (−0.02)6.48 (−0.12)115.64115.82 (0.18)115.78 (0.14)
  CO 169.69166.50 (−3.19)165.97 (−3.72)
  NH9.039.47 (0.44)9.06 (0.04)
  CH 3 1.070.68 (−0.40)0.20 (−0.88)23.6421.43 (−2.21)18.07 (−5.57)
  rmsd (ppm) 0.350.38 1.672.57
ParaHCl
  1 (OH)8.28.33 (0.13)−0.99 (−9.19)155.79157.66 (1.87)157.55 (1.75)
  2* 6.56.58 (0.08)4.24 (−2.26)114.66113.92 (−0.74)107.11 (−7.54)
  36.76.62 (−0.08)5.00 (−1.70)* 122.23123.12 (0.89)117.79 (−4.44)
  4 128.22128.85 (0.63)128.03 (−0.19)
  5* 6.56.46 (−0.04)4.01 (−2.49)* 122.23122.17 (−0.06)116.03 (−6.20)
  66.26.17 (−0.03)3.36 (−2.84)117.54118.07 (0.53)113.47 (−4.07)
  COH + 16.9117.22 (0.31)10.86 (−6.04)172.43168.37 (−4.07)169.89 (−2.55)
  NH10.7610.39 (−0.37)4.24 (−6.52)
  CH 3 2.822.56 (−0.26)−1.84 (−4.67)22.6319.62 (−3.01)−2.00 (−24.62)
  H 2 A O7.27.21 (0.01)−2.23 (−9.43)
  H 2 B O6.66.58 (−0.02)−0.97 (−7.57)
  rmsd (ppm) 0.185.95 1.979.67
ParaOA
  1 (OH)8.39.23 (0.93)8.92 (0.62)150.78154.60 (3.82)152.61 (1.83)
  25.55.54 (0.04)5.31 (−0.19)* 115.05115.41 (0.35)110.81 (−4.25)
  36.56.66 (0.16)6.42 (−0.08)* 120.86122.50 (1.65)121.49 (0.64)
  4 132.77133.74 (0.97)134.02 (1.24)
  5* 7.27.39 (0.19)7.37 (0.17)* 120.86123.26 (2.41)123.06 (2.21)
  6* 7.27.18 (−0.02)6.85 (−0.35)* 115.05115.03 (−0.02)117.34 (2.29)
  NH9.310.17 (0.87)10.00 (0.70)
  CO 173.84173.32 (−0.52)171.12 (−2.72)
  CH 3 1.991.78 (−0.21)1.46 (−0.53)24.2721.80 (−2.47)19.92 (−4.35)
  HOA111.6812.57 (0.90)11.06 (−0.62)160.38162.79 (2.40)162.01 (1.62)
  HOAN14.7516.39 (1.64)13.62 (−1.13)159.43161.47 (2.04)158.85 (−0.58)
  rmsd (ppm) 0.760.58 2.012.50
a Chemical shifts obtained from NMR or computed by GIPAW/DFT on XRD-derived structures before (“XRD”) and after (“DFT”) geometry optimization by DFT (Section 2.4). The values within parentheses represent the deviation between the GIPAW/DFT predictions and the experimental chemical shift [Equation (1)]. The root mean square deviation (rmsd) between calculated and experimental chemical-shift sets are given for each structure (bold-face numbers). Values marked by asterisks involve sites with completely overlapping MAS NMR peaks, for which the chemical shift is taken as the peak maximum.
Table 2. Effective 1H–1H distances a.
Sites f NMR f DFT f XRD r eff DFT ( r eff NMR ) Δ r eff DFT r eff XRD ( r eff NMR ) Δ r eff XRD
(pm)(pm)(pm)(pm)
Para
1 (OH),NH
H20.0290.0240.021229 (220)9230 (218)12
H3,H60.0710.0610.057235 (227)8235 (226)9
C H 3 0.0740.0670.060193 (188)5194 (187)7
H2
H3,H60.0340.0190.018237 (214)23236 (213)23
C H 3 0.0560.0510.043202 (197)5205 (196)9
H3,H6
H50.0220.0220.020232 (230)2233 (229)4
C H 3 0.0650.0390.035211 (192)19211 (191)20
H5
H50.0260.0300.026221 (224)−3222 (222)0
C H 3 0.0120.0120.011290 (287)3290 (285)5
C H 3
CH3 b0.6110.6750.709177 (178)−1173 (177)−4
R2/rmsd (pm) 0.9800.976 10.5 11.5
ParaHCl
1–6, H 2 O
1–6, H 2 O0.4240.5060.632164 (169)−5144 (154)−10
CO H + 0.0850.1410.078203 (221)−18205 (202)3
NH0.1130.0540.033213 (188)25211 (172)39
C H 3 0.1220.0980.055260 (251)9260 (228)32
CO H +
NH0.0100.0050.003318 (301)17315 (273)42
C H 3 0.0320.0390.026225 (236)−11219 (214)5
NH
C H 3 0.0550.0500.030216 (212)4213 (193)20
C H 3
CH3 c0.1590.1070.143181 (170)11157 (154)3
R2/rmsd (pm) 0.9000.823 14.1 24.7
ParaOA
1–6,NH
1–6,NH0.4580.3840.404230 (223)7222 (218)4
H5,H6,NH
CH3 d0.3860.5780.564
H5,H6
HOAN0.0350.0470.044314 (330)−16305 (317)−12
C H 3
CH3 c0.2950.2740.294177 (175)2168 (168)0
HOA10.0100.0170.020332 (364)−32314 (354)−40
HOAN0.0630.1120.094242 (266)−24242 (259)−17
HOA1
1 (OH)0.0800.0990.065220 (228)−8227 (219)8
H20.0490.0540.057243 (247)−4232 (238)−6
HOAN0.0100.0130.022309 (321)−12276 (312)−36
R2/rmsd (pm) 0.9660.983 16.5 20.9
a Fractional 2Q–1Q NMR intensities [ f NMR ; Equation (4)] and the counterparts f XRD and f DFT calculated from Equation (6) and the atom coordinates in the XRD structure before and after DFT optimization, along with the effective 1H–1H distances extracted from Equation (8), r eff α with α = {NMR, XRD, DFT}. Δ r eff XRD ( H j H k ) and Δ r eff DFT ( H j H k ) were calculated from Equation (11), whereas the correlation coefficient ( R 2 ) of the agreement between the set { f NMR } and the XRD/DFT counterparts was evaluated from Equation (10), as well as the rmsd (in pm) between each { r eff XRD } and { r eff DFT } set to { r eff NMR }. b Assumed absence of rotation around the C 3 axis. c Assumed rapid rotation around the C 3 axis; see Section 2.6.2. d These values were excluded from the distance analysis; see Section 2.6.4.
Disclaimer/Publisher’s Note: The statements, opinions and data contained in all publications are solely those of the individual author(s) and contributor(s) and not of MDPI and/or the editor(s). MDPI and/or the editor(s) disclaim responsibility for any injury to people or property resulting from any ideas, methods, instructions or products referred to in the content.