
Quantitative 1H and 13C NMR and Chemometric Assessment of 13C NMR Data: Application to Anabolic Steroid Formulations

 ,
,
Abstract

1. Introduction
2. Results
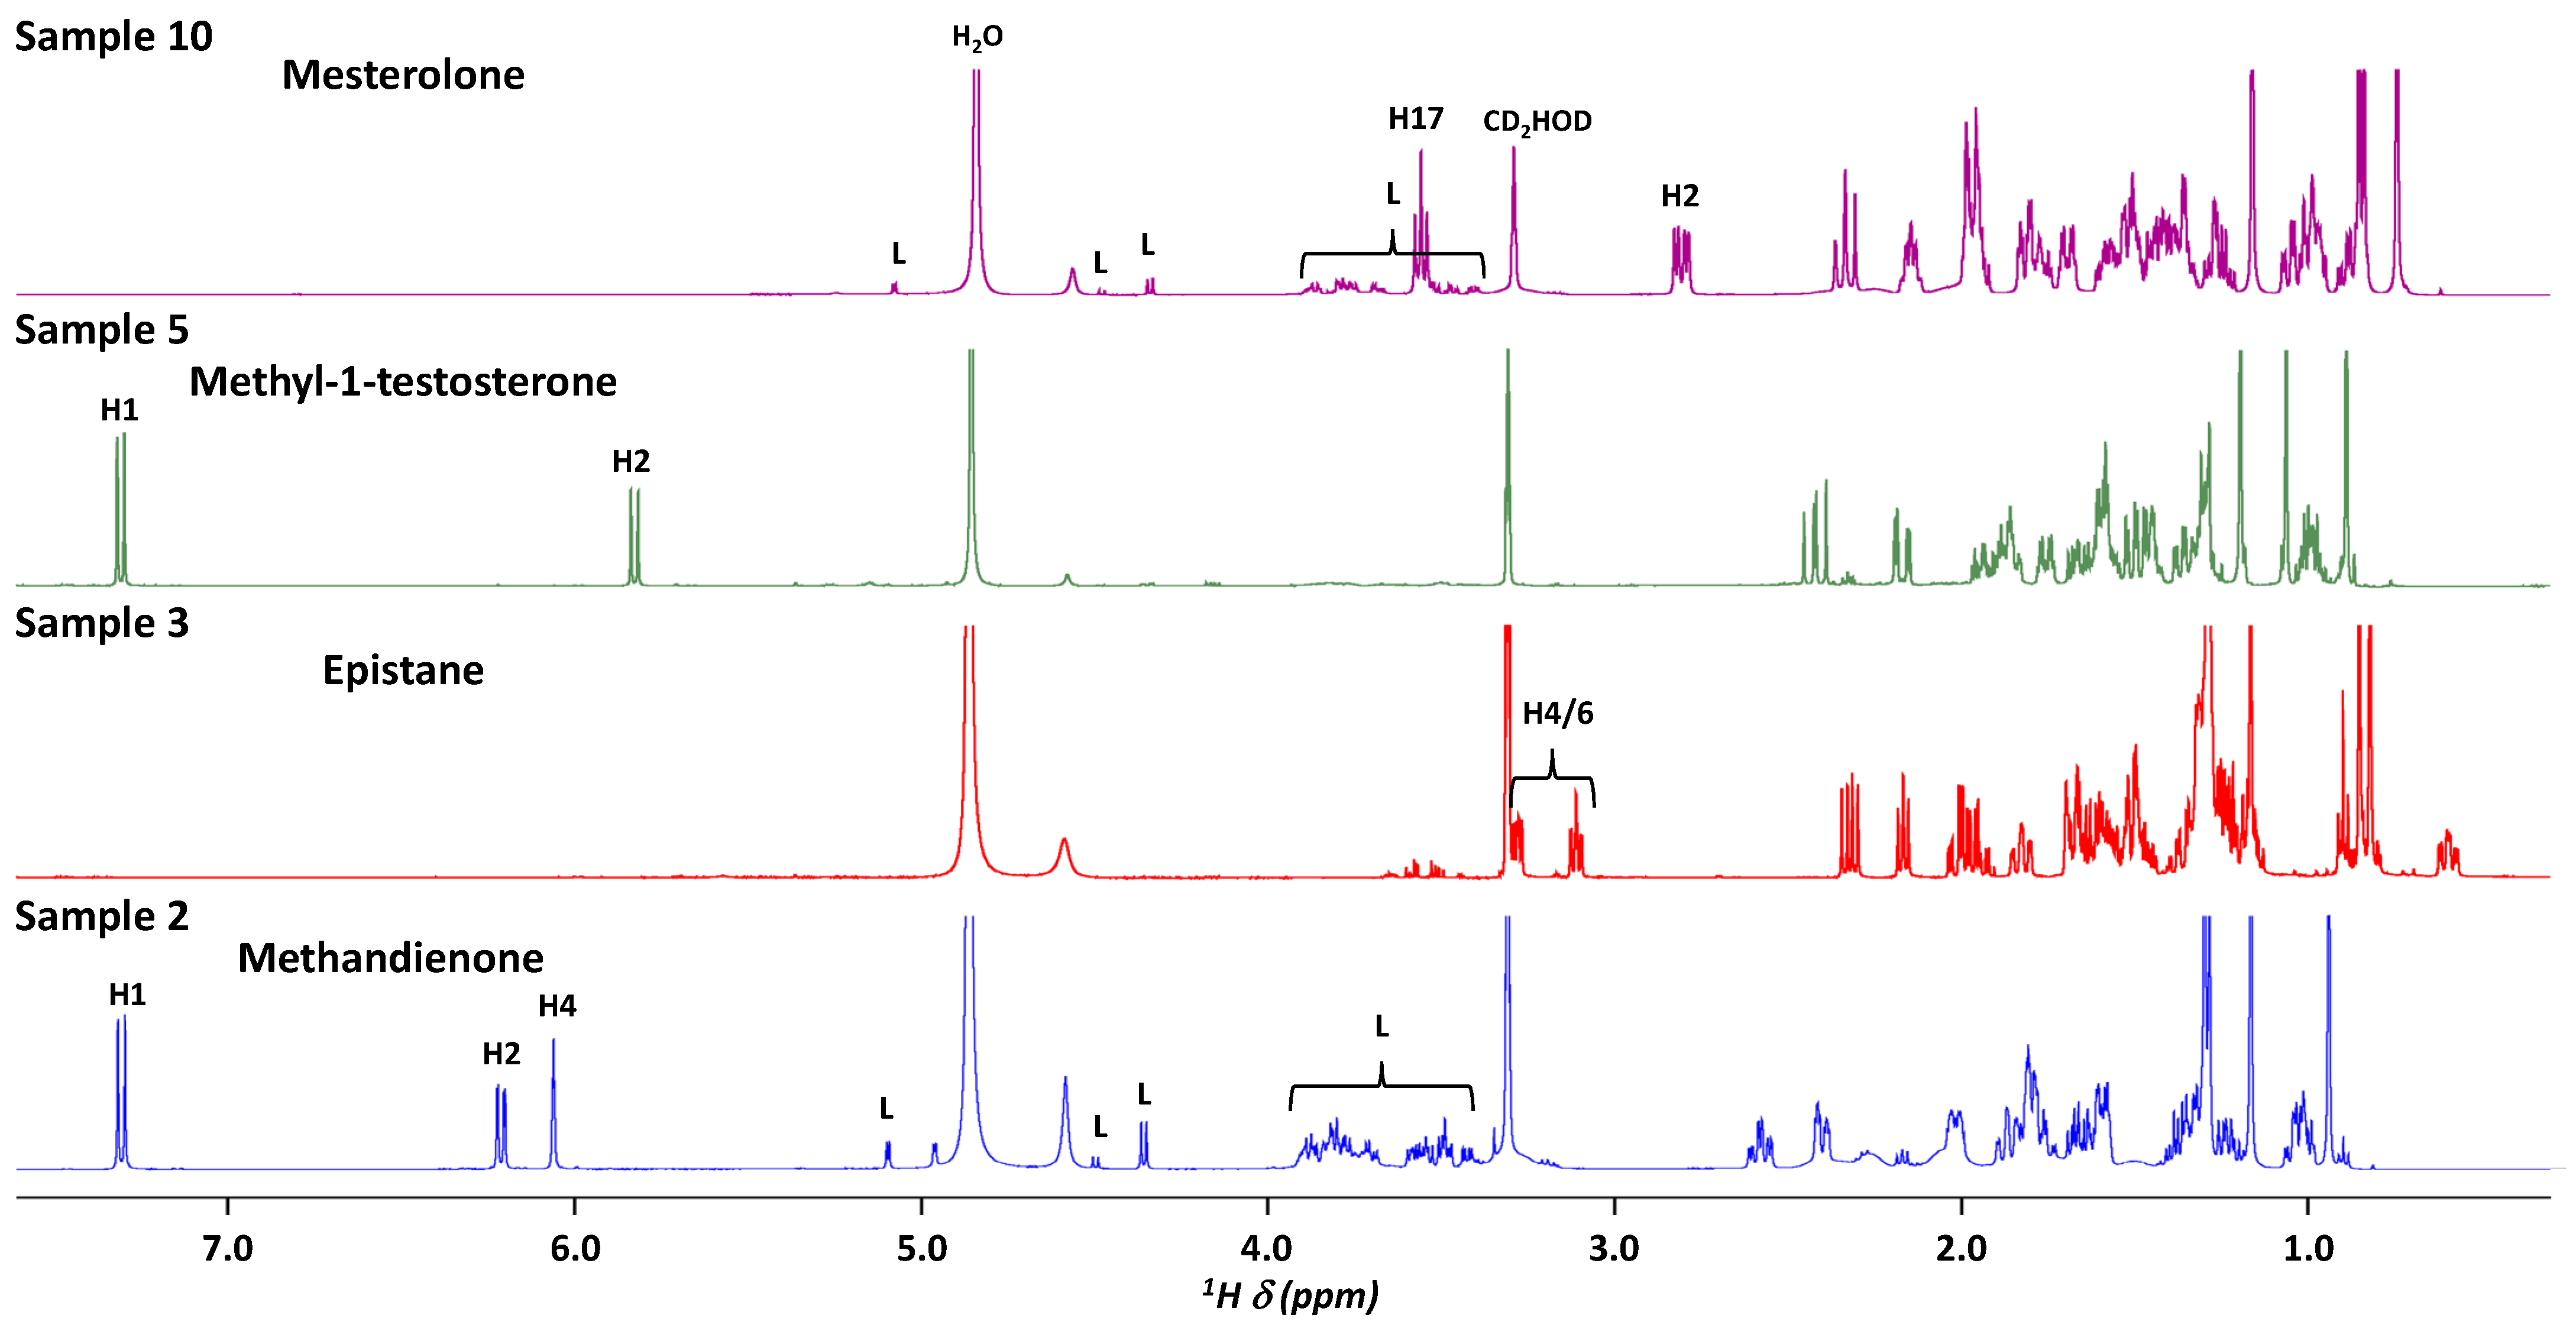
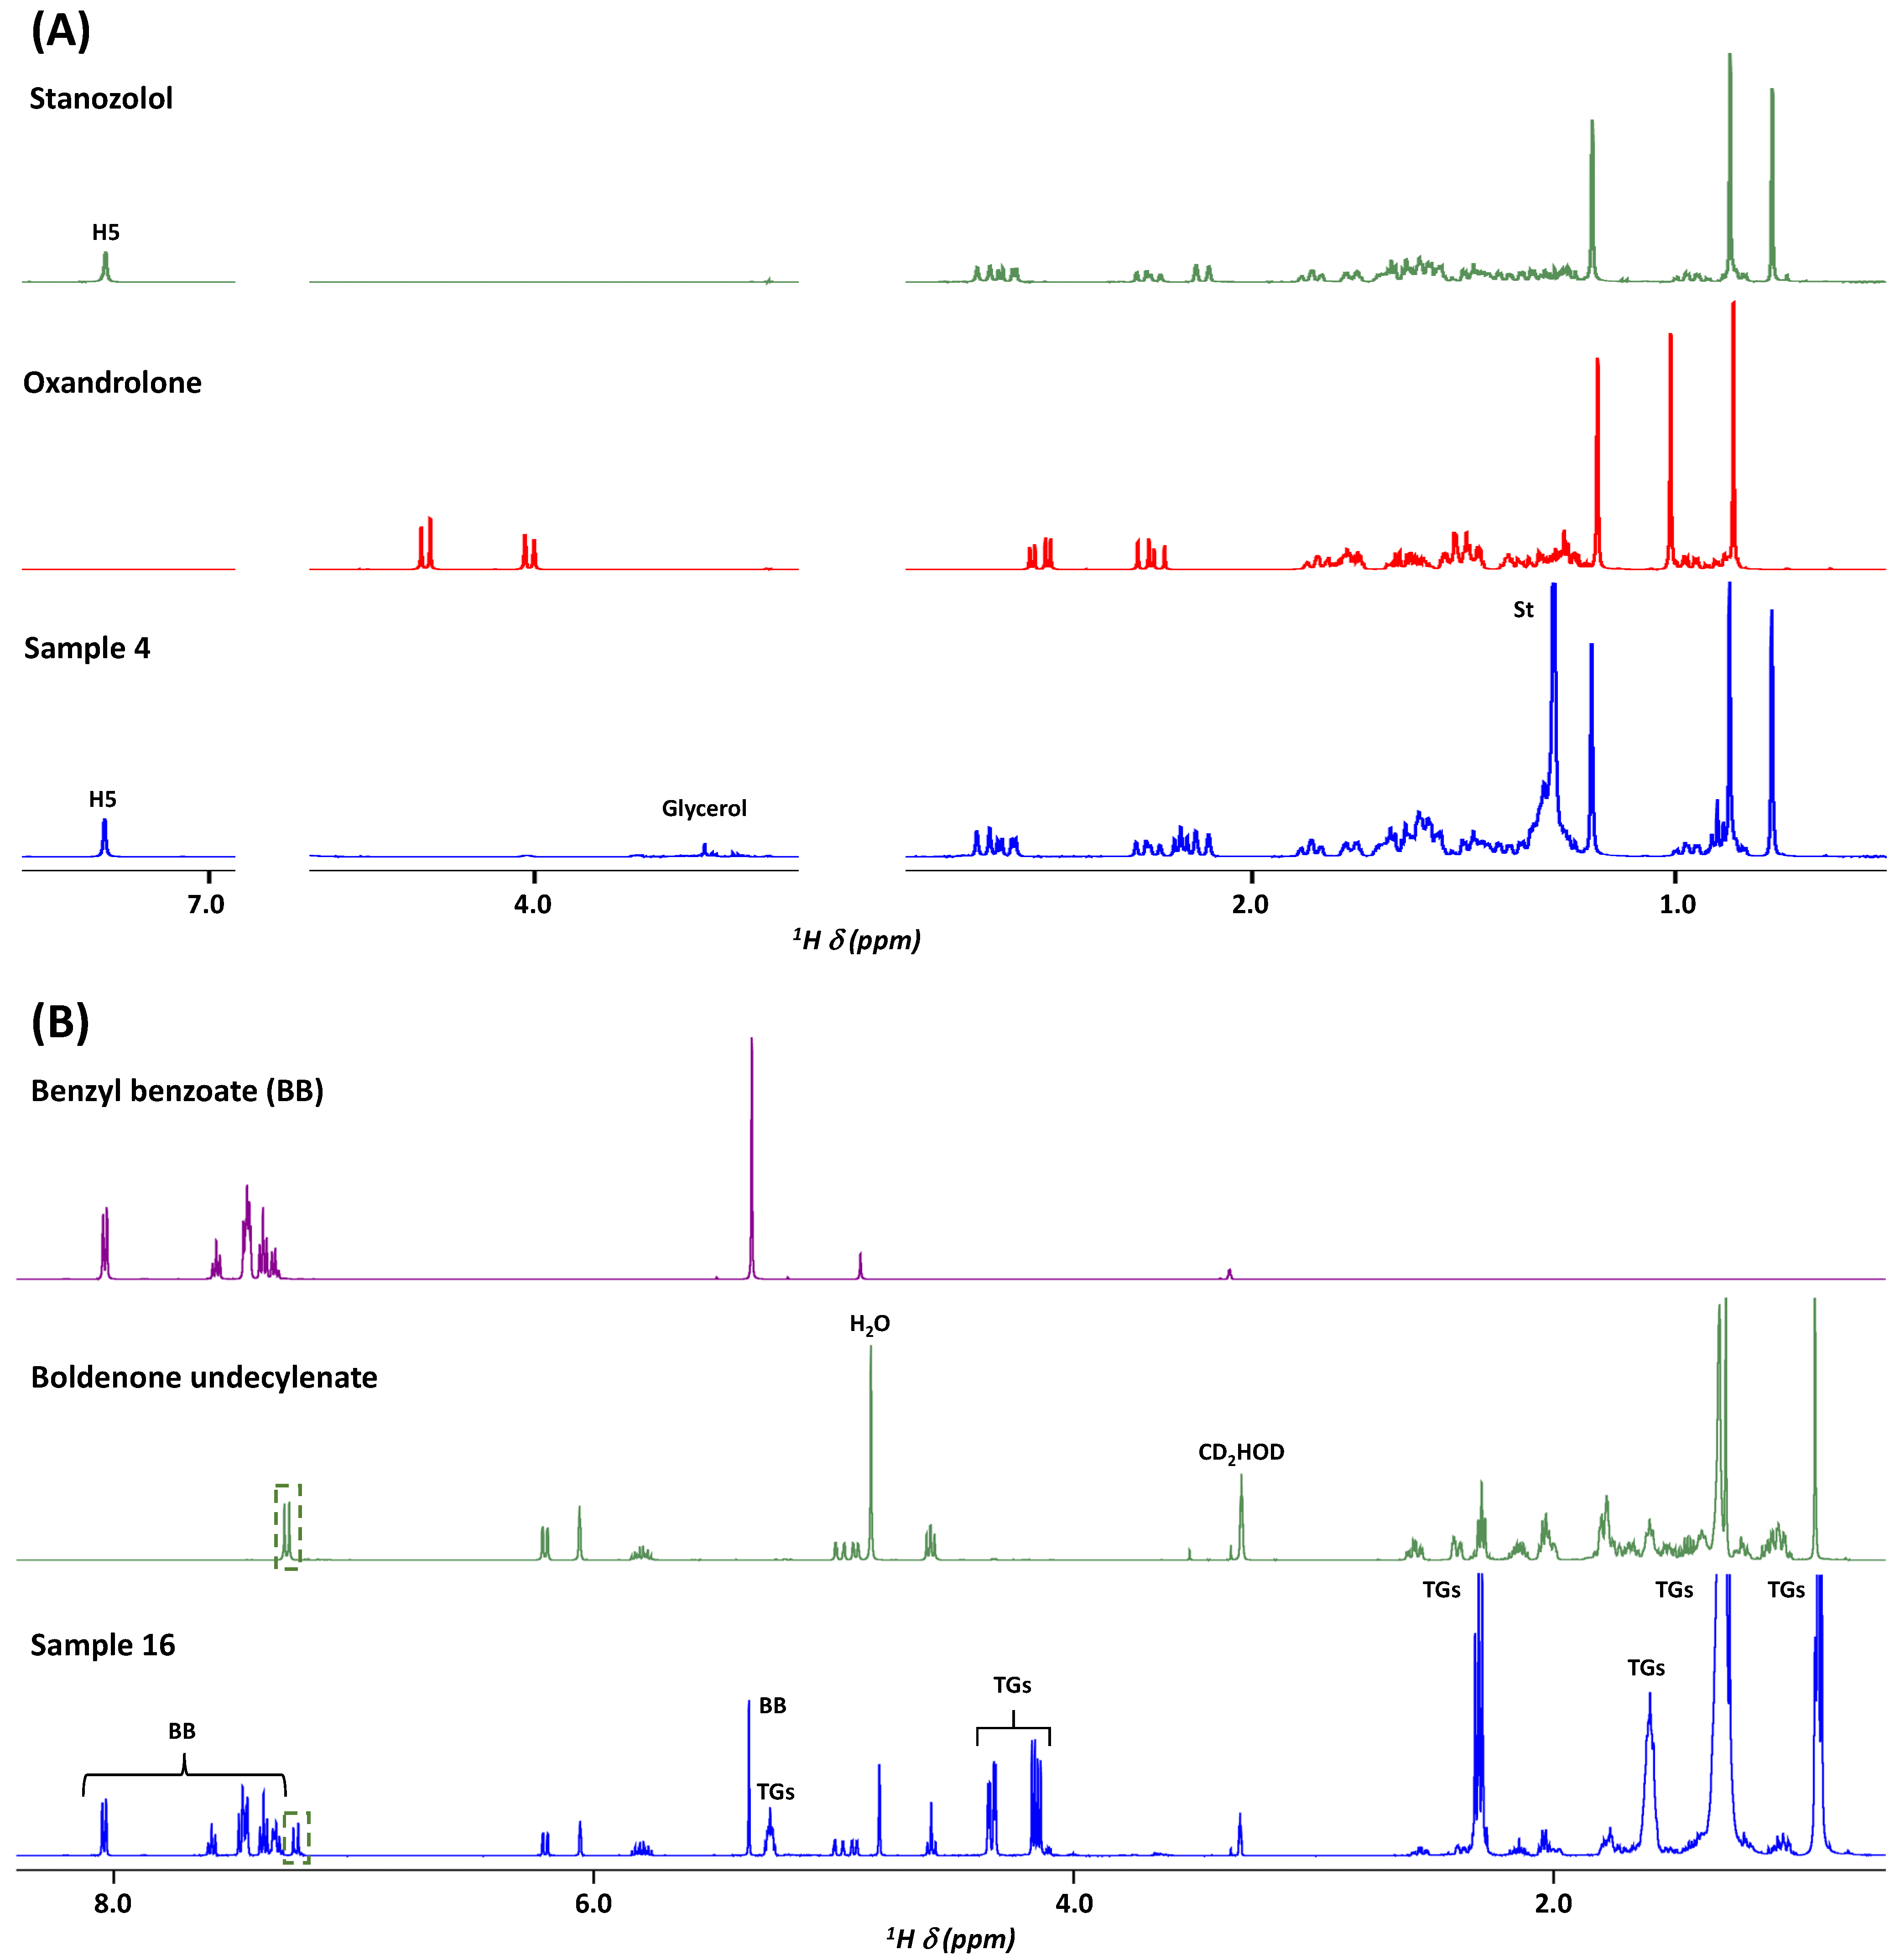
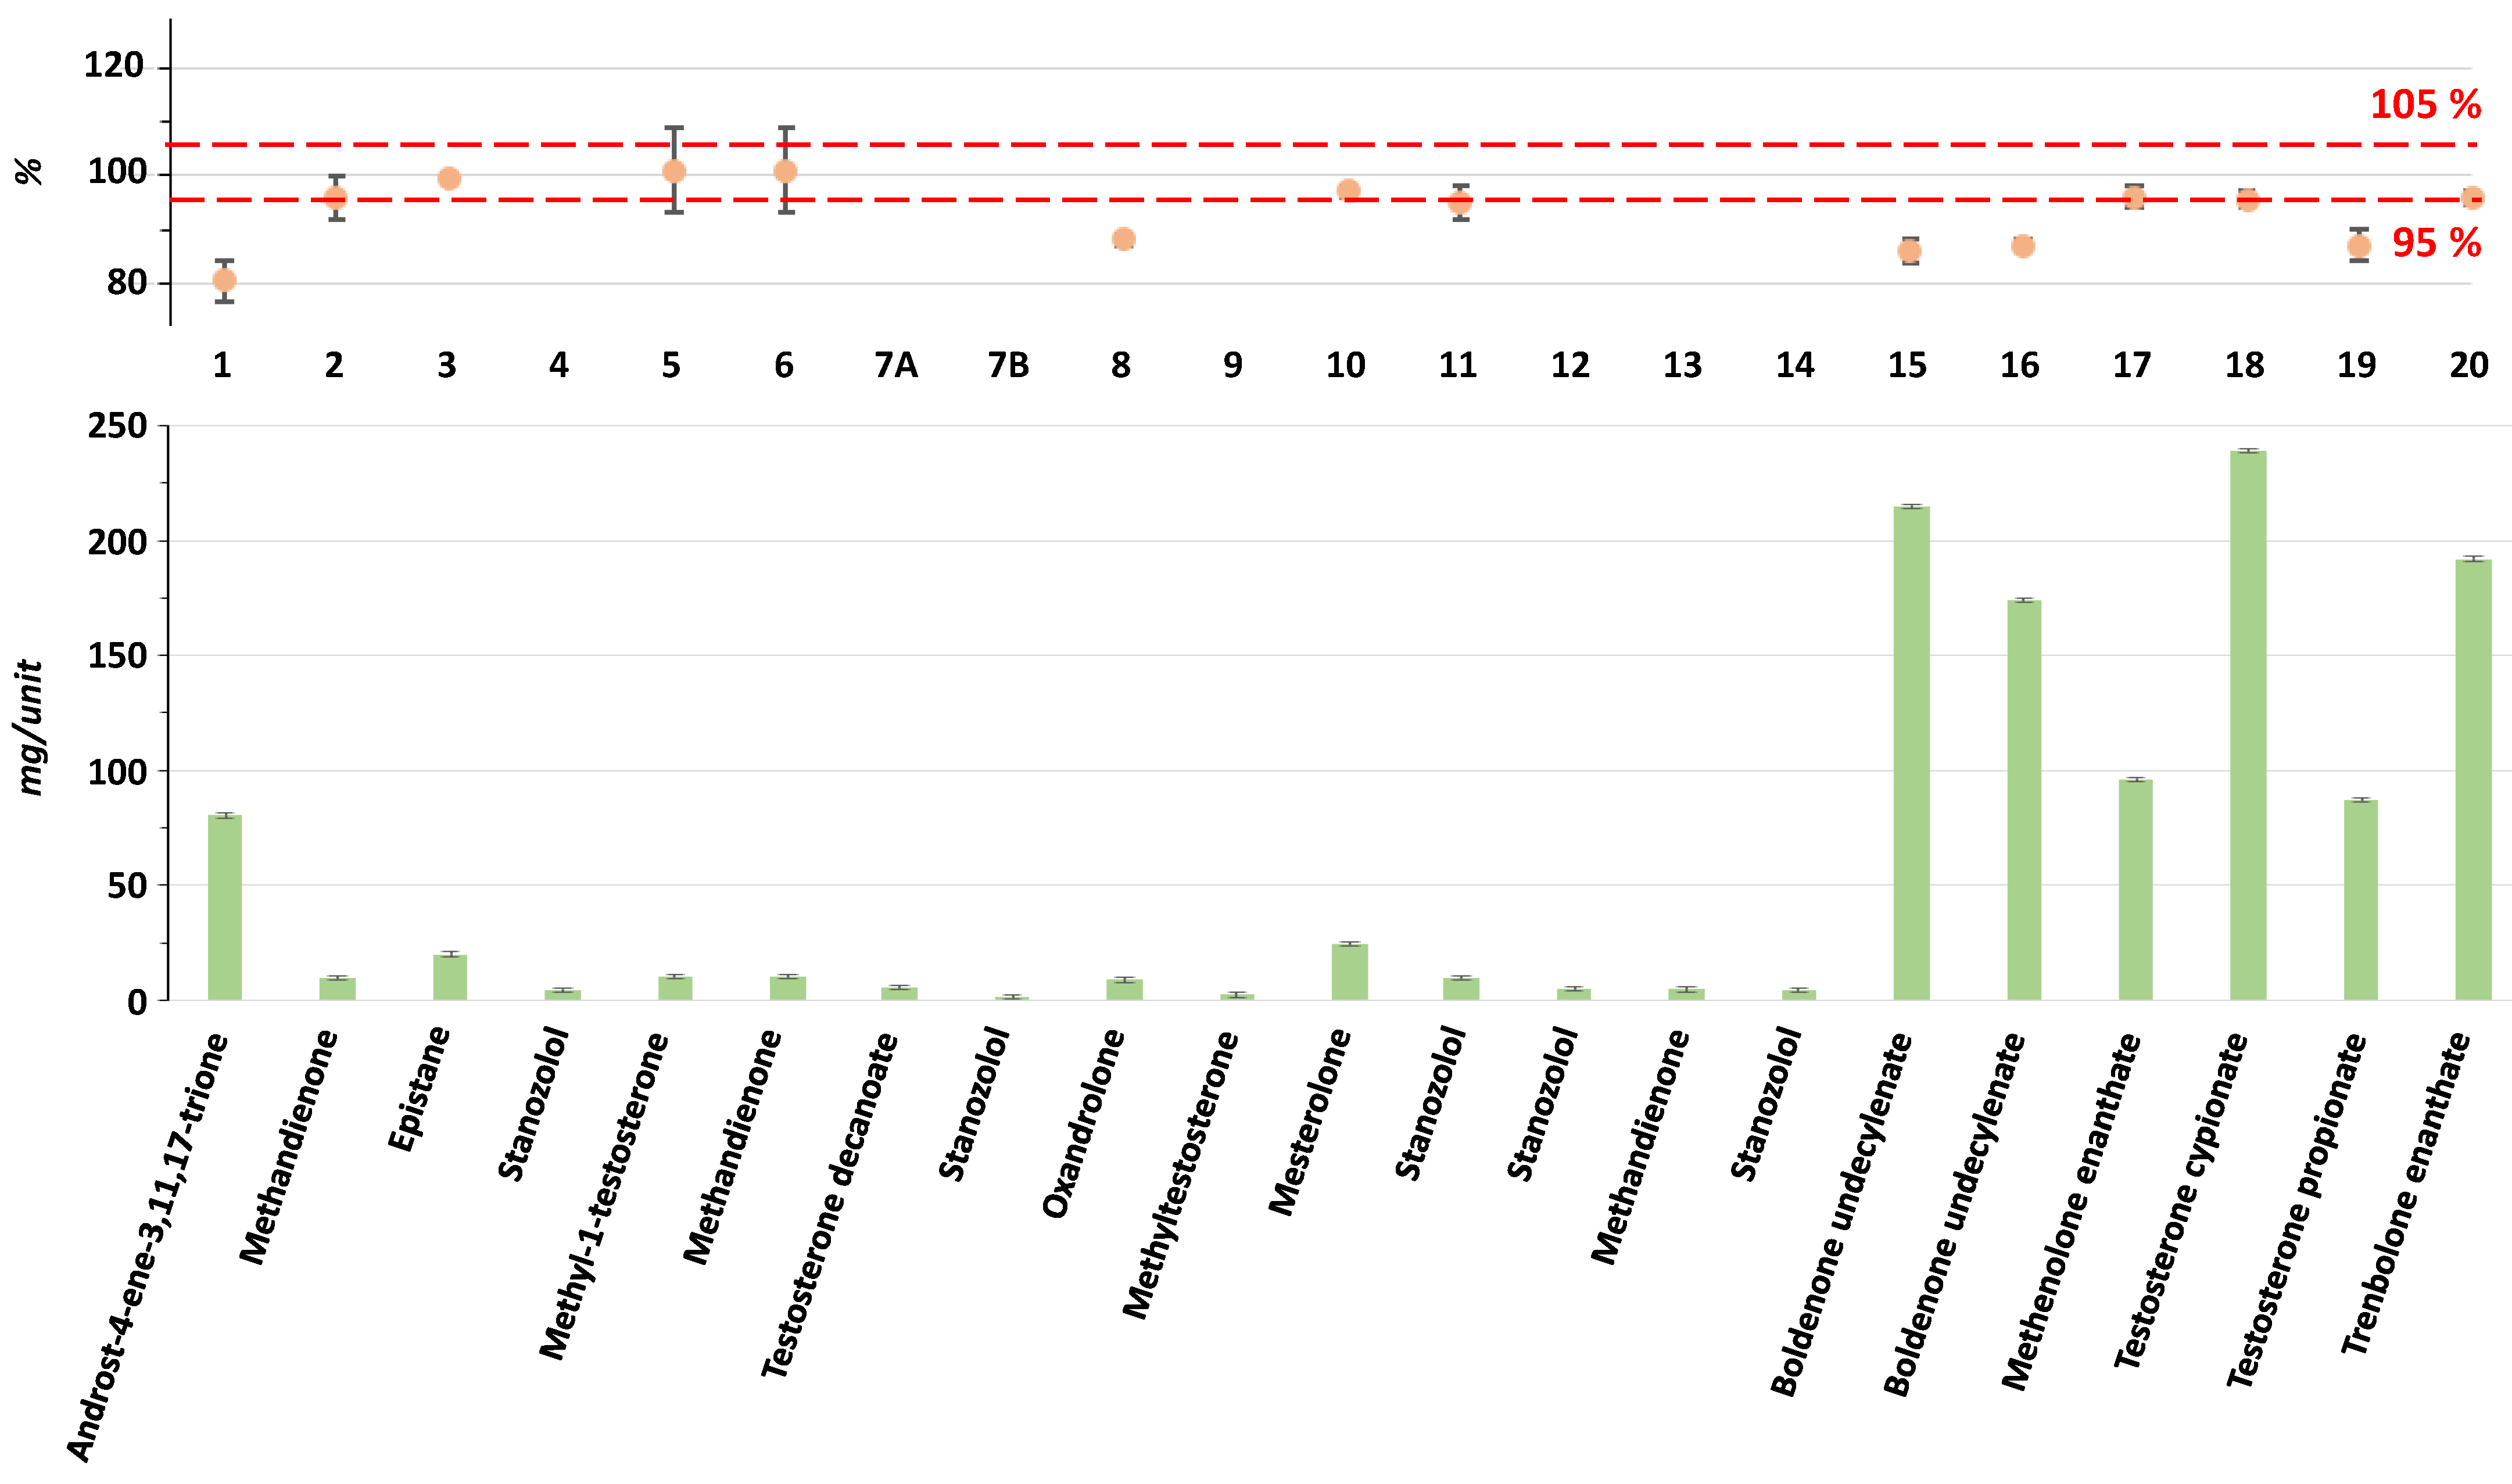
2.1. 1H NMR for the Assessment of 20 AAS Formulations
2.2. Comprehensive NMR and Chemometric Analysis of 12 Oily Injectable AAS Formulations
2.2.1. Qualitative 1H and 13C NMR Analysis
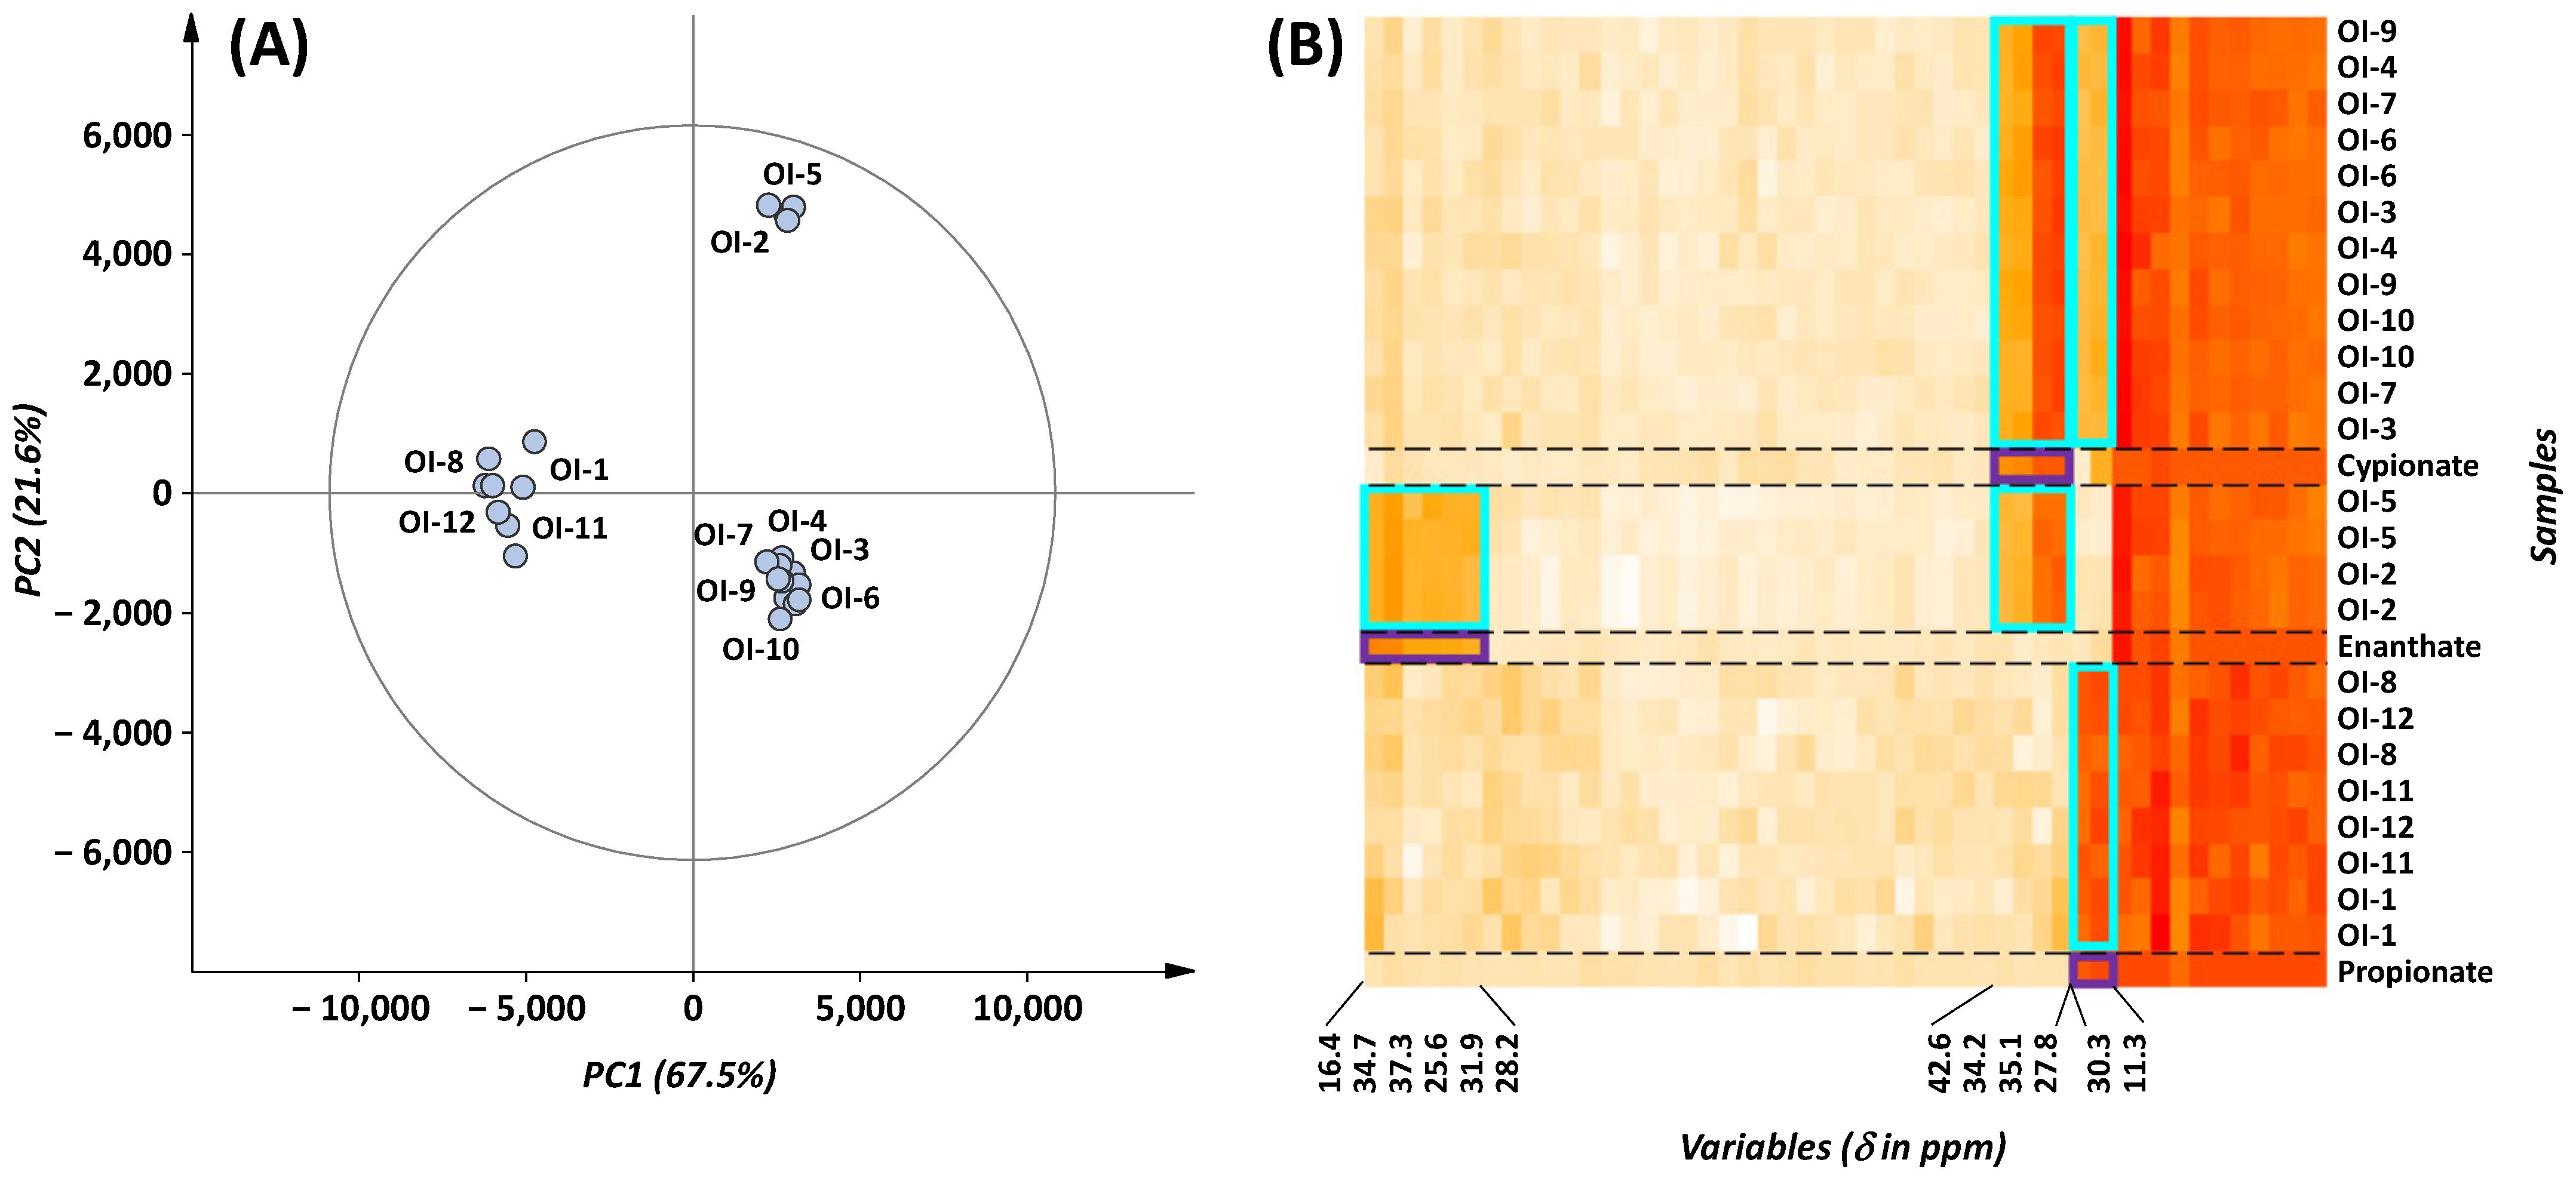
2.2.2. Chemometrics
3. Discussion
4. Materials and Methods
4.1. Materials
4.2. Sample Preparation
4.2.1. Qualitative Analysis
4.2.2. Quantitative Analysis
- Quantitative 1H NMR Analysis of Solid Formulations
- Quantitative analysis of injectable formulations
4.3. NMR Analysis
4.4. Chemometrics
4.5. Mass Spectrometry
Supplementary Materials
Author Contributions
Funding
Data Availability Statement
Acknowledgments
Conflicts of Interest
Abbreviations
| NMR | Nuclear magnetic resonance |
| AAS | Anabolic androgenic steroids |
| TSP | Sodium 2,2,3,3-tetradeutero-3-trimethylsilyl-propionate |
| MS | Mass spectrometry |
| PCA | Principal component analysis |
| HCA | Hierarchical cluster analysis |
Appendix A
Appendix A.1
Appendix A.2

| Testosterone Cypionate | Testosterone Propionate | Testosterone Enanthate | ||||
|---|---|---|---|---|---|---|
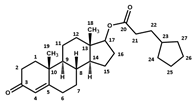 | 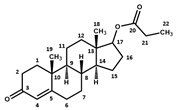 | 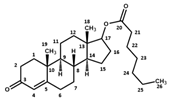 | ||||
| Atom N° | δ 1H (ppm) | δ 13C (ppm) | δ 1H (ppm) | δ 13C (ppm) | δ 1H (ppm) | δ 13C (ppm) |
| 1 | 2.08; 1.69 | 38.4 | 2.09; 1.69 | 38.5 | 2.07; 1.69 | 38.8 |
| 2 | 2.48; 2.31 | 35.5 | 2.49; 2.28 | 35.6 | 2.475; 2.28 | 35.9 |
| 3 | - | 204.0 | - | 204.0 | - | 204.2 |
| 4 | 5.71 | 125.9 | 5.705 | 126.0 | 5.70 | 126.3 |
| 5 | - | 176.6 | - | 176.6 | - | 176.8 |
| 6 | 2.31; 2.48 | 36.4 | 2.31; 2.49 | 36.4 | 2.31; 2.475 | 36.7 |
| 7 | 1.06; 1.91 | 34.5 | 1.06; 1.91 | 34.5 | 1.05; 1.90 | 34.8 |
| 8 | 1.70 | 38.3 | 1.70 | 38.4 | 1.70 | 38.6 |
| 9 | 1.01 | 56.9 | 1.01 | 57.0 | 1.00 | 57.3 |
| 10 | - | 41.7 | - | 41.7 | - | 42.0 |
| 11 | 1.48; 1.61 | 23.4 | 1.48; 1.61 | 23.4 | 1.47; 1.61 | 23.7 |
| 12 | 1.22; 1.79 | 39.6 | 1.22; 1.79 | 39.7 | 1.21; 1.78 | 40.0 |
| 13 | - | 45.4 | - | 45.5 | - | 45.8 |
| 14 | 1.12 | 53.2 | 1.12 | 53.3 | 1.11 | 53.6 |
| 15 | 1.70; 1.43 | 26.1 | 1.70; 1.41 | 26.1 | 1.69; 1.41 | 26.4 |
| 16 | 2.17; 1.54 | 30.2 | 2.17; 1.54 | 30.3 | 2.15; 1.53 | 30.6 |
| 17 | 4.61 | 85.6 | 4.61 | 85.6 | 4.61 | 85.8 |
| 18 | 0.89 | 14.2 | 0.88 | 14.2 | 0.88 | 14.5 |
| 19 | 1.25 | 19.4 | 1.24 | 19.4 | 1.24 | 19.7 |
| 20 | - | 177.4 | 178.0 | - | 177.5 | |
| 21 | 2.33 | 36.4 | 2.33 | 30.3 | 2.31 | 37.3 |
| 22 | 1.62 | 34.2 | 1.11 | 11.3 | 1.60 | 28.2 |
| 23 | 1.79 | 42.6 | 1.31 | 34.7; 31.9; 25.6 | ||
| 24 | 1.79; 1.12 | 35.1 | 1.31 | 34.7; 31.9; 25.6 | ||
| 25 | 1.71; 1.54 | 27.8 | 1.31 | 34.7; 31.9; 25.6 | ||
| 26 | 1.71; 1.54 | 27.8 | 0.90 | 16.4 | ||
| 27 | 1.79; 1.12 | 35.1 | ||||
References
- Hachem, R.; Assemat, G.; Martins, N.; Balayssac, S.; Gilard, V.; Martino, R.; Malet-Martino, M. Proton NMR for detection, identification and quantification of adulterants in 160 herbal food supplements marketed for weight loss. J. Pharm. Biomed. Anal. 2016, 124, 34–47. [Google Scholar] [CrossRef] [PubMed]
- Zhao, J.; Wang, M.; Avula, B.; Khan, I.A. Detection and quantification of phenethylamines in sports dietary supplements by NMR approach. J. Pharm. Biomed. Anal. 2018, 151, 347–355. [Google Scholar] [CrossRef] [PubMed]
- Dos Santos Ribeiro, H.S.; Dagnino, D.; Schripsema, J. Rapid and accurate verification of drug identity, purity and quality by 1H-NMR using similarity calculations and differential NMR. J. Pharm. Biomed. Anal. 2021, 199, 114040. [Google Scholar] [CrossRef] [PubMed]
- Kim, S.B.; Bisson, J.; Friesen, J.B.; Bucchini, L.; Gafner, S.; Lankin, D.C.; Chen, S.N.; Pauli, G.F.; McAlpine, J.B. The Untargeted Capability of NMR Helps Recognizing Nefarious Adulteration in Natural Products. J. Nat. Prod. 2021, 84, 846–856. [Google Scholar] [CrossRef]
- Holzgrabe, U.; Malet-Martino, M. Analytical challenges in drug counterfeiting and falsification-The NMR approach. J. Pharm. Biomed. Anal. 2011, 55, 679–687. [Google Scholar] [CrossRef]
- Skrzypiec-Spring, M.; Pokrywka, A.; Bombala, W.; Berezovska, D.; Rozmus, J.; Brawanska, K.; Nowicki, K.; Abu Faraj, G.; Rynkowski, M.; Szelag, A. Illegal Use of Testosterone and Other Anabolic-Androgenic Steroids in the Population of Amateur Athletes in Wroclaw, Poland-An Unfavorable Lifestyle Trend in the Population of Men of Reproductive Age. J. Clin. Med. 2024, 13, 3719. [Google Scholar] [CrossRef]
- World Anti-Doping Code International Standard Prohibited List. 2025. Available online: https://www.wada-ama.org/en/prohibited-list#search-anchor (accessed on 18 April 2025).
- Berneira, L.M.; Poletti, T.; de Freitas, S.C.; da Silva, C.C.; Ortiz, R.S.; de Pereira, C.M.P. Extraction and analytical approaches in the forensic evaluation of anabolic androgenic steroid formulations. WIREs Forensic Sci. 2021, 4, e1437. [Google Scholar] [CrossRef]
- Neves, D.; Caldas, E.D. GC-MS quantitative analysis of black market pharmaceutical products containing anabolic androgenic steroids seized by the Brazilian Federal Police. Forensic Sci. Int. 2017, 275, 272–281. [Google Scholar] [CrossRef]
- Al-Khadhra, R.S. The determination of common anabolic steroid and stimulants in nutritional supplements by HPLC-DAD and LC-MS. J. Chromatogr. Sci. 2020, 58, 355–361. [Google Scholar] [CrossRef]
- Lorenz, L.M.; Toomey, V.M.; Lanzarotta, A.C.; Flurer, R.A.; Falconer, T.M. Identification of the designer steroid Androsta-3,5-diene-7,17-dione in a dietary supplement. Drug Test. Anal. 2019, 11, 1109–1115. [Google Scholar] [CrossRef]
- Gonzalo-Lumbreras, R.; Garcia-Miguens, M.A.; Izquierdo-Hornillos, R. HPLC method development for testosterone propionate and cipionate in oil-based injectables. J. Pharm. Biomed. Anal. 2005, 38, 757–762. [Google Scholar] [CrossRef] [PubMed]
- Tircova, B.; Bosakova, Z.; Kozlik, P. Development of an ultra-high performance liquid chromatography-tandem mass spectrometry method for the determination of anabolic steroids currently available on the black market in the Czech Republic and Slovakia. Drug Test. Anal. 2019, 11, 355–360. [Google Scholar] [CrossRef] [PubMed]
- Micalizzi, G.; Huszti, K.; Palinkas, Z.; Mandolfino, F.; Martos, E.; Dugo, P.; Mondello, L.; Utczas, M. Reliable identification and quantification of anabolic androgenic steroids in dietary supplements by using gas chromatography coupled to triple quadrupole mass spectrometry. Drug Test. Anal. 2021, 13, 128–139. [Google Scholar] [CrossRef] [PubMed]
- Ribeiro, M.V.d.M.; Boralle, N.; Pezza, H.R.; Pezza, L. Authenticity assessment of anabolic androgenic steroids in counterfeit drugs by 1H NMR. Anal. Methods 2018, 10, 1140–1150. [Google Scholar] [CrossRef]
- Ribeiro, M.V.M.; Boralle, N.; Felippe, L.G.; Pezza, H.R.; Pezza, L. 1H NMR determination of adulteration of anabolic steroids in seized drugs. Steroids 2018, 138, 47–56. [Google Scholar] [CrossRef]
- Monakhova, Y.B.; Holzgrabe, U.; Diehl, B.W.K. Current role and future perspectives of multivariate (chemometric) methods in NMR spectroscopic analysis of pharmaceutical products. J. Pharm. Biomed. Anal. 2018, 147, 580–589. [Google Scholar] [CrossRef]
- Shi, T.; Dai, T.; Zhang, T.; Ma, X.; Wang, X. NMR spectroscopy combined with chemometrics for quality assessment of common vegetable oils: A review. Trends Food Sci. Technol. 2025, 157, 104889. [Google Scholar] [CrossRef]
- Kozhuharov, V.R.; Ivanov, K.; Ivanova, S. Dietary Supplements as Source of Unintentional Doping. Biomed. Res. Int. 2022, 2022, 8387271. [Google Scholar] [CrossRef]
- Magnolini, R.; Falcato, L.; Cremonesi, A.; Schori, D.; Bruggmann, P. Fake anabolic androgenic steroids on the black market—A systematic review and meta-analysis on qualitative and quantitative analytical results found within the literature. BMC Public Health 2022, 22, 1371. [Google Scholar] [CrossRef]
- Blunt, J.W.; Stothers, J.B. 13C n.m.r. spectra of steroids—A survey and commentary. Org. Magn. Reson. 2005, 9, 439–464. [Google Scholar] [CrossRef]
- Miguita, A.G.C.; Augusti, R.; Nascentes, C.C.; Sena, M.M. Screening method for the characterization of anabolic steroids seized in Brazil using paper spray mass spectrometry and chemometric tools. J. Mass. Spectrom. 2022, 57, e4886. [Google Scholar] [CrossRef] [PubMed]
- Hou, Z.; Jin, Y.; Gu, Z.; Zhang, R.; Su, Z.; Liu, S. 1H NMR Spectroscopy Combined with Machine-Learning Algorithm for Origin Recognition of Chinese Famous Green Tea Longjing Tea. Foods 2024, 13, 2702. [Google Scholar] [CrossRef] [PubMed]
- Schmid, N.; Bruderer, S.; Paruzzo, F.; Fischetti, G.; Toscano, G.; Graf, D.; Fey, M.; Henrici, A.; Ziebart, V.; Heitmann, B.; et al. Deconvolution of 1D NMR spectra: A deep learning-based approach. J. Magn. Reson. 2023, 347, 107357. [Google Scholar] [CrossRef] [PubMed]
- Okano, M.; Sato, M.; Ikekita, A. Analysis of non-ketoic steroids 17α-methylepithiostanol and desoxymethyltestosterone indietary supplements. Drug Test. Anal. 2009, 1, 518–525. [Google Scholar] [CrossRef]

| Sample Number | Form | Claimed Active Compound | Detected Active Compound |
|---|---|---|---|
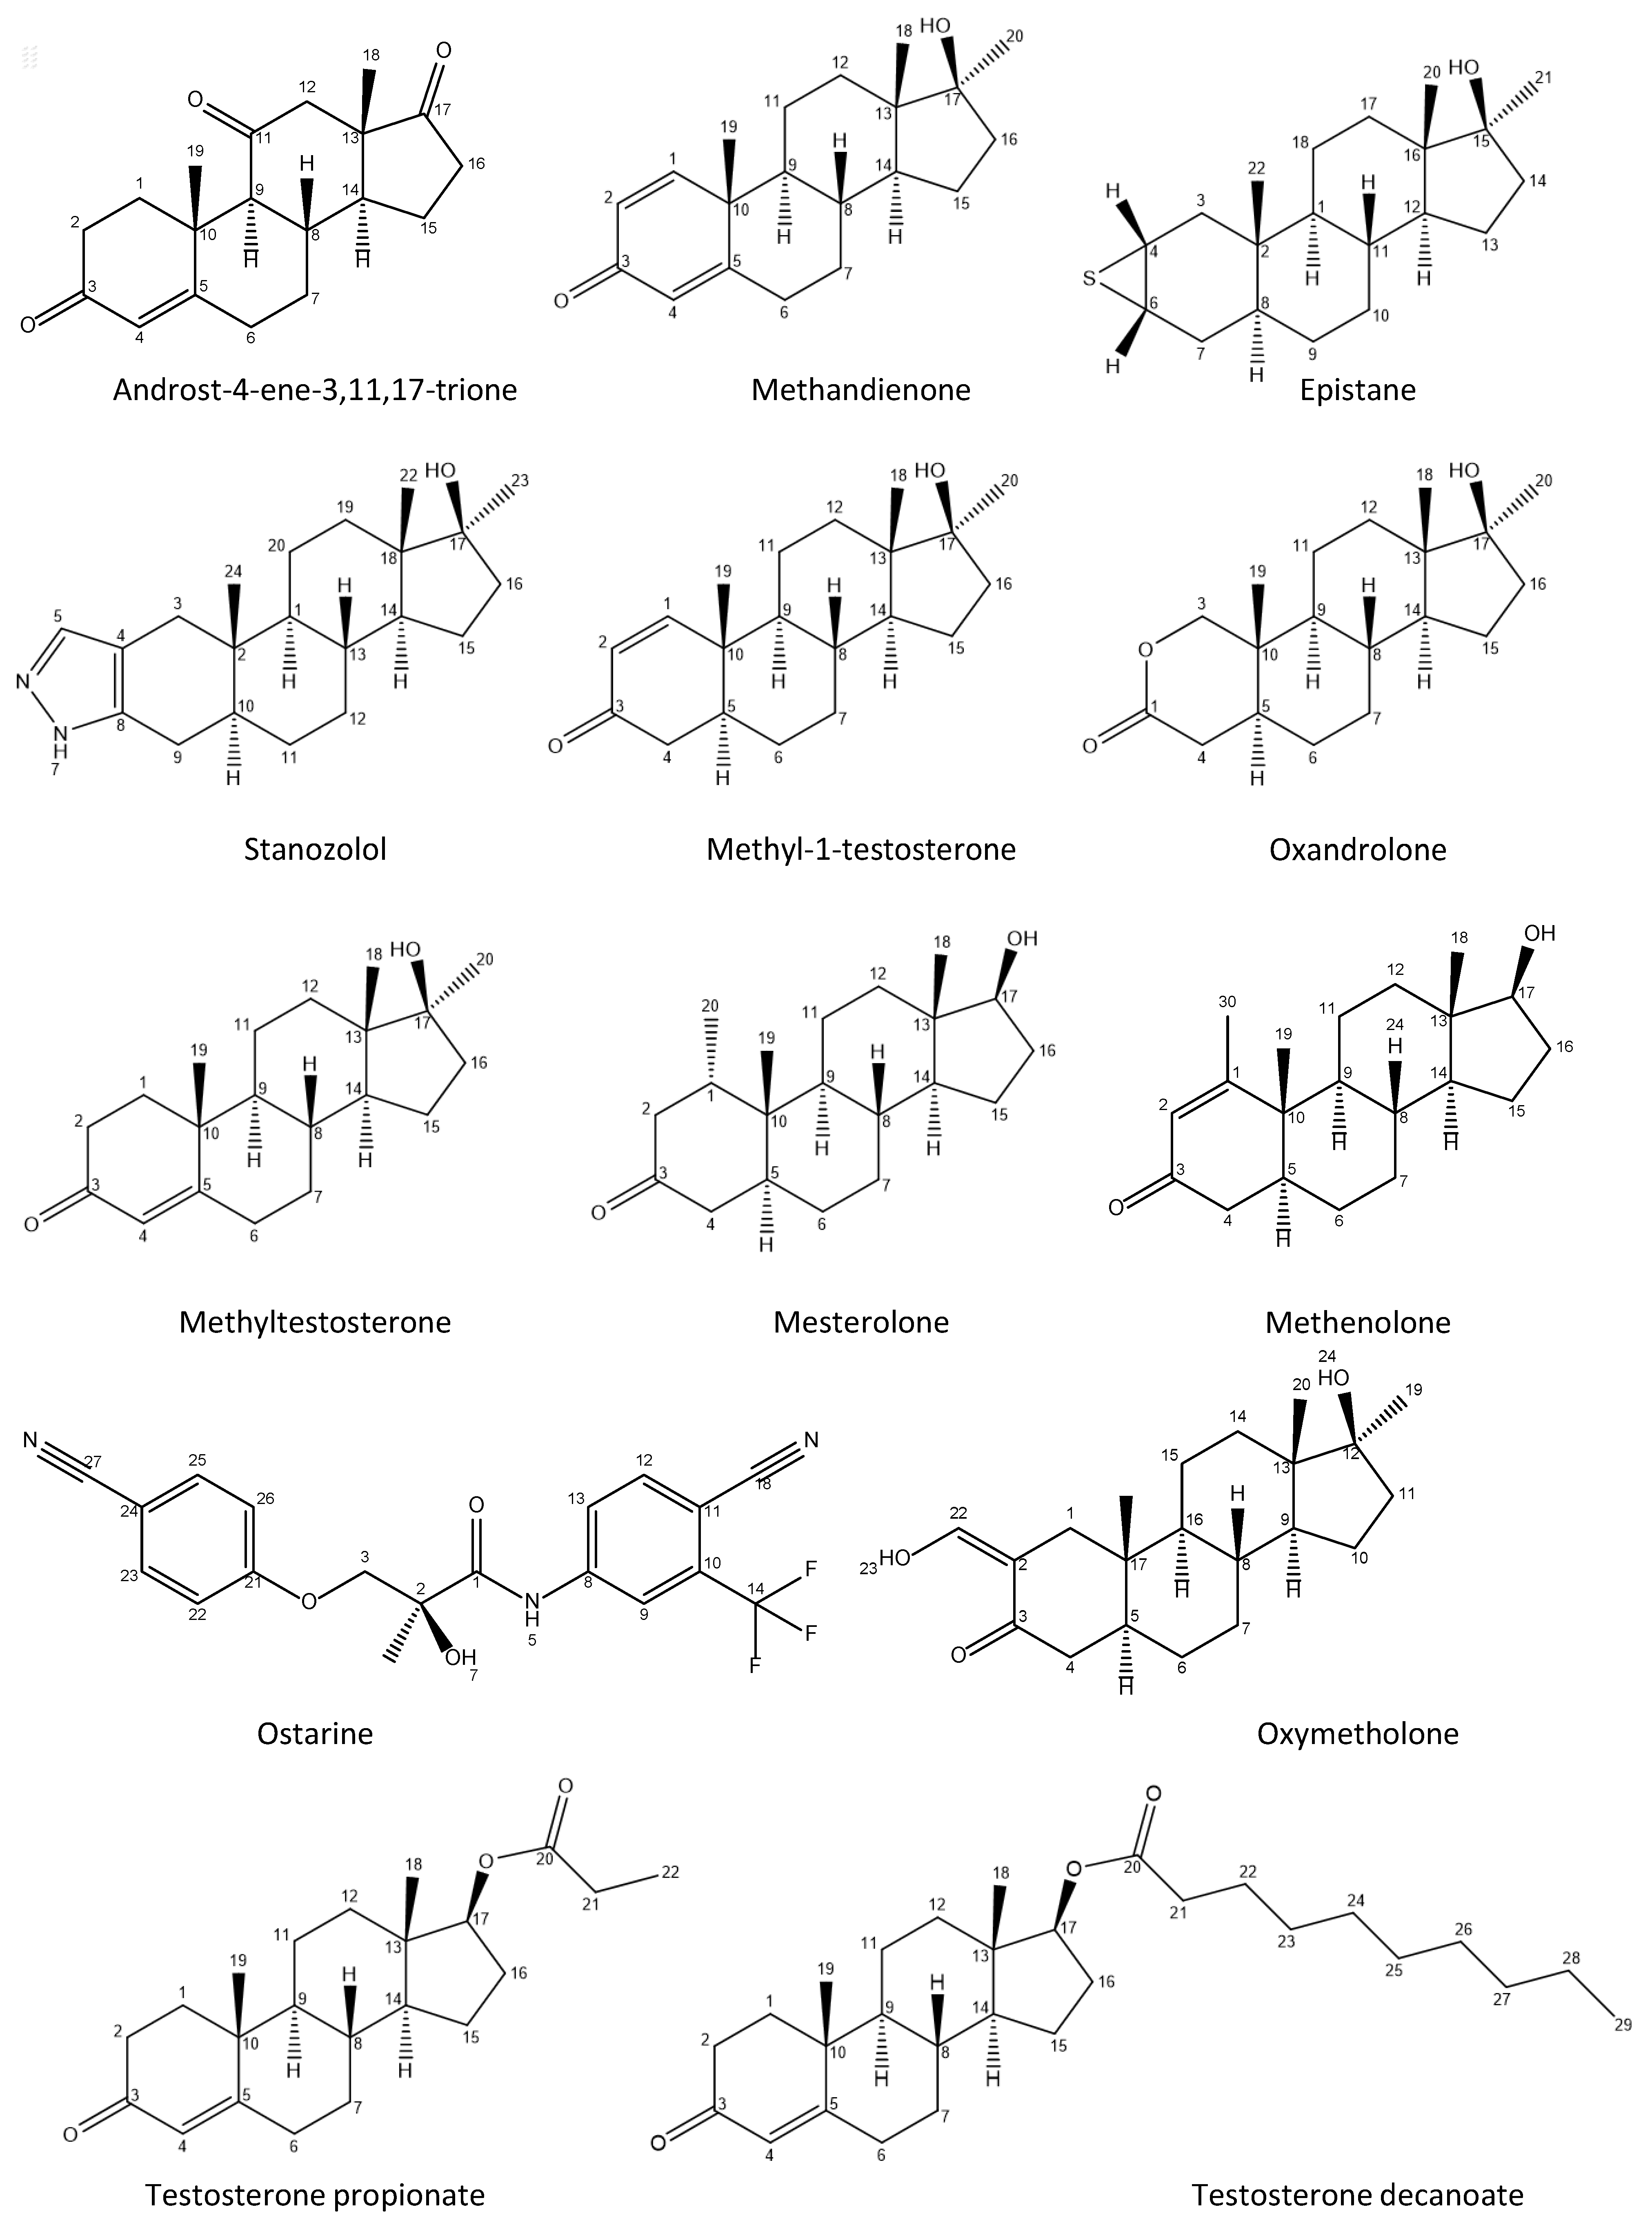
| 1 | capsule | Androst-4-ene-3,11,17-trione | Androst-4-ene-3,11,17-trione |
| 2 | tablet | Methandienone | Methandienone |
| 3 | capsule | Epistane | Epistane |
| 4 | tablet | Oxandrolone | Stanozolol |
| 5 | tablet | Methyl-1-testosterone | Methyl-1-testosterone |
| 6 | tablet | Methandienone | Methandienone |
| 7 | capsule | Ostarine | Testosterone decanoate Stanozolol |
| 8 | tablet | Oxandrolone | Oxandrolone |
| 9 | tablet | Oxymetholone | Methyltestosterone |
| 10 | tablet | Mesterolone | Mesterolone |
| 11 | tablet | Stanozolol | Stanozolol |
| 12 | tablet | no information * | Stanozolol |
| 13 | tablet | no information * | Methandienone |
| 14 | tablet | no information * | Stanozolol |
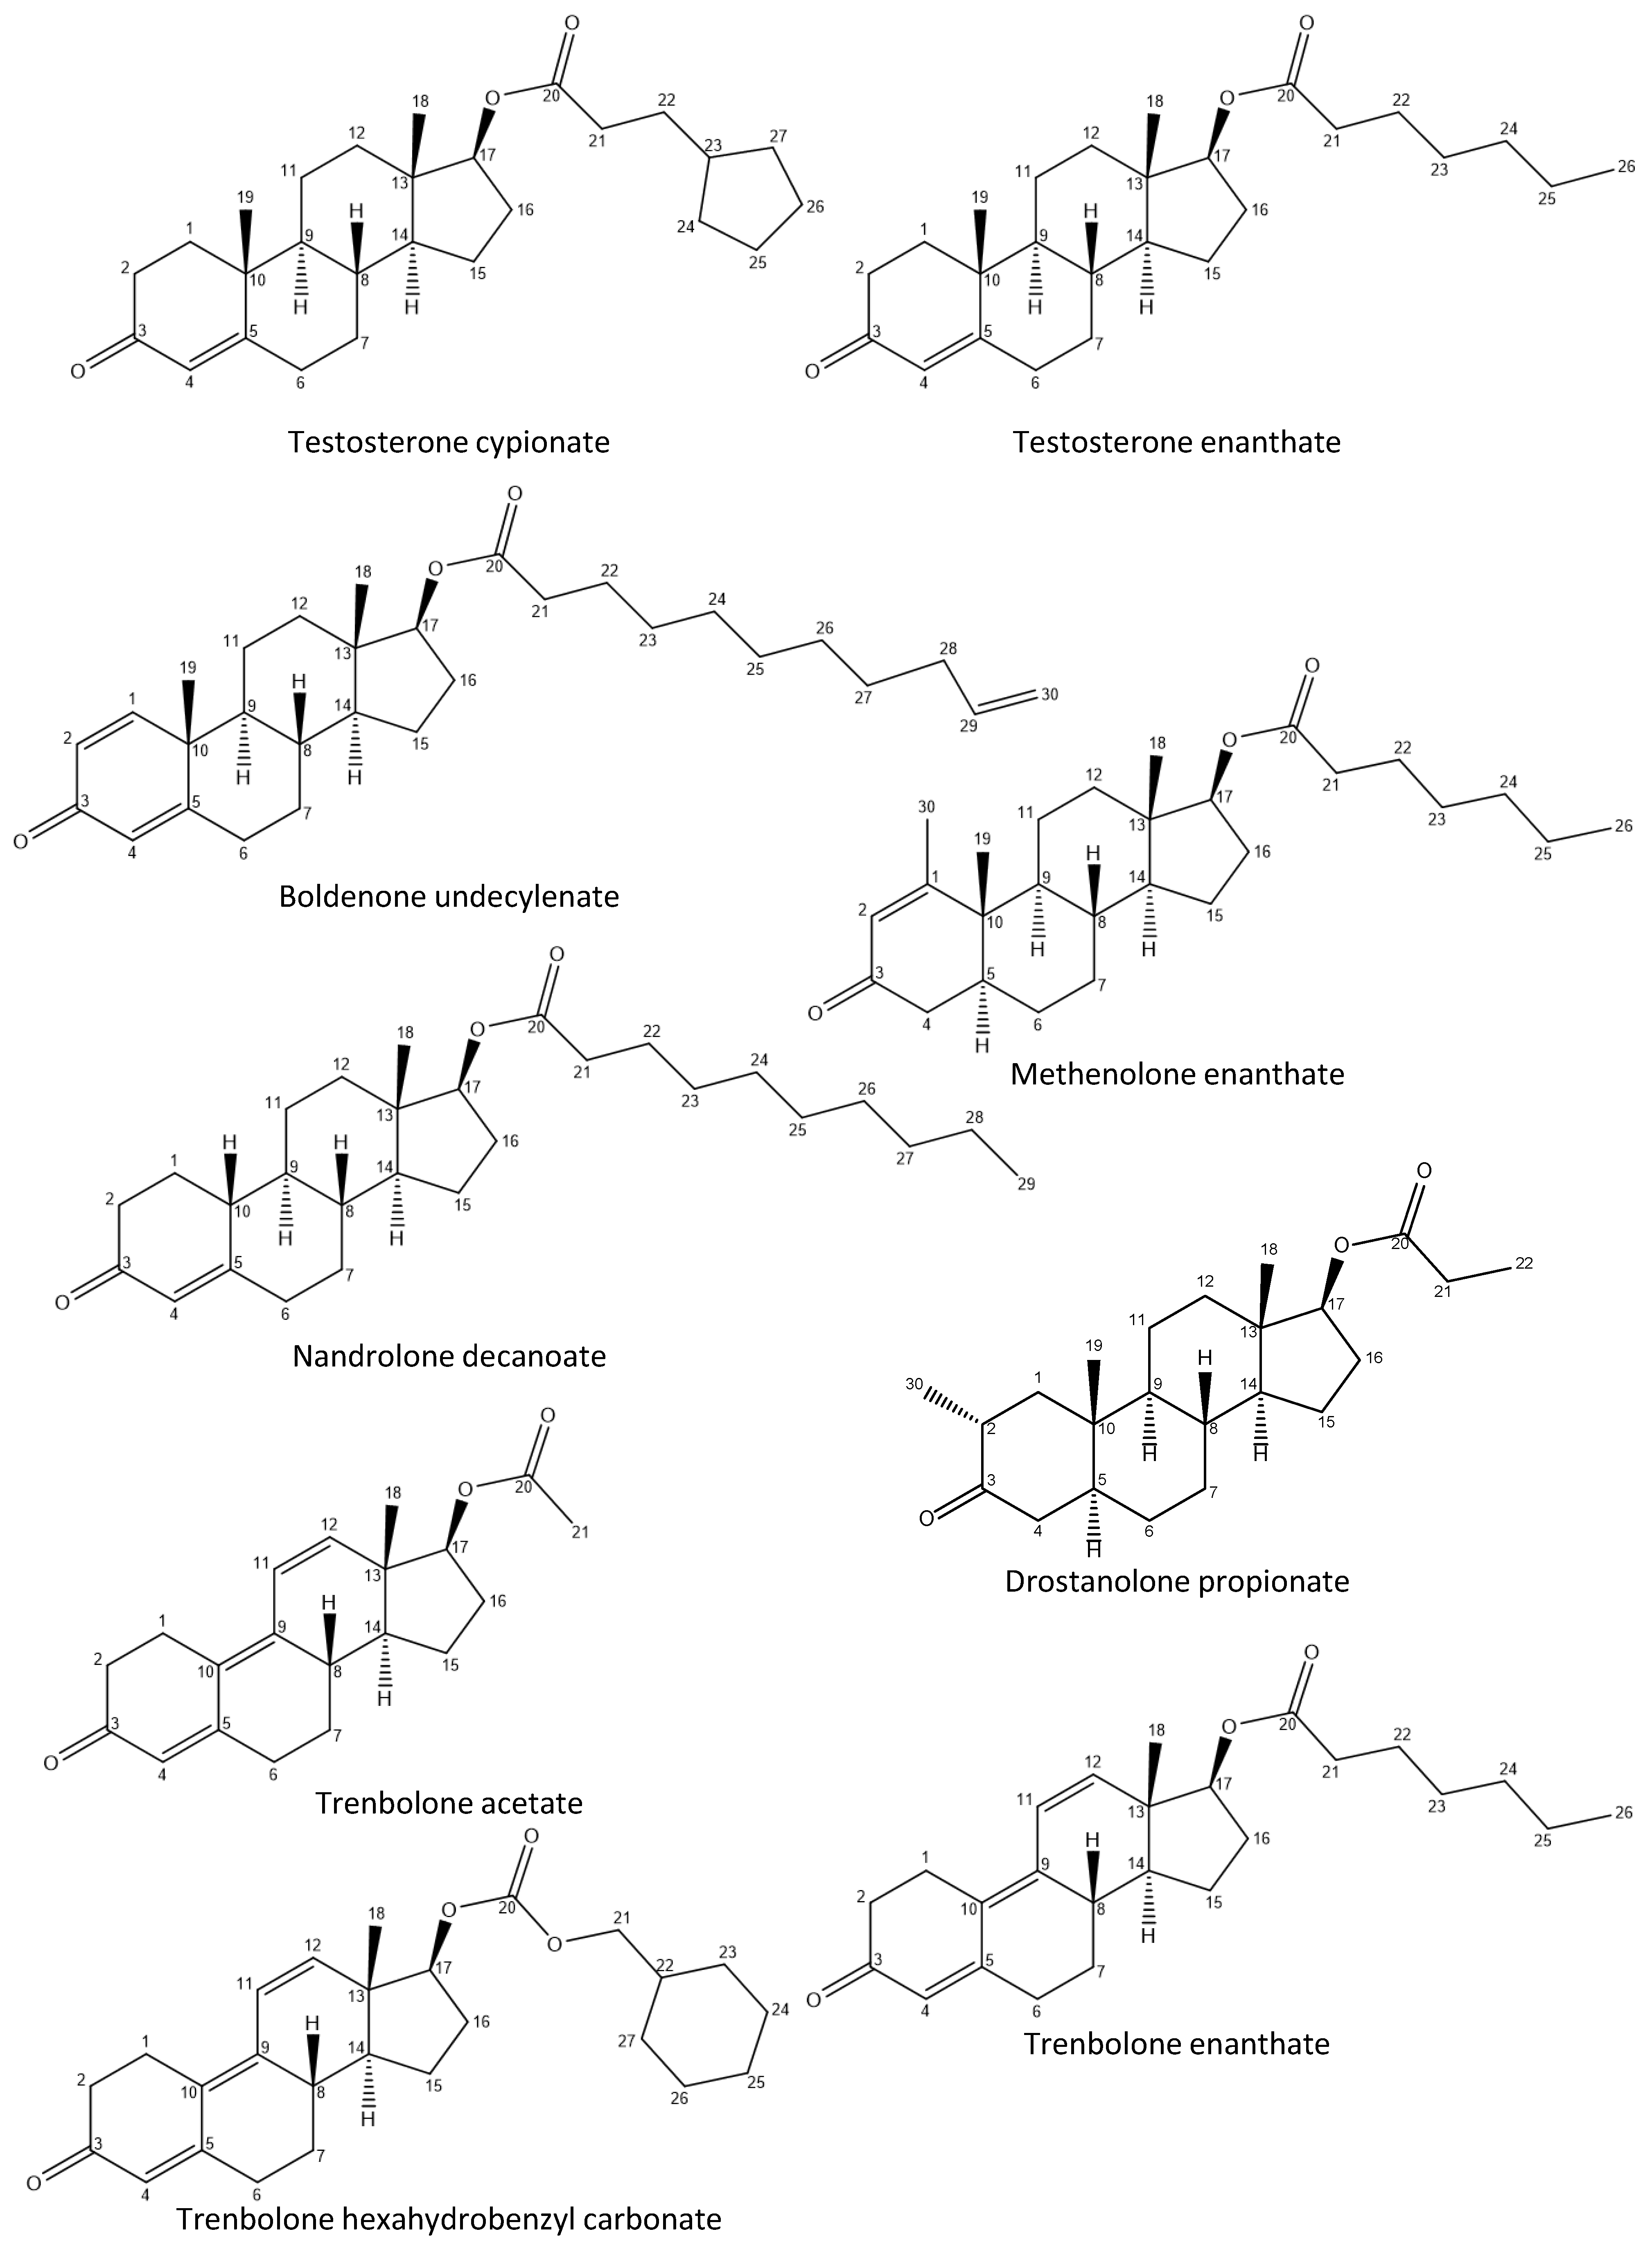
| 15 | injectable | Boldenone undecylenate | Boldenone undecylenate |
| 16 | injectable | Boldenone undecylenate | Boldenone undecylenate |
| 17 | injectable | Methenolone enanthate | Methenolone enanthate |
| 18 | injectable | Testosterone cypionate | Testosterone cypionate |
| 19 | injectable | Testosterone propionate | Testosterone propionate |
| 20 | injectable | Trenbolone enanthate | Trenbolone enanthate |
| Active Compound | Detected in Sample | Signal(s) Used for Quantification | |
|---|---|---|---|
| δ (ppm), Multiplicity a, J (Hz), Number of Protons | Assignment b | ||
| Androst-4-ene-3,11,17-trione | 1 | 5.76 ppm, s, 1H | H4 |
| Methandienone | 2, 6, 13 | 7.31, d (10.0), 1H | H1 |
| 6.21, dd (10.0, 1.9), 1H | H2 | ||
| 6.06 apt (1.9), 1H | H4 | ||
| Epistane | 3 | 3.11, m, 1H | H4/H6 |
| Stanozolol | 4, 7, 11, 12, 14 | 7.24, s, 1H | H5 |
| 0.73, s, 3H | H24 | ||
| Methyl-1-testosterone | 5 | 7.31, d (10.2), 1H | H1 |
| 5.83 dd (10.2, 0.7), 1H | H2 | ||
| Testosterone decanoate | 7 | 5.70, s, 1H | H4 |
| Oxandrolone | 8 | AB system, 4.26 (part A) and 4.01 | |
| (part B) (10.7), 2H | H3 | ||
| 1.83, s, 3H | H18 | ||
| Methyltestosterone | 9 | 5.71, s, 3H | H4 |
| Mesterolone | 10 | 2.79, dd (14.7, 6.0), 1H | H2 |
| Boldenone undecylenate | 15, 16 | 6.20, dd (10.1, 1.9), 1H | H2 |
| 6.05, apt (1.5), 1H | H4 | ||
| Methenolone enanthate | 17 | 5.71, s, 1H | H2 |
| Testosterone cypionate | 18 | 5.70, s, 1H | H4 |
| Testosterone propionate | 19 | 5.72, s, 1H | H4 |
| Trenbolone enanthate | 20 | AB system, 6.55 (part A) and 6.40 | |
| (part B) (9.9), 2H | H11, H12 | ||
| 5.77, s, 1H | H4 | ||
| Oil-Based Injectable Samples | Claimed Active Compound | Claimed Content (mg/mL) | Detected Active Compound (Testosterone Esters) | Amount mg/mL (% Found/Claimed) |
|---|---|---|---|---|
| OI-1 | Trenbolone acetate | 120 | propionate | 56 ± 1 |
| OI-2 | Testosterone enanthate | 150 | enanthate cypionate | 25 ± 1 (17%) 25 ± 1 (17%) |
| Testosterone cypionate | 150 | |||
| Nandrolone decanoate | 150 | |||
| OI-3 | Boldenone undecylenate | 250 | cypionate | 65 ± 2 |
| propionate | 42 ± 3 | |||
| OI-4 | Testosterone cypionate | 300 | cypionate | 61 ± 3 (20%) |
| propionate | 41 ± 2 | |||
| OI-5 | Nandrolone decanoate | 300 | Enanthate | 58 ± 2 |
| cypionate | 50 ± 2 | |||
| OI-6 | Methenolone | 120 | cypionate | 69 ± 4 |
| propionate | 41 ± 2 | |||
| OI-7 | Testosterone propionate | 120 | propionate | 41 ± 2 (34%) |
| cypionate | 62 ± 3 | |||
| OI-8 | Testosterone propionate | 100 | propionate | 49 ± 1 (49%) |
| Trenbolone acetate | 100 | |||
| Drostanolone propionate | 100 | |||
| OI-9 | Testosterone propionate | 60 | propionate cypionate | 44 ± 2 (73%) 71 ± 1 (59%) |
| Testosterone enanthate | 120 | |||
| Testosterone cypionate | 120 | |||
| OI-10 | Testosterone enanthate | 300 | cypionate | 69 ± 4 |
| propionate | 47 ± 3 | |||
| OI-11 | Testosterone enanthate | 75 | propionate | 34 ± 2 |
| Trenbolone acetate | 75 | |||
| Trenbolone hexahydrobenzyl carbonate | 75 | |||
| OI-12 | Testosterone enanthate | 75 | propionate | 48 ± 1 |
| Trenbolone acetate | 75 | |||
| Trenbolone hexahydrobenzyl carbonate | 75 |
Disclaimer/Publisher’s Note: The statements, opinions and data contained in all publications are solely those of the individual author(s) and contributor(s) and not of MDPI and/or the editor(s). MDPI and/or the editor(s) disclaim responsibility for any injury to people or property resulting from any ideas, methods, instructions or products referred to in the content. |
© 2025 by the authors. Licensee MDPI, Basel, Switzerland. This article is an open access article distributed under the terms and conditions of the Creative Commons Attribution (CC BY) license (https://creativecommons.org/licenses/by/4.0/).
Share and Cite
Balayssac, S.; Assemat, G.; Danoun, S.; Malet-Martino, M.; Gilard, V. Quantitative 1H and 13C NMR and Chemometric Assessment of 13C NMR Data: Application to Anabolic Steroid Formulations. Molecules 2025, 30, 2060. https://doi.org/10.3390/molecules30092060
Balayssac S, Assemat G, Danoun S, Malet-Martino M, Gilard V. Quantitative 1H and 13C NMR and Chemometric Assessment of 13C NMR Data: Application to Anabolic Steroid Formulations. Molecules. 2025; 30(9):2060. https://doi.org/10.3390/molecules30092060
Chicago/Turabian StyleBalayssac, Stéphane, Gaëtan Assemat, Saïda Danoun, Myriam Malet-Martino, and Véronique Gilard. 2025. "Quantitative 1H and 13C NMR and Chemometric Assessment of 13C NMR Data: Application to Anabolic Steroid Formulations" Molecules 30, no. 9: 2060. https://doi.org/10.3390/molecules30092060
APA StyleBalayssac, S., Assemat, G., Danoun, S., Malet-Martino, M., & Gilard, V. (2025). Quantitative 1H and 13C NMR and Chemometric Assessment of 13C NMR Data: Application to Anabolic Steroid Formulations. Molecules, 30(9), 2060. https://doi.org/10.3390/molecules30092060