

Challenges in the Measurement of the Volume of Phases for HPLC Columns


Abstract
1. Introduction
2. Column Physical Volume
3. Volume of the Mobile Phase Within a Loaded HPLC Column
4. Volume of the Active Stationary Phase Within the HPLC Column
5. Phase Ratio for an HPLC Column
5.1. Reversed-Phase Mechanism
- (a)
- packed columns are characterized by higher log Φ values than monolithic columns;
- (b)
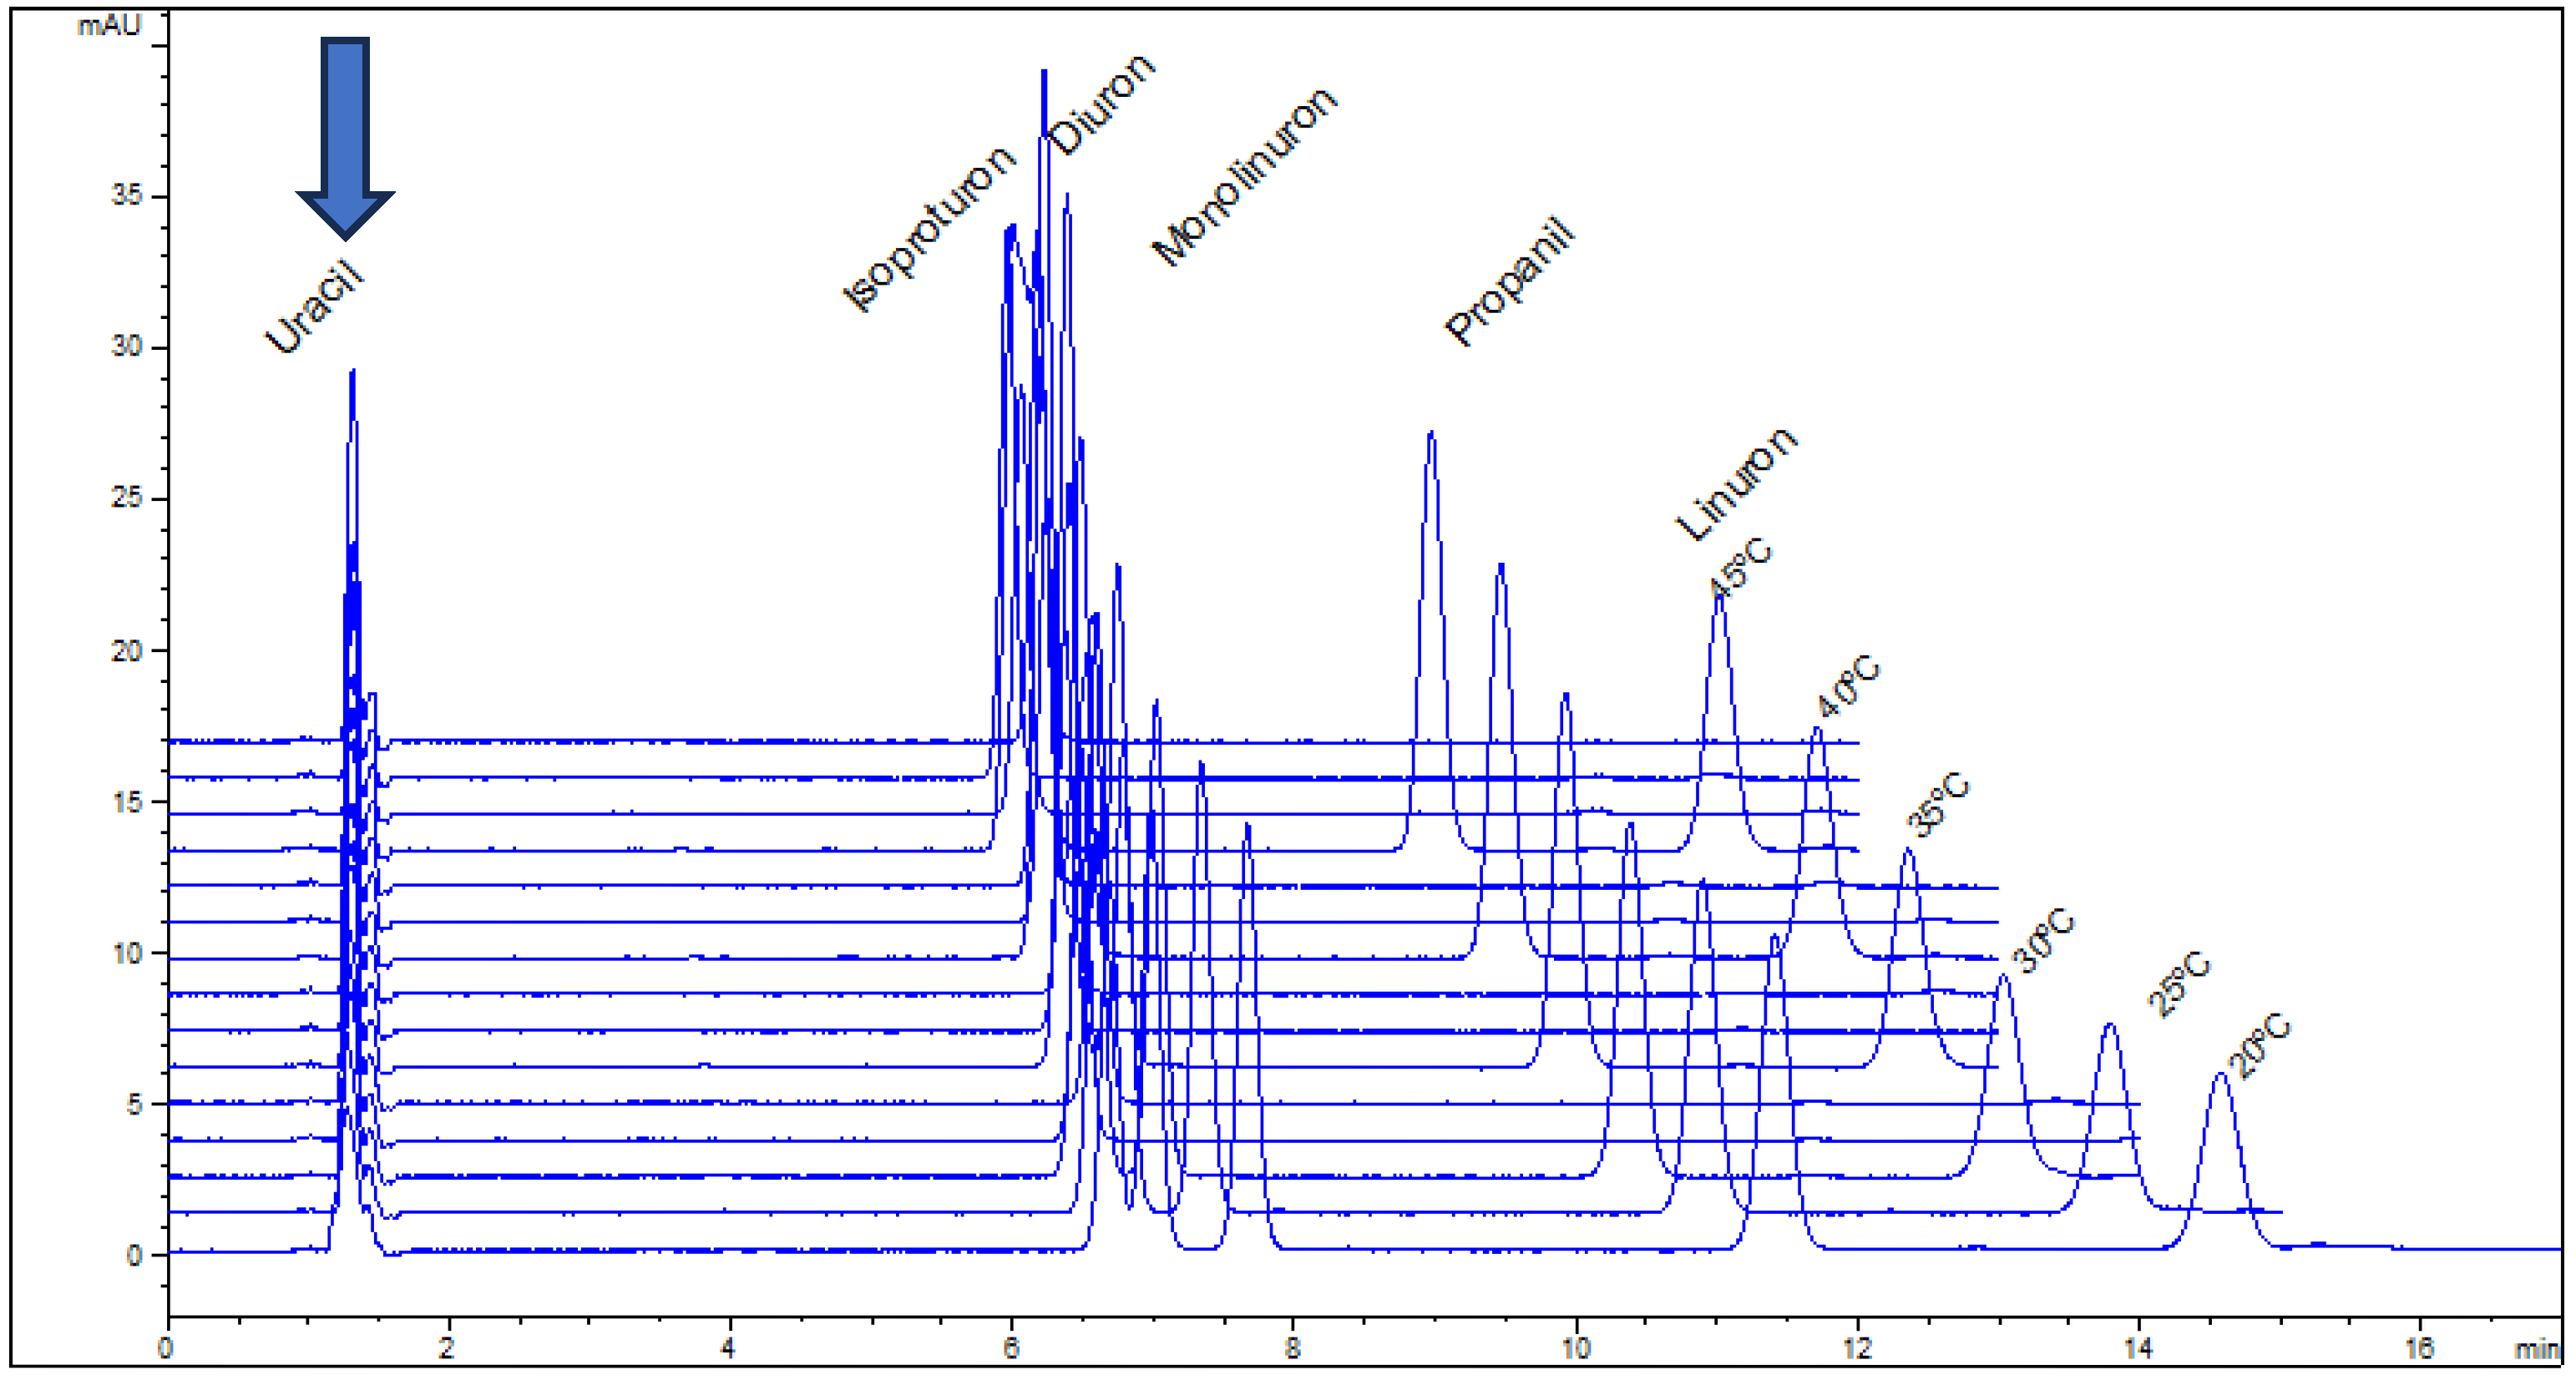
- the nature of the organic component in the mobile phase has influence on log Φ; the three most used organic modifiers are in the following order of values of the phase ratio: acetonitrile > ethanol > methanol (example for Luna C18 column). This suggests that the organic component of the mobile phase plays a role in the retention process;
- (c)
- log Φ is influenced by the pair of probe hydrocarbons, as if different solutes “see” different volumes of stationary phase. The pair of propylbenzene/butylbenzenes produce higher values of phase rationing than ethylbenzene/propylbenzene and then toluene/ethylbenzene;
- (d)
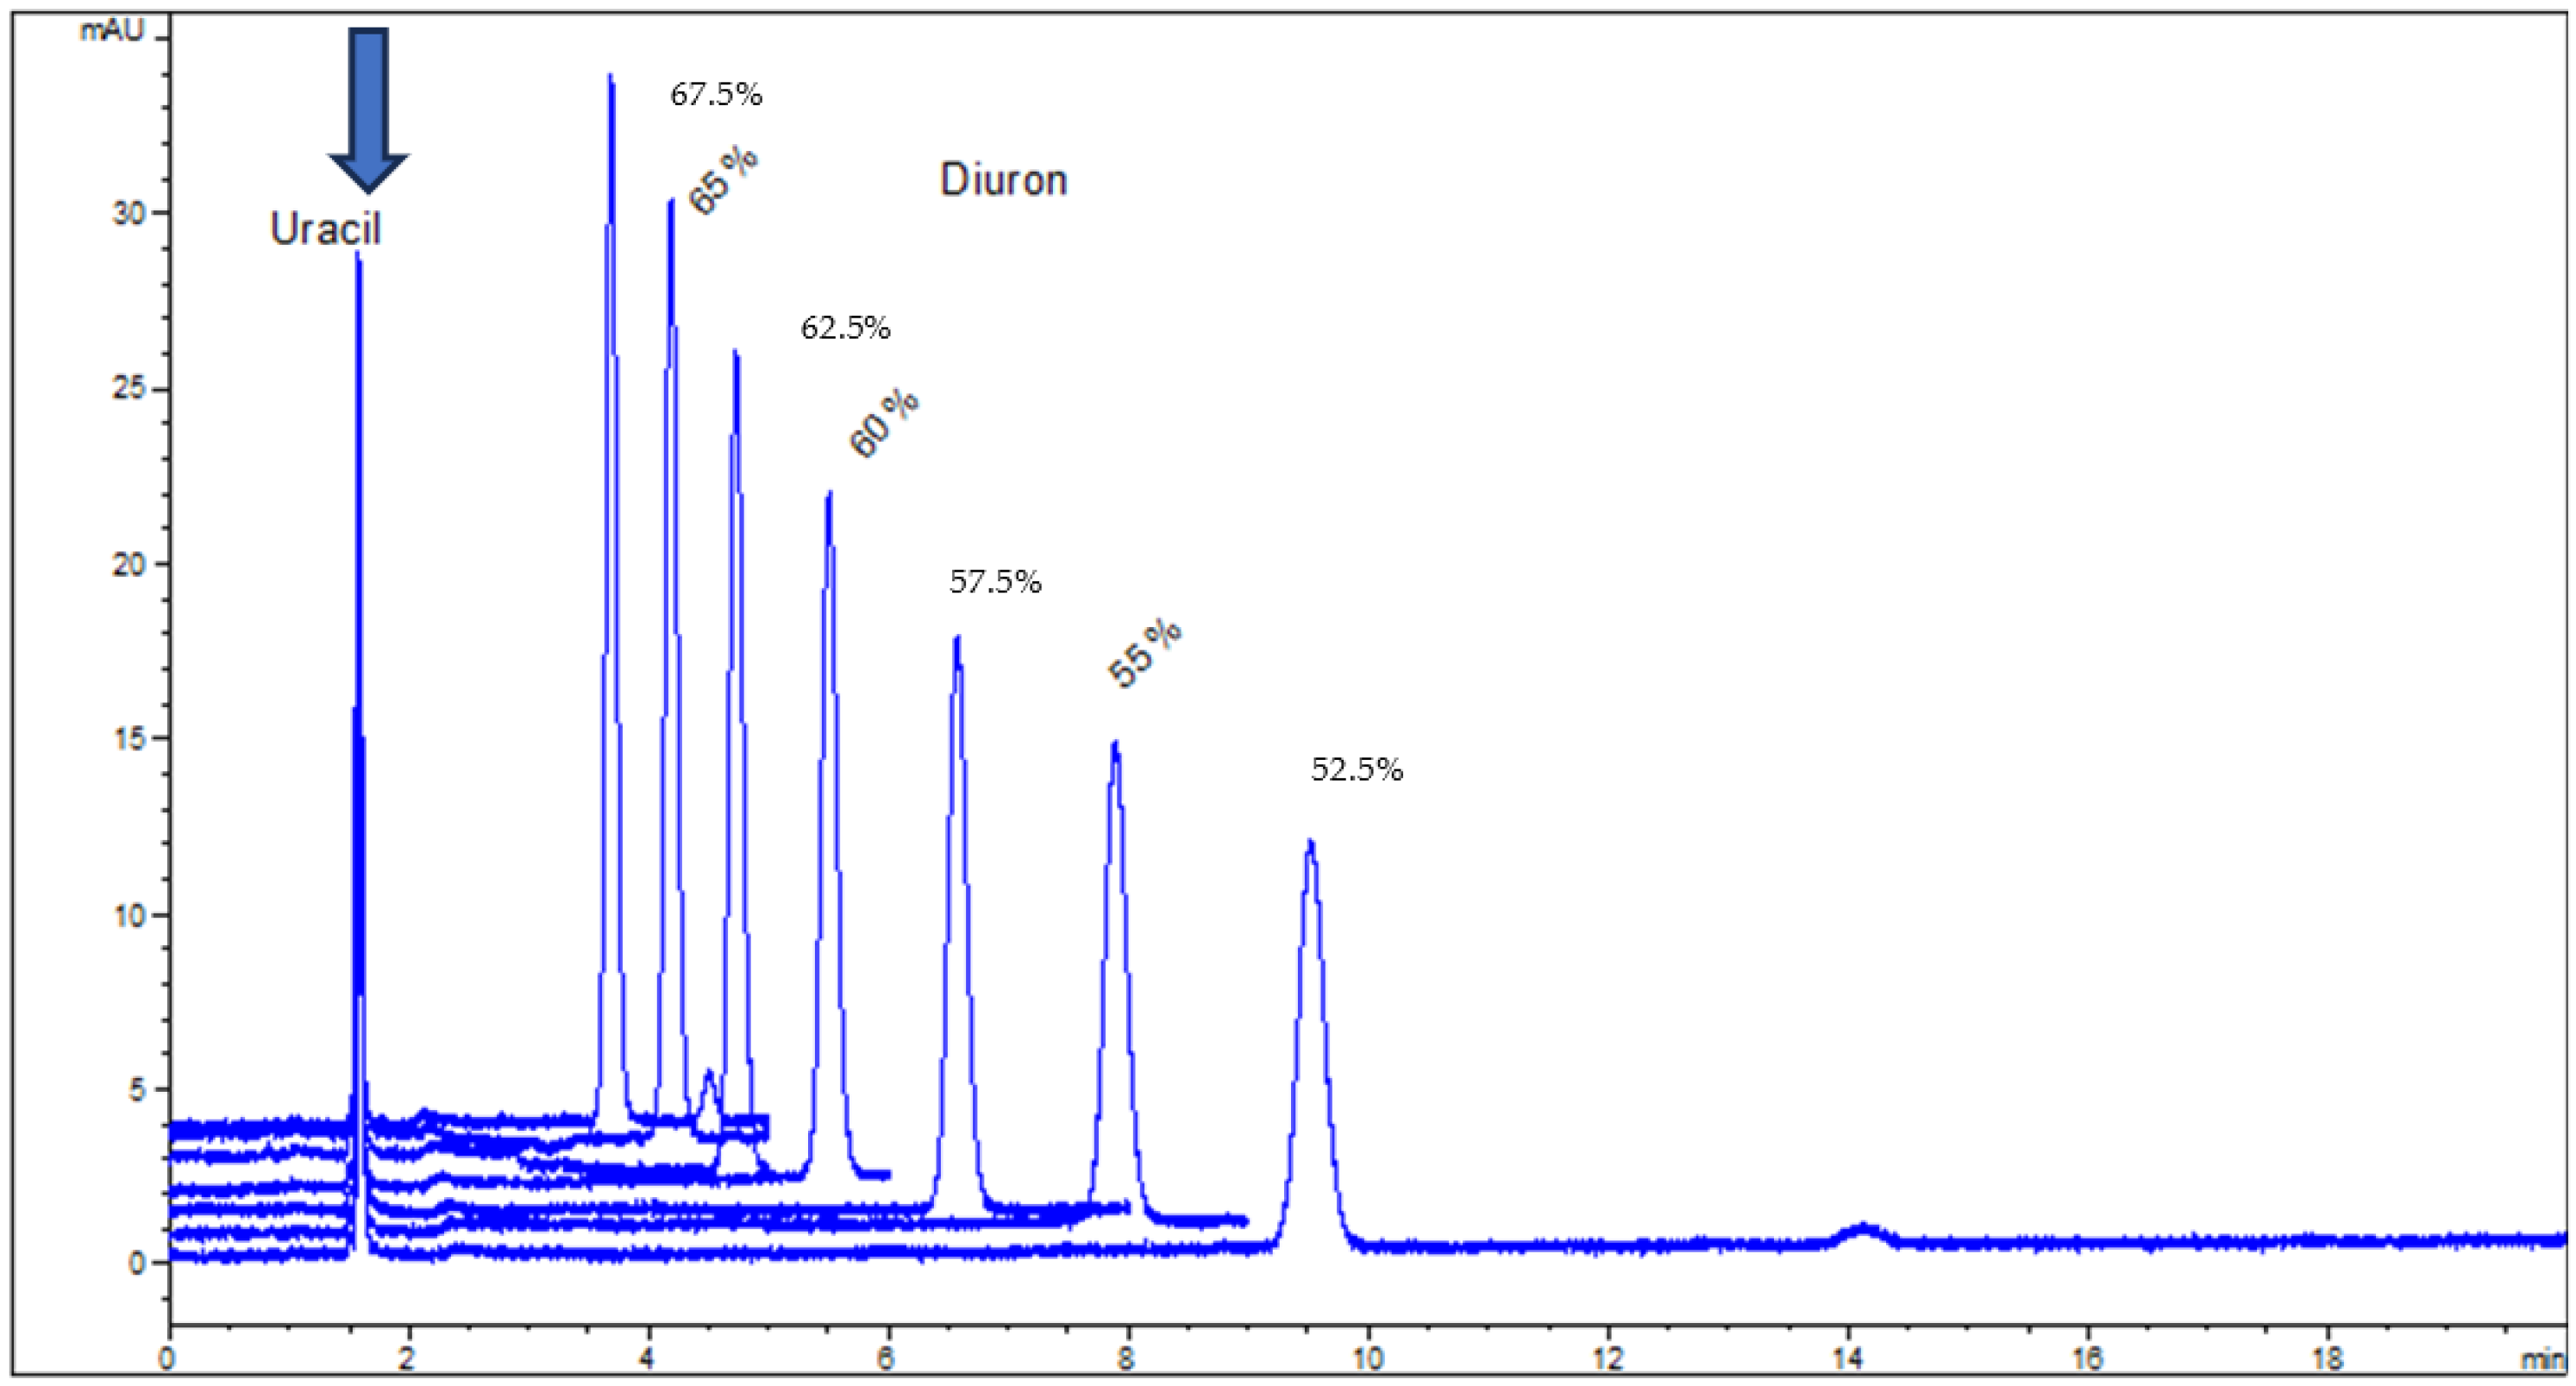
- the phase ratio is influenced by the mobile phase composition; for both organic modifiers, methanol and acetonitrile, log Φ appears to have a maximum value, situated between 40 and 60% organic component (v/v);
- (e)
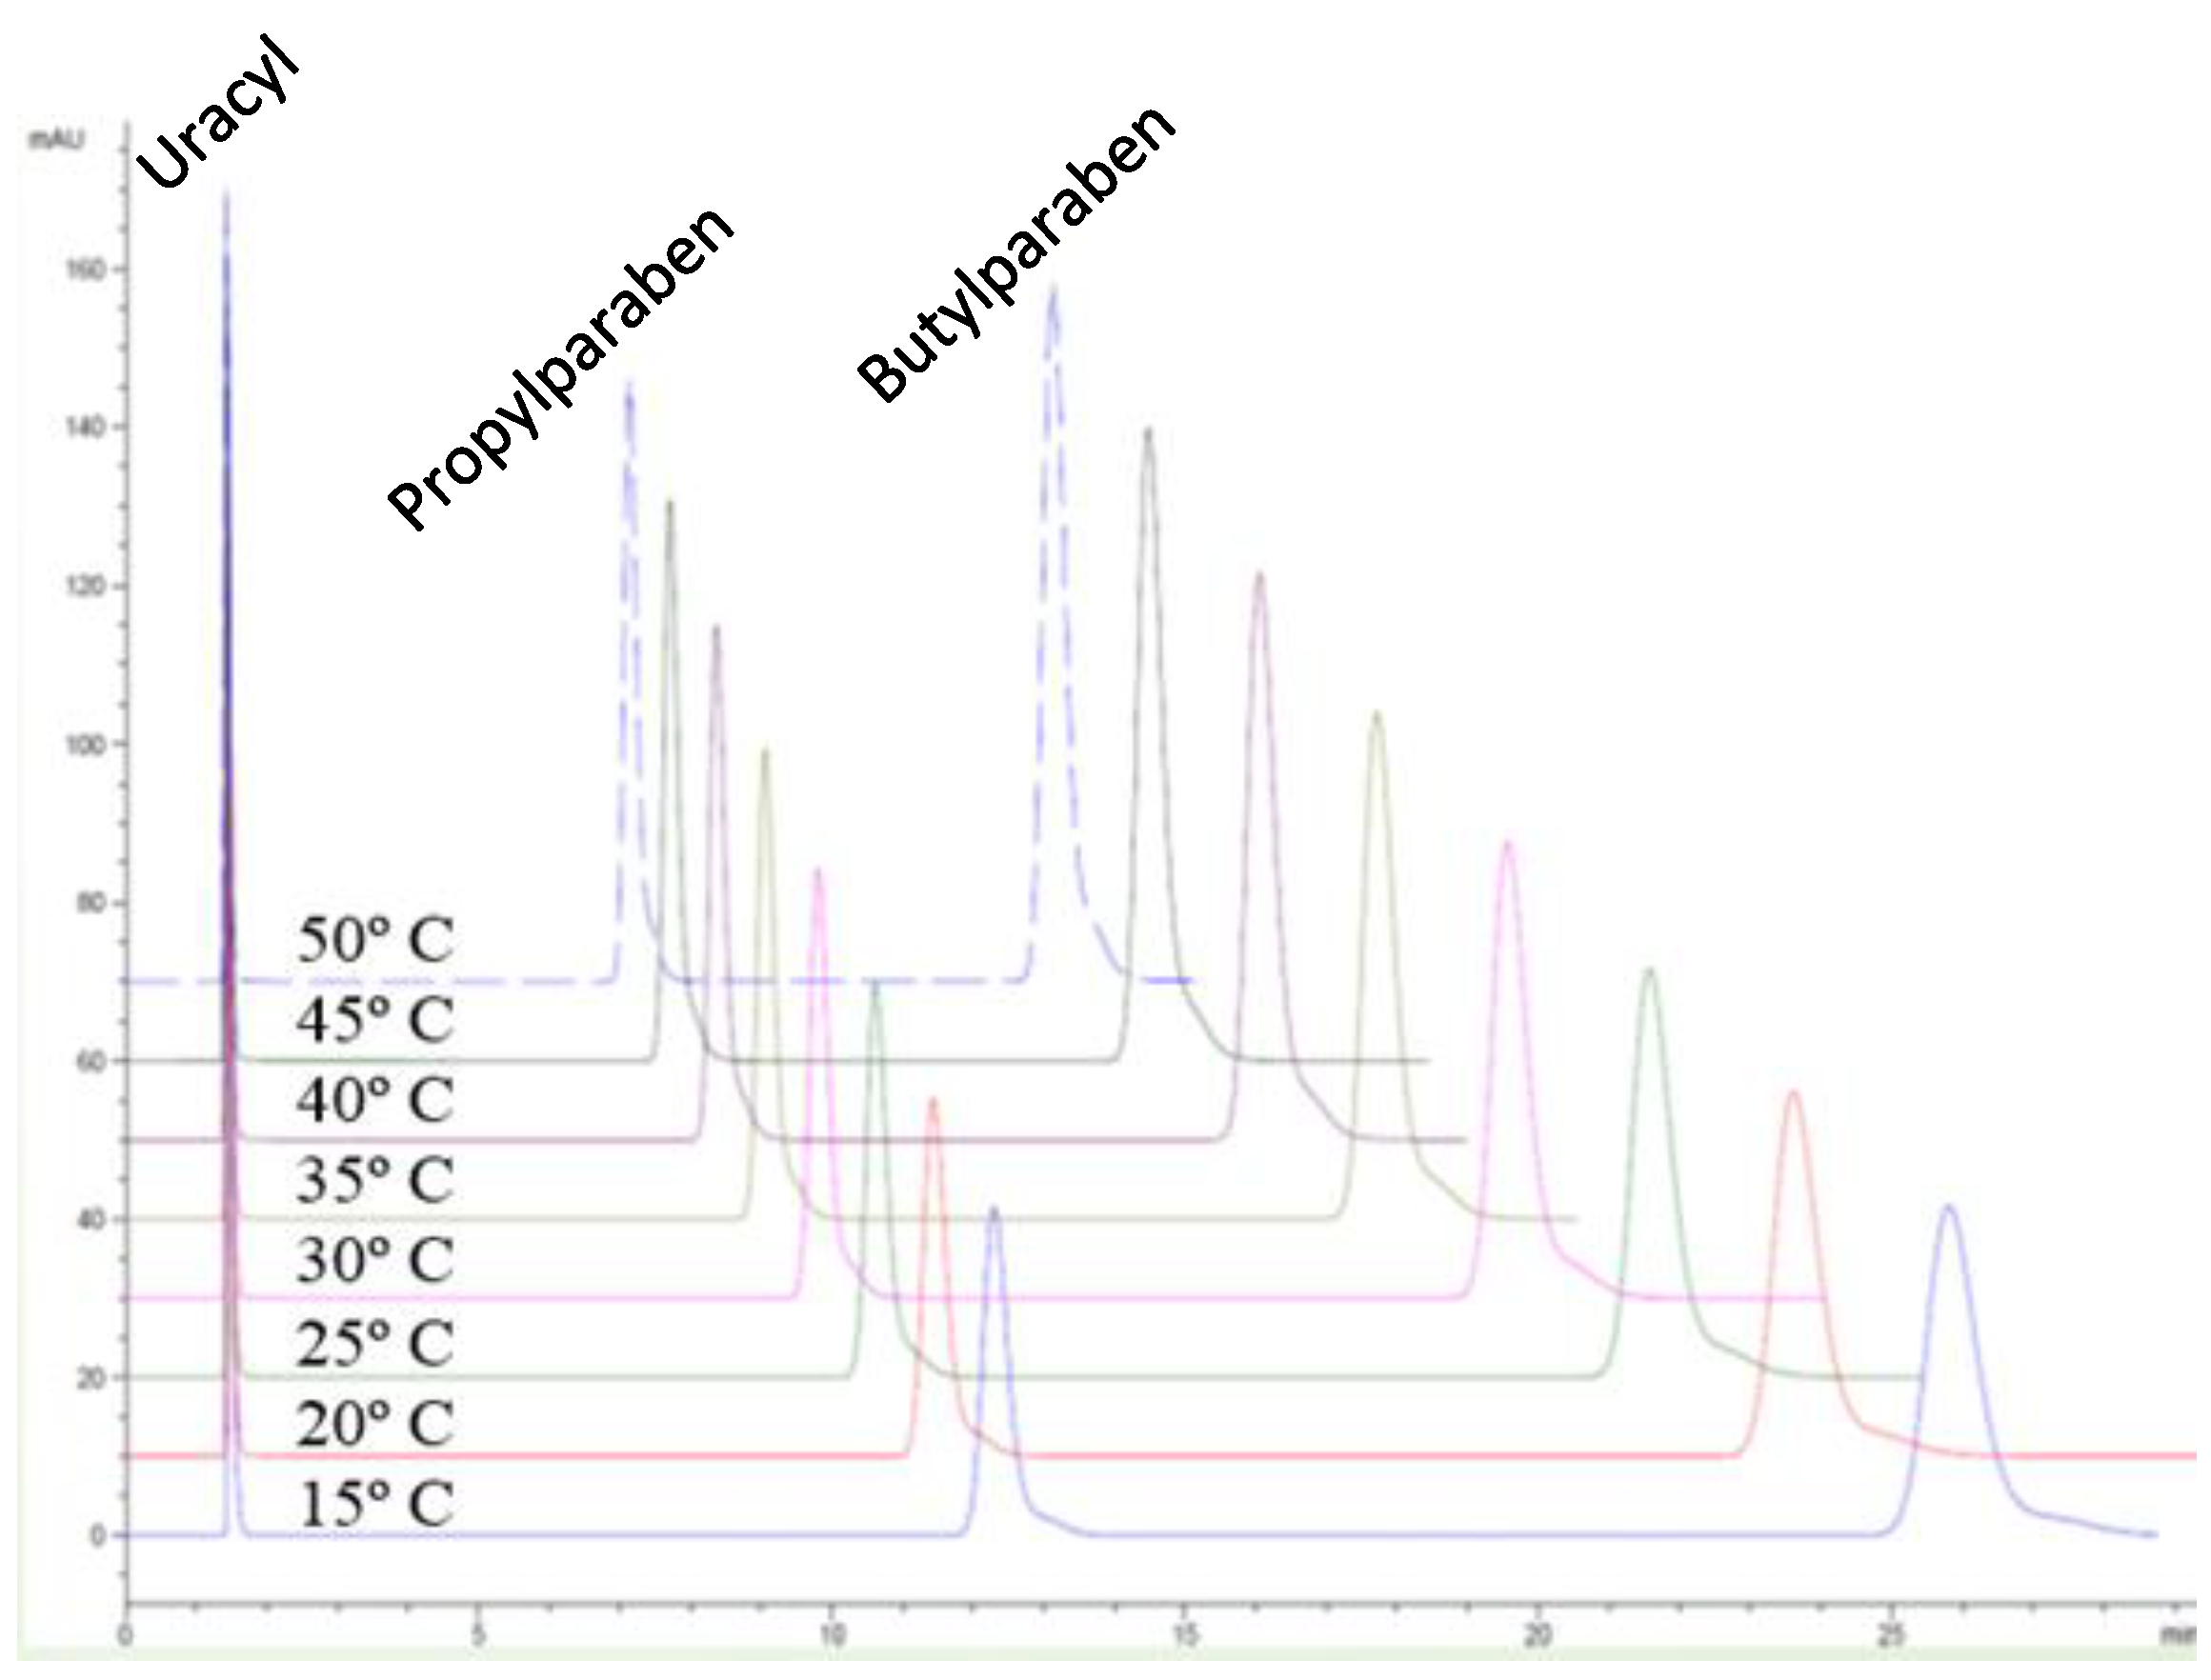
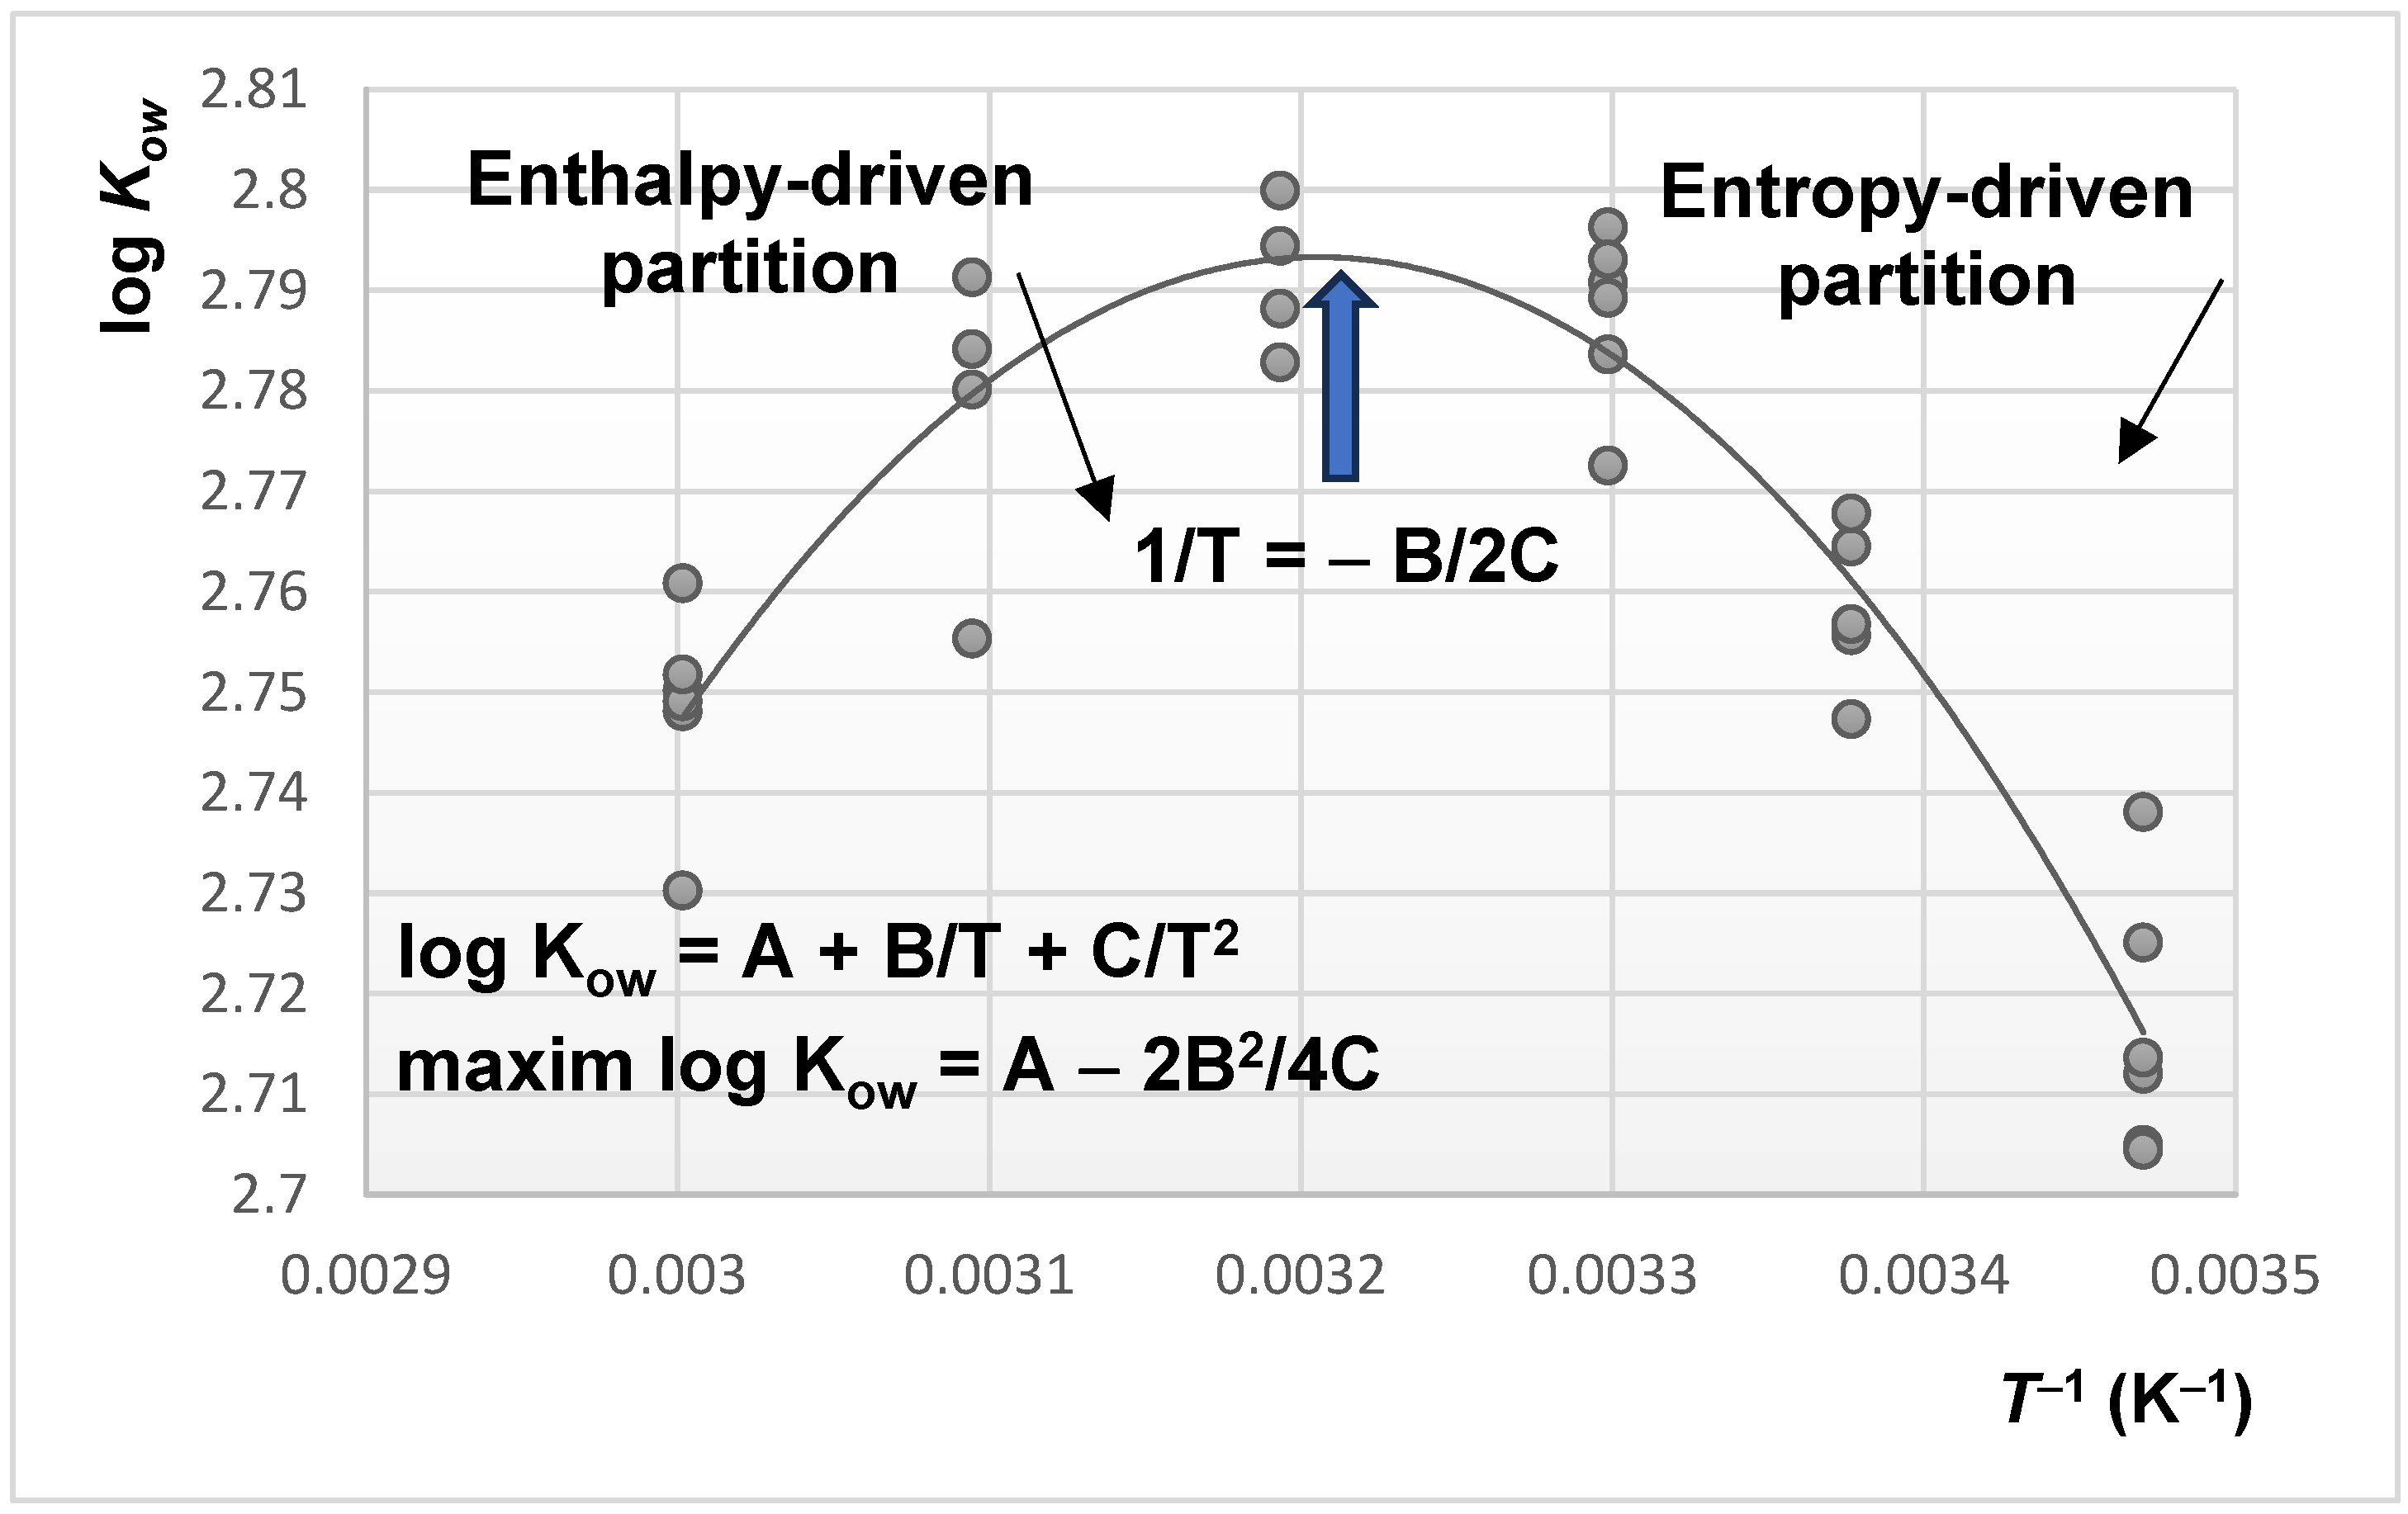
- the phase ratio is temperature-dependent, as discussed further in this review.
5.2. HILIC Mechanism
5.3. Other Mechanisms
6. Theoretical Implications of Phase Ratio Evaluation
7. Final Remarks and Conclusions
Funding
Informed Consent Statement
Data Availability Statement
Conflicts of Interest
Abbreviations
| α(CH2) | Methylene selectivity |
| ΔG0 | Variation of standard free enthalpy (or Gibbs free energy) |
| ΔH0 | Variation of standard enthalpy |
| HILIC | Hydrophilic interaction liquid chromatography |
| HPLC | High-performance liquid chromatography |
| k | Retention factor |
| KD | Partition constant of solute between mobile and stationary phase |
| log Kow | Logarithm of octanol–water partition constant |
| LC | Liquid chromatography |
| Mw | Molecular mass |
| NP-LC | Normal-phase liquid chromatography |
| NMR | Nuclear magnetic resonance |
| RP-LC | Reversed-phase liquid chromatography |
| ΔS0 | Variation of standard entropy |
| t0 | Dead time of an HPLC separation |
| T | Absolute temperature of column (in K) |
| Vcolumn | Geometrical volume of an HPLC column |
| Vm | Volume of mobile phase |
| Vm,ads | Volume of adsorbed mobile phase on stationary phase |
| Vs | Volume of stationary phase |
| Vs,active | Volume of active functionalities from stationary phase |
| Vs,support | Volume of inert support from stationary phase |
| Φ | Phase ratio of a column |
References
- Moldoveanu, S.; David, V. Essential in Modern HPLC Separations, 2nd ed.; Elsevier: Amsterdam, The Netherlands, 2022; pp. 63–105. [Google Scholar] [CrossRef]
- Nikitas, P.; Pappa-Louisi, A.; Agrafiotou, P. Effect of the organic modifier concentration on the retention in reversed-phase liquid chromatography. I. General semi-thermodynamic treatment for adsorption and partition mechanisms. J. Chromatogr. A 2002, 946, 9–32. [Google Scholar] [CrossRef] [PubMed]
- Asnin, L.D.; Stepanova, M.V. On physical meaning of van’t Hoff equation and its applicability in chromatography. J. Chromatogr. A 2024, 1733, 465250. [Google Scholar] [CrossRef] [PubMed]
- Wells, M.J.M.; Clark, C.R. Liquid chromatographic elution characteristics of some solutes used to measure column void volume on C18 bonded phases. Anal. Chem. 1981, 53, 1341–1345. [Google Scholar] [CrossRef]
- Lecacheux, D.; Lesec, J. Measurement of the dead volume between concurrent detectors in gel permeation chromatography. J. Liq. Chromatogr. 1982, 5, 2227–2239. [Google Scholar] [CrossRef]
- Gritti, F. Perspective on the future approaches to predict retention in liquid chromatography. Anal. Chem. 2021, 93, 5653–5664. [Google Scholar] [CrossRef]
- Kumar, V.; Khanal, O.; Jin, M. Modeling the impact of holdup volume from chromatographic workstations on ion-exchange chromatography. Ind. Eng. Chem. Res. 2022, 61, 10195–10204. [Google Scholar] [CrossRef]
- Available online: https://www.silicycle.com/faq/analytical-and-preparative-chromatography/hplc/what-is-the-difference-between-dead-volume-and-dwell-volume (accessed on 20 March 2025).
- Alhedai, A.; Martire, D.E.; Scot, P.W. Column “dead volume” in liquid chromatography. Analyst 1989, 114, 869–875. [Google Scholar] [CrossRef]
- Yun, K.S.; Zhu, C.; Parcher, J.F. Theoretical relationships between the void volume, mobile phase volume, retention volume, adsorption, and Gibbs free energy in chromatographic processes. Anal. Chem. 1995, 67, 613–619. [Google Scholar] [CrossRef]
- Smith, R.; Nieass, C.; Wainwright, M. A review of methods for the determination of hold-up volume in modern liquid chromatography. J. Liq. Chromatogr. 1986, 9, 1387–1430. [Google Scholar] [CrossRef]
- Poole, C.F. Chapter: The Column in Liquid Chromatography. In The Essence of Chromatography; Elsevier: Amsterdam, The Netherlands, 2003; pp. 267–413. [Google Scholar]
- Vailaya, A.; Horwath, C. Retention in reversed-phase chromatography: Partition or adsorption? J. Chromatogr. A 1998, 829, 1–27. [Google Scholar] [CrossRef]
- Poole, C.F.; Atapattu, S.N. Determination of physicochemical properties of small molecules by reversed-phase liquid chromatography. J. Chromatogr. A 2020, 1626, 461427. [Google Scholar] [CrossRef] [PubMed]
- Chester, T.L.; Coym, J.W. Effect of phase ratio on van’t Hoff analysis in reversed-phase liquid chromatography, and phase ratio independent estimation of transfer enthalpy. J. Chromatogr. A 2003, 1003, 101–111. [Google Scholar] [CrossRef] [PubMed]
- Moldoveanu, S.C.; Caiali, E.; David, V. Phase ratio and equilibrium constant in RP-HPLC obtained from octanol/water partition constant through solvophobic theory. Chromatographia 2017, 80, 1491–1500. [Google Scholar] [CrossRef]
- Miyabe, K.; Guiochon, G. Measurement of the parameters of the mass transfer kinetics in high performance liquid chromatography. J. Sep. Sci. 2003, 26, 155–173. [Google Scholar] [CrossRef]
- Zuvela, P.; Skoczylas, M.; Liu, J.J.; Baczek, T.; Wong, M.W.; Buszewski, B. Column characterization and selection systems in reversed-phase high-performance liquid chromatography. Chem. Rev. 2019, 119, 3674–3729. [Google Scholar] [CrossRef]
- Guan, H.; Guiochon, G. Study of physico-chemical properties of some packing materials: I. Measurements of the external porosity of packed columns by inverse size-exclusion chromatography. J. Chromatogr. A 1996, 731, 27–40. [Google Scholar] [CrossRef]
- Wang, M.; Mallette, J.; Parcher, J.F. Comparison of void volume mobile phase volume accessible volume determined from retention data for oligomers in reversed-phase liquid chromatographic systems. J. Chromatogr A 2011, 1218, 2995–3001. [Google Scholar] [CrossRef]
- Dinh, N.P.; Jonsson, T.; Irgum, K. Water uptake on polar stationary phases under conditions for hydrophilic interaction chromatography and its relation to solute retention. J. Chromatogr. A 2013, 1320, 33–47. [Google Scholar] [CrossRef]
- Krstulovic, A.M.; Colin, H.; Guiochon, G. Comparison of methods used for the determination of void volume in reversed-phase liquid chromatography. Anal. Chem. 1982, 54, 2438–2443. [Google Scholar] [CrossRef]
- Rimmer, C.A.; Simmons, C.R.; Dorsey, J.G. The measurement and meaning of void volumes in reversed-phase liquid chromatography. J. Chromatogr. A 2002, 965, 219–232. [Google Scholar] [CrossRef]
- Melander, W.R.; Erard, J.F.; Horvath, C. Movement of components in reversed-phase chromatography: I. Mobile phase space with multi-component eluents. J. Chromatogr. A 1983, 282, 211–228. [Google Scholar] [CrossRef]
- Djerki, R.A.; Laub, R.J. Solute retention in column liquid chromatography: IX. Comparison of methods of determination of the void volume in liquid-liquid chromatography. J. Liq. Chromatogr. 1987, 10, 1749–1767. [Google Scholar] [CrossRef]
- Gritti, F.; Kazakevich, Y.; Guiochon, G. Measurement of hold-up volumes in reverse-phase liquid chromatography: Definition and comparison between static and dynamic methods. J. Chromatogr. A 2007, 1161, 157–169. [Google Scholar] [CrossRef] [PubMed]
- Knox, J.H.; Kaliszan, R. Theory of solvent disturbance peaks and experimental determination of thermodynamic dead-volume in column liquid chromatography. J. Chromatogr. A 1985, 349, 211–234. [Google Scholar] [CrossRef]
- Kazakevich, Y.V.; McNair, H.M. Thermodynamic definition of HPLC dead volume. J. Chromatogr. Sci. 1993, 31, 317–322. [Google Scholar] [CrossRef]
- Patrushev, Y.; Sotnikova, Y.; Sidelnikov, V. Dead volume determination of the HPLC monolithic rod columns with organic sorbents. J. Liq. Chromatogr. Rel. Technol. 2019, 42, 575–581. [Google Scholar] [CrossRef]
- Jiang, P.; Wu, D.; Lucy, C.A. Determination of void volume in normal phase liquid chromatography. J. Chromatogr. A 2013, 1324, 63–70. [Google Scholar] [CrossRef]
- Greco, G.; Letzel, T. Main interactions and influences of the chromatographic parameters in HILIC separations. J. Chromatogr. Sci. 2013, 51, 684–693. [Google Scholar] [CrossRef]
- Vailaya, A. Fundamentals of reversed phase chromatography: Thermodynamic and exothermodynamic treatment. J. Liq. Chromatogr. Rel. Technolog. 2005, 28, 965–1054. [Google Scholar] [CrossRef]
- Berendsen, G.E.; Schoenmakers, P.J.; de Galan, L.; Vigh, G.; Varga-Puchony, Z.; Inczedy, J. On the determination of the hold-up time in reversed phase liquid chromatography. J. Liq. Chromatogr. 1980, 3, 1669–1686. [Google Scholar] [CrossRef]
- Sander, L.C.; Wise, S.A. Recent advances in bonded phases for liquid chromatography. CRC Crit. Rev. Anal. Chem. 1987, 18, 299–417. [Google Scholar] [CrossRef]
- van der Houwen, O.A.G.J.; van der Linden, J.A.A.; Indemans, A.W.M. Evaluation of the use of lithium nitrate as a test substance for the determination of the hold-up time of a reversed-phase packing. J. Liq. Chromatogr. 1982, 5, 2321–2341. [Google Scholar] [CrossRef]
- Oumada, F.Z.; Roses, M.; Bosch, E. Inorganic salts as hold-up time markers in C18 columns. Talanta 2000, 53, 667–677. [Google Scholar] [CrossRef] [PubMed]
- McCormick, R.M.; Karger, B.L. Distribution phenomena of mobile-phase components and determination of dead volume in reversed-phase liquid chromatography. Anal. Chem. 1980, 52, 2249–2257. [Google Scholar] [CrossRef]
- Bidlingmeyer, B.A.; Warren, F.V.; Weston, A.; Nugent, C. Some practical considerations when determining the void volume in high-performance liquid chromatography. J. Chromatogr. Sci. 1991, 29, 275–279. [Google Scholar] [CrossRef]
- Mockel, H.J.; Freyholdt, T. Column dead-time for a bonded C18 phase with pure alcohols as eluents. Chromatographia 1983, 17, 215–220. [Google Scholar] [CrossRef]
- Gritti, F.; Smith, K. Harmonization of experimental methods used to measure the true hold-up volume of liquid chromatography columns. LCGC N. Am. 2023, 41, 28–33. [Google Scholar] [CrossRef]
- Nesterenko, P.N.; Kazakova, V.D. Tutorial on high-performance liquid chromatography of isotopologues of organic compounds. J. Chromatogr. Open 2025, 7, 100207. [Google Scholar] [CrossRef]
- Ribar, D.; Lukšič, M.; Kralj Cigić, I. Towards an accurate method for column void volume determination using liquid chromatography-mass spectrometry. J. Chromatogr. A 2023, 1706, 464245. [Google Scholar] [CrossRef]
- Engelhardt, H.; Müller, H.; Dreyer, B. Is there a “true” dead volume for HPLC columns? Chromatographia 1984, 19, 240–245. [Google Scholar] [CrossRef]
- Stanley, B.J.; Foster, C.R.; Guiochon, G. On the reproducibility of column performance in liquid chromatography and the role of the packing density. J. Chromatogr. A 1997, 761, 41–51. [Google Scholar] [CrossRef]
- Didaoui, L.; Touabet, A.; Ahmed, A.Y.B.H.; Meklati, B.Y.; Engewald, W. Evaluation of dead time calculation in reversed-phase liquid chromatography using a multiparametric mathematical method. J. High Resolut. Chromatogr. 1999, 22, 559–564. [Google Scholar] [CrossRef]
- Miyabe, K.; Matsumoto, Y.; Ando, N.; Teratani, Y. Measurement of pore diffusivity in separation media for high performance liquid chromatography. Anal. Sci. 2013, 29, 315–323. [Google Scholar] [CrossRef] [PubMed]
- Petre, J.; Iancu, V.; David, V. Thermodynamic study of the liquid chromatography retention process for some pesticides on C8 and C18 silica-based stationary phases. Rev. Roum. Chim. 2013, 58, 425–432. [Google Scholar]
- Abraham, M.H.; Ibrahim, A.; Zissimos, A.M. Determination of sets of solute descriptors from chromatographic measurements. J. Chromatogr. A 2004, 1037, 29–47. [Google Scholar] [CrossRef]
- Vitha, M.F.; Carr, P.W. The chemical interpretation and practice of linear solvation energy relationships in chromatography. J. Chromatogr. A 2006, 1126, 143–194. [Google Scholar] [CrossRef]
- Poole, C.F.; Atapattu, S.N.; Poole, S.K.; Bell, A.N. Determination of solute descriptors by chromatographic methods. Anal. Chim. Acta 2009, 652, 32–53. [Google Scholar] [CrossRef]
- Available online: http://www.chemaxon.com (accessed on 15 March 2025).
- Atapattu, S.N.; Johnson, K.R.D.; Poole, C.F. System maps for the retention of neutral compounds on an electrostatic-shielded reversed-phase column. Chromatographia 2019, 82, 799–808. [Google Scholar] [CrossRef]
- Subirats, X.; Justicia, A.; Rosés, M. Chasing the elusive hold-up time from an LFER approach. J. Chromatogr. A 2018, 1571, 176–184. [Google Scholar] [CrossRef]
- Guo, Y. Recent progress in the fundamental understanding of hydrophilic interaction chromatography (HILIC). Analyst 2015, 140, 6452–6466. [Google Scholar] [CrossRef]
- McCalley, D.V. Understanding and manipulating the separation in hydrophilic interaction liquid chromatography—A review. J. Chromatogr. A 2017, 1523, 49–71. [Google Scholar] [CrossRef] [PubMed]
- Tsopelas, F.; Ochsenkühn-Petropoulou, M.; Tsantili-Kakoulidou, A. Void volume markers in reversed-phase and biomimetic liquid chromatography. J. Chromatogr. A 2010, 1217, 2847–2854. [Google Scholar] [CrossRef] [PubMed]
- Krivoshein, A.V.; Hu, Z. Nonideal behavior of void volume markers in polar-organic chiral HPLC on polysaccharide-based chiral stationary phases. J. Liq. Chromatogr. Relat. Technol. 2021, 44, 476–483. [Google Scholar] [CrossRef]
- Schoenmakers, P.J.; Billiet, H.A.H.; de Galan, L. Description of solute retention over the full range of mobile phase compositions in reversed-phase liquid chromatography. J. Chromatogr. 1983, 282, 107–121. [Google Scholar] [CrossRef]
- Moldoveanu, S.C.; Bacalum, E.; Galaon, T.; David, V. Revisiting the dependence of retention factor on the content of organic component in the mobile phase in reversed-phase. J. Sep. Sci. 2023, 46, 2300274. [Google Scholar] [CrossRef]
- David, V.; Moldoveanu, S.C. Retention factor variation on wide range of mobile phase compositions in RP-HPLC; A short tutorial. J. Chromatogr. Open 2024, 6, 100176. [Google Scholar] [CrossRef]
- Wainwright, M.S.; Nieass, C.S.; Haken, J.K.; Chaplin, R.P. Use of retention plots of n-alkyl benzenes for determining dead times in liquid and gas chromatography. J. Chromatogr. A 1985, 321, 287–293. [Google Scholar] [CrossRef]
- Laub, R.J.; Madden, S.J. Solute retention in column liquid chromatography. V. The column dead volume. J. Liq. Chromatogr. 1985, 8, 173–186. [Google Scholar] [CrossRef]
- Nowotnik, D.P.; Narra, R.K. A Comparison of methods for the determination of dead time in a reversed-phase high-performance liquid chromatography system used for the measurement of lipophilicity. J. Liq. Chromatogr. 1993, 16, 3919–3932. [Google Scholar] [CrossRef]
- Molikova, M.; Jandera, P. Characterization of stationary phases for reversed-phase chromatography. J. Sep. Sci. 2010, 33, 453–463. [Google Scholar] [CrossRef]
- Wätzig, H.; Ebel, S. Estimation of dead-time in liquid chromatography from retention behaviour of homologous series by non-linear regression. Chromatographia 1991, 31, 544–548. [Google Scholar] [CrossRef]
- Pous-Torres, S.; Torres-Lapasió, J.R.; Baeza-Baeza, J.J.; García-Álvarez-Coque, M.C. Alternating iterative regression method for dead time estimation from experimental designs. Anal. Bioanal. Chem. 2009, 394, 625–636. [Google Scholar] [CrossRef]
- Guan, H.; Guiochon, G.; Coffey, D.; Davis, E.; Gulakowski, K.; Smith, D.W. Study of the physico-chemical properties of some packing materials II. General properties of the particles. J. Chromatogr. A 1996, 736, 21–30. [Google Scholar] [CrossRef]
- Svec, F. Organic polymer monoliths as stationary phases for capillary HPLC. J. Sep. Sci. 2004, 27, 1419–1430. [Google Scholar] [CrossRef]
- Tsui, H.-W.; Zhou, W.-L.; Wu, C.-D. The implicit role of the hold-up volume in defining the adsorbed layer thickness. J. Chromatogr. A 2025, 1751, 465952. [Google Scholar] [CrossRef]
- Bocian, S.; Vajda, P.; Felinger, A.; Buszewski, B. Excess adsorption of commonly used organic solvents from water on non end-capped C18-bonded phases in reversed-phase liquid chromatography. Anal. Chem. 2009, 81, 6334–6346. [Google Scholar] [CrossRef]
- Bocian, S.; Soukup, J.; Jandera, P.; Buszewski, B. Thermodynamics study of solvent adsorption on octadecyl-modified silica. Chromatographia 2015, 78, 21–30. [Google Scholar] [CrossRef]
- Buszewski, B.; Bocian, S.; Rychlicki, G.; Vajda, P.; Felinger, A. Study of solvent adsorption on chemically bonded stationary phases by microcalorimetry and liquid chromatography. J. Colloid Interface Sci. 2010, 349, 620–625. [Google Scholar] [CrossRef]
- Kazakevich, Y.V.; McNair, H.M. Study of the excess adsorption of the eluent components on different reversed-phase adsorbents. J. Chromatogr. Sci. 1995, 33, 321–327. [Google Scholar] [CrossRef]
- Gritti, F.; Kazakevich, Y.V.; Guiochon, G. Effect of the surface coverage of endcapped C18 silica on the excess adsorption isotherms of commonly used organic solvents from water in reversed phase liquid chromatography. J. Chromatogr. A 2007, 1169, 111–124. [Google Scholar] [CrossRef]
- Saifutdinov, B.R.; Buryak, A.K. On the differences in the mechanisms of adsorption of aromatic heterocycles from water–acetonitrile solutions on octadecyl-bonded silica gels. Colloid J. 2019, 81, 555–562. [Google Scholar] [CrossRef]
- Zhuravlev, L.T. The surface chemistry of amorphous silica. Zhuravlev model. Colloids Surf. A Physicochem. Eng. Asp. 2000, 173, 1–38. [Google Scholar] [CrossRef]
- Zhuravlev, L.T.; Potapov, V.V. Density of silanol groups on the surface of silica precipitated from a hydrothermal solution. Russ. J. Phys. Chem. 2006, 80, 1119–1128. [Google Scholar] [CrossRef]
- McCalley, D.V.; Neue, U.V. Estimation of the extent of the water-rich layer associated with the silica surface in hydrophilic interaction chromatography. J. Chromatogr. A 2008, 1192, 225–229. [Google Scholar] [CrossRef]
- Soukup, J.; Jandera, P. Adsorption of water from aqueous acetonitrile on silica-based stationary phases in aqueous normal-phase liquid chromatography. J. Chromatogr. A 2014, 1374, 102–111. [Google Scholar] [CrossRef]
- Jandera, P.; Hájek, T. Dual-mode hydrophilic interaction normal phase and reversed phase liquid chromatography of polar compounds on a single column. J. Sep. Sci. 2020, 43, 70–86. [Google Scholar] [CrossRef]
- Jandera, P.; Hájek, T. A new definition of the stationary phase volume in mixed-mode chromatographic columns in hydrophilic liquid chromatography. Molecules 2021, 26, 4819. [Google Scholar] [CrossRef]
- Guo, Y.; Bhaladia, N.; Fattel, B.; Serris, J. Evaluating the adsorbed water layer on polar stationary phases for hydrophilic interaction chromatography (HILIC). Separations 2019, 6, 19. [Google Scholar] [CrossRef]
- Wikberg, E.; Sparrman, T.; Viklund, C.; Jonsson, T.; Irgum, K. A 2H nuclear magnetic resonance study of the state of water in neat silica and zwitterionic stationary phases and its influence on the chromatographic retention characteristics in hydrophilic interaction high-performance liquid chromatography. J. Chromatogr. A 2011, 1218, 6630–6638. [Google Scholar] [CrossRef]
- Melnikov, S.M.; Holtzel, A.; Seidel-Morgenstern, A.; Tallarek, U. Composition, structure, and mobility of water-acetonitrile mixtures in a silica nanopore studied by molecular dynamics simulations. Anal. Chem. 2011, 83, 2569–2575. [Google Scholar] [CrossRef]
- Kirkland, J.J. Development of some stationary phases for reversed-phase HPLC. J. Chromatogr. A 2004, 1060, 9–21. [Google Scholar] [CrossRef] [PubMed]
- Sentell, K.B.; Dorsey, J.G. Retention mechanisms in reversed-phase liquid chromatography. Stationary-phase bonding density and partitioning. Anal. Chem. 1989, 61, 930–934. [Google Scholar] [CrossRef] [PubMed]
- Moldoveanu, S.C.; David, V. Dependence of distribution constant in liquid-liquid partition equilibria on van der Waals molecular surface area. J. Sep. Sci. 2013, 36, 2963–2978. [Google Scholar] [CrossRef] [PubMed]
- Deineka, V.I.; Burzhinskaya, T.G.; Deineka, L.A. The surface structure of “monomeric” and “polymeric” reversed stationary phases and mechanisms of carotenoid separation. Prot. Met. Phys. Chem. Surf. 2022, 58, 1188–1192. [Google Scholar] [CrossRef]
- Sentell, K.B.; Dorsey, J.G. On the calculation of the stationary phase volume in reversed phase chromatography. J. Liq. Chromatogr. 1988, 11, 1875–1885. [Google Scholar] [CrossRef]
- Medvedovici, A.; David, V.; David, V.; Georgita, C. Retention phenomena induced by large volume injection of organic solvents non-miscible with mobile phase in reversed-phase liquid chromatography. J. Liq. Chromatogr. Rel. Technolog. 2007, 30, 199–213. [Google Scholar] [CrossRef]
- David, V.; Galaon, T.; Caiali, E.; Medvedovici, A. Competitional hydrophobicity driven separations under RP-LC mechanism: Application to sulphonylurea congeners. J. Sep. Sci. 2009, 32, 3099–3106. [Google Scholar] [CrossRef]
- Trebel, N.; Holtzel, A.; Steinhoff, A.; Tallarek, U. Insights from molecular simulations about dead time markers in reversed-phase liquid chromatography. J. Chromatogr. A 2021, 1640, 461958. [Google Scholar] [CrossRef]
- Rafferty, J.L.; Siepmann, J.I.; Schure, M.R. Influence of bonded-phase coverage in reversed-phase liquid chromatography via molecular simulation: I. Effects on chain conformation and interfacial properties. J. Chromatogr. A 2008, 1204, 11–19. [Google Scholar] [CrossRef]
- Rafferty, J.L.; Siepmann, J.I.; Schure, M.R. Influence of bonded-phase coverage in reversed-phase liquid chromatography via molecular simulation. II. Effects on solute retention. J. Chromatogr. A 2008, 1204, 20–27. [Google Scholar] [CrossRef]
- Rafferty, J.L.; Siepmann, J.I.; Schure, M.R. Mobile phase effects in reversed-phase liquid chromatography: A comparison of acetonitrile/water and methanol/water solvents as studied by molecular simulations. J. Chromatogr. A 2011, 1218, 2203–2213. [Google Scholar] [CrossRef]
- Available online: https://www.epa.gov/tsca-screening-tools/epi-suitetm-estimation-program-interface (accessed on 25 March 2025).
- Horvath, C.; Melander, W.; Molnar, I. Solvophobic interactions in liquid chromatography with nonpolar stationary phases. J. Chromatogr. 1976, 125, 129–156. [Google Scholar] [CrossRef]
- Moldoveanu, S.; David, V. Estimation of phase ratio in reversed-phase high performance liquid chromatography. J. Chromatogr. A 2015, 1381, 194–201. [Google Scholar] [CrossRef] [PubMed]
- Caiali, E.; David, V.; Aboul-Enein, H.Y.; Moldoveanu, S.C. Evaluation of the phase ratio for three C18 high performance liquid chromatographic columns. J. Chromatogr. A 2016, 1435, 85–91. [Google Scholar] [CrossRef]
- Caiali, E.; Moldoveanu, S.C.; David, V. Comparison of the phase ratio for C18 HPLC columns using three different organic modifiers (methanol, ethanol, and acetonitrile) in mobile phase composition. Rev. Roum. Chim. 2017, 62, 629–636. [Google Scholar]
- Li, P.; Ling, J.; Ji, L.; Xie, Z.; Jiang, J.; Wang, T. Determination of the phase ratio of a dehydroabietic-acid-bonded silica-gel chromatographic stationary phase and its effect on separation thermodynamics. J. Chromatogr. A 2024, 1715, 464629. [Google Scholar] [CrossRef]
- Daniels, C.; Li, S.Y.; Iba, B.; Zhao, Y.; Kuklinski, K.; Bushey, M.M. A thermodynamic study of capillary electrochromatographic retention of aromatic hydrocarbons on a lauryl acrylate porous polymer monolithic column with measured phase ratio. J. Sep. Sci. 2021, 44, 3098–3106. [Google Scholar] [CrossRef]
- Sangawitayakorn, C.; Wilairat, P.; Chantiwas, R. Experimental determination of phase ratio of C8 columns employing retention factors and octane-mobile phase partition coefficients of homologous series of linear alkylbenzenes. J. Chromatogr. A 2020, 1634, 461668. [Google Scholar] [CrossRef]
- Redon, L.; Subirats, X.; Rosés, M. HILIC characterization: Estimation of phase volumes and composition for a zwitterionic column. Anal. Chim. Acta 2020, 1130, 39–48. [Google Scholar] [CrossRef]
- Redón, L.; Subirats, X.; Rosés, M. Evaluation of hold-up volume determination methods and markers in hydrophilic interaction liquid chromatography. Molecules 2023, 28, 1372. [Google Scholar] [CrossRef]
- Bacskay, I.; Buratti, A.; Catani, M.; Dembek, M.; Bocian, S.; Buszewski, B.; Felinger, A. Retention mechanism on phosphodiester stationary phases in HILIC and purely aqueous mobile phase, Part I: The problem of hold-up volume determination. J. Chromatogr. A 2025, 1742, 465627. [Google Scholar] [CrossRef] [PubMed]
- Bartó, E.; Felinger, A.; Jandera, P. Investigation of the temperature dependence of water adsorption on silica-based stationary phases in hydrophilic interaction liquid chromatography. J. Chromatogr. A 2017, 1489, 143–148. [Google Scholar] [CrossRef] [PubMed]
- Urban, J.; Eeltink, S.; Jandera, P.; Schoenmakers, P.J. Characterization of polymer-based monolithic capillary columns by inverse size-exclusion chromatography and mercury-intrusion porosimetry. J. Chromatogr. A 2008, 1182, 161–168. [Google Scholar] [CrossRef]
- Mazsaroff, I.; Regnier, F.E. Phase ratio determination in an ion-exchange column having pores partially accessible to proteins. J. Chromatogr. A 1988, 442, 15–28. [Google Scholar] [CrossRef] [PubMed]
- Moldoveanu, S.C.; Caiali, E.; David, V. Results from solvophobic theory applied on methylene selectivity in reversed-phase HPLC. J. Liq. Chromatogr. Rel. Technol. 2018, 41, 24–32. [Google Scholar] [CrossRef]
- David, V.; Moldoveanu, S.C. Variation with temperature of octanol/water partition constant for the homologous series from benzene to propylbenzene. Sep. Sci. Plus 2019, 2, 457–464. [Google Scholar] [CrossRef]
- Soare, A.C.; David, V.; Moldoveanu, S.C. Does phase ratio in reversed phase high performance liquid chromatography vary with temperature? J. Chromatogr. A 2020, 1620, 461023. [Google Scholar] [CrossRef]
- Soare, A.C.; David, V.; Moldoveanu, S.C. Variation with temperature of phase ratio in reversed phase HPLC for a methanol/water mobile phase. Chromatographia 2021, 84, 581–587. [Google Scholar] [CrossRef]
- Galaon, T.; David, V. Deviation from van’t Hoff dependence in RP-LC induced by tautomeric interconversion observed for four compounds. J. Sep. Sci. 2011, 34, 1423–1428. [Google Scholar] [CrossRef]
- Tanase, M.; Soare, A.C.; David, V.; Moldoveanu, S.C. Sources of non-linear van’t Hoff temperature dependences in high performance liquid chromatography. ACS Omega 2019, 4, 19808–19817. [Google Scholar] [CrossRef]
- Horvath, C.; Melander, W. Reversed-phase chromatography. In High Performance Liquid Chromatography Advances and Perspectives; Horvath, C., Ed.; Academic Press: New York, NY, USA, 1980; Volume 2, pp. 199–201. [Google Scholar]
- Rosés, M.; Subirats, X.; Bosch, E. Retention models for ionizable compounds in reversed-phase liquid chromatography; Effect of variation of mobile phase composition and temperature. J. Chromatogr. A 2009, 1216, 1756–1775. [Google Scholar] [CrossRef]
- Dorsey, J.G.; Cooper, W.T. Retention mechanisms of bonded phase liquid chromatography. Anal. Chem. 1994, 66, 857A–867A. [Google Scholar] [CrossRef]

| Tracer | Point Charges | Polarizabilities Å3 | Electronegativity |
|---|---|---|---|
| Uracil | 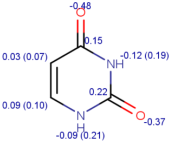 |  | 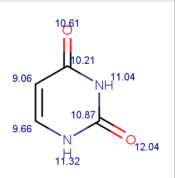 |
| Thiourea | 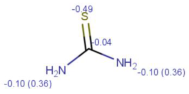 | 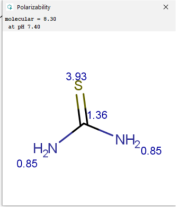 | 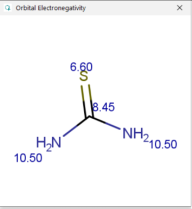 |
| Nitrate |  | 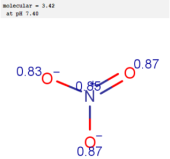 | 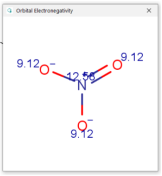 |
Disclaimer/Publisher’s Note: The statements, opinions and data contained in all publications are solely those of the individual author(s) and contributor(s) and not of MDPI and/or the editor(s). MDPI and/or the editor(s) disclaim responsibility for any injury to people or property resulting from any ideas, methods, instructions or products referred to in the content. |
© 2025 by the authors. Licensee MDPI, Basel, Switzerland. This article is an open access article distributed under the terms and conditions of the Creative Commons Attribution (CC BY) license (https://creativecommons.org/licenses/by/4.0/).
Share and Cite
David, V.; Petre, J.; Moldoveanu, S.C. Challenges in the Measurement of the Volume of Phases for HPLC Columns. Molecules 2025, 30, 2062. https://doi.org/10.3390/molecules30092062
David V, Petre J, Moldoveanu SC. Challenges in the Measurement of the Volume of Phases for HPLC Columns. Molecules. 2025; 30(9):2062. https://doi.org/10.3390/molecules30092062
Chicago/Turabian StyleDavid, Victor, Jana Petre, and Serban C. Moldoveanu. 2025. "Challenges in the Measurement of the Volume of Phases for HPLC Columns" Molecules 30, no. 9: 2062. https://doi.org/10.3390/molecules30092062
APA StyleDavid, V., Petre, J., & Moldoveanu, S. C. (2025). Challenges in the Measurement of the Volume of Phases for HPLC Columns. Molecules, 30(9), 2062. https://doi.org/10.3390/molecules30092062