Article

Comparative Analysis of Volatile Organic Compounds in Different Parts of Ginseng Powder Using Gas Chromatography–Ion Mobility Spectrometry

State Key Laboratory of Chinese Medicine Powder and Medicine Innovation in Hunan (Incubation), Science and Technology Innovation Center, Hunan University of Chinese Medicine, Changsha 410208, China
*
Author to whom correspondence should be addressed.
These authors contributed equally to this work.
Molecules 2025, 30(9), 1965; https://doi.org/10.3390/molecules30091965
Submission received: 27 March 2025 / Revised: 23 April 2025 / Accepted: 27 April 2025 / Published: 29 April 2025

Abstract

The main root, reed head, and fibrous root are three different main edible medicinal parts of ginseng (Panax ginseng C. A. Meyer). When processed into ginseng products, such as ginseng powder, they exhibit similar colors and odors, easily confused in market circulation. However, there are differences in their pharmacological activity and clinical indications. Therefore, the identification of the different parts of ginseng powder is crucial for ensuring the quality, safety, and efficacy of medicinal ginseng products. In this study, we utilized gas chromatography–ion mobility spectrometry (GC–IMS) to analyze volatile organic components (VOCs) in main root, reed head, and fibrous root of ginseng. It was found that the composition of VOCs in different parts of ginseng powder was similar, but the content was different in all samples, and a total of 68 signal peaks was detected and 65 VOCs identified. In addition, combined with fingerprint analysis, principal component analysis (PCA), Euclidean distance, partial-least squares discriminant analysis (PLS-DA), and cluster analysis (CA), it clearly showed the significant differences between VOCs in different parts of ginseng powder. Our findings reveal that GC–IMS combined with chemometrics is a reliable method for distinguishing the active parts of ginseng powder, and provides essential data support for different parts of ginseng processing and functional product development.

1. Introduction

Ginseng (Panax ginseng C. A. Meyer) is a functional food primarily found in China, North Korea, and Japan. According to its place of origin, ginseng can be categorized into Jilin ginseng, Liao ginseng, Goryeo ginseng, Japanese ginseng, and so on. Ginseng is extensively utilized as both a common and functional food in China, Japan, North Korea, South Korea, and various other regions globally. Moreover, it is frequently used to enhance immune function [1], prevent cardiovascular and cerebrovascular diseases [2], alleviate fatigue [3], inhibit oxidation [4], delay aging [5], improve memory [6], and promote anti-cancer effects [7]. In 2009, the Codex Alimentarius Commission (CAC) adopted the International Standard for Ginseng Food, following which the Ministry of Health of the People’s Republic of China permitted ginseng cultivation as food in 2012 under Regulation No. 17. The primary edible parts of ginseng are the roots and rhizomes. The rhizome is the head part of the reed (named the reed head), and the root is mainly divided into two parts: the main root and the fibrous root.
It is easy to distinguish the main root, reed head, and fibrous root of ginseng by appearance and form, but ginseng-related foods are usually sold in powder form, and the color and smell of the powder from the three ginseng parts are similar, which is difficult to distinguish with the naked eye or by smell. There is a significant price disparity among the main roots, fibrous roots, and reed head of ginseng, indicating that high-quality ginseng powder primarily consists of the main root powder; the reed head and fibrous roots of ginseng are often made into general-quality ginseng powder due to their lower cost. Some illegal traders exploit this feature to sell fiber root and reed head powder as main root powder for profit, seriously disrupting the market order. Studies have demonstrated that these parts contain many similar active ingredients, such as ginsenosides [8]. The average value of the total content of 10 ginsenosides (Rb1, Rb2, Rb3, Rc, Rd, Re, Rf, Rg1, Rg2, and Ro) follows the order: ginseng fibrous roots > ginseng reed head > ginseng main roots, indicating that fibrous roots can serve as the primary component when ginseng saponins are utilized as functional constituents. Simultaneously, there is some evidence of the poor quality or adulteration of ginseng products in the market, which may have a negative impact on their quality and safety. At present, high-performance liquid chromatography (HPLC) [8] and gas chromatography-mass spectrometry (GC-MS) [9] can be used as the main method to identify different parts of ginseng powder, but this method is complicated, time-consuming, and destructive to samples. Therefore, it is of practical significance to distinguish and identify different parts of ginseng powder using an efficient method to ensure the safety and efficacy of health foods.
Gas chromatography–olfactometry (GC–O), electronic nose (e-nose), gas chromatography–ion mobility spectrometry (GC–IMS), and other technologies are used to detect volatile organic components (VOCs) and evaluate the authenticity and quality of food. Among them, GC–IMS is a newly developed technique for the analysis and detection of VOCs. GC–IMS combines the high separation capability of gas chromatography with the high sensitivity of ion mobility spectrometry to effectively separate and detect VOCs in samples, even at trace levels [10,11]. GC–IMS has the advantage of a fast response and can qualitatively and quantitatively analyze samples in a short time [12]. The 3D spectra (retention time, drift time, and signal strength) obtained via GC–IMS can visually demonstrate differences in the VOCs in a sample. Direct headspace sampling allows the sample to be analyzed without special treatment or enrichment, saving time and effort while retaining the original flavor of the sample. At present, GC–IMS is a rapid, efficient, convenient, and eco-friendly technique widely used for analyzing VOCs in food and flavor analysis [13,14].
The primary bioactive components of ginseng include ginsenosides [15,16], polysaccharides [17], and VOCs [9,18]. VOCs are significant active substances in plant-based foods. A small dose of VOCs in ginseng exhibits excitatory effects, a moderate dose induces sedative effects, and a high dose results in paralysis [19]. Moreover, VOCs exhibit antibacterial, anti-tumor, and myocardial ischemia-alleviating effects [20,21]. The utilization of GC–IMS for analyzing VOCs in different parts of ginseng (the main root, reed head, and fibrous root) powder holds significant importance in selecting suitable parts to develop products. Although, some researchers have indicated that the types and contents of ginsenosides differ in different parts of ginseng [8], but a study of VOCs in different parts of ginseng powder has not been reported. In this study, we employed the GC–IMS method to rapidly analyze VOCs in different parts of ginseng powder and to establish the fingerprints of VOCs to identify the characteristic substances and further treatment of data by principal component analysis (PCA), cluster analysis (CA), and partial least-squares discriminant analysis (PLS-DA). The results of this study are helpful for providing a reference for the identification, development, and utilization of different parts of ginseng.

2. Results

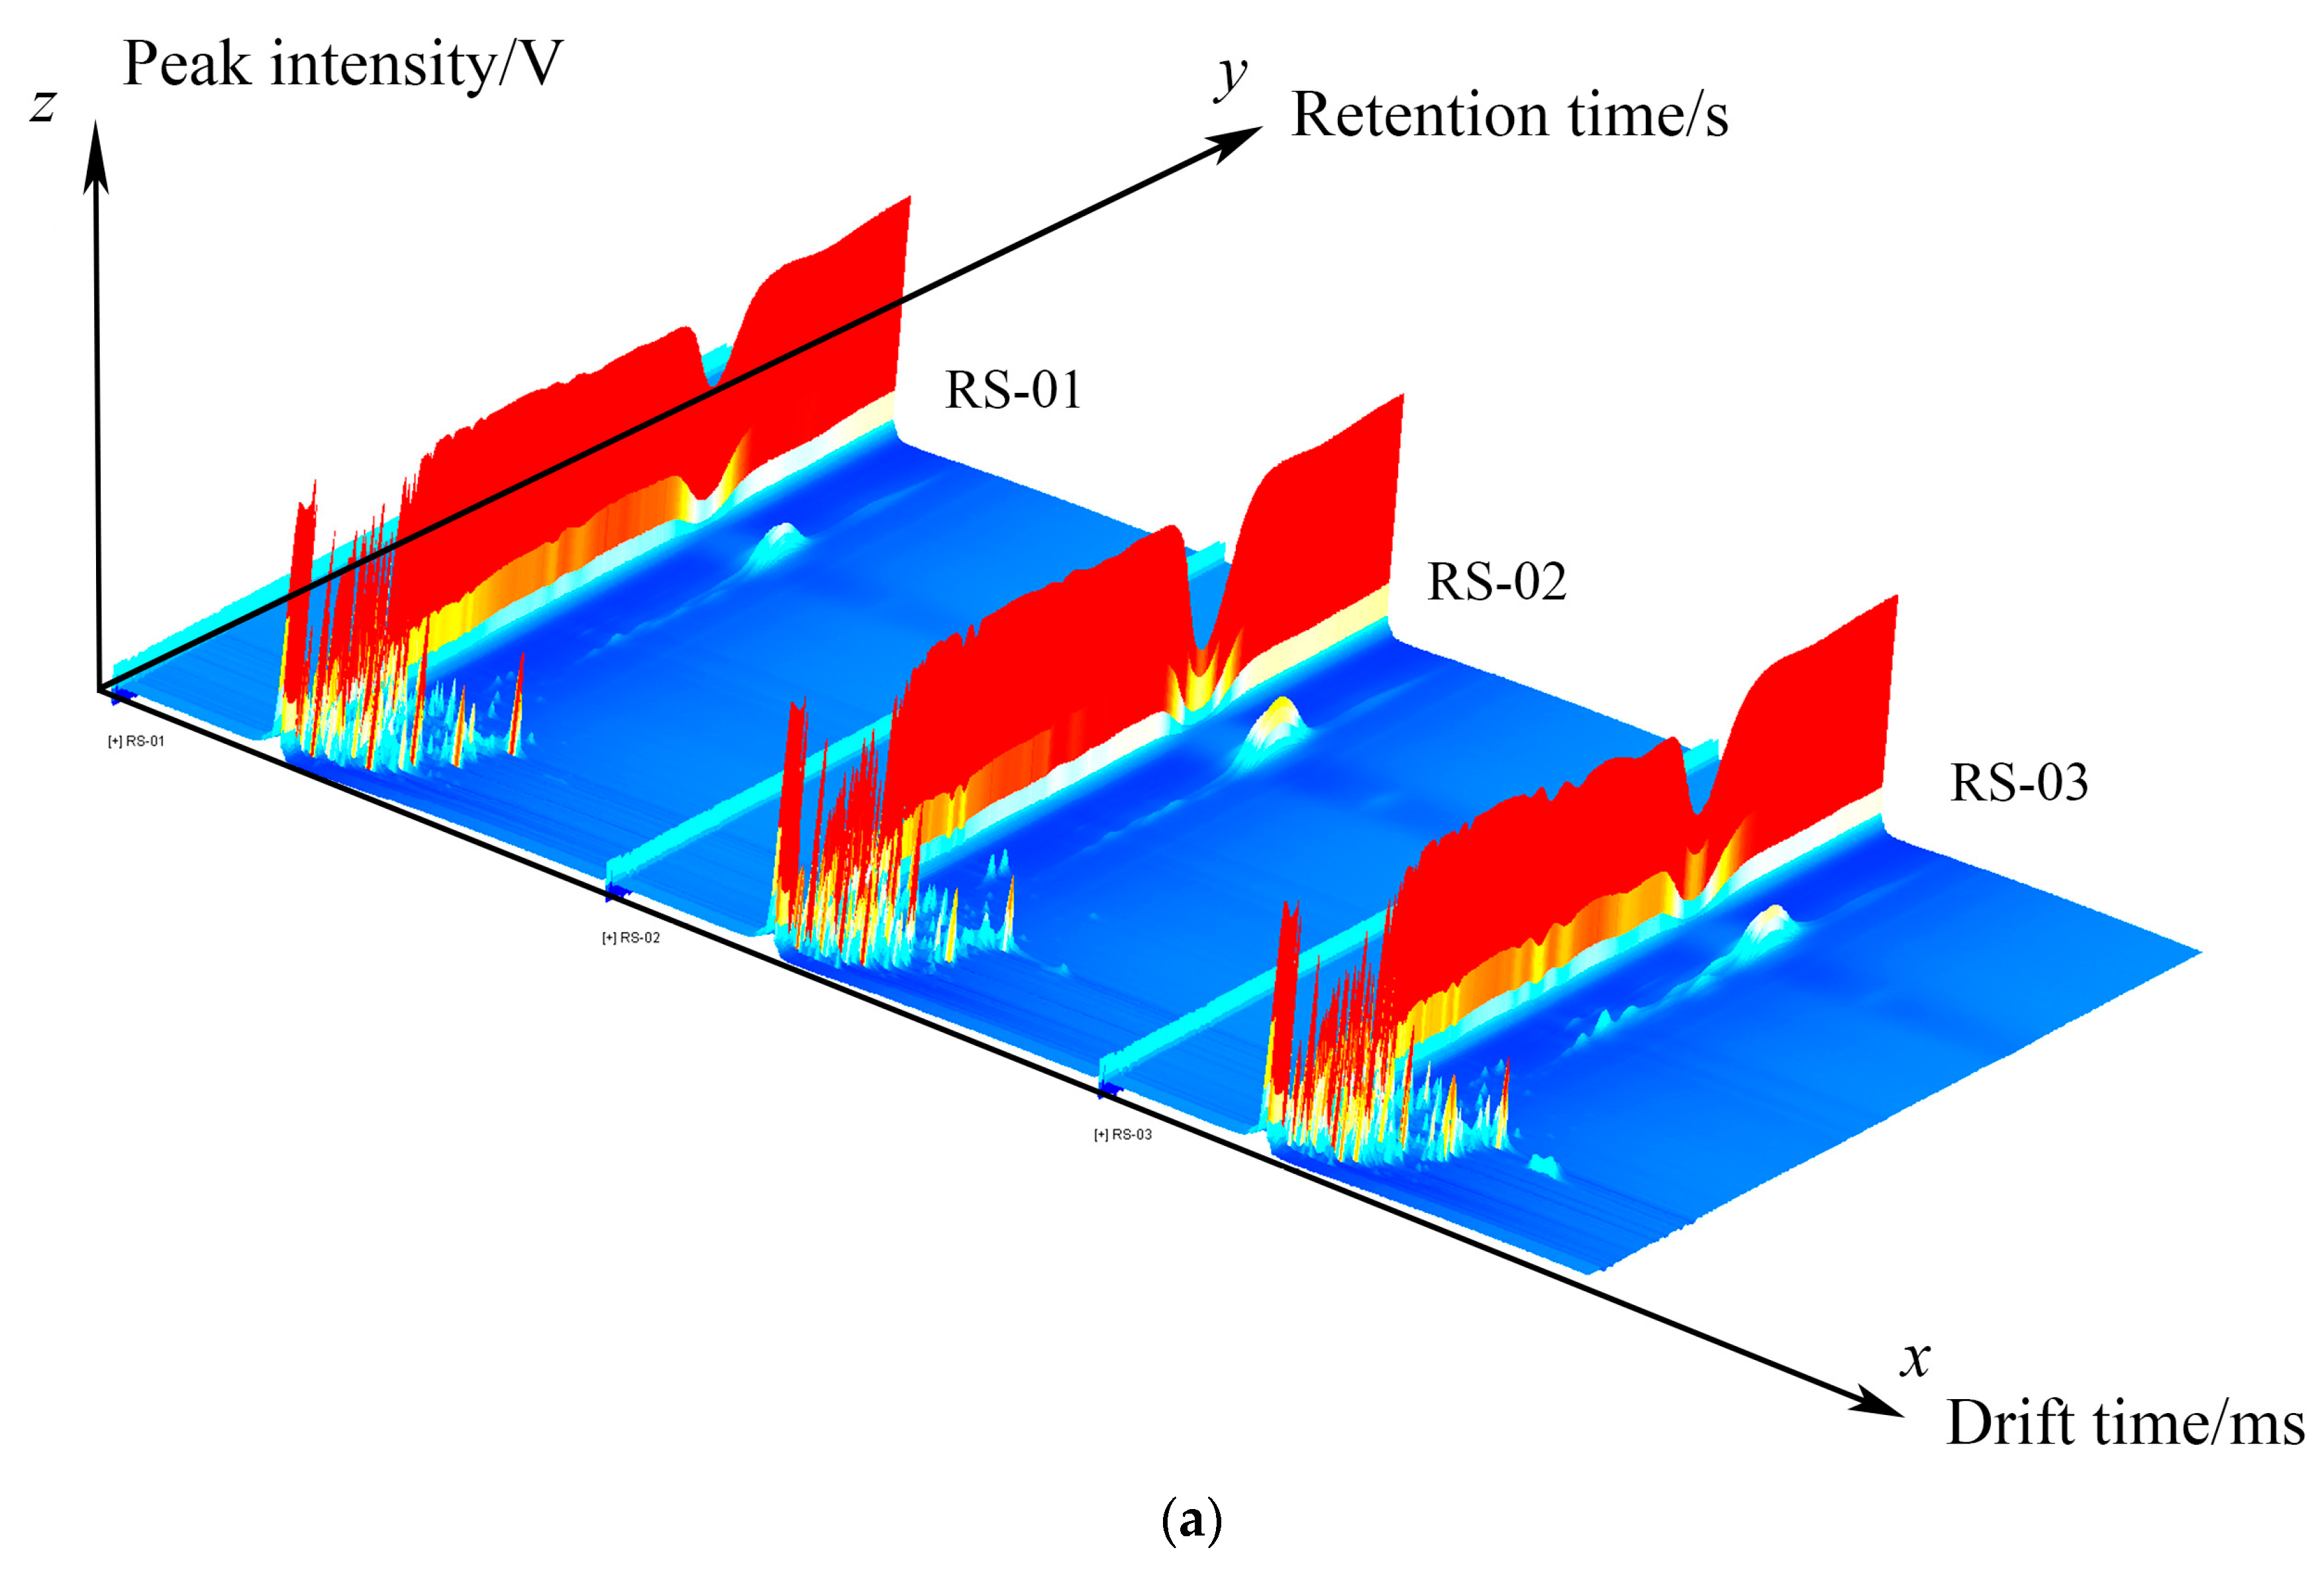
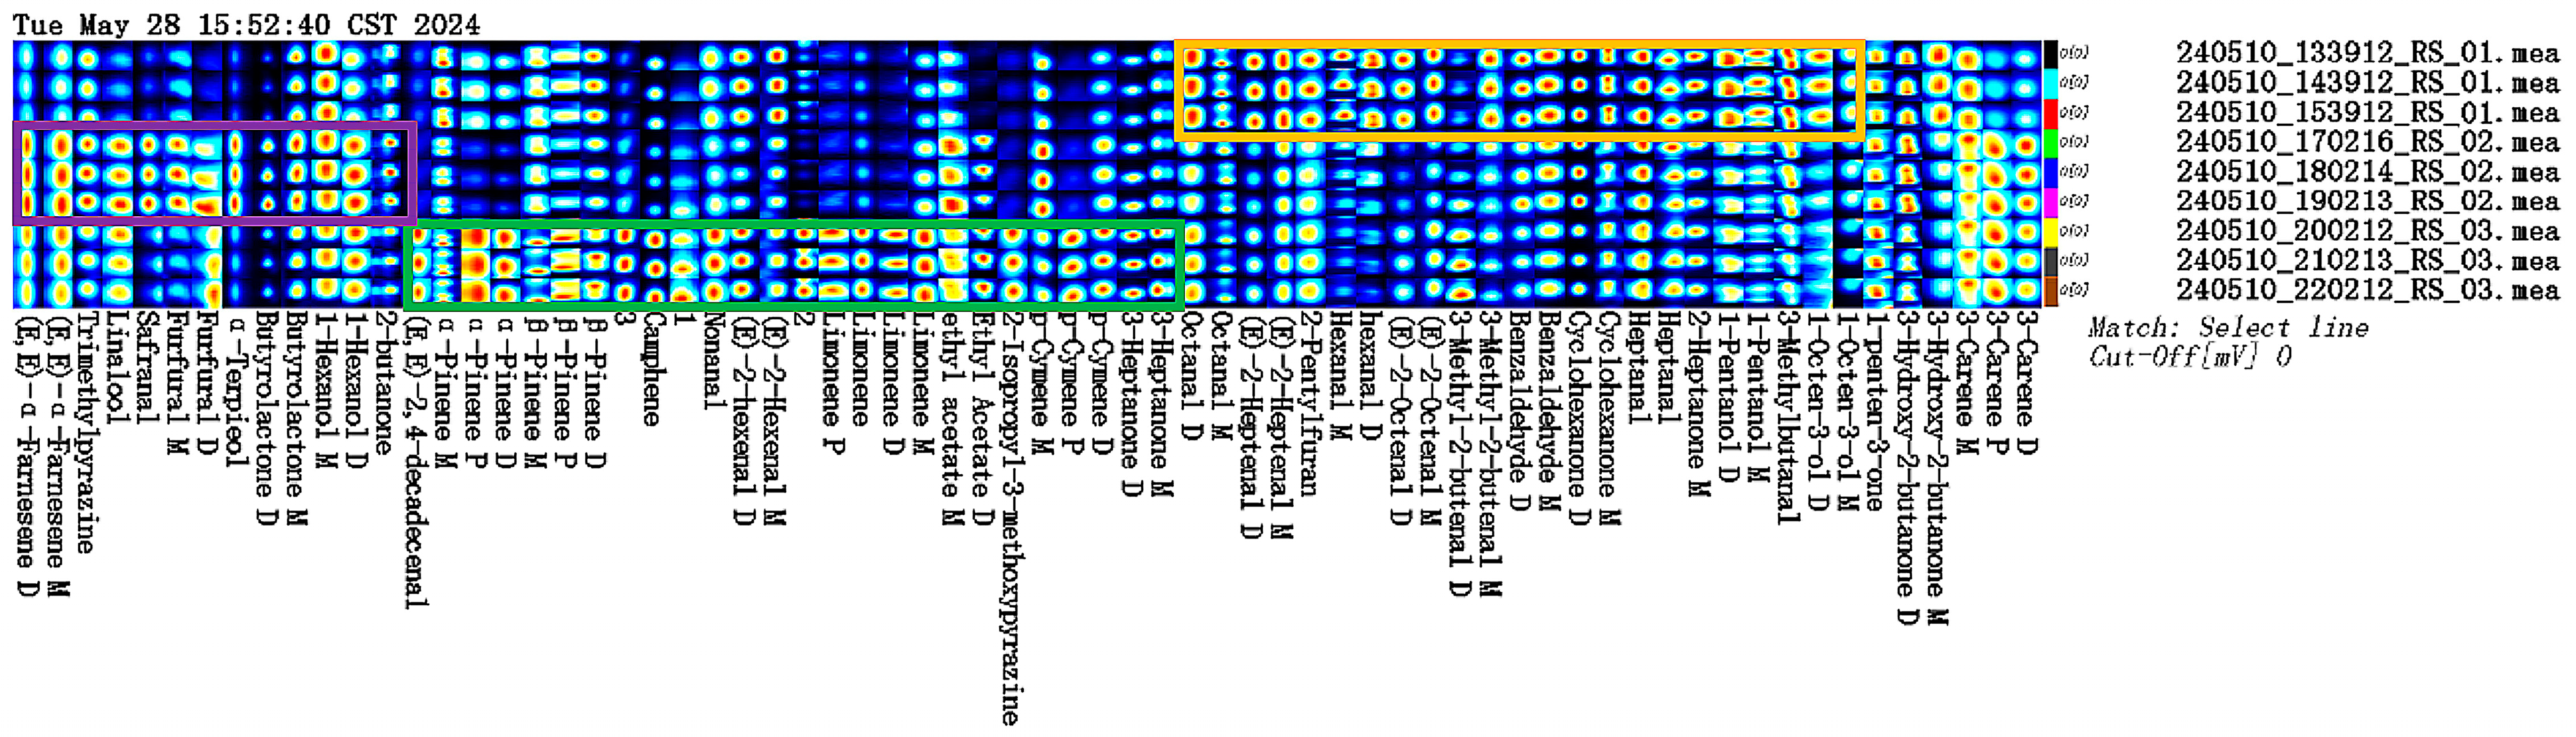
2.1. Qualitative Analysis of VOCs in Different Parts of Ginseng Powder

The differences in VOCs from three different parts of ginseng (the main root, reed head, and fibrous root) powder were analyzed using GC–IMS. Based on the NIST and IMS databases, VOCs were determined by combining retention indexes (RI), retention times, and drift times. A total of 68 signal peaks was detected, and a total of 65 VOCs was identified. The results are presented in Table 1. Figure 1a shows the three-dimensional (3D) spectrum of GC–IMS, where the three axes stand for the mobility time (X-axis), retention time (Y-axis), and signal peak strength (Z-axis). In order to facilitate observation, a top view is shown for comparison. As depicted in Figure 1b, the graph features a blue background; the vertical axis denotes the retention time of the gas chromatogram, while the horizontal axis indicates the relative mobility time. The red vertical line at a horizontal coordinate of 1.0 corresponds to RIP (reactive ion peak, normalized). Each point on either side of RIP represents a volatile substance. The color represents the concentration of the substance; white means that the concentration is lower, and red means it is higher; the darker the color, the greater the concentration. It can be seen that there are certain differences in VOCs in the samples derived from different parts of ginseng powder.
To more intuitively compare the differences between samples, the spectrum of the RS-01 sample was chosen as the reference, and the spectra of other samples were subtracted to generate a comparative difference diagram for various samples, as depicted in Figure 1c. If the VOC content of the target sample and the reference is the same, the deducted background is white, whereas red means that the concentration of the substance in the target sample is higher than the reference, and blue means that the concentration of the substance in the target sample is lower than the reference. It can be seen that there are obvious differences in the contents of various VOCs in RS-01, RS-02, and RS-03, which is consistent with the results observed in the 3D spectrum and top view.

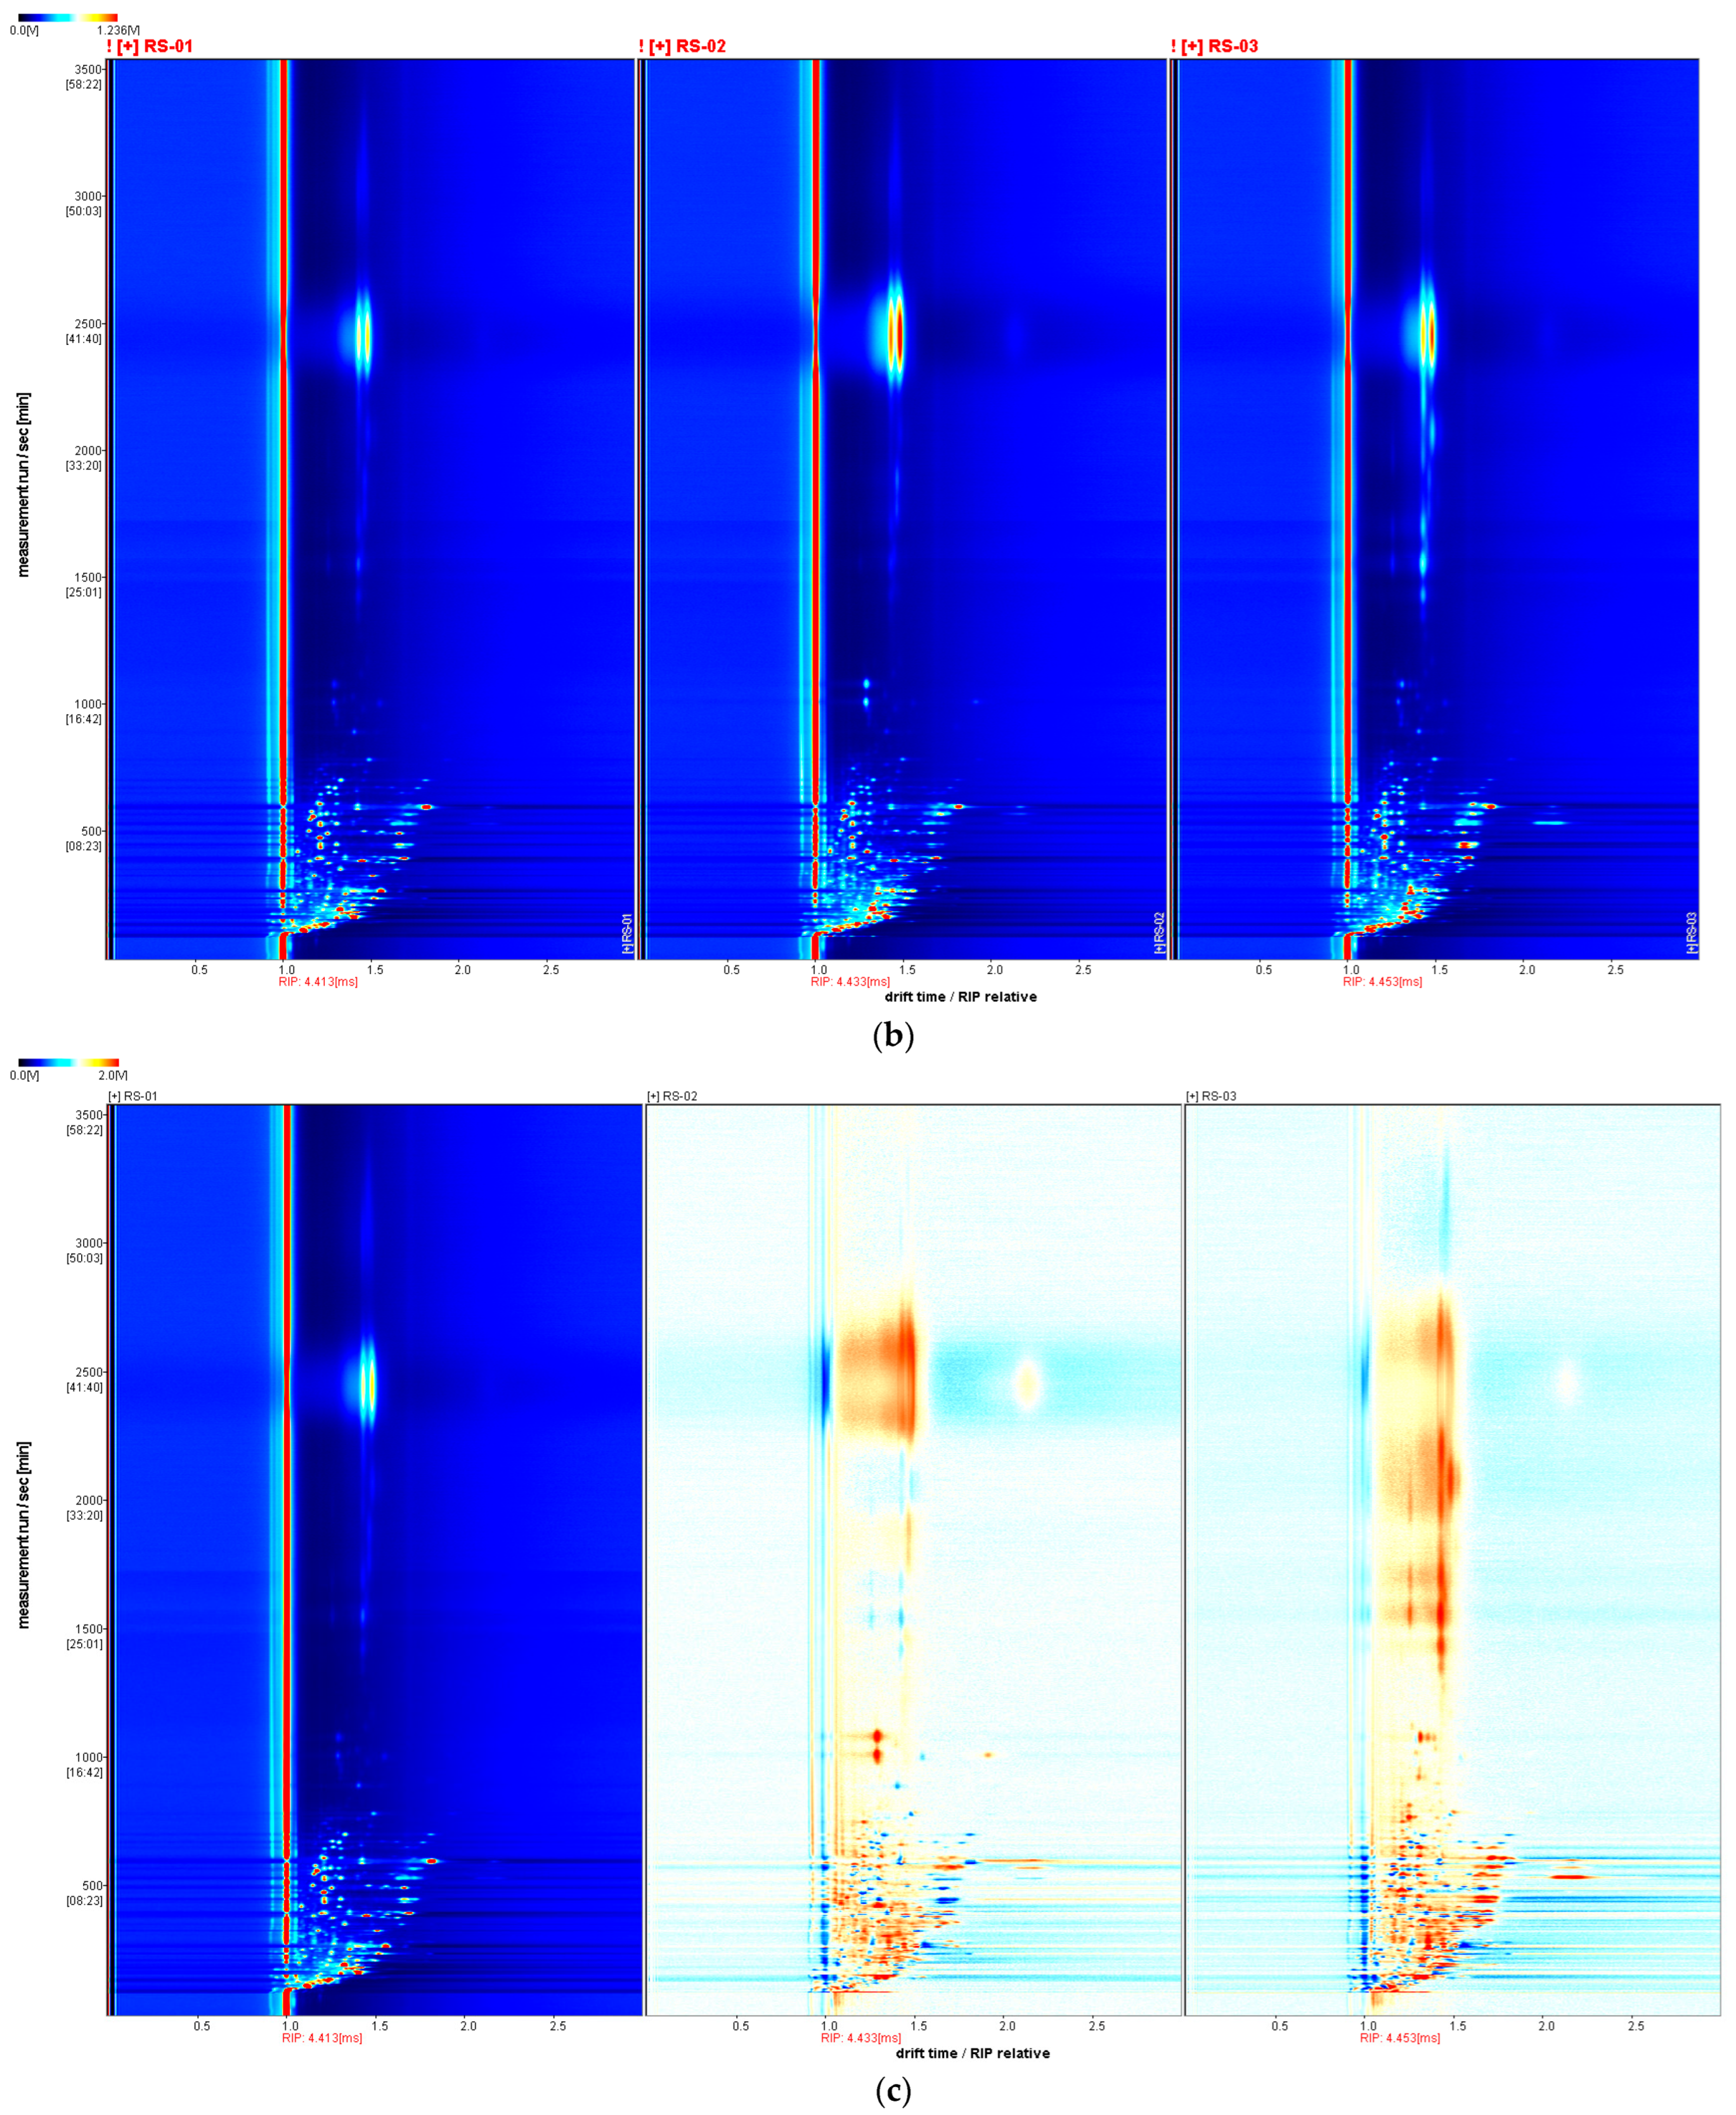
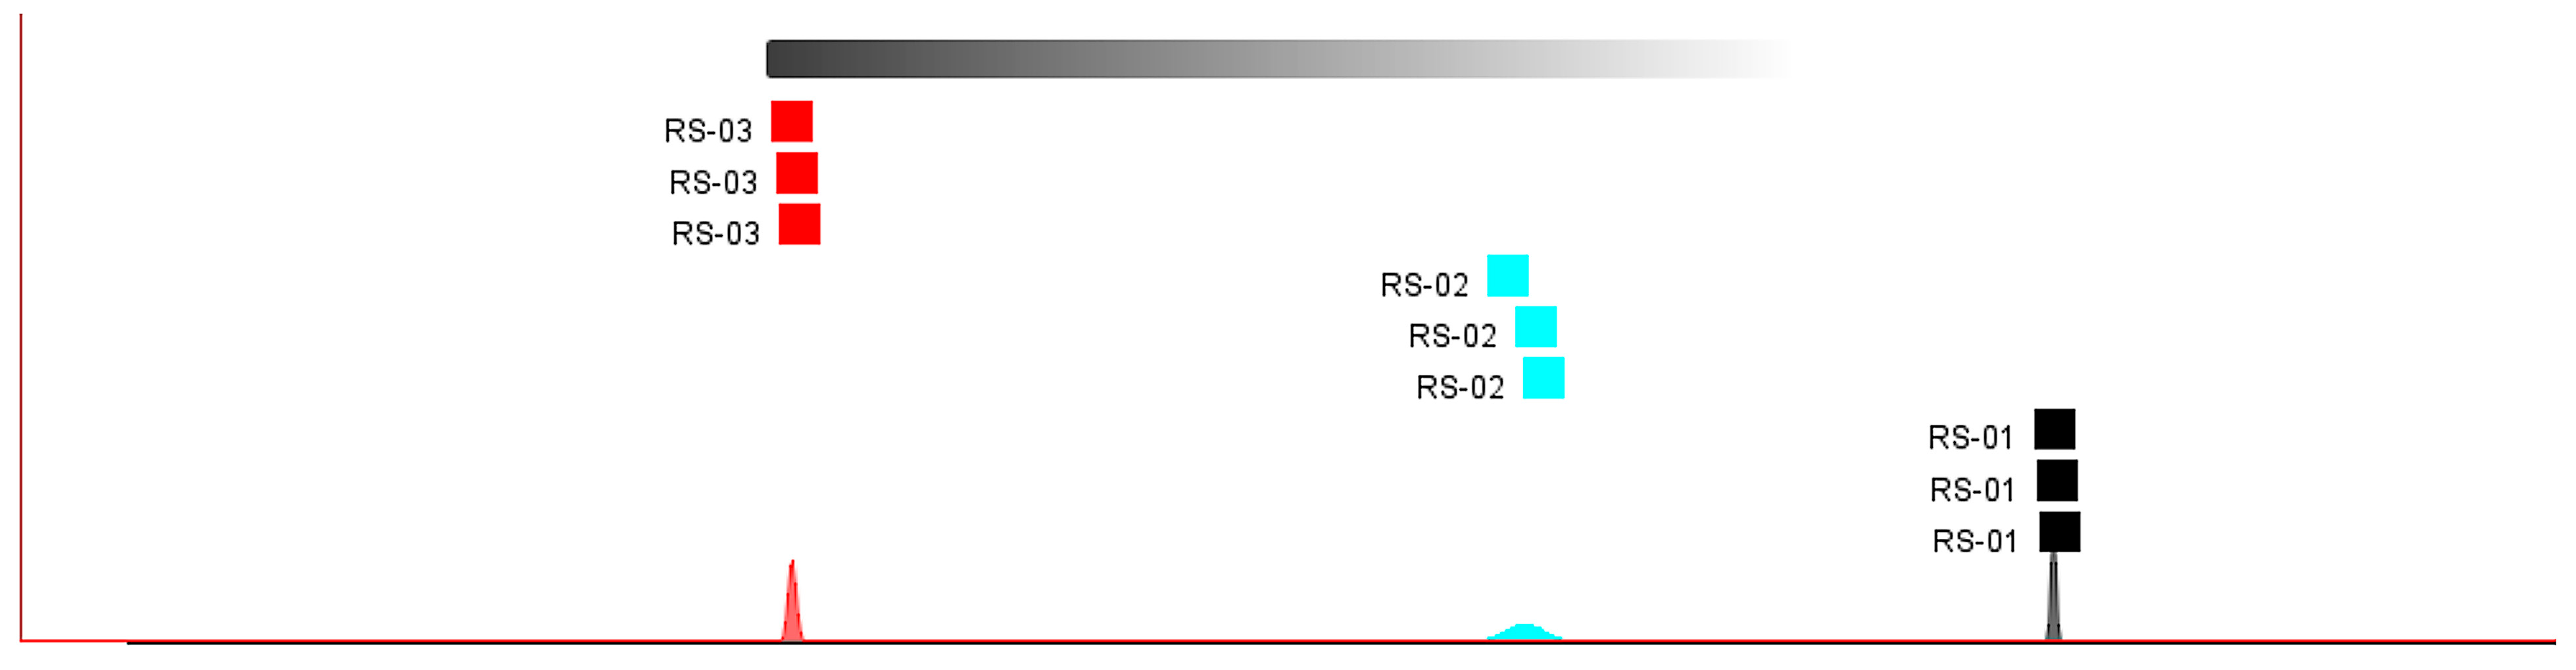
2.2. Differences in Characteristic VOCs Fingerprints

In order to more intuitively identify differences between samples from different parts of ginseng powder, and the VOCs in the samples were further compared, and fingerprints were analyzed using the Gallery Plot plug-in, as shown in Figure 2. Each row represents all selected signal peaks in a sample, and each column represents the same VOCs in different samples. The color intensity represents the concentration of VOCs; the redder the color, the higher the relative content, and the bluer the color, the lower the relative content. Unidentified components are numbered 1–3. Through the comparative analysis of VOCs in samples RS-01, RS-02, and RS-03, the results show that Octanal, (E)-2-Heptenal, 2-Pentylfuran, Hexanal, (E)-2-Octenal, 3-Methyl-2-butenal, Benzaldehyde, Cyclohexanone, Heptanal, 2-Heptanone, 1-Pentanol, 3-Methylbutanal, 1-Octen-3-ol are high in main root (RS-01), as shown in the orange box. (E, E)-α-Farnesene, Trimethylpyrazine, Linalool, Safranal, Furfural, α-Terpieol, Butyrolactone, Hexanol, 2-butanone are high in reed head (RS-02), as shown in the purple frame. (E, E)-2,4-decadecenal, α-Pinene, β-Pinene, Camphene, Nonanal, (E)-2-hexenal, Limonene, Ethyl Acetate, 2-Isopropyl-3-methoxypyrazine, p-Cymene, 3-Heptanone are high in fibrous root (RS-03), as shown in the green box. It can be seen that the type and contents of VOCs can be used as an important indication to distinguish different ginseng parts powder.

2.3. Chemometric Analysis

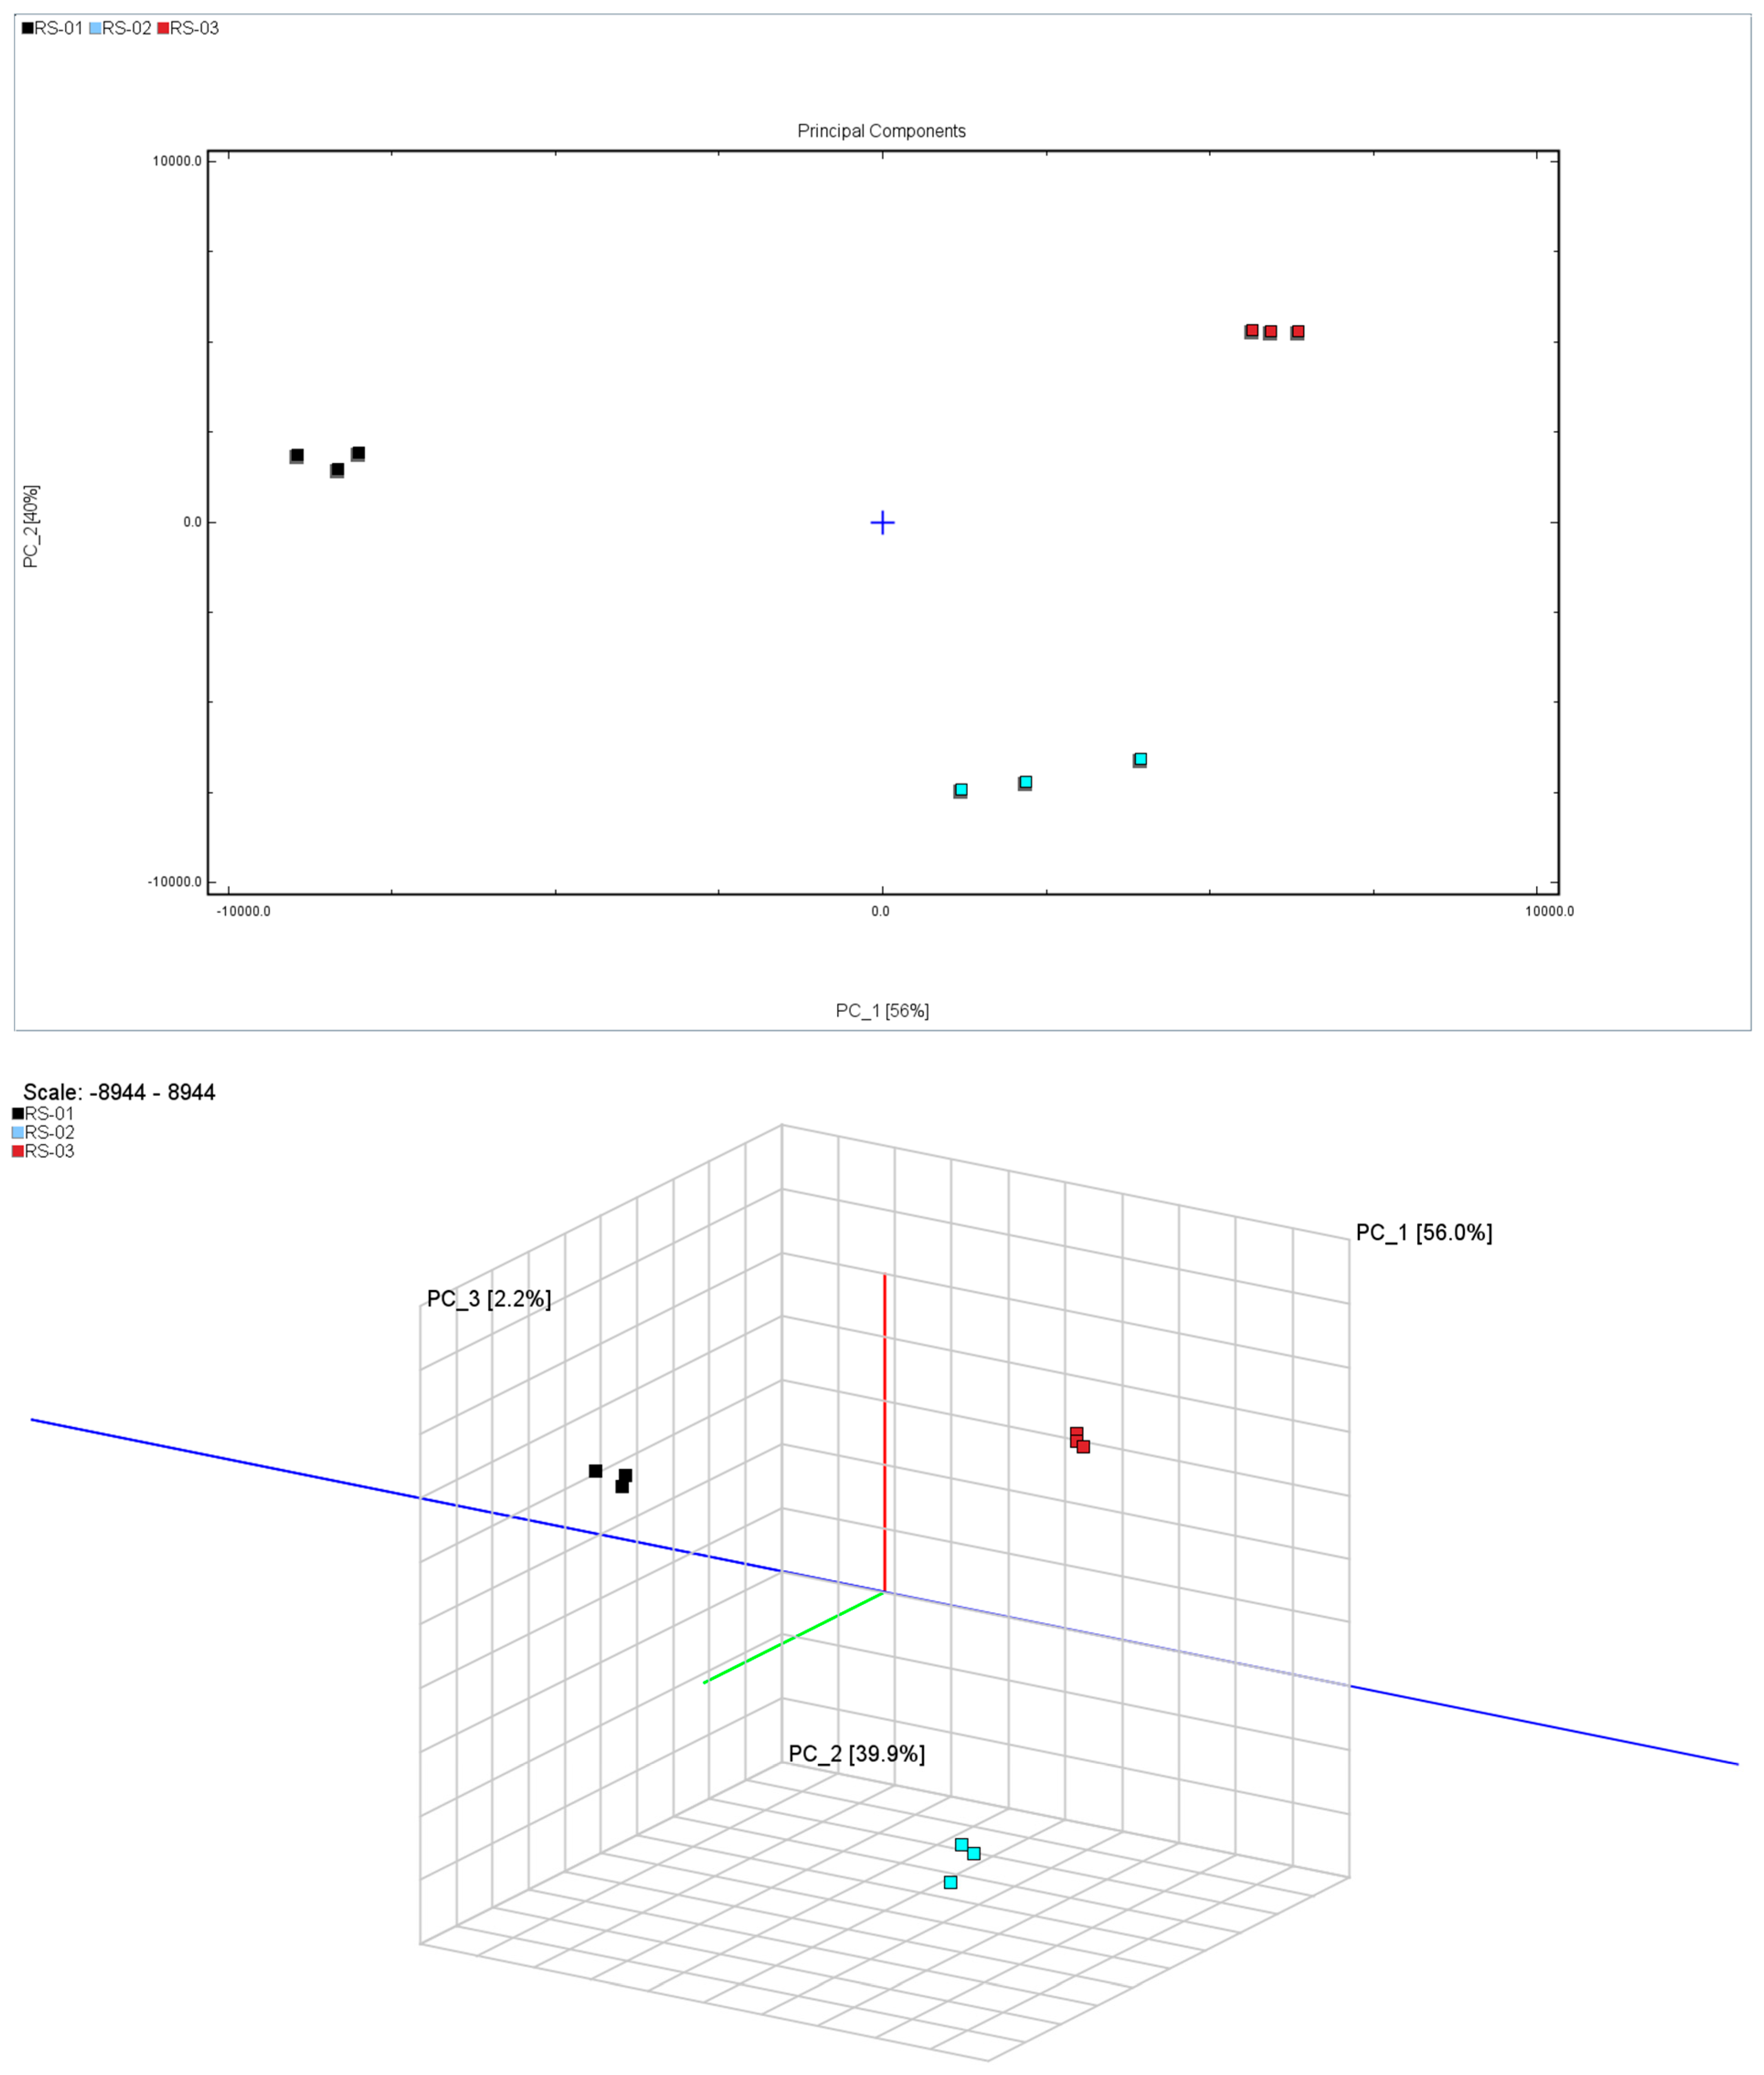
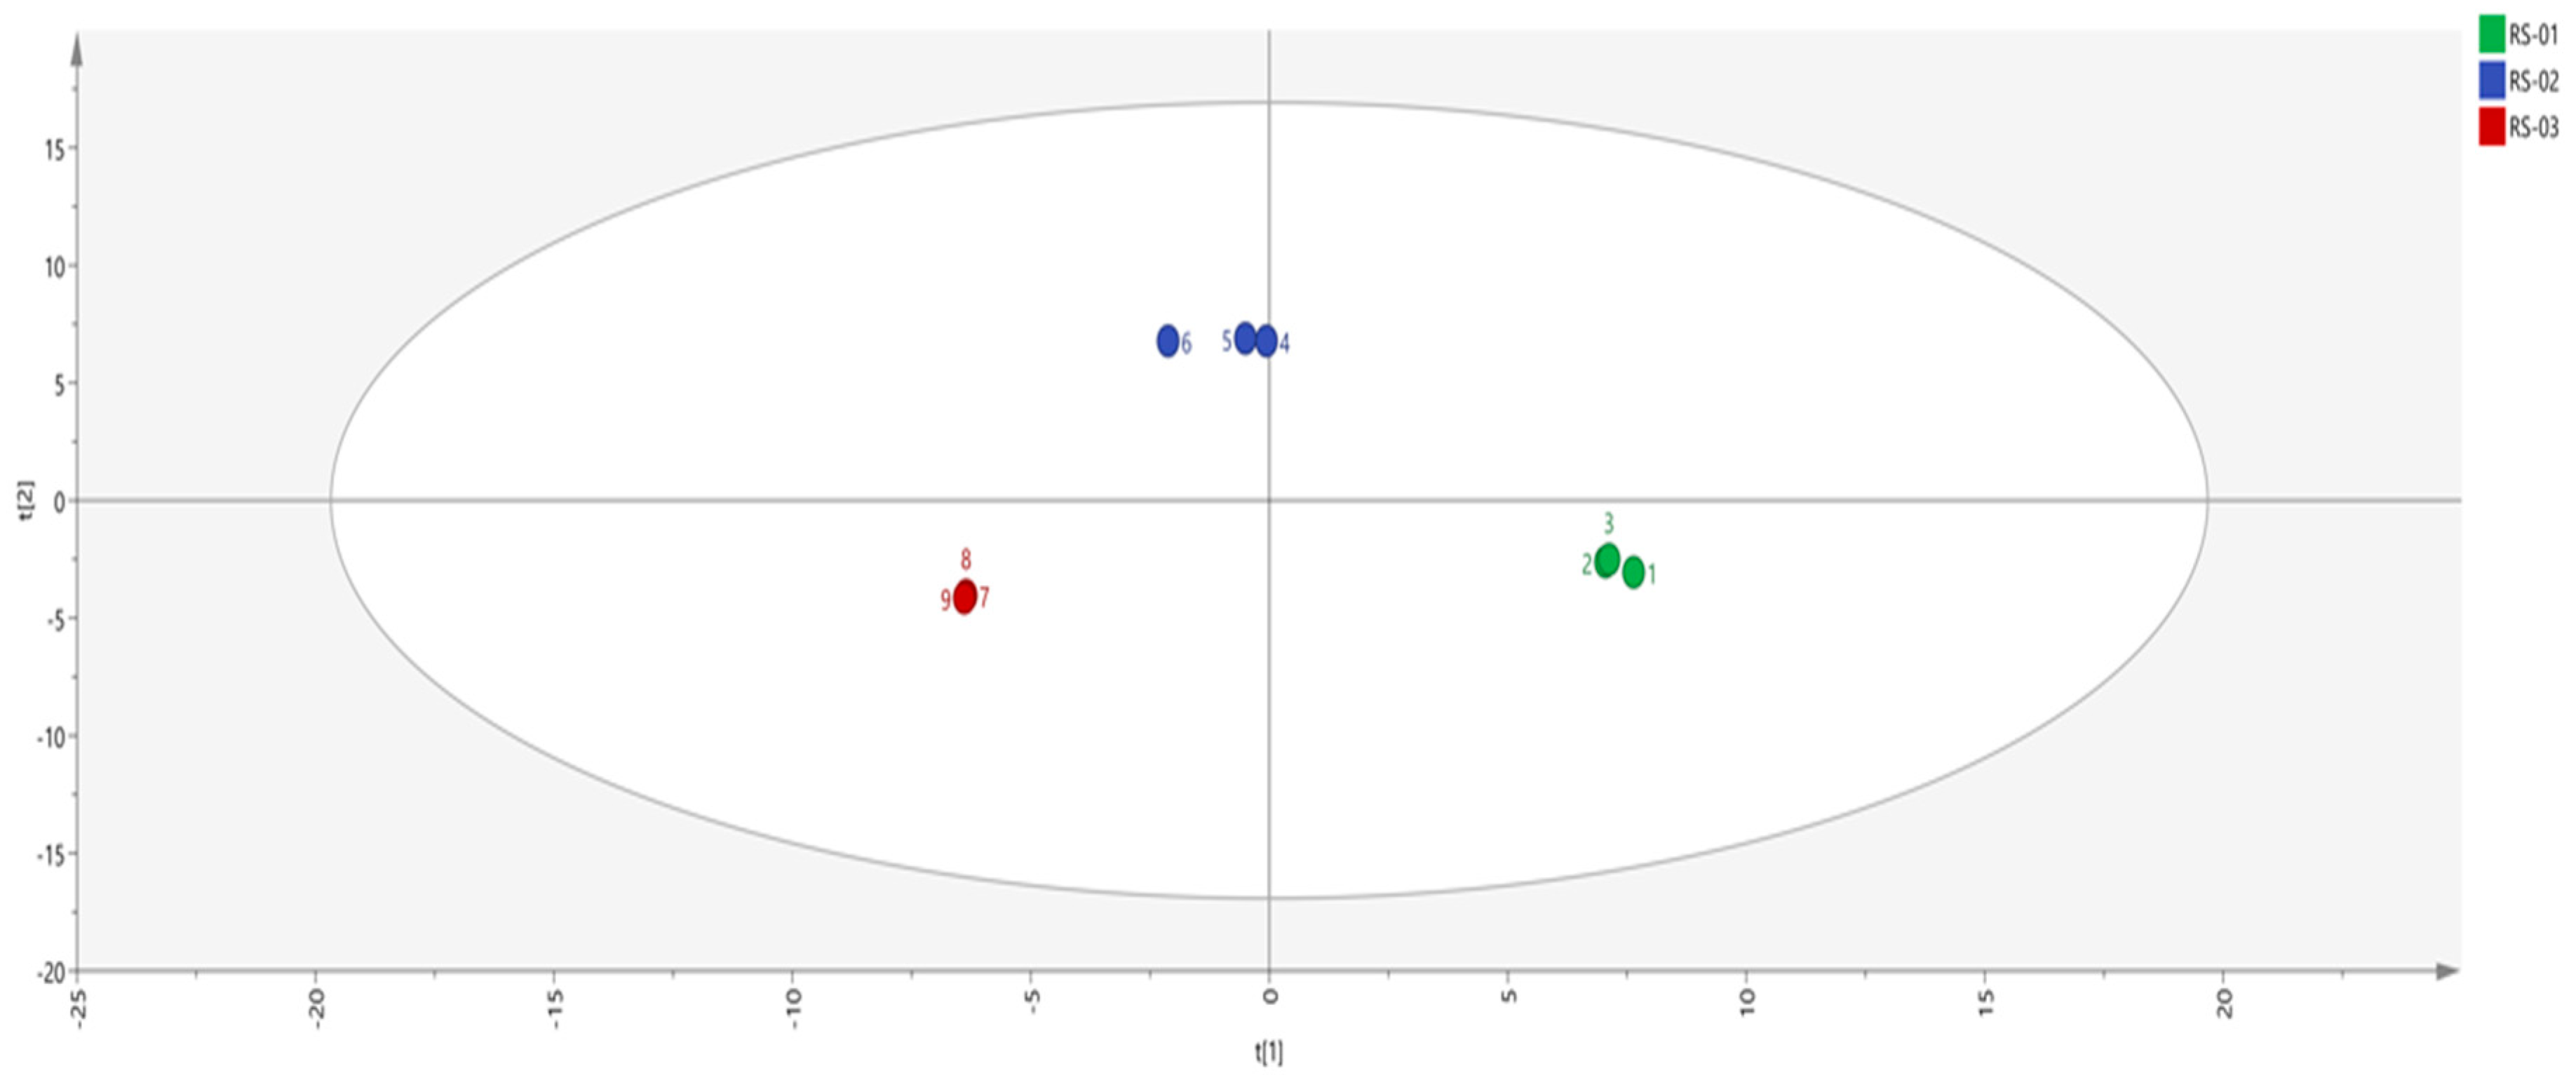
2.3.1. Principal Component Analysis

Principal component analysis (PCA) is a data representation method used for feature extraction and dimensionality reduction. It reduces a large number of potentially relevant variables to a smaller number of uncorrelated variables, providing an overview of class separation, clustering, and outliers. Additionally, PCA facilitates model visualization, enhancing interpretability while mitigating subjective bias [22,23]. In order to distinguish the difference between the main root, reed head, and fibrous root, PCA was performed on the peak volume of 65 VOCs in 9 batches of samples, and the results are shown in Figure 3, where different colors represent different samples of ginseng powder. The distance between individual points represents the level of similarity, and the dispersion of the same points represents the homogeneity of the same sample. The contribution rate of PC1 is 56%, that of PC2 is 39.9%, and that of PC3 is 2.2%, and the cumulative contribution rate reaches 98.1%. The distance between the three samples is large, indicating that there were differences in VOCs in different parts of the ginseng powder.

2.3.2. Euclidean Distance

The analysis of a fingerprint similarity map is a clustering analysis method based on Euclidean distance, which evaluates differences between samples, according to distance discrimination. This method takes into consideration the actual distance between two points in space or the natural length of the vector (from the point to the origin). The distance is directly proportional to the degree of similarity between the research objects [24]. Through the “nearest neighbor” fingerprint analysis of samples, the results showed the distances between ginseng powder samples of different parts can be clearly distinguished, and the results are shown in Figure 4. This indicated significant differences in VOCs between RS-01, RS-02, and RS-03 samples, which can be clearly distinguished. Among them, RS-03 and RS-01 are the furthest apart, which shows that the difference between them is the most significant. This is similar to the results of the PCA analysis.

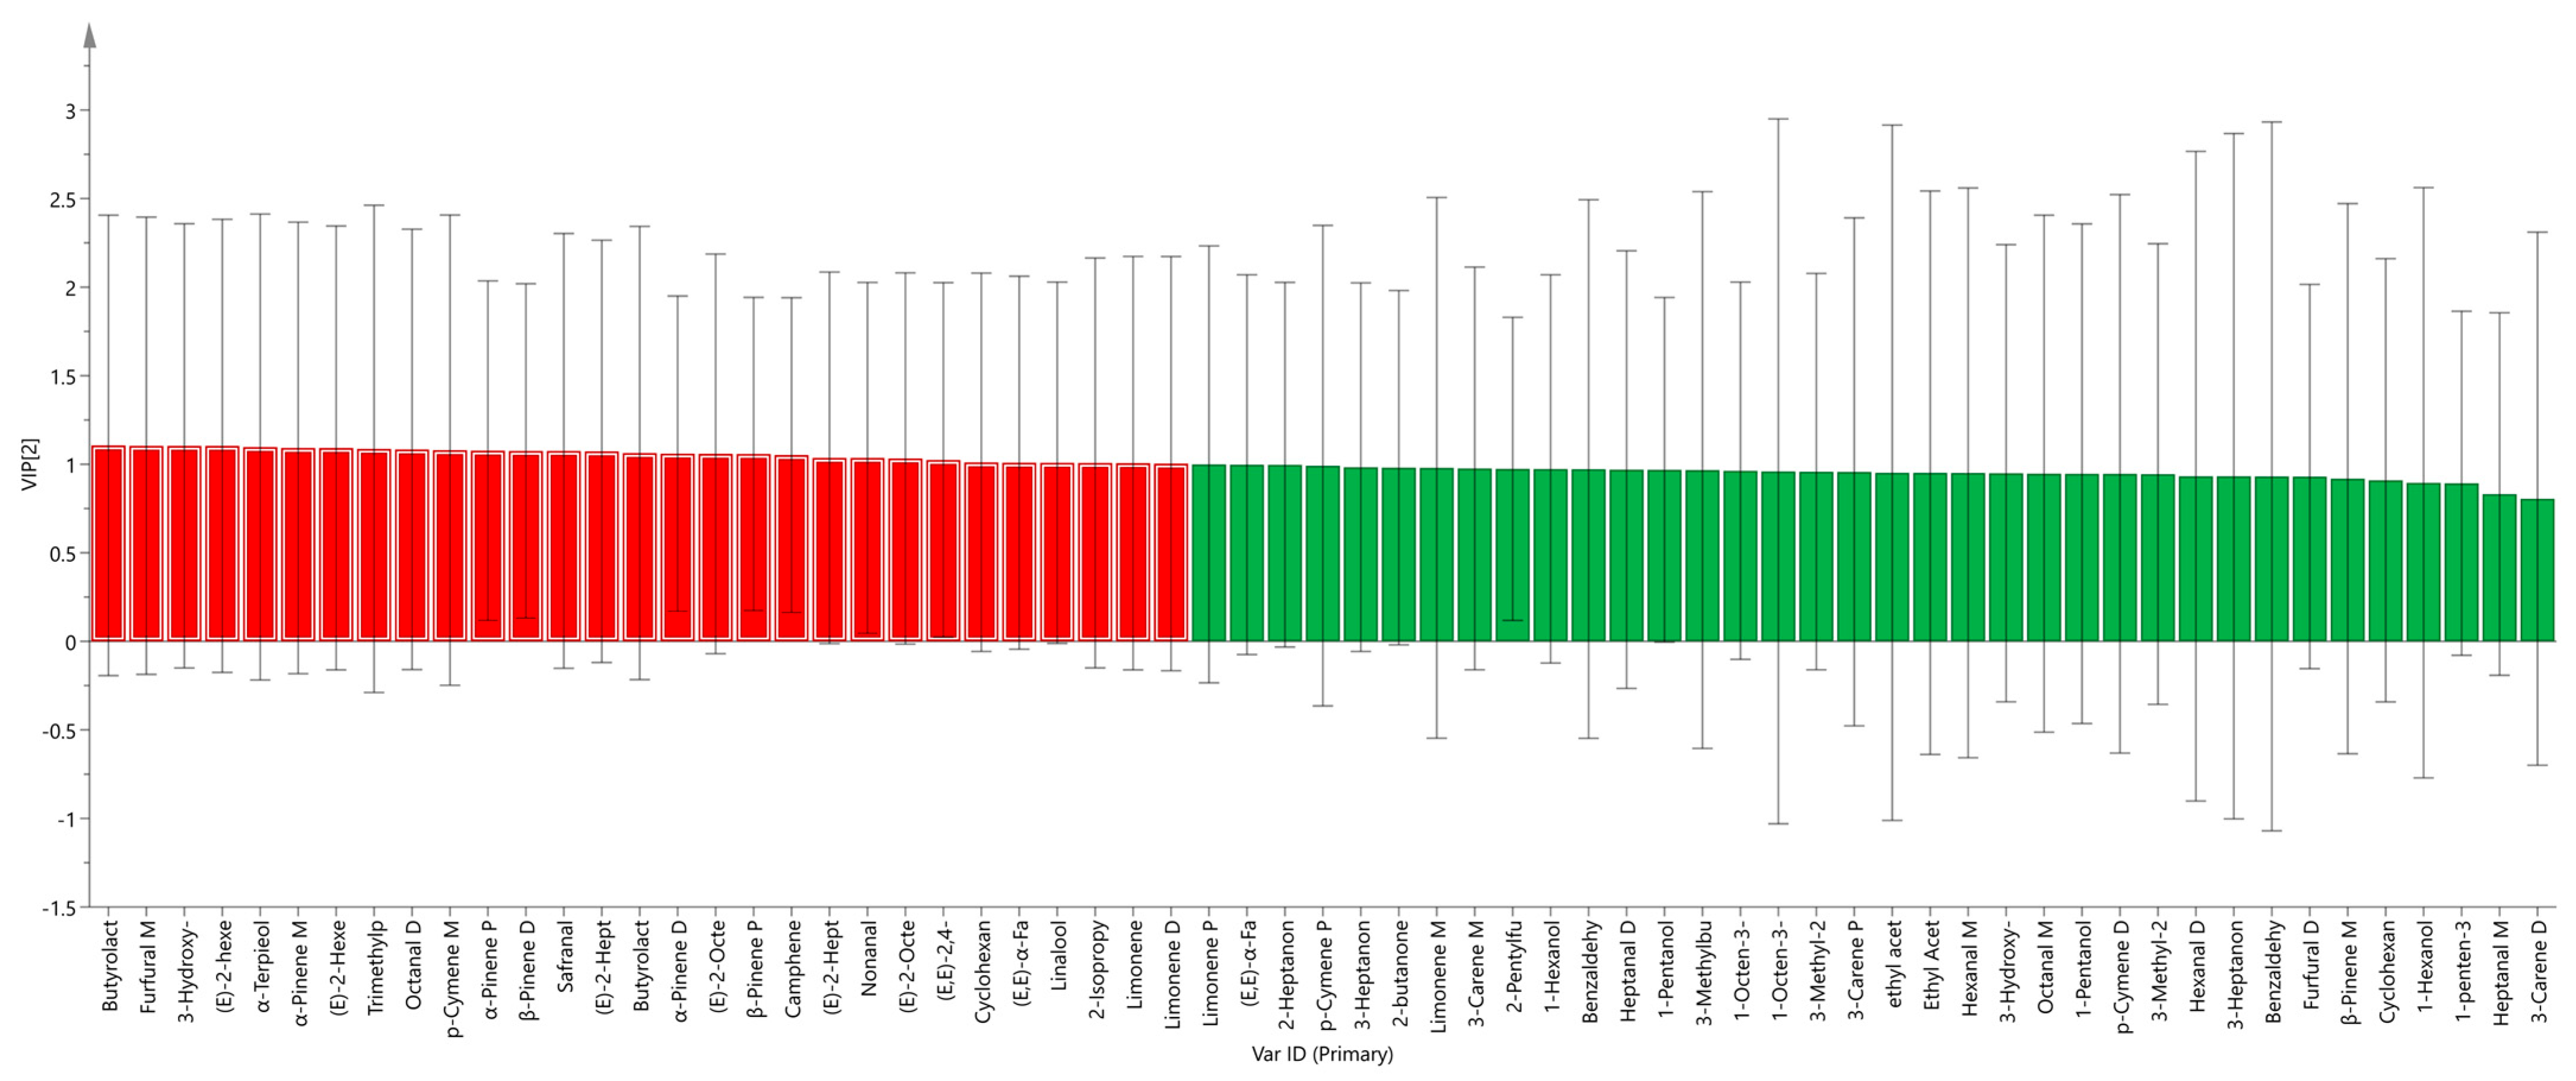
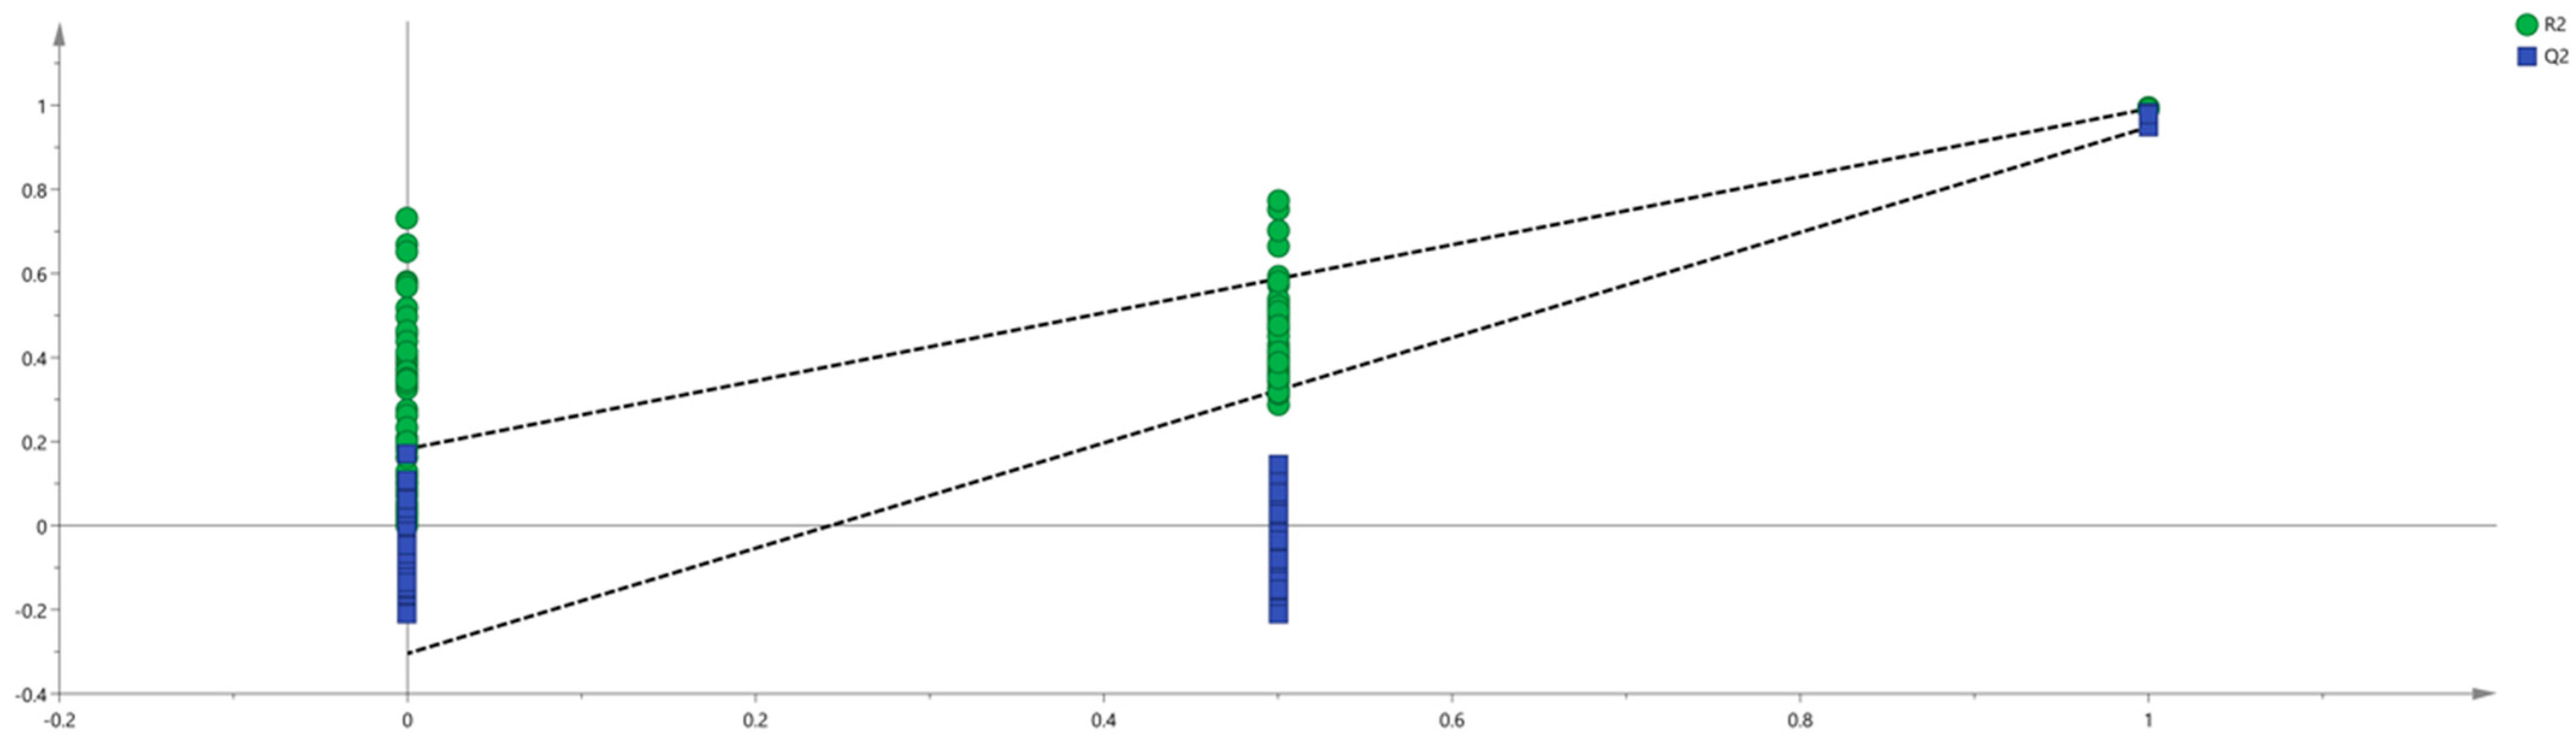
2.3.3. Partial Least-Squares Discriminant Analysis

Partial least-squares discriminant analysis (PLS-DA) is a supervised discriminant analysis method that can effectively distinguish observed values between groups, interpret observations, and predict corresponding variables [25,26]. The method’s reliability and predictive ability are evaluated using R2 and Q2. When R2 > 0.5 and Q2 > 0.5, this means that the method is reliable, and the closer R2 and Q2 are to 1, the stronger the predictive ability of the method is. In order to further distinguish the difference between main root, reed head, and fibrous root, the peak volume results of 65 VOCs from different samples were normalized, and PLS-DA scores were obtained with SIMCA software (version 14.1). The results are shown in Figure 5, where R2X = 0.957, R2Y = 0.995, and Q2 = 0.986. The distances between the three groups of samples were relatively large, indicating that there were obvious differences between the three groups, which was consistent with the conclusion drawn from PCA.
To measure the contribution of each variable, the variable important projection (VIP) of each volatile component variable was predicted based on the PLS-DA model. VIP is a parameter used to measure variable contribution to classification. Larger VIP values indicate higher contribution to classification. A VIP greater than 1 signifies substantial contribution to the discriminant model, serving as a marker screening criterion [27]. As depicted in Figure 6, a total of 29 VOCs exhibited significant contributions (indicated by the red bar chart), including (E, E)-α-Farnesene D, Safranal, α-Terpieol, Nonanal, 2-Isopropyl-3-methoxypyrazine, Linalool, (E)-2-Octenal M, (E)-2-Octenal D, p-Cymene M, Octanal D, Trimethylpyrazine, (E)-2-Heptenal D, (E)-2-Heptenal M, Cyclohexanone D, (E)-2-Hexenal M, (E)-2-hexenal D, 3-Hydroxy-2-butanone D, Furfural M, Butyrolactone M, β-Pinene D, β-Pinene P, Camphene, α-Pinene M, α-Pinene D, α-Pinene P, Butyrolactone D, Limonene D, Limonene, and (E, E)-2, 4-Decadecenal. These VOCs served as primary characteristic markers and were crucial in differentiating the samples of various parts of ginseng powder. Simultaneously, to avoid overfitting, we conducted 200 cross-validations to examine R2 and Q2 values. The steep slopes of the straight lines in Figure 7 indicate that the PLS-DA model was not overfitting (R2 = 0.219; Q2 = −0.261). The results demonstrated that the model had satisfactory predictive capability, meaning that the 29 VOCs could be used as reference indexes to identify the three parts of ginseng powder.

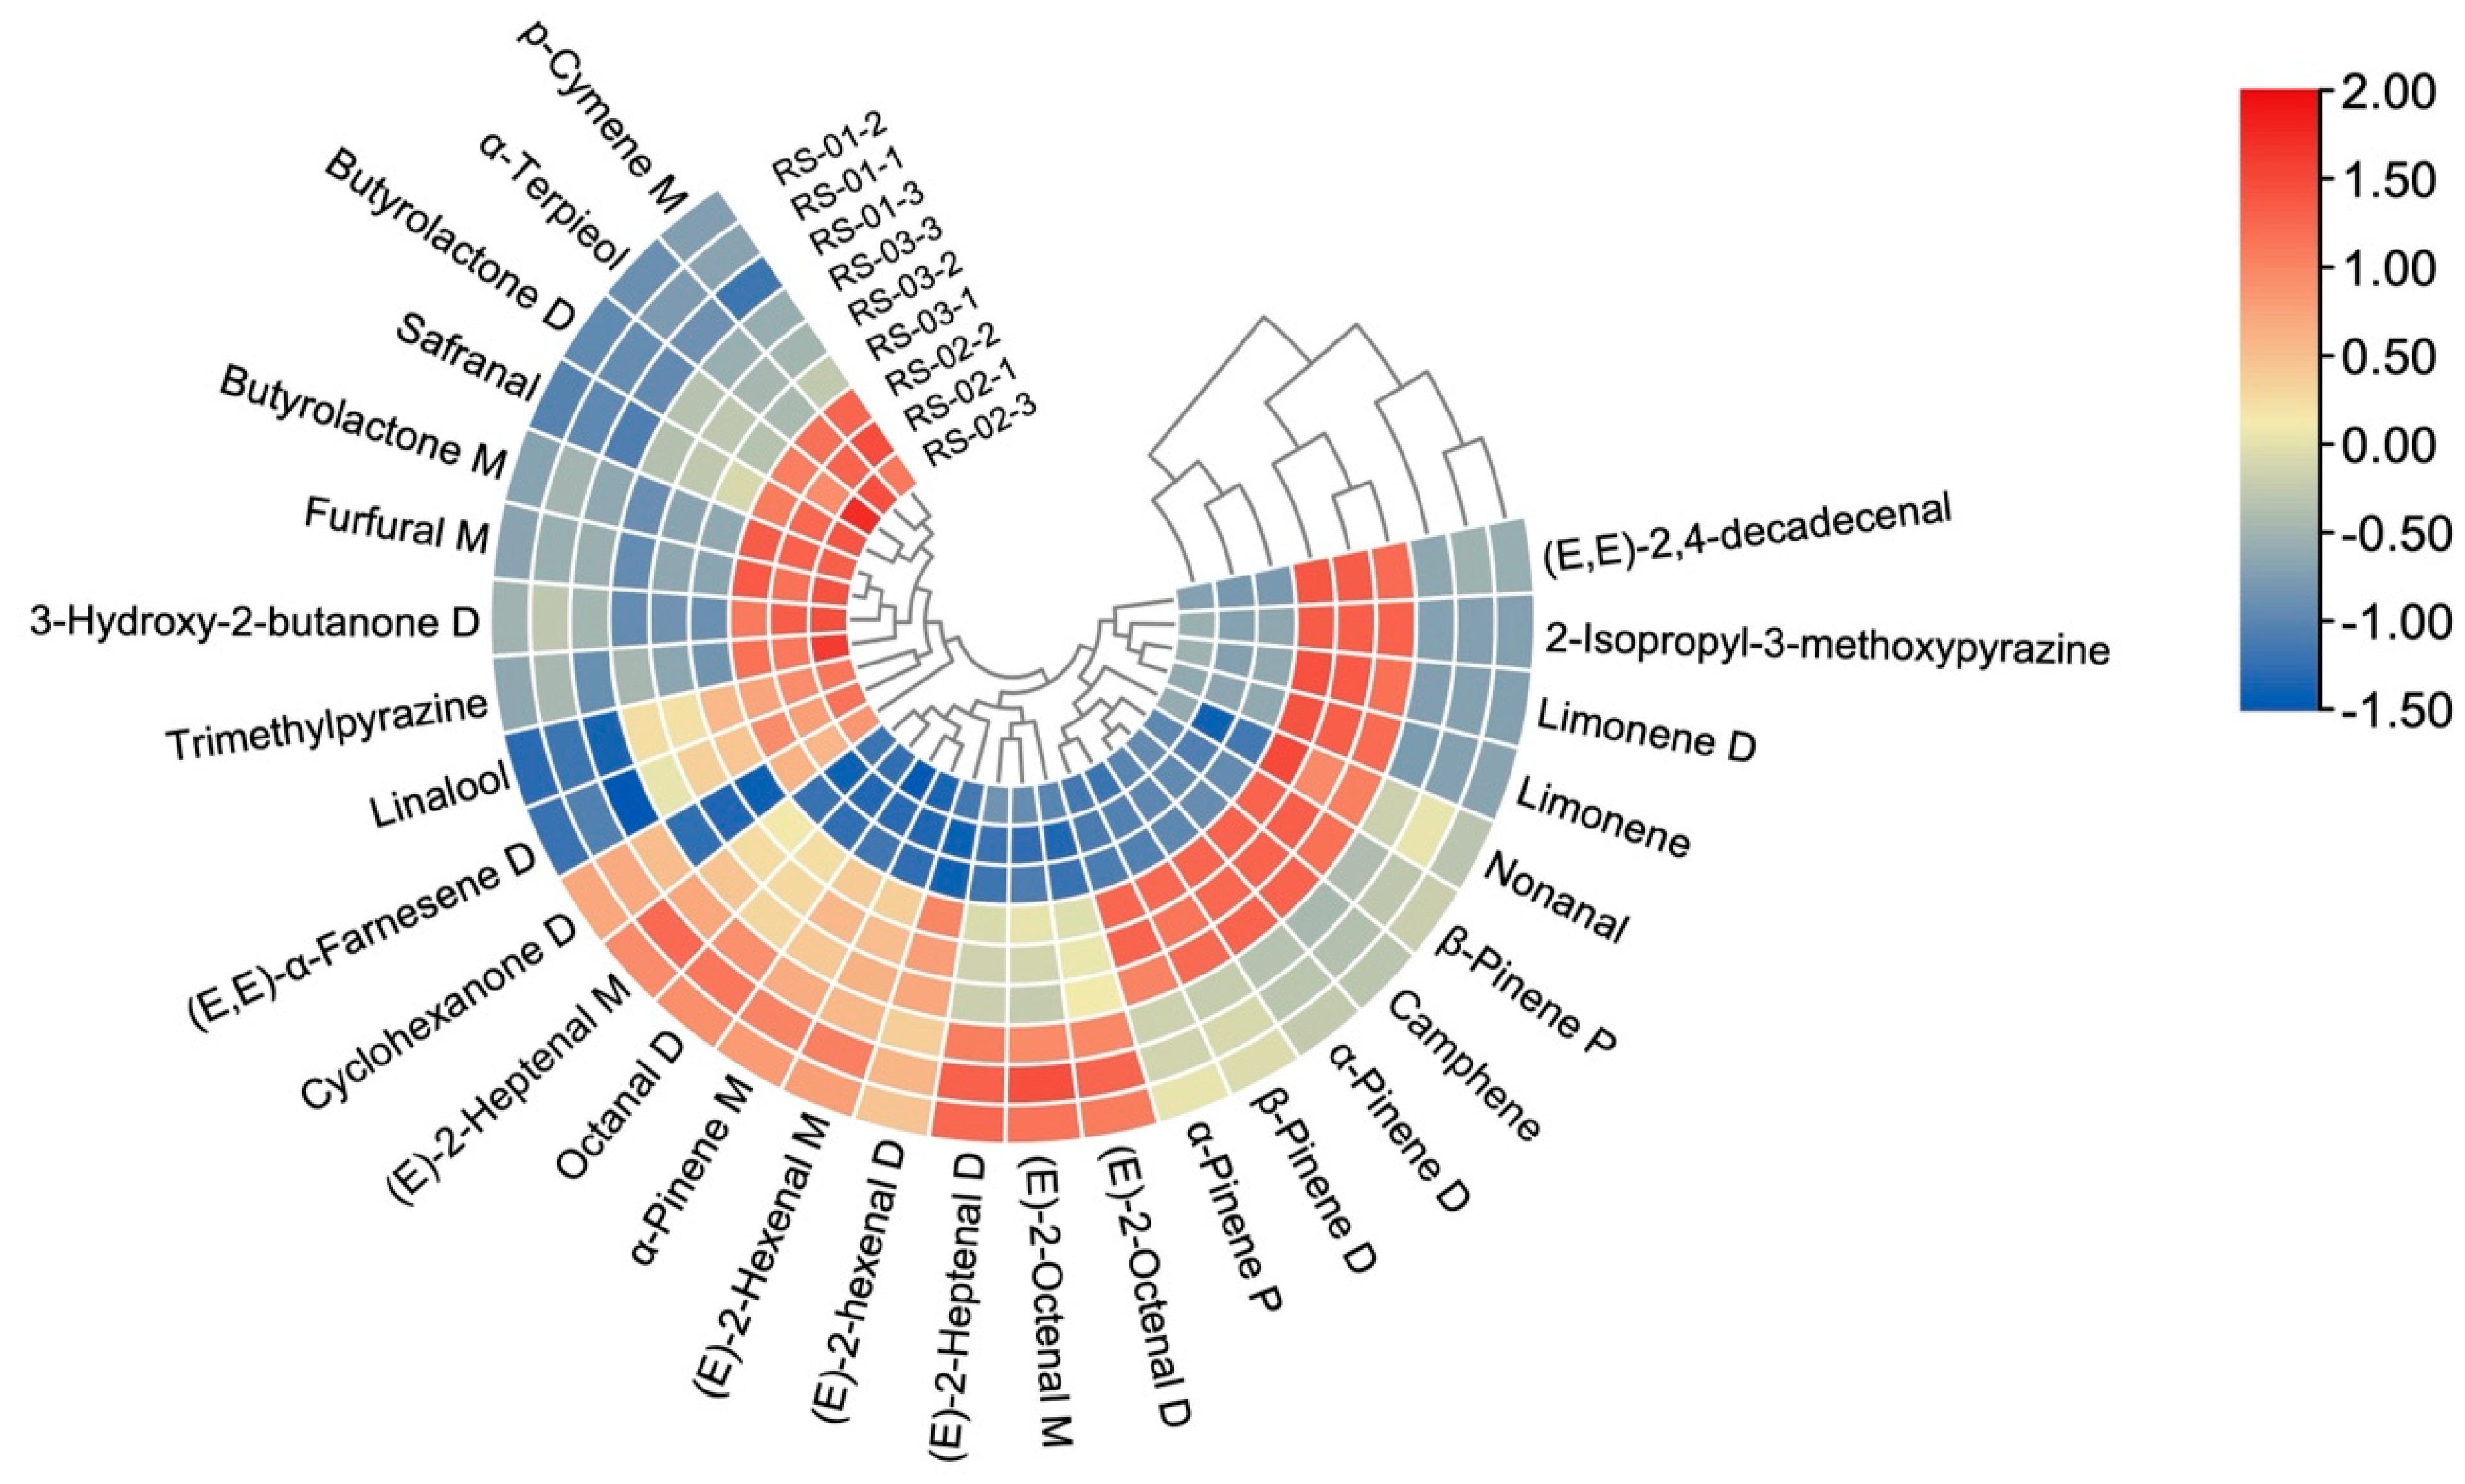
2.3.4. Cluster Analysis (CA)

Cluster analysis, a frequently employed statistical method, simplifies data aggregation and reflection by means of color changes. It can directly express data values through color depth and cluster samples with similar data [28]. To further clarify and screen out the characteristic VOCs that can be used to distinguish and identify the three different parts of ginseng powder, we imported 29 VOC peaks with VIP >1 from the three groups into TBtools software (version v2.119) for CA. The results are shown in Figure 8. The outer circle denotes the detected VOCs, while the column labels specify the ginseng sample names. The heat map displays relative values, with blue indicating lower values, and red indicating higher values. The results show that there are both similarities and differences in the content of characteristic VOCs from different parts of ginseng powder. Among them, the contents of (E)-2-Octenal M, (E)-2-Octenal D, Octanal D, (E)-2-Heptenal D, (E)-2-Heptenal M, (E)-2-Hexenal M, and α-Pinene M were higher in main root (RS-01) than in the other parts of ginseng powder. The contents of (E, E)-α-Farnesene D, Safranal, α-Terpieol, Linalool, p-Cymene M, Trimethylpyrazine, 3-Hydroxy-2-butanone D, Furfural M, Butyrolactone M, and Butyrolactone D were higher in reed head (RS-02) than in the other parts of ginseng powder. The contents of 2-Isopropyl-3-methoxypyrazine, β-Pinene D, β-Pinene P, α-Pinene D, α-Pinene P, Limonene D, Limonene, and (E, E)-2, 4-decadecenal were higher in fibrous root (RS-03) than in the other parts of ginseng powder. It is worth noting that the clustering of VOCs mostly occurs among their monomers, dimers, and polymers, indicating a strong correlation among these substances. The reason is that they may be linked together through various chemical reactions [29].
Figure 8 shows that the three ginseng parts can still be grouped and distinguished, which is consistent with the analysis results of GC–IMS fingerprint, PCA, and PLS-DA. In addition, the three ginseng parts can be broadly categorized into two groups, with the reed head (RS-02) in one, the main root (RS-01) and fibrous root (RS-03) in the other, suggesting similar characteristic VOC types and contents in the main root and fibrous root. Therefore, the 29 characteristic VOCs can effectively distinguish and identify different parts of ginseng powder and can be used as a landmark substance for identification.

3. Discussion

In the research of traditional Chinese medicine with the same homology of medicine and food, scholars have primarily focused on the active compounds in medicinal parts while overlooking non-medicinal parts. However, an increasing number of studies have demonstrated that non-medicinal parts of traditional Chinese medicine also contain substantial pharmacological elements, holding significant potential for development and utilization. For instance, the male flowers and leaves of new resource food Eucommia ulmoides exhibit a variety of pharmacological activities [30]. Therefore, through the rapid identification in different parts of plant Chinese medicine with the same homology of medicine and food, reasonable development, and utilization of its effective parts, substantial resource wastage can be mitigated, promoting sustainable resource use and development.
The major edible parts of ginseng, an important traditional Chinese medicinal herb with health care functions, are its roots and rhizomes (main roots, fibrous roots, and reed head). The price of ginseng varies by more than 10 times in three different parts. It is easy to distinguish the main root, reed head, and fibrous root from the appearance, but ginseng products are usually sold in powder form, and with different parts of the ginseng powder having a similar color and smell, it is difficult to distinguish with the naked eye or by smell. Therefore, using a simple and easy method to distinguish different parts of ginseng helps to improve their efficient utilization. As a straightforward and efficient technology with improved sensitivity and resolution, GC–IMS can precisely detect VOCs in ginseng products, showing promise in quality control, authentication, and personalized utilization. However, the application of GC–IMS in different parts of ginseng powder has not been previously reported either in China or internationally. Therefore, in this study, we carried out the content determination of VOCs in different parts of ginseng using this technique.
In our comparative analysis of VOCs in the main roots, fibrous roots, and reed head of ginseng, a total of 65 VOCs was identified using the GC–IMS method, which is rapid and sensitive, enabling the precise identification in different parts of ginseng powder. Through comparing the contents of VOCs in different parts of ginseng powder and performing PCA and Euclidean distance, we could clearly identify significant differences between them. This is mainly due to their different growth positions, developmental stages, and physiological functions in ginseng plants. The main root has a complex internal structure, including periderm, phloem, xylem, etc. It is the main part of ginseng plant, responsible for absorbing water and nutrients in the soil and supporting the growth of the whole plant. Fibrous roots have a relatively simple structure and have a large number of smaller roots growing on the main root. They are mainly responsible for increasing the absorption area of the root system and improving the absorption efficiency of water and nutrients of the plant. The reed head is the root part of ginseng, primarily connecting the main root and stem, storing nutrients, and performing other tasks.
We obtained 29 differential markers in different parts of ginseng powder using PLS-DA, and CA analysis, which has important guiding significance for rapid identification and quality control in different parts of ginseng powder. (E, E)-α-Farnesene, trimethylpyrazine, linalool, furfural M, safranal, α-terpineol, butyrolactone, and 3-hydroxy-2-butanone D were present in relatively high amounts in the reed head of ginseng. α-Farnesene is a sesquiterpene with an alkene carbon chain chemical structure, containing multiple unsaturated double bonds, which confers strong antioxidant properties [31]. The reed head of ginseng also exhibits adaptogenic effects, which include protecting myocardial cells, increasing coronary blood flow, enhancing immunity, improving the body’s energy metabolism, displaying antidiuretic properties, and inducing emesis [32]. The content of (E, E) -2, 4-decenoaldehyde, α-pinene D, β-pinene D, nonanal, limonene, 2-isopropyl-3-methoxypyrazine, and cymene was higher in the fibrous roots of ginseng. Fibrous roots have good antioxidant, immunomodulatory, anti-inflammatory, antidiabetes effects [33,34]. The content of octanal, (E)-2-heptenal, 2-pentylfuran, hexanal, (E)-2-octenal, 3-methyl-2-butenal, benzaldehyde, cyclohexanone, heptanal, 2-heptanone, amyl alcohol, and 1-octene-3-ol was higher in the main roots of ginseng. The main roots mainly have antioxidant, antiproliferative, and antigenotoxic activities [35]. In terms of market prices, the main roots of ginseng were the most expensive part, followed by the reed head of ginseng, whereas the fibrous roots of ginseng were the cheapest. Considering cost-effectiveness, anti-inflammatory, and anti-aging properties, the use of the reed head of ginseng is more advisable. Meanwhile, this study revealed certain differences in the contents of these components, which were similar in the main roots, fibrous roots, and reed head of ginseng. Among them, α-Pinene and β-Pinene, which have good antibacterial, antitumor, and antiviral activity [36], had the highest content in the fibrous roots of ginseng, and therefore consuming this part of the plant would derive antibacterial, antitumor, and antiviral benefits.
Present observations showed that GC–IMS can better characterize VOCs in the main root, reed head, and fibrous root of ginseng powder. The application of GC–IMS can better distinguish between three different parts of ginseng powder and provides a theoretical basis for the personalized development and utilization of them. This assay method can accurately identify the various parts of ginseng and provide a scientific basis and reference for a more efficient and safe utilization of ginseng resources in food and medicine.

4. Materials and Methods

4.1. Materials

Ginseng was collected from Songjiang Town, Fu song County, Baishan City, Jilin Province, China, kept in a box with ice, and transported to the laboratory within 24 h. The main root, reed head, and fibrous root were collected separately after cleaning.
The main roots, reed heads, and fibrous roots of ginseng were crushed by a grinder and sieved through an 80-mesh sieve; three kinds of sample powders were obtained, respectively, and the samples were numbered systematically as RS-01, RS-02, and RS-03.

4.2. Instruments and Equipment

Normal ketones included 2-butanone, 2-pentanone, 2-hexanone, 2-heptanone, 2-octanone, and 2-nononone (all analytically pure), Aladin Corporation, Shanghai, China. The equipment also included 20 mL headspace bottle, Shandong Haineng Scientific Instrument Co., Ltd., Shandong, China. MXT-5 capillary column (15 m × 0.53 mm, 1.0 μm), Restek, Mount EI, Pennsylvania, USA; FlavourSpec® gas-phase ion mobility spectrometer, G.A.S, Dortmund, Germany; CTC-PAL 3 static headspace automatic sampling device, CTC Analytics AG, Basel, Switzerland; and VOCal data processing software (version 0.4.03), G.A.S, Dortmund, Germany.

4.3. Analysis with GC–IMS

Firstly, 0.5 g of ginseng samples (RS-01, RS-02, and RS-03) was accurately weighed, respectively, and placed in a 20 mL headspace bottle, incubated at 70 °C and 500 rpm for 20 min. The volume of the automatic headspace injection was 500 µL, and the temperature of the injection needle was 85 °C. Then the VOCs were subjected to a chromatographic column for separation at 60 °C for 30 min. Each sample was measured in three parallel groups. The column temperature and IMS was 60 °C and 45 °C, respectively. The ionization source was tritium source (3H), and the electric field strength was 500 V/cm. High-purity N2 (purity ≥ 99.999%) was used as the carrier and drift gas. The programmed pressure increase was as follows: an initial flow rate of 2.00 mL/min was maintained for 2 min, linearly increased to 10.00 mL/min within 8 min, linearly increased to 100.00 mL/min within 10 min, and maintained for 39 min. The total chromatographic running time was 59 min. The VOCs were identified based on the RIs of standard substances in the GC–IMS library.

4.4. Statistical Analysis

The GC retention index database (NIST 2020) and IMS mobility time database built into VOCal software were used for qualitative analysis of VOCs. The Reporter (Version 11.x) and Gallery Plot (Version 1.1.0.2) were used to plot the difference map (3D spectrum, 2D spectrum, and difference spectrum) and fingerprint of different samples. Principal component analysis (PCA) and cluster analysis (CA) was carried out using dynamic PCA (version 0.0.3) and TB tools (version v2.119). SIMCA (version 14.1) software was used for partial least squares discriminant analysis (PLS-DA) to calculate the variable important projection (VIP) value.

5. Conclusions

In this study, GC–IMS was used to analyze and identify VOCs in different parts of ginseng powder, resulting in the detection of 68 VOCs. Following qualitative analysis based on the database, the chemical characteristics of 65 VOCs were identified, including monomers and dimers of some substances. It is clear that the characteristic VOCs of different parts of ginseng powder are essentially the same, but their contents are different. We employed PCA and PLS-DA theories and methodologies for analysis, establishing a discriminant model capable of differentiating between the main roots, rhizomes, and fibrous roots of ginseng powder. The characteristic markers obtained by the VIP value and CA played a key role in ginseng powder identification, providing assistance for the selection of specific raw materials for ginseng products catering to different needs. Our method not only provides an important reference for the identification and the authenticity in different edible parts of ginseng but also ensures the improvement and enhancement of the quality standards of ginseng products in the market.
However, this study has limitations: there may be significant differences in VOC content in the main root, reed head, and fibrous root of ginseng due to the different growth environment (altitude, region, etc.) and growth cycle of ginseng. In addition, the GC–IMS database is not perfect, limiting the accurate quantitative analysis and comprehensive characterization of samples. Therefore, our next step is to collect ginseng from different regions with different growth years for comprehensive evaluation.

Author Contributions

For research Conceptualization, M.Z. and X.Y.; methodology, M.Z. and X.Y.; software, Y.L. and L.Z.; validation, X.Y. and F.O.; formal analysis, M.Z. and X.Y.; investigation, L.Z. and F.O.; resources, C.L. and Y.L.; data curation, C.L.; writing—original draft preparation, M.Z. and Y.L.; writing—review and editing, C.L.; visualization, M.Z. and C.L.; supervision, C.L.; project administration, C.L.; funding acquisition, C.L. All authors have read and agreed to the published version of the manuscript.

Funding

Innovation and Entrepreneurship training plan of Hunan University of Chinese Medicine (No. 2024210), the domestic First-Class Construction Discipline of Chinese Medicine in Hunan University of Chinese Medicine (No. 2025).

Institutional Review Board Statement

Not applicable.

Informed Consent Statement

Not applicable.

Data Availability Statement

Data are contained within the article.

Conflicts of Interest

The authors declare no conflicts of interest.

References

  1. Zhang, M.; Ma, L.; Luo, J.; Ren, T.; Liu, S.; Pan, L.; Bao, Y.; Li, F.; Dai, Y.; Pi, Z.; et al. Low-Medium Polarity Ginsenosides from Wild Ginseng Improves Immunity by Activating the AhR/MAPK Pathway through Tryptophan Metabolism Driven by Gut Microbiota. J. Agric. Food Chem. 2024, 72, 26142–26154. [Google Scholar] [CrossRef] [PubMed]
  2. Ni, J.; Zhang, H.; Wang, X.; Liu, Z.; Nie, T.; Li, L.; Su, J.; Zhu, Y.; Ma, C.; Huang, Y.; et al. Rg3 regulates myocardial pyruvate metabolism via P300-mediated dihydrolipoamide dehydrogenase 2-hydroxyisobutyrylation in TAC-induced cardiac hypertrophy. Cell Death Dis. 2022, 13, 1073. [Google Scholar] [CrossRef] [PubMed]
  3. Jiao, Y.; Chen, J.; Hao, F.; Tian, M. Ginseng Pectin WGPA Alleviates Exercise-Induced Fatigue by Enhancing Gluconeogenesis. Evid. Based Complement. Alternat. Med. 2022, 2022, 7973380. [Google Scholar] [CrossRef] [PubMed]
  4. Lee, Y.M.; Yoon, H.; Park, H.M.; Song, B.C.; Yeum, K.J. Implications of red Panax ginseng in oxidative stress associated chronic diseases. J. Ginseng Res. 2017, 41, 113–119. [Google Scholar] [CrossRef]
  5. E, M.; Zhang, Z.; Ji, P.; Liu, Q.; Qi, H.; Hou, T.; Su, H.; Wang, Z.; Li, X. A novel mechanism of major ginsenosides from Panax ginseng against multiple organ aging in middle-aged mice: Phosphatidylcholine-myo-inositol metabolism based on metabolomic analysis. Biochem. Biophys. Res. Commun. 2024, 719, 150027. [Google Scholar] [CrossRef]
  6. Dong, L.; Wang, Y.; Lv, J.; Zhang, H.; Jiang, N.; Lu, C.; Xu, P.; Liu, X. Memory enhancement of fresh ginseng on deficits induced by chronic restraint stress in mice. Nutr. Neurosci. 2019, 22, 235–242. [Google Scholar] [CrossRef]
  7. Valdés-González, J.A.; Sánchez, M.; Moratilla-Rivera, I.; Iglesias, I.; Gómez-Serranillos, M.P. Immunomodulatory, Anti-Inflammatory, and Anti-Cancer Properties of Ginseng: A Pharmacological Update. Molecules. 2023, 28, 3863. [Google Scholar] [CrossRef]
  8. Mao, Y.M.; Li, K.Q.; Zhao, D.Q.; Huang, B.T.; Li, J.Q.; Liu, L.; Qi, B. Analysis of ginsenosides in different parts of ginseng by HPLC and chemometry. J. Chin. Med. Mater. 2022, 45, 2442–2447. [Google Scholar] [CrossRef]
  9. Cui, L.L.; Zhao, H.; Song, J.; Yan, M.X.; Luo, J.; Fen, Z.W.; Chen, X.; Dong, X.Y.; Wang, L.Y.; Su, L.M.; et al. Study on the Difference of Volatile Compounds in Underground Parts of Dried Raw Ginseng and Red Ginseng. Spec. Wild Econ. Anim. Plant Res. 2022, 44, 101–106. [Google Scholar] [CrossRef]
  10. Christmann, J.; Rohn, S.; Weller, P. gc-ims-tools-A new Python package for chemometric analysis of GC-IMS data. Food Chem. 2022, 394, 133476. [Google Scholar] [CrossRef]
  11. Capitain, C.; Weller, P. Non-Targeted Screening Approaches for Profiling of Volatile Organic Compounds Based on Gas Chromatography-Ion Mobility Spectroscopy (GC-IMS) and Machine Learning. Molecules. 2021, 26, 5457. [Google Scholar] [CrossRef] [PubMed]
  12. Duan, H.; Zhou, Y.; Wang, D.; Yan, W. Differences in Volatile Organic Compounds in Rhizoma gastrodiae(Tian Ma) of Different Origins Determined by HS-GC-IMS. Molecules. 2023, 28, 4883. [Google Scholar] [CrossRef] [PubMed]
  13. Wang, S.; Chen, H.; Sun, B. Recent progress in food flavor analysis using gas chromatography-ion mobility spectrometry (GC-IMS). Food Chem. 2020, 315, 126158. [Google Scholar] [CrossRef]
  14. Zhu, H.; Zhu, D.; Sun, J. Application of GC-IMS coupled with chemometric analysis for the classification and authentication of geographical indication agricultural products and food. Front. Nutr. 2023, 10, 1247695. [Google Scholar] [CrossRef]
  15. Qian, J.; Jiang, Y.; Hu, H. Ginsenosides: An immunomodulator for the treatment of colorectal cancer. Front. Pharmacol. 2024, 15, 1408993. [Google Scholar] [CrossRef]
  16. Xia, D.; Wang, S.; Wu, K.; Li, N.; Fan, W. Ginsenosides and Tumors: A Comprehensive and Visualized Analysis of Research Hotspots and Antitumor Mechanisms. J. Cancer. 2024, 15, 671–684. [Google Scholar] [CrossRef]
  17. Liu, Q.; Zhang, Z.; Ji, P.; Liu, J.; Chen, B.; E, M.; Qi, H.; Hou, T.; Huang, Q.; Ding, L.; et al. Ginseng polysaccharide components attenuate obesity and liver lipid accumulation by regulating fecal microbiota and hepatic lysine degradation. Int. J. Biol. Macromol. 2024, 269, 131872. [Google Scholar] [CrossRef]
  18. SONG, Q. Research progress on chemical constituents of Panax ginseng and their pharmacological effects. Ginseng Res. 2017, 29, 47–54. [Google Scholar] [CrossRef]
  19. Han, H.J.; Kim, H.Y.; Choi, J.J.; Ahn, S.Y.; Lee, S.H.; Oh, K.W.; Kim, S.Y. Effects of red ginseng extract on sleeping behaviors in human volunteers. J. Ethnopharmacol. 2013, 149, 597–599. [Google Scholar] [CrossRef]
  20. Chaparala, A.; Poudyal, D.; Tashkandi, H.; Witalison, E.E.; Chumanevich, A.A.; Hofseth, J.L.; Nguyen, I.; Hardy, O.; Pittman, D.L.; Wyatt, M.D.; et al. Panaxynol, a bioactive component of American ginseng, targets macrophages and suppresses colitis in mice. Oncotarget. 2020, 11, 2026–2036. [Google Scholar] [CrossRef]
  21. Zhang, L.; Ravipati, A.S.; Koyyalamudi, S.R.; Jeong, S.C.; Reddy, N.; Bartlett, J.; Smith, P.T.; de la Cruz, M.; Monteiro, M.C.; Melguizo, A.; et al. Anti-fungal and anti-bacterial activities of ethanol extracts of selected traditional Chinese medicinal herbs. Asian Pac. J. Trop. Med. 2013, 6, 673–681. [Google Scholar] [CrossRef] [PubMed]
  22. Jang, J.H. Principal component analysis of hybrid functional and vector data. Stat. Med. 2021, 40, 5152–5173. [Google Scholar] [CrossRef] [PubMed]
  23. Xiang, Y.; Zou, M.; Ou, F.; Zhu, L.; Xu, Y.; Zhou, Q.; Lei, C. A Comparison of the Impacts of Different Drying Methods on the Volatile Organic Compounds in Ginseng. Molecules. 2024, 29, 5235. [Google Scholar] [CrossRef]
  24. Xiang, Y.; Lei, C.; Hu, G.; Zhou, W.; Li, Y.; Huang, D. Investigation of 60Co Irradiation on the Volatile Organic Compounds from Finger Citron (Citri Sarcodactylis Fructus) Using GC–IMS. Foods. 2023, 12, 3543. [Google Scholar] [CrossRef]
  25. Ruiz-Perez, D.; Guan, H.; Madhivanan, P.; Mathee, K.; Narasimhan, G. So you think you can PLS-DA? BMC Bioinform. 2020, 21, 2. [Google Scholar] [CrossRef]
  26. Liu, H.; Yu, Y.; Zou, B.; Yu, Y.; Yang, J.; Xu, Y.; Chen, X.; Yang, F. Evaluation of Dynamic Changes and Regularity of Volatile Flavor Compounds for Different Green Plum (Prunus mume Sieb. et Zucc) Varieties during the Ripening Process by HS-GC–IMS with PLS-DA. Foods. 2023, 12, 551. [Google Scholar] [CrossRef]
  27. Sun, P.; Lin, S.; Li, X.; Li, D. Different stages of flavor variations among canned Antarctic krill (Euphausia superba): Based on GC-IMS and PLS-DA. Food Chem. 2024, 459, 140465. [Google Scholar] [CrossRef]
  28. Ma, J.; Qi, Y.; Lei, M.; Xuan, H.; Li, X.; Lu, W.; Guo, J.; Chen, H. Analysis and discrimination of adhesive species using ATR-FTIR combined with Raman, and HS-GC-IMS together with multivariate statistical analysis. J. Chromatogr. A. 2024, 1736, 465402. [Google Scholar] [CrossRef] [PubMed]
  29. Feng, H.; Deng, S.Y.; Han, Y.Y.; Mu, W.L.; Ma, D.Z.; Lin, H.; Wang, H.; Li, Z.X. Comparison of volatile components of 7 kinds of commercial smoked fish via headspace-gas chromatography-ion mobility spectrometry. J. Food Saf. Qual. 2023, 14, 183–190. [Google Scholar] [CrossRef]
  30. Luo, J.; Zhang, R.Y.; Tian, X. The Active Ingredients and Pharmacological Effects of Eucommia ulmoides and the Application of Its Different Parts in Food Field. Farm. Prod. Process. 2024, 8, 94–98. [Google Scholar] [CrossRef]
  31. Li, Y.L.; Zhang, S.Y.; Dong, Y. Effect of Preharvest 1-Methylcyclopene Application on Superficial Scald and Antioxidant Capacity of ‘Bartlett’ Pears during Shelf Life. Food Sci. 2021, 42, 250–256. [Google Scholar] [CrossRef]
  32. Jia, C.L.; Zhang, X.M.; Xu, G.Y.; Zhao, K.J.; Guan, M. Progress of Origin and Clinical Application of Ginseng. Eval. Anal. Drug-Use Hosp. China 2023, 23, 123–128. [Google Scholar] [CrossRef]
  33. Zhang, P.; Zhang, D.; Ma, C.; Wang, R.; Wang, W. Free Radical Scavenging Effect and Immunomodulatory Activity of Total Saponins Extract of Ginseng Fibrous Roots. Molecules. 2024, 29, 2770. [Google Scholar] [CrossRef] [PubMed]
  34. Ye, A.Q.; Zhao, X.; Zhang, Y.W.; Li, L.; Cheng, L.Q. Preparation of Ginsenosides 20(S, R)-Rg3 and Rg5 from Ginseng Root Powder Catalyzed by Natural Lemon Juice. Food Res. Dev. 2021, 42, 68–74. [Google Scholar] [CrossRef]
  35. Seo, B.Y.; Choi, M.J.; Kim, J.S.; Park, E. Comparative Analysis of Ginsenoside Profiles: Antioxidant, Antiproliferative, and Antigenotoxic Activities of Ginseng Extracts of Fine and Main Roots. Prev. Nutr. Food Sci. 2019, 24, 128–135. [Google Scholar] [CrossRef]
  36. Salehi, B.; Upadhyay, S.; Erdogan Orhan, I.; Kumar Jugran, A.; LDJayaweera, S.; ADias, D.; Sharopov, F.; Taheri, Y.; Martins, N.; Baghalpour, N.; et al. Therapeutic Potential of α-and β-Pinene: A Miracle Gift of Nature. Biomolecules. 2019, 9, 738. [Google Scholar] [CrossRef]
Figure 1. Three-dimensional (a), two-dimensional (b), and comparative map (c) of VOCs in different parts of ginseng powder.
Molecules 30 01965 g001aMolecules 30 01965 g001b
Figure 2. Fingerprints in different parts of ginseng powder.
Molecules 30 01965 g002
Figure 3. Results of the PCA analysis in different parts of ginseng powder.
Molecules 30 01965 g003
Figure 4. Fingerprint similarity based on Euclidean distance from different parts of ginseng powder.
Molecules 30 01965 g004
Figure 5. PLS−DA analysis of VOCs in different parts of ginseng powder.
Molecules 30 01965 g005
Figure 6. VIP values of the characteristic variables.
Molecules 30 01965 g006
Figure 7. Permutation test results of VOCs in different parts of ginseng powder.
Molecules 30 01965 g007
Figure 8. Cluster heat map of VOCs in different parts of ginseng powder.
Molecules 30 01965 g008
Table 1. Results of the qualitative analysis of different parts of ginseng powder.
NoCompoundsCAS#FormulaRIRt/sDt/msOdor Description
1(E, E)-α-Farnesene DC502614C15H241487.12464.6541.48579Citrus, herbal, lavender, bergamot, myrrh, neroli, green
2(E, E)-α-Farnesene MC502614C15H241485.72454.6041.42258Citrus, herbal, lavender, bergamot, myrrh, neroli, green
3SafranalC116267C10H14O1208.91077.3301.28714herbal, phenolic, tobacco, spicy
4α-TerpieolC10482561C10H18O1188.81014.8451.28968floral, lilac, terpenic
5NonanalC124196C9H18O1104.8790.4761.49418rose, citrus, strong oily
62-Isopropyl-3-methoxypyrazineC25773404C8H12N2O1095.1768.1101.25062mung, bean
7LinaloolC78706C10H18O1086.2748.0991.21862citrus, rose, woody, blueberry
8(E)-2-Octenal MC2548870C8H14O1065.5703.3661.32707fresh cucumber, fatty, green herbal, banana, green leaf
9(E)-2-Octenal DC2548870C8H14O1065.5703.3661.82308fresh cucumber, fatty, green herbal, banana, green leaf
10p-Cymene MC99876C10H141020.4615.0791.21506fresh, citrus, terpene, woody, spice
11p-Cymene DC99876C10H141021.1616.2561.31284fresh, citrus, terpene, woody, spice
12p-Cymene PC99876C10H141017.8610.3711.72530fresh, citrus, terpene, woody, spice
13Octanal DC124130C8H16O1013.9603.3081.81241aldehyde, waxy, citrus, orange, fruity, fatty
14Octanal MC124130C8H16O1008.0592.7131.41418aldehyde, waxy, citrus, orange, fruity, fatty
15TrimethylpyrazineC14667551C7H10N21000.5579.6801.16306roasted potato, peanut, cocoa, chocolate
161-Octen-3-ol DC3391864C8H16O983.8545.9351.59477mushroom, lavender, rose, hay
17Benzaldehyde MC100527C7H6O961.9502.3471.15250bitter almond, cherry, nutty
18Benzaldehyde DC100527C7H6O961.9502.3471.46539bitter almond, cherry, nutty
19(E)-2-Heptenal DC18829555C7H12O959.7498.1281.66210spicy, green vegetables, fresh, fatty
20(E)-2-Heptenal MC18829555C7H12O957.8494.6131.25811spicy, green vegetables, fresh, fatty
21Heptanal DC111717C7H14O899.9396.8911.69906fresh, aldehyde, fatty, green herbs, wine, fruity
22Heptanal MC111717C7H14O902.7401.1091.35053fresh, aldehyde, fatty, green herbs, wine, fruity
23Cyclohexanone DC108941C6H10O893.3387.0491.44426strong pungent, earthy
24Cyclohexanone MC108941C6H10O892.3385.6431.15646strong pungent, earthy
251-Hexanol MC111273C6H14O869.7354.7091.32808fresh, fruity, wine, sweet, green
261-Hexanol DC111273C6H14O867.2351.4471.64167fresh, fruity, wine, sweet, green
27(E)-2-Hexenal MC6728263C6H10O853.9334.5441.17881green, banana, fat
28(E)-2-hexenal DC6728263C6H10O849.1328.5691.51598green, banana, fat
29Hexanal DC66251C6H12O797.3271.2101.55279fresh, green, fat, fruity
30Hexanal MC66251C6H12O800.8274.7951.26863fresh, green, fat, fruity
311-Pentanol DC71410C5H12O767.1241.3351.52334balsamic
321-Pentanol MC71410C5H12O768.4242.5301.24801balsamic
333-MethylbutanalC590863C5H10O668.3164.9791.40801chocolate, fat
34Ethyl Acetate DC141786C4H8O2628.6144.9101.33439fresh, fruity, sweet, grassy
35ethyl acetate MC141786C4H8O2633.5147.2261.09980fresh, fruity, sweet, grassy
363-Hydroxy-2-butanone DC513860C4H8O2715.4196.2401.32556butter, cream
373-Hydroxy-2-butanone MC513860C4H8O2722.2201.6441.07231butter, cream
38Furfural DC98011C5H4O2831.1307.3931.33734sweet, woody, almond, bready
39Furfural MC98011C5H4O2829.0305.0771.08507sweet, woody, almond, bready
40Butyrolactone MC96480C4H6O2918.2425.4691.08166cream, fat, caramel
41β-Pinene MC127913C10H16977.3532.6261.21289resin, green
42β-Pinene DC127913C10H16976.0529.8561.29733resin, green
43β-Pinene PC127913C10H16975.0528.0091.63287resin, green
44CampheneC79925C10H16952.5484.6051.20951woody, camphor
45α-Pinene MC80568C10H16932.7449.6501.21413fresh, camphor, sweet, pine wood
46α-Pinene DC80568C10H16934.0451.7271.67103fresh, camphor, sweet, pine wood
47α-Pinene PC80568C10H16934.3452.2461.72246fresh, camphor, sweet, pine wood
483-Methyl-2-butenal DC107868C5H8O786.0260.1701.35635fruity
493-Methyl-2-butenal MC107868C5H8O779.3253.4221.08907fruity
501-penten-3-oneC1629589C5H8O667.2164.3891.30212strong pungent odors
512-butanoneC78933C4H8O601.2132.4941.23571fruity, camphor
522-Heptanone MC110430C7H14O885.6376.1571.26226pear, banana, fruity, slight medicinal fragrance
533-Heptanone DC106354C7H14O889.3381.3151.62728Fruity, Grass, Oil
54Butyrolactone DC96480C4H6O2917.2423.8681.29782cream, fat, caramel
55Limonene MC138863C10H161039.9651.8781.21338lemon, sweet, orange, pine oil
56Limonene DC138863C10H161038.1648.3501.29803lemon, sweet, orange, pine oil
57LimoneneC138863C10H161038.5649.0551.6614lemon, sweet, orange, pine oil
58Limonene PC138863C10H161038.5649.0551.72667lemon, sweet, orange, pine oil
592-PentylfuranC3777693C9H14O996.3572.4131.25131bean, fruity, earthy, green, vegetable
603-Carene MC13466789C10H16997.9575.1751.21279citrus, lemon, woody
613-Carene DC13466789C10H16995.3570.2041.30035citrus, lemon, woody
623-Carene PC13466789C10H16995.5570.7561.71712citrus, lemon, woody
631-Octen-3-ol MC3391864C8H16O985.8550.1111.15382mushroom, lavender, rose, hay
643-Heptanone MC106354C7H14O899.9396.8921.19904fruity, grass, oil
65(E, E)-2,4-decadecenalC25152845C10H16O1331.61552.1471.42880cucumber, melon, citrus, pumpkin, nutty
Note: The suffixes M, D, or P denote the monomer, dimer, and polymer of the same substance. The software’s descriptions of the substances’ odors primarily draw from the databases of https://www.flavornet.org (accessed on 15 May 2024), https://www.femaflavor.org (accessed on 15 May 2024) and https://www.chemicalbook.com (accessed on 15 May 2024).
Disclaimer/Publisher’s Note: The statements, opinions and data contained in all publications are solely those of the individual author(s) and contributor(s) and not of MDPI and/or the editor(s). MDPI and/or the editor(s) disclaim responsibility for any injury to people or property resulting from any ideas, methods, instructions or products referred to in the content.

