Article

Unambiguous Determination of Benzo[a]pyrene and Dibenzo[a,l]pyrene in HPLC Fractions via Room-Temperature Fluorescence Excitation–Emission Matrices

by
George T. Knecht
1,
Stephanie D. Nauth
1,
Juan C. Gomez Alvarado
1,
Anthony M. Santana
1,
Hector C. Goicoechea
2,3 and
Andres D. Campiglia
1,*
1
Department of Chemistry, University of Central Florida, Physical Sciences Building, 4111, Orlando, FL 32816, USA
2
Laboratorio de Desarrollo Analítico y Quimiometría, Catedra de Química Analítica I, Facultad de Bioquímica y Ciencias Biológicas, Universidad Nacional del Litoral, Ciudad Universitaria, Santa Fe 3000, Argentina
3
Consejo Nacional de Investigacioes Científicas y Técnicas (CONICET), Godoy Cruz 2290, Buenos Aires CP C1425FQB, Argentina
*
Author to whom correspondence should be addressed.
Molecules 2025, 30(7), 1550; https://doi.org/10.3390/molecules30071550
Submission received: 16 March 2025 / Revised: 27 March 2025 / Accepted: 29 March 2025 / Published: 31 March 2025

Abstract

:
When high-performance liquid chromatography (HPLC) is used for the analysis of polycyclic aromatic hydrocarbons (PAHs) in complex samples, further examination of HPLC fractions is recommended to confirm PAH assignments solely based on retention times. Gas chromatography–mass spectrometry (GC-MS) has been particularly relevant in the unambiguous determination of PAHs with remarkably similar retention times. The combination of HPLC and GC requires lengthy analysis times to ensure proper assignments. This article presents an approach for the analysis of co-eluted PAHs with no need for further chromatographic separation. Benzo[a]pyrene (BaP) and dibenzo[a,l]pyrene (DBalP) were directly determined in a co-eluted HPLC fraction via room-temperature fluorescence excitation–emission matrices (RTF-EEMs). RTF-EEMs can be recorded in a matter of seconds with a spectrofluorometer equipped with a multichannel detection system. The spectral overlapping of BaP and DBalP was resolved using parallel factor analysis (PARAFAC). The analytical advantages of this approach were demonstrated with the trace analysis (ng/mL) of these two PAHs in pre-concentrated tobacco extracts.

Graphical Abstract

1. Introduction

HPLC is a popular approach to the qualitative and quantitative analysis of polycyclic aromatic compounds in many scientific fields. Commercial instrumentation for the HPLC analysis of PAHs is usually equipped with ultraviolet–visible (UV-VIS) and/or fluorescence (FL) detectors. Although multichannel detectors with on-the-fly spectral scanning capabilities are intrinsically more selective than single-channel detectors, they lack specificity for the unambiguous identification of co-eluted compounds. This is particularly true for the analysis of PAHs with similar HPLC retention behaviors and, therefore, results in almost identical retention times [1,2,3]. The unambiguous identification of co-eluted PAHs often requires further analysis of the co-eluted HPLC fractions with a supporting analytical technique such as GC-MS. Unfortunately, the combination of HPLC and GC requires costly experimental procedures with rather lengthy analysis times to ensure proper PAH assignments.
Due to their ubiquitous occurrence and extreme eco-toxicological relevance, the U.S. Environmental Protection Agency (EPA) recommends the routine monitoring of sixteen PAHs with molecular masses (MMs) ranging from 128 Da to 278 Da. These include naphthalene, acenaphthene, acenaphthylene, fluorene, phenanthrene, anthracene, fluoranthene, pyrene, benzo[a]anthracene, chrysene, benzo[b]fluoranthene, benzo[k]fluoranthene, BaP, dibenzo[a,h]anthracene, benzo[g,h,i]perylene, and indeno[1,2,3-cd]pyrene. According to the International Agency for Research on Cancer (IARC), BaP has the highest cancer risk among the EPA PAHs [4].
In addition to the sixteen priority pollutants, the toxicity of PAH-contaminated samples is attributed to the presence of high-molecular-weight PAHs (HMW-PAHs), i.e., PAHs with an MM greater than 300 Da. As a matter of fact, certain PAHs with an MM of 302 Da have shown higher toxicity than the sixteen EPA PAHs. These include DBalP, which is the most potent carcinogenic PAH known to date [5,6,7,8]. Its toxicity is approximately 100 times the toxicity of BaP. Thus, unambiguous identification of DBalP in contaminated samples is extremely relevant even if it is present at lower concentrations than other PAHs.
In a recent article, Campiglia and co-workers applied EPA Method 610 to the HPLC analysis of 15 EPA PAHs and 10 HMW-PAHs with an MM of 302 Da from tobacco [9]. Except for DBalP, all the 302 Da isomers showed the expected chromatographic behaviors under reversed-phase conditions, i.e., they eluted later than the EPA PAHs from the chromatographic column due to the stronger affinities for the octadecyl stationary phase [2]. DBalP co-eluted with BaP and therefore, eluted earlier than three heaviest EPA PAHs, namely dibenzo[a,h]anthracene, benzo[g,h,i]perylene, and indeno[1,2,3-cd]pyrene.
The unambiguous determination of DBalP and BaP in HPLC fractions was then accomplished via Laser-Excited Time-Resolved Shpol’skii Spectroscopy (LETRSS) [9]. The two PAHs were collected within their time-window of HPLC elution (29-32 min). The mobile phase (acetonitrile) was evaporated to dryness and the residue was reconstituted in 1mL of octane. The LETRSS analysis was carried out at 77 K with the aid of a cryogenic fiber optic probe and an instrumental set-up that was built in-house for time-resolved laser-induced fluorescence measurements. Wavelength time matrices (WTMs) were collected from the frozen samples to obtain line-narrowed spectra and fluorescence lifetimes resulting in the unambiguous determination of BaP and DBalP.
The present study proposes a straightforward approach to the analysis of these two PAHs in HPLC fractions. It consists of pouring the HPLC fraction directly into a quartz cuvette to record RTF-EEMs using a commercial spectrofluorometer. Since the spectrofluorometer is equipped with a spectrograph and a charge-coupled device (CCD), recording RT-EEMs from HPLC fractions only takes a few seconds per sample. Spectral deconvolution was accomplished with PARAFAC. Although this algorithm has been applied to the analysis of several EPA PAHs via RTF [10,11,12,13,14,15,16,17], our literature search did not find any reports of the application of PARAFAC for the unambiguous determination of BaP and DBalP in HPLC fractions. The same was true for the analysis of these two PAHs in tobacco samples. Although B[a]P has been found in a variety of tobacco products and cigarette smoke, there are no reports that detected the presence of DBalP using chromatographic methods [18,19,20,21]. This is rather intriguing, particularly if one considers the incomplete combustion of tobacco during the smoking process. The straightforward experimental procedure, the excellent analytical figures of merit, and the accuracy of the analysis presented here make this approach a robust alternative for the routine analysis of BaP and DBalP in tobacco samples.

2. Results and Discussion

Figure 1 shows a typical chromatogram of a standard mixture containing the 25 studied PAHs [9]. The co-elution of BaP and DBalP occurred between an elution time of approximately 30 and 32 min, and it was further confirmed by the statistical equivalence (P ≥ 98%; n1 = n2= 3) [22] of their retention times (tRBaP = 30.9 ± 0.3 min; tRDBalP = 31.8 ± 0.3 min). Considering the experimental simplicity of pouring the HPLC fraction into a cuvette for measurements using a spectrofluorometer, we studied the RTF features of BaP and DBalP in acetonitrile, i.e., the mobile phase of the HPLC separation.

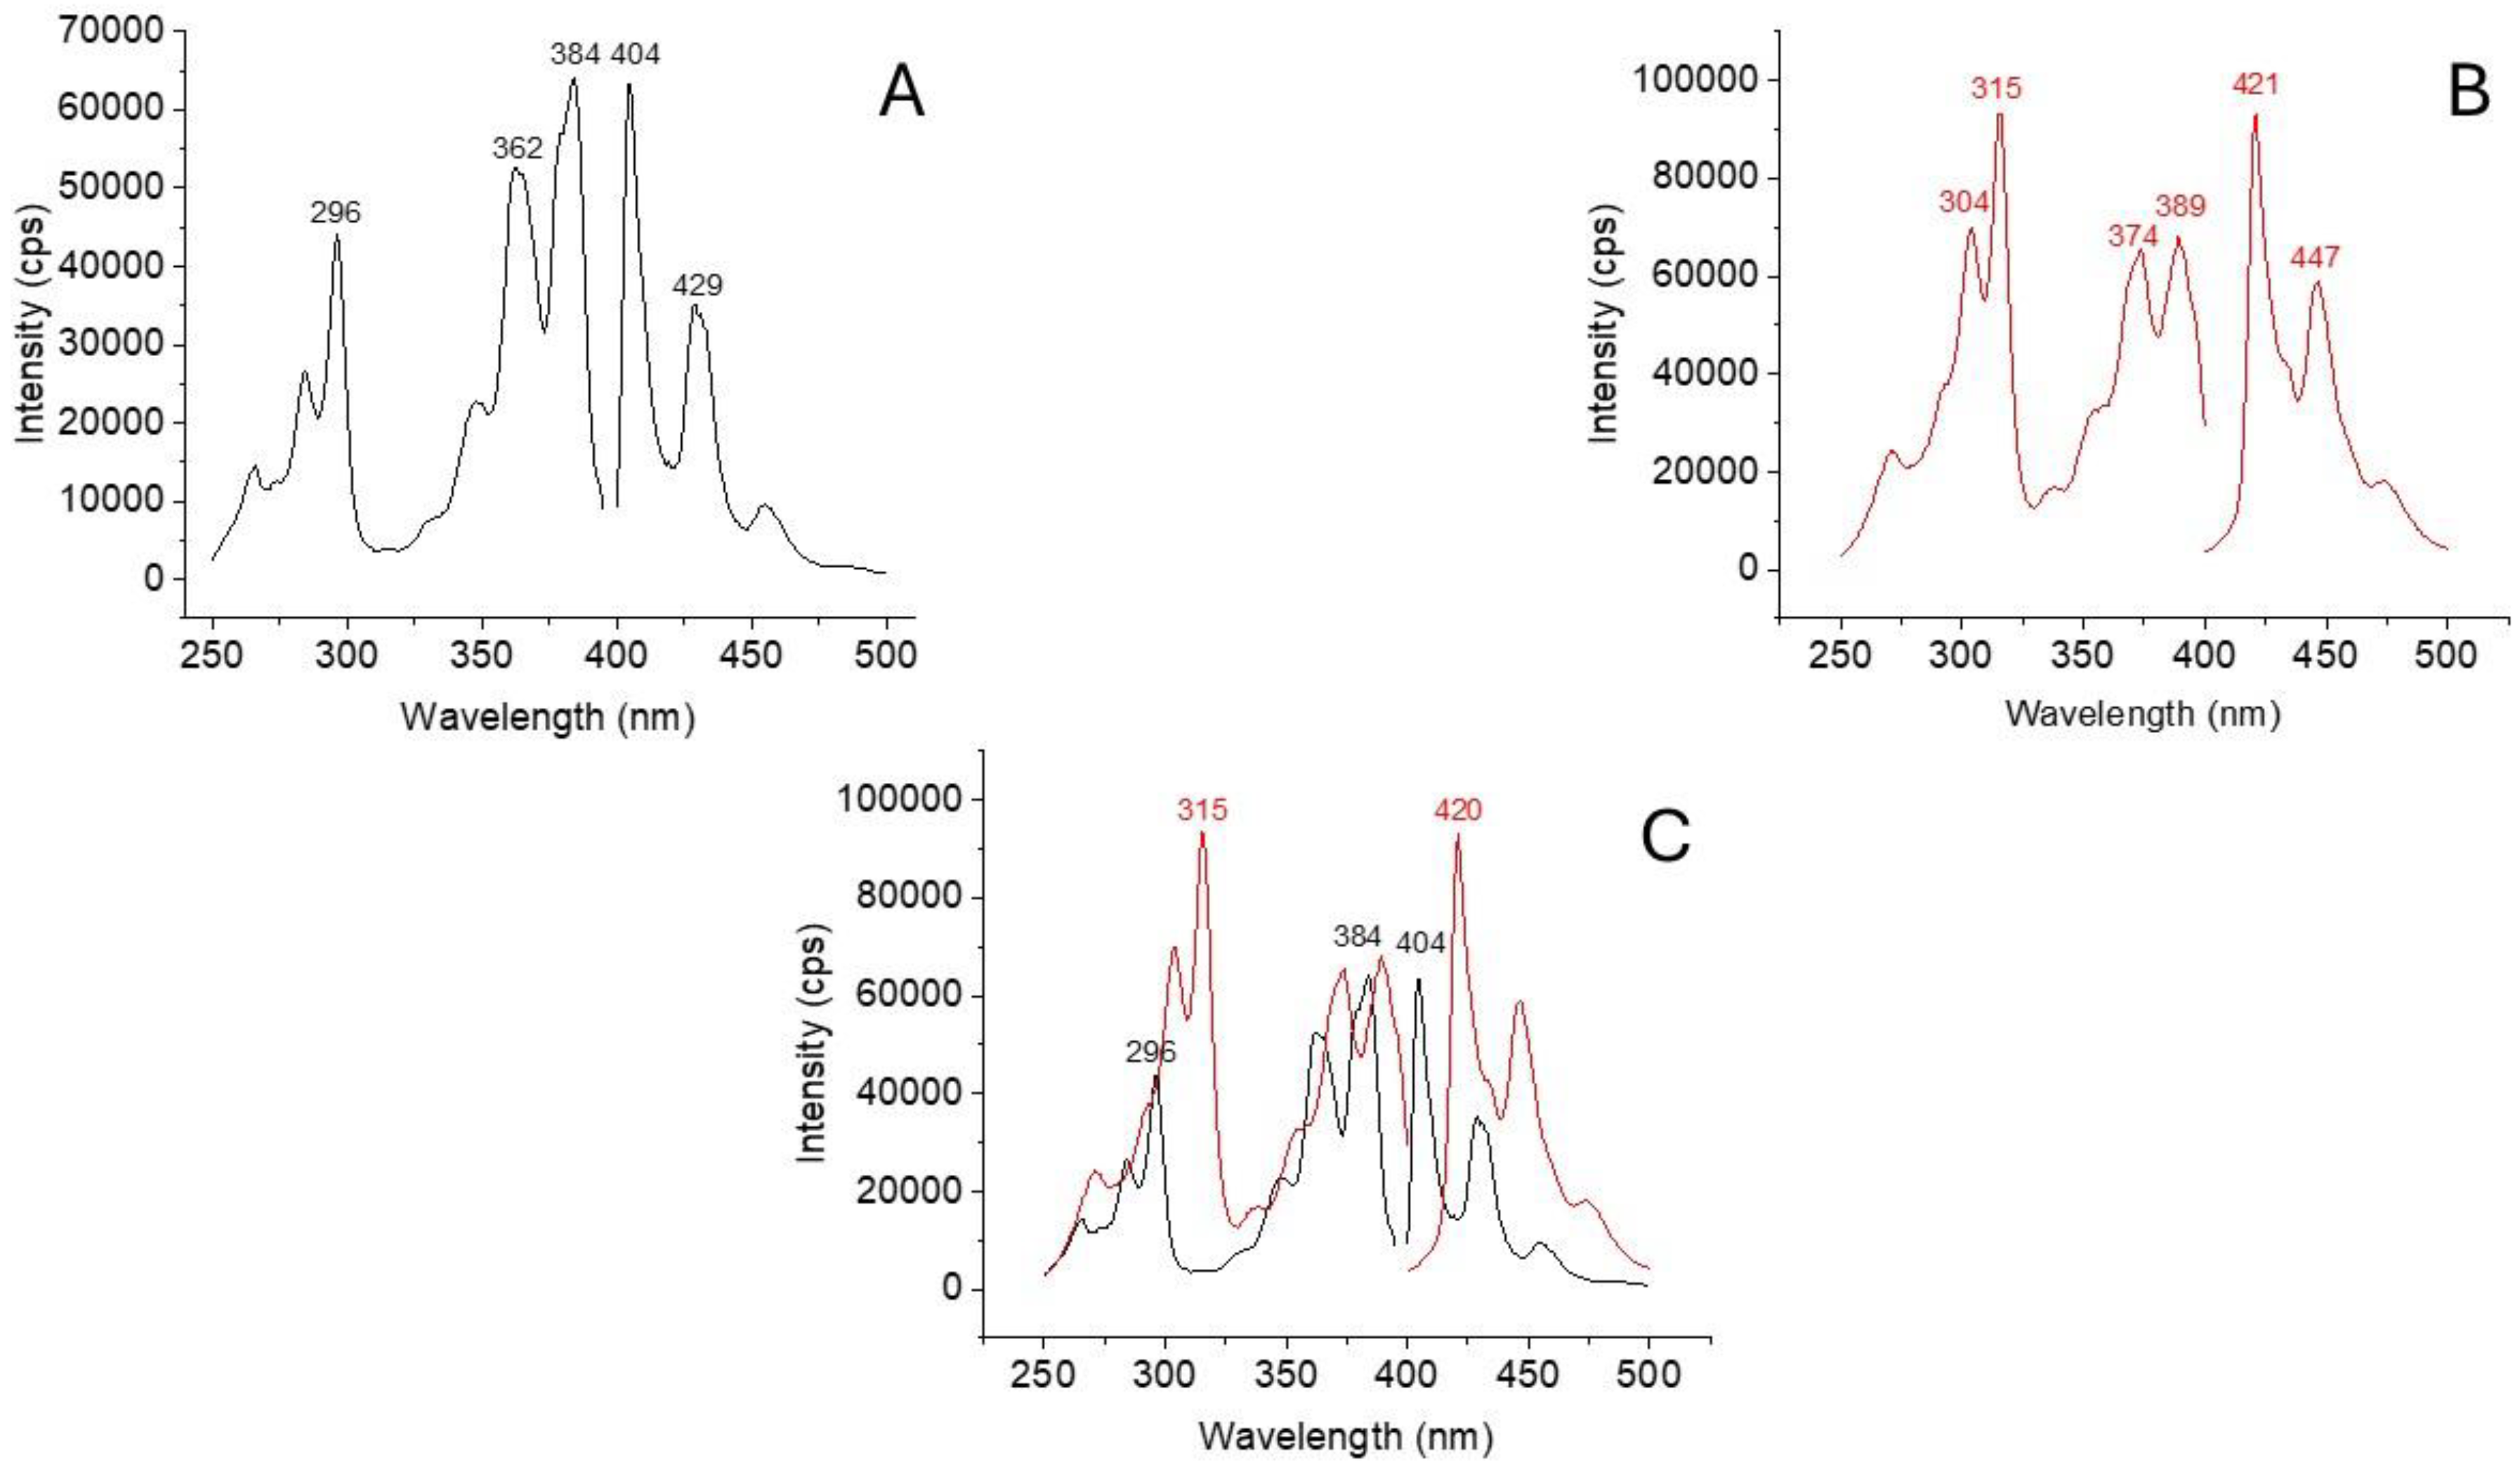
2.1. Room Temperature Excitation and Fluorescence Spectra of BaP and DBalP

Figure 2A and 2B show the excitation and emission spectra of BaP and DBalP recorded from pure standard solutions in acetonitrile, respectively. All spectra were recorded at the maximum excitation and emission wavelengths of each PAH using a 3 nm band-pass for both monochromators. Although the two PAHs showed characteristic spectral profiles with distinct excitation and emission wavelengths, the strong spectral overlapping observed in Figure 2C might prevent their unambiguous determination in HPLC fractions. This possibility was investigated with binary mixtures of BaP and DBalP in acetonitrile. Table S1 summarizes the results obtained for BaP. The possible interference of DBalP was tested at the same concentration of BaP (1:1 mixture) and at 5 × (1:5 mixture) and 10 × (1:10 mixture) higher concentrations of DBalP compared to BaP. All fluorescence intensities were measured at the maximum excitation and emission wavelength of BaP and then compared to the fluorescence intensity of a pure standard solution of BaP. No interference from DBalP was observed for the 1:1 mixture. As shown in Table S2, similar results were obtained for DBalP in the presence of BaP.

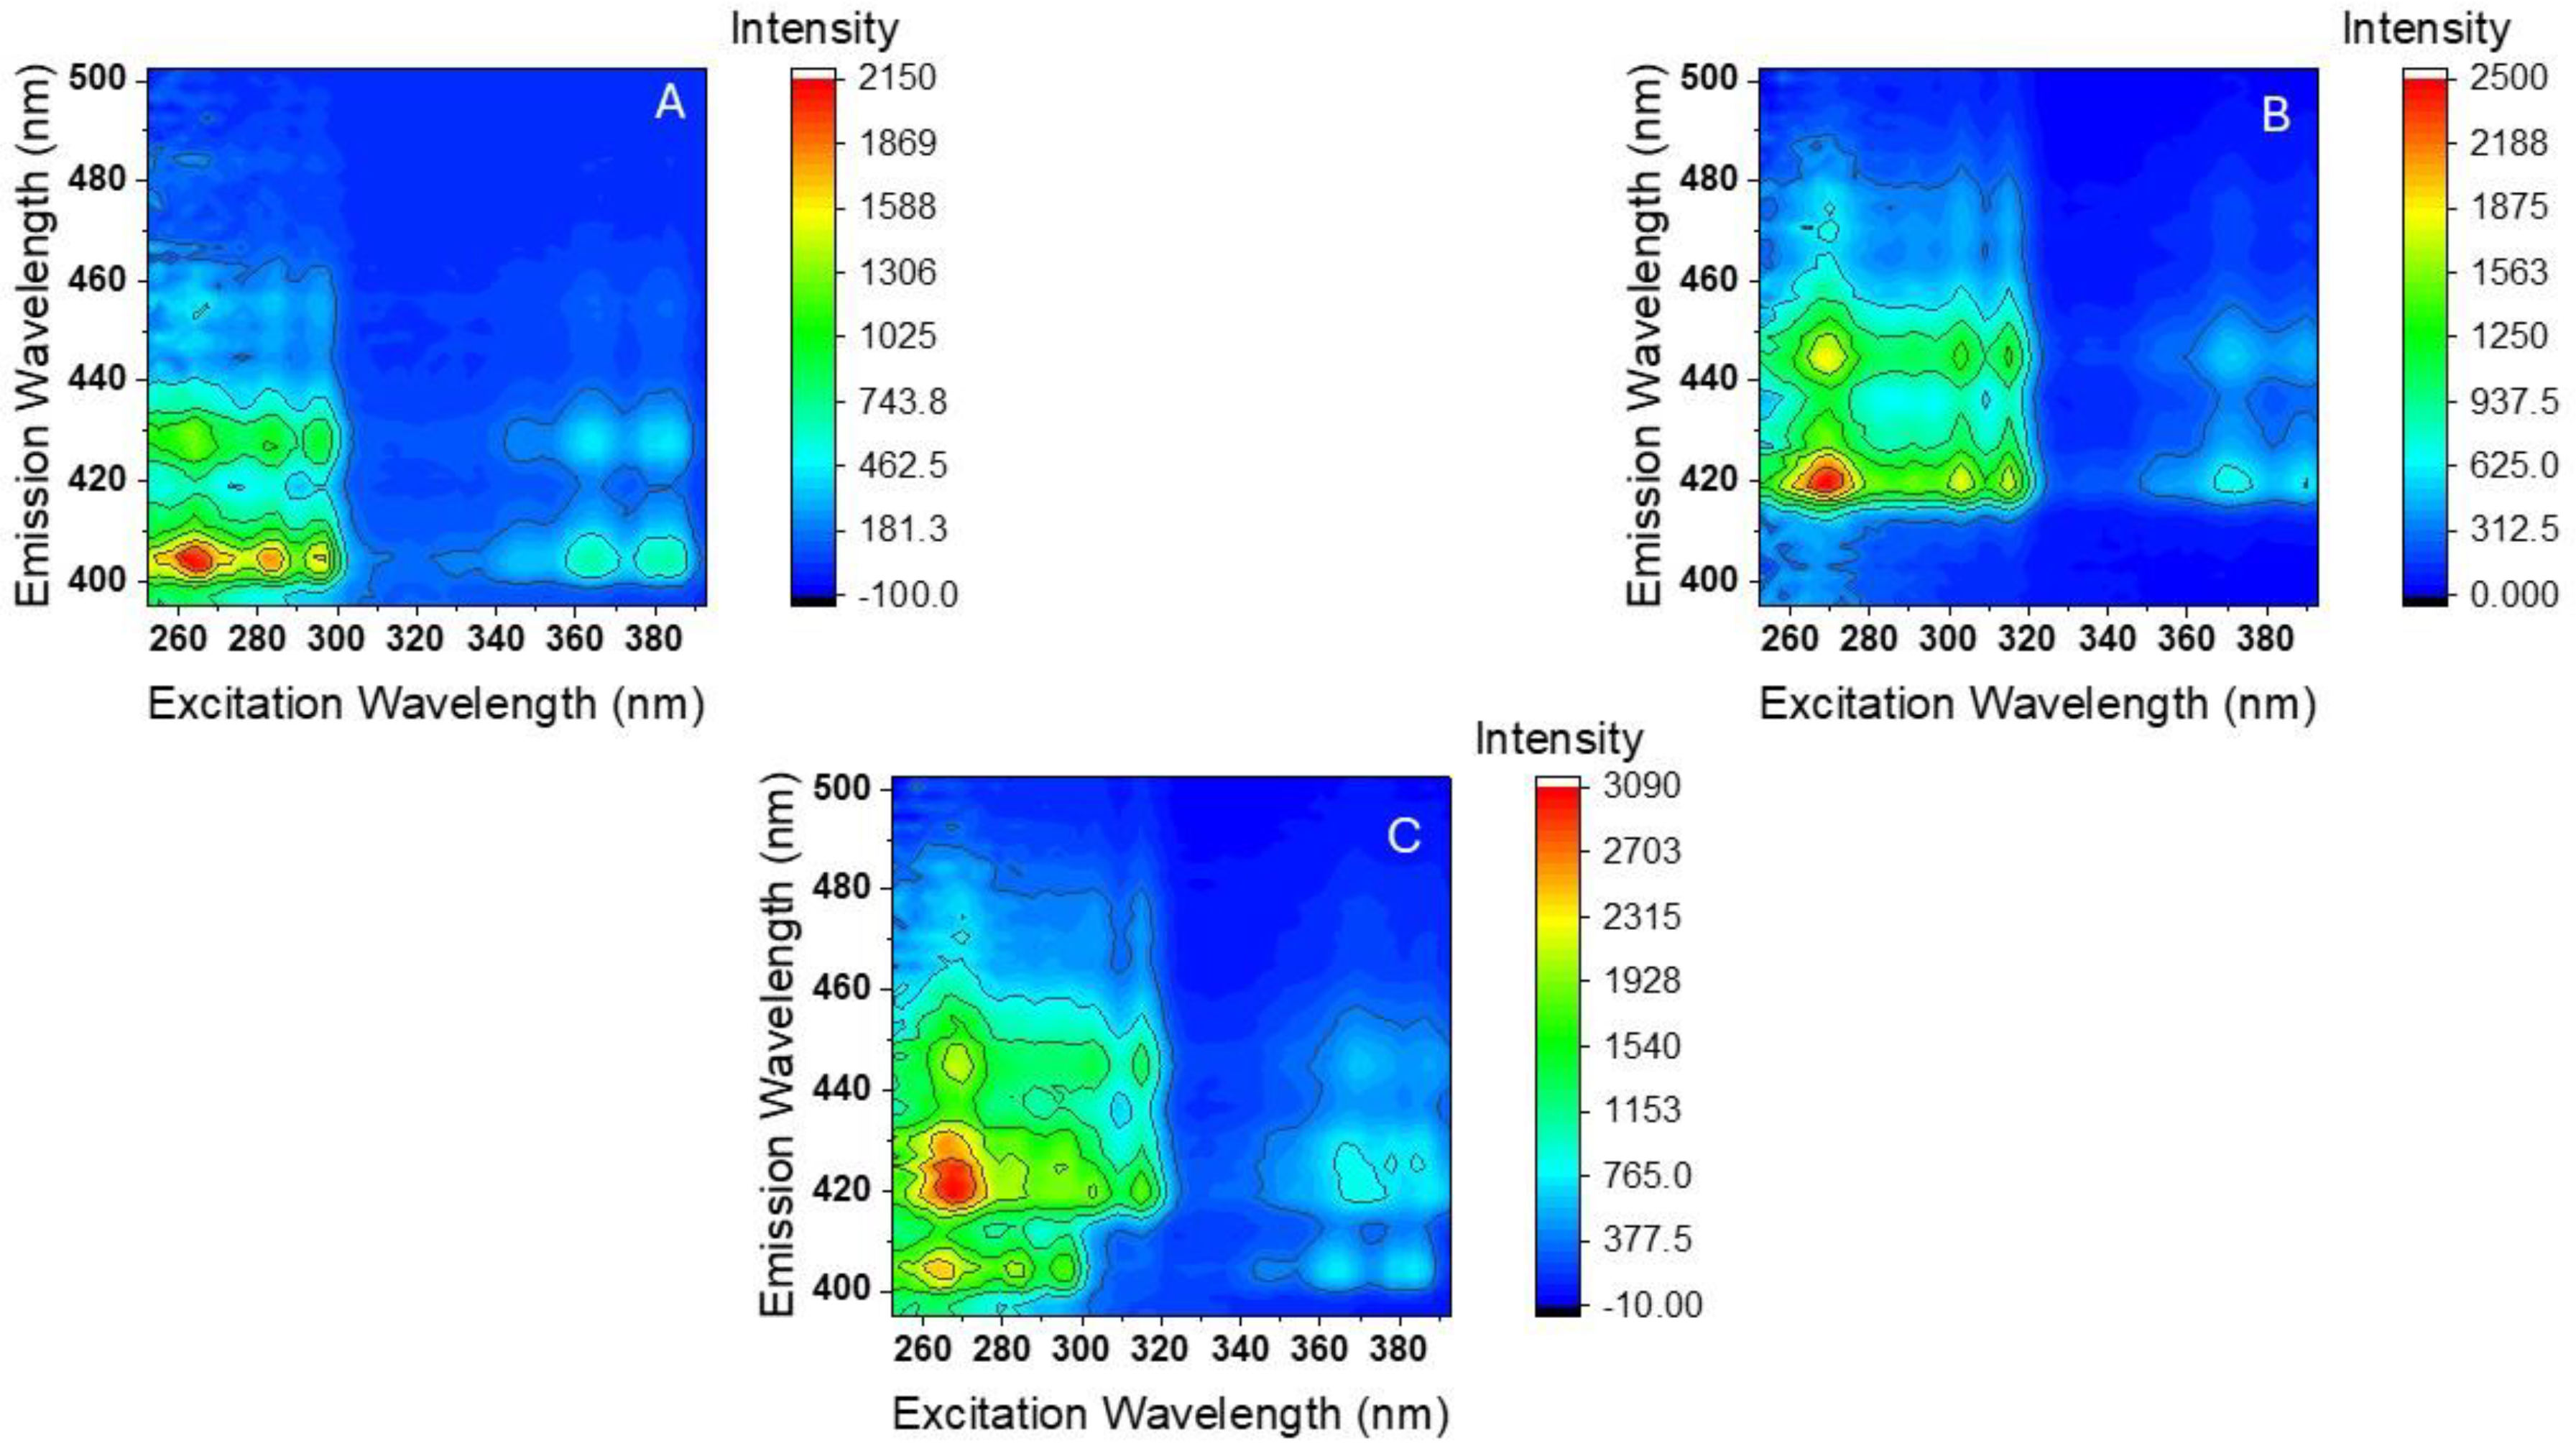
2.2. Room-Temperature Fluorescence Excitation–Emission Matrices (RTF-EEMs) of BaP and DBalP

The unambiguous determination of co-eluted PAHs in HPLC fractions is limited by the broad nature of room-temperature excitation and fluorescence spectra. Well-known approaches to reducing the overlap of excitation and fluorescence spectra include coupling high-order instrumental data to parallel factor analysis (PARAFAC). This approach carries with it the second-order advantage, which permits the quantification of fluorophores in samples of unknown composition no matter how many signal-overlapping constituents are in the unknown sample [23,24,25,26,27].
Previous work in Campiglia’s lab on the analysis of EPA PAHs in soil samples combined PARAFAC with 4.2K time-resolved EEMs (4.2K TREEMs) [28]. TREEMs refer to excitation–emission matrices recorded with laser-based instrumentation at certain time windows during the total fluorescence decay of the sample. The present study combined PARAFAC and RT-EEMs, which consisted of fluorescence spectra recorded at several excitation wavelengths and compiled into either a two-dimensional data format (wavelength of excitation vs. wavelength of fluorescence) or a three-dimensional format (wavelength of excitation vs. wavelength of fluorescence vs. signal intensity).
Figure 3A,B show the RT-EEMs recorded from pure standard solutions of BaP and DBalP in acetonitrile. Figure 3C shows the RTF-EEM recorded from a binary mixture of the two PAHs in acetonitrile. The excitation and emission passbands were set at 3 nm in all cases. The sample excitation was conducted at 3 nm increments between 250 and 393 nm. The excitation wavelengths were scanned from low (393 nm) to high energy (250 nm) to reduce the sample exposure to UV irradiation and possible photobleaching. The fluorescence emission was monitored between 394 and 502 nm using an integration time of 150 milliseconds. Scatter interference from excitation radiation and from second-order grating effects were eliminated with the aid of fully automated cut-off filters. Under these instrumental settings, each EEM resulted in a data matrix of 55 excitation data points × 48 emission data points, with an average acquisition time of 20.7 ± 0.3 s per EEM.

2.3. RTF-EEMs’ Analytical Figures of Merit for the Analysis of BaP and DBalP in Acetonitrile

The analytical figures of merit (AFOM) for the analysis of BaP and DBalP in acetonitrile are summarized in Table 1. The fluorescence intensities plotted in the calibration graphs correspond to the intensity values obtained from the EEMs at the maximum excitation and emission wavelengths of each PAH. No attempts were made to experimentally determine the upper concentration limits of the linear dynamic ranges (LDRs). The correlation coefficients (Rs) were close to unity, demonstrating linear correlations between fluorescence intensity and PAH concentration. The LOD and the LOQ of BaP were approximately one order of magnitude lower than those of DBalP. These values are in good agreement with the stronger fluorescence emitted by BaP. The relative standard deviations (RSDs) at medium linear concentrations demonstrated good reproducibility at the parts-per-billion (ng/mL) concentration level.

2.4. Calibration and Validation Sets for PARAFAC Analysis

If EEMs are arranged in a three-dimensional representation X of dimensions I × J × K, where I is the number of samples, J is the number of emission wavelengths, and K is the number of excitation wavelengths, PARAFAC can decompose the array into a more condensed form than the original one [23]. This is accomplished by minimizing the sum of the squares of the residuals (eijk) in the model described by Equation (1):
x i j k = n = 1 n a i n b j n c k n + e i j k
where n indicates the component number and xijk is the fluorescence intensity for sample i at the emission wavelength j and excitation wavelength k. For any given component n, the elements ain, bjn, and ckn are arranged in the score vector an (whose elements are directly proportional to its concentration in each sample) and the loading vectors bn and cn, which estimate its emission and excitation profiles.
Binary mixtures with different concentrations of BaP and DBalP were prepared in acetonitrile for the calibration and the validation sets. Three individual EEMs were recorded from three aliquots of each binary mixture to account for possible instrumental variations. The same approach was used to record EEMs from the blank solution (acetonitrile). The average plots of the blank-subtracted EEMs recorded from all the binary mixtures in the calibration set and the validation set are shown in Figure S1 and Figure S2 respectively.
Table 2 summarizes the composition of the calibration set for the PARAFAC model employed in these studies. All solutions consisted of standard mixtures of BaP and DBalP in acetonitrile. The concentrations of the two PAHs were calculated with a Central Composite Design (CCD) and took into consideration the LDRs in Table 1.
Because BaP is a stronger fluorophore than DBalP, its concentration in all the binary mixtures was considerably lower than the concentration of DBalP. In addition, a zero-concentration sample for each analyte was included in the calibration sets. Table 3 lists the nominal concentrations of BaP and DBalP in the binary mixtures for the validation set and those predicted by PARAFAC using two factors. For the binary mixtures, there was no need to exploit the second-order advantage. The nominal concentrations of the standard mixtures were different from those in Table 1 but within the same concentration ranges as the calibration set. A comparison of the nominal to the predicted concentration clearly showed an excellent predictive ability, with mean recoveries of 102.2 ± 5% for BaP and 100.4 ± 3% for DBalP.

2.5. HPLC–EEM Analysis of Tobacco Smoke Condensate

Five samples of tobacco smoke condensate (TSC) were subjected to HPLC analysis. Four samples were prepared by mixing aliquots of pre-concentrated TSC to solid amounts of BaP and DBalP. The remaining sample consisted of TSC with no addition of BaP and DBalP. Figure 4 shows the RTF-EEMs recorded from the five HPLC samples.
A visual comparison of the EEMs in Figure 3 provides insights into the contribution of each PAH to the total fluorescence of the HPLC fractions. The nominal concentrations of BaP and DBalP in the five TSC samples are listed in Table 4. It should be noted that the reported concentrations only compute the amounts of BaP and DBalP added to the TSC samples. The excellent agreement between the nominal and the predicted concentration demonstrate the ability of PARAFAC to determine the two PAHs in co-eluted HPLC fractions. These quantitative results are consistent with the quality of the profiles extracted by PARAFAC for both analytes (see SI Figure 3).

3. Materials and Methods

3.1. Chemicals

All reagents used were the highest available purity. Analytical standards of BaP and DBalP were purchased from Chiron (Trondheim, Norway). Pure (100%) HPLC-grade acetonitrile and acetone were purchased from Fisher Scientific (Waltham, MA, USA). Camel Menthol Crush commercial cigarettes were purchased at local stores. Nanopure water supplied by the Barnstead Nanopure Infinity water system (Barnstead, Dubuque, IA, USA) located in the laboratory was used throughout all the experiments.

3.2. Preparation of Calibration and Validation Sets for PARAFAC Analysis

Calibration and validation samples were prepared by diluting stock solutions of BaP and DBalP in HPLC-grade acetonitrile. All dilutions were made with micropipettes to a total volume of 3.00 mL. The PAH final concentrations varied between 16.0 ng/mL and 104.0 ng/mL for BaP, and between 164.6 ng/mL and 500.0 ng/mL for DBalP. In addition, a zero-concentration sample for each analyte was included in the calibration sets. For the validation sets, nine solutions were prepared with concentrations varying from 30.0 ng/mL to 95.0 ng/mL for BaP and from 110 ng/mL to 450 ng/mL for DBalP.

3.3. Collection of Tobacco Smoke Condensate

Tobacco smoke condensate was collected according to the guidelines of the National Institute of Standards and Technology (NIST SRM 3222) [29]. The main steps were as follows: A sintered glass frit funnel was placed on an Erlenmeyer vacuum flask with a length of tubing extending from the funnel into 300 mL of acetone. The apparatus was placed in dry ice and a slight vacuum was created. After setup, 11 g of cigarette tobacco filler was ignited and burned to ash in the filter, such that the smoke bubbled through the acetone. After 2 min, the ashes were stoked, and the apparatus allowed to cool for 8 min. After cooling, the remaining ashes were removed, and the funnel was washed with around 200 mL of acetone. The funnel and tubing were then removed and sonicated in the extract solution to remove any remaining condensate.

3.4. HPLC–EEM Analysis of Tobacco Smoke Condensate

Prior to HPLC analysis, a pre-concentration step for the tobacco smoke condensate was performed by evaporating 8 mL of the condensate to a residue, which was then reconstituted with acetonitrile to a final volume of 1.0 mL and centrifuged for 1 min at 10,000 rpm. Samples for PARAFAC analysis were prepared by adding 100 μL aliquots of the pre-concentrated smoke condensate to solid residues containing various masses of either BaP or DBalP. BaP residues were prepared by evaporating different volumes of a 101.2 mg/mL BaP standard solution in acetonitrile. DBalP residues were prepared by evaporating different volumes of a 513.0 mg/mL DBalP standard solution in acetonitrile. All mixtures were centrifuged at 600 rpm for 5 min to ensure complete dissolution of the solid residue into the liquid aliquot of the pre-concentrated smoke condensate. All sample injections were performed using a 20 μL fixed-volume injection loop. HPLC fractions were collected from 27.5 to 31.5 min of the chromatographic time and subjected to EEM analysis. Each HPLC fraction was subjected to triplicate measurements made from three sample injections.

3.5. Instrumentation

Chromatographic analysis was performed with a Hitachi HPLC system (San Jose, CA, USA) using a computer with Hitachi software. Its main components included a model L7100 gradient pump, an L-7400 UV detector, an L-7485 fluorescence detector, an L-761 online degasser, and a D-7000 control interface. PAH separation was accomplished with an Eclipse PAH column (250 mm length, 4.6 mm inner diameter, and 5 µm particle size), using isocratic elution for five minutes with 40% acetonitrile and 60% water, and then linear gradient elution to 100% with acetonitrile over 25 min. The mobile phase flow rate was 2.0 mL/min and the column temperature was ~25 °C. Sample injection (20 µL) was performed using a fixed-volume injection loop. HPLC fractions were collected in 30 mL amber vials.
Room-temperature fluorescence measurements were made using a DuettaTM spectrofluorometer (Horiba Scientific, Piscataway, NJ, USA) equipped with a 75 W xenon arc lamp, a single-grating scanning monochromator for sample excitation, and a spectrograph/TE-cooled CCD for spectra collection from 250 nm to 1100 nm. The instrument is equipped with a reference detector (Si photodiode) to compensate for variations in the intensity of sample excitation and a fully automated set of cut-off filters to eliminate second-order grating effects. Instrument control was accomplished with custom software (EzSpecTM Touch-Screen Software, https://www.horiba.com/jpn/scientific/products/detail/action/show/Product/ezspec-software-1880/#show-more). All measurements were made from liquid solutions in 500 μL quartz cuvettes.

3.6. Software for Data Analysis with PARAFAC

MATLAB 7.10 was used for all calculations (The Mathworks Inc., Natick, MA, USA, 2010) [30]. Software processing was facilitated by an MVC2 graphical user interface written in MATLAB that was previously described by Olivieri et al. [31].

4. Conclusions

Although DBalP is the most toxic PAH known to date, there is relatively limited information on its possible presence in tobacco samples. Our study showed that DBalP co-elutes with BaP under standard HPLC conditions. Therefore, their unambiguous identification requires further analysis of the HPLC fractions via an alternative analytical method. One possibility is to perform the analysis via GC-MS. This technique is able to differentiate BaP from DBalP in HPLC fractions, but it would require further separation via a rather lengthy experimental procedure.
Herein, an alternative method was proposed to obviate further chromatographic separation of these two PAHs in co-eluted HPLC fractions. The experimental procedure is straightforward; it consists of pouring the HPLC fraction directly into a quartz cuvette to record RTF-EEMs using a commercial spectrofluorometer. If the spectrofluorometer is equipped with a multichannel detection system, i.e., a spectrograph and a CCD, the RTF-EEM recording will take less than one minute per HPLC fraction. These are distinct advantages compared to LETRSS analysis [9], which requires laser-based instrumentation and the use of a liquid cryogen to avoid spectral overlap. In the present study, the strong spectral overlap between BaP and DBalP was resolved at room temperature with the aid of PARAFAC. Since this algorithm carries with it the second-order advantage, it makes recording RTF-EEMs an accurate approach for the unambiguous determination of BaP and DBalP at the parts-per-billion level via EPA Method 610.

Supplementary Materials

The following supporting information can be downloaded at: https://www.mdpi.com/article/10.3390/molecules30071550/s1, Table S1: Statistical comparison of fluorescence intensities recorded at the maximum excitation and emission wavelengths of BaP in 1:1, 1:5, and 1:10 binary mixtures with DBalP in acetonitrile; Table S2: Statistical comparison of fluorescence intensities recorded at the maximum excitation and emission wavelengths of DBalP in 1:1, 1:5, and 1:10 binary mixtures with BaP in acetonitrile; Figure S1: RTF-EEMs recorded from the calibration set used for the PARAFAC analysis; Figure S2: RTF-EEMs recorded from the validation set used for the PARAFAC analysis; Figure S3: Examples of spectral profiles extracted by PARAFAC from HPLC fractions.

Author Contributions

G.T.K.: collection of room-temperature fluorescence excitation–emission matrices; S.D.N. and J.C.G.A.: HPLC analysis; A.M.S.: pre-concentration of tobacco smoke condensate with and without BaP and DBalP; H.C.G.: PARAFAC analysis; A.D.C.: formulation of research goals and aims; development of methodology; management, planning, and execution of research activity; review and editing. All authors have read and agreed to the published version of the manuscript.

Funding

This research received no external funding.

Institutional Review Board Statement

Not applicable.

Informed Consent Statement

Not applicable.

Data Availability Statement

Data are contained within the article and Supplementary Materials.

Conflicts of Interest

The authors declare no conflicts of interest.

References

  1. Roberts, K.P.; Jankowiak, R.; Small, G.J. High-performance liquid chromatography interfaced with fluorescence line-narrowing spectroscopy for on-line analysis. Anal. Chem. 2001, 73, 951–956. [Google Scholar] [CrossRef] [PubMed]
  2. Wise, S.A.; Rodgers, R.P.; Reddy, C.M.; Nelson, R.K.; Kujawinski, E.B.; Wade, T.L.; Campiglia, A.D.; Lieu, Z. Advances in Chemical Analysis of Oil Spills Since the Deepwater Horizon Disaster. Crit. Rev. Anal. Chem. 2022, 53, 1638–1697. [Google Scholar] [CrossRef] [PubMed]
  3. Tian, B.Y.; Gao, S.T.; Zhu, Z.J.; Zeng, X.Y.; Liang, Y.; Yu, Z.Q.; Peng, P.A. Two-dimensional gas chromatography coupled to isotope ratio mass spectrometry for determining high molecular weight polycyclic aromatic hydrocarbons in sediments. J. Chromatogr. A 2023, 1693, 463879. [Google Scholar] [CrossRef]
  4. IARC Working Group on the Evaluation of Carcinogenic Risks to Humans Chemical Agents and Related Occupations. Lyon (FR): International Agency for Research on Cancer. IARC Monographs on the Evaluation of Carcinogenic Risks to Humans, No. 100F BENZO[a]PYRENE, 2012. Available online: https://www.ncbi.nlm.nih.gov/books/NBK304415/ (accessed on 14 March 2025).
  5. Cavalieri, E.L.; Higginbotham, S.; Rogan, E.G. Dibenzo[a,l]pyrene—The Most Potent Carcinogenic Aromatic Hydrocarbon. Polycycl. Aromat. Compd. 1994, 6, 177–183. [Google Scholar] [CrossRef]
  6. Mahadevan, B.; Luch, A.; Bravo, C.F.; Atkin, J.; Steppan, L.B.; Pereira, C.; Kerkvliet, N.I.; Baird, W.M. Dibenzo[a,l]pyrene induced DNA adduct formation in lung tissue in vivo. Cancer Lett. 2005, 227, 25–32. [Google Scholar] [CrossRef]
  7. Russell, G.K.; Gupta, R.C.; Vadhanam, M.V. Effect of phytochemical intervention on dibenzo[a,l]pyrene-induced DNA adduct formation. Mutat. Res./Fundam. Mol. Mech. Mutagen. 2015, 774, 25–32. [Google Scholar] [CrossRef]
  8. Kowalczyk, K.; Roszak, J.; Sobanska, Z.; Stepnik, M. Review of mechanisms of genotoxic action of dibenzo[def,p]chrysene (formerly dibenzo[a,l]pyrene). Toxin Rev. 2023, 42, 460–477. [Google Scholar] [CrossRef]
  9. Comas, A.; Santana, A.; Campiglia, A.D. On the co-elution of benzo[a]pyrene and dibenzo[a,l]pyrene in chromatographic fractions and their unambiguous determination in tobacco extracts via laser-excited time resolved Shpol’skii spectroscopy. Anal. Methods 2023, 15, 1959–1968. [Google Scholar] [CrossRef]
  10. Elcoroaaristizabal, S.; de Juan, A.; Garcia, A.J.; Durana, N.; Alonso, L. Comparison of second-order multivariate methods for screening and determination of PAHs by total fluorescence spectroscopy. Chemom. Intell. Lab. Syst. 2014, 132, 63–64. [Google Scholar] [CrossRef]
  11. Ahmadvand, M.; Sereshti, H.; Parastar, H. Chemometric-based determination of polycyclic aromatic hydrocarbons in aqueous samples using ultrasound-assisted emulsification microextraction combined to gas chromatography–mass spectrometry. J. Chromatogr. A 2015, 1413, 117–126. [Google Scholar] [CrossRef]
  12. Gu, H.W.; Zhang, S.H.; Wu, B.C.; Chen, W.; Wang, J.B.; Liu, Y. A green chemometrics-assisted fluorimetric detection method for the direct and simultaneous determination of six polycyclic aromatic hydrocarbons in oil-field wastewaters. Spectrochim. Acta A Mol. Biomol. Spectrosc. 2018, 200, 93–101. [Google Scholar] [CrossRef] [PubMed]
  13. Panigrahi, S.K.; Mishra, A.K. Identification of pyrene in complex sample matrix using time-resolved fluorescence measurement coupled with PARAFAC analysis. J. Photochem. Photobiol. A 2019, 383, 111991. [Google Scholar] [CrossRef]
  14. Catena, S.; Sanllorente, S.; Sarabia, L.A.; Boggia, R.; Turrini, F.; Ortiz, M.C. Unequivocal identification and quantification of PAHs content in ternary synthetic mixtures and in smoked tuna by means of excitation-emission fluorescence spectroscopy coupled with PARAFAC. Microchem. J. 2020, 154, 10456. [Google Scholar] [CrossRef]
  15. Araújo, K.C.; Barreto, M.C.; Siqueira, A.S.; Freitas AC, P.; Oliveira, L.G.; Bastos ME, P.A.; Rocha ME, P.; Silva, L.A.; Fragoso, W.D. Oil spill in northeastern Brazil: Application of fluorescence spectroscopy and PARAFAC in the analysis of oil-related compounds. Chemosphere 2021, 267, 129154. [Google Scholar] [CrossRef]
  16. Seopela, M.P.; Powers, L.C.; Clark, C.; Heyes, A.; Gonsior, M. Combined fluorescent measurements, parallel factor analysis and GC-mass spectrometry in evaluating the photodegradation of PAHS in freshwater systems. Chemosphere 2021, 269, 129386. [Google Scholar] [CrossRef] [PubMed]
  17. Siqueira, A.S.; Almeida, L.F.; Fragoso, W.D. Determination of anthracene, phenanthrene, and fluorene in tap water and sediment samples by fluorescence spectroscopy on nylon membranes and second-order calibration. Talanta 2023, 253, 124002. [Google Scholar] [CrossRef]
  18. Hearn, B.A.; Ding, Y.S.; Watson, C.H.; Johnson, T.L.; Zewdie, G.; Jeong-Im, J.H.; Walters, M.J.; Holman, M.R.; Rochester, C.G. Multi-year Study of PAHs in Mainstream Cigarette Smoke. Tob. Regul. Sci. 2018, 4, 96–106. [Google Scholar] [CrossRef] [PubMed]
  19. Palazzi, P.; Hardy, E.M.; Appenzeller, B.M.R. Biomonitoring of children exposure to urban pollution and environmental tobacco smoke with hair analysis—A pilot study on children living in Paris and Yeu Island, France. Sci. Total Environ. 2019, 665, 864–872. [Google Scholar] [CrossRef]
  20. Adesina, O.A.; Olowolafe, T.I.; Igbafe, A. Levels of polycyclic aromatic hydrocarbon from mainstream smoke of tobacco products and its risks assessment. J. Hazard. Mater. Adv. 2022, 5, 100053. [Google Scholar] [CrossRef]
  21. Burkhardt, T.; Scherer, M.; Scherer, G.; Pluym, N.; Weber, T.; Kolossa-Gehring, M. Time trend of exposure to secondhand tobacco smoke and polycyclic aromatic hydrocarbons between 1995 and 2019 in Germany—Showcases for successful European legislation. Environ. Res. 2023, 216 Pt 2, 114638. [Google Scholar] [CrossRef]
  22. Miller, J.N.; Miller, J.C.; Miller, R.D. Statistics and Chemometrics for Analytical Chemistry, 7th ed.; Pearson: London, UK, 2018. [Google Scholar]
  23. Murphy, K.R.; Stedmon, C.A.; Graeber, D.; Bro, R. Fluorescence spectroscopy and multi-way techniques. PARAFAC. Anal. Methods 2013, 5, 6557–6566. [Google Scholar] [CrossRef]
  24. Zhang, W.; Li, T.; Dong, B. Characterizing dissolved organic matter in Taihu Lake with PARAFAC and SOM method. Water Sci. Technol. 2022, 85, 706–718. [Google Scholar] [CrossRef]
  25. Dinç, E.; Ertekin, Z.C.; Ünal, N. Three-way analysis of pH-UV absorbance dataset for the determination of paracetamol and its pKa value in presence of excipients. Spectrochim. Acta Part A 2020, 230, 118049. [Google Scholar] [CrossRef] [PubMed]
  26. Olivieri, A. Analytical Figures of Merit in Univariate, Multivariate, and Multiway Calibration: What Have We Learned? What Do We Still Need to Learn? J. Chemom. 2024, 38, e3613. [Google Scholar] [CrossRef]
  27. Olivieri, A.C.; Escandar, G.M. Recent Advances in Multiway Analytical Figures of Merit. Data Handl. Sci. Technol. 2024, 33, 363–380. [Google Scholar] [CrossRef]
  28. Goicoechea, H.C.; Yu, S.; Moore AF, T.; Campiglia, A.D. Four-way modeling of 4.2 K time-resolved excitation emission fluorescence data for the quantitation of polycyclic aromatic hydrocarbons in soil samples. Talanta 2012, 101, 330–336. [Google Scholar] [CrossRef] [PubMed]
  29. SRM 3222; Collection of Tobacco Smoke Condensate (SRM 3222 Cigarette Tobacco Filler). National Standards of Technology. Chemical Sciences Division, Material Measurement Laboratory, NIST: Gaithersburg, MD, USA, 2017.
  30. Bro, R. PARAFAC Tutorial and applications. Chemometr. Intell. Lab. Syst. 1997, 38, 149–171. [Google Scholar] [CrossRef]
  31. Chiappini, F.A.; Munoz de la Pena, A.; Goicoechea, H.C.; Olivieri, A.C. An upgrade of MVC2, a MATLAB graphical user interface for second-order multivariate calibration: Beyond trilinear models. Chemometr. Intell. Lab. Syst. 2023, 237, 104814. [Google Scholar] [CrossRef]
Figure 1. Typical HPLC chromatogram recorded from a standard solution containing the 16 EPA PAHs and 10 HMW-PAHs in acetonitrile. All PAH concentrations were at the ng/mL level. Fluorescence measurements were performed at the maximum excitation and emission wavelengths of each PAH [9].
Molecules 30 01550 g001
Figure 2. Excitation and fluorescence spectra of BaP (A) and DBalP (B) recorded from pure standard solutions in acetonitrile. The excitation and emission spectra were recorded at the maximum emission and excitation wavelengths of each PAH, respectively. The excitation and emission passbands were 3 nm in all cases. Figure (C) illustrates the spectral overlap of these two PAHs in acetonitrile solutions. All spectra were normalized for the maximum fluorescence intensities.
Molecules 30 01550 g002
Figure 3. RTF-EEMs recorded from pure standard solutions of (A) BaP and (B) DBalP in acetonitrile and (C) a binary mixture of BaP and DBalP in acetonitrile. In all cases, the concentrations of BaP and DBalP were 29 ng/mL and 281 ng/mL, respectively. All measurements were performed using 3 nm excitation and emission passbands.
Molecules 30 01550 g003
Figure 4. RTF-EEMs of HPLC fractions recorded from TSC mixed with different concentrations of BaP and DBalP (BE) and from unmixed TSC (A).
Molecules 30 01550 g004
Table 1. RTF-EEMs’ analytical figures of merit for BaP and DBalP in acetonitrile.
λexcem 1LOD 2 (ng/mL)LOQ 3 (ng/mL)LDR 4 (ng/mL)R 5% RSD 6
BaP384/4044.71616–1040.99950.6
DBalP315/42132107107–5000.99884.2
1 Excitation (λexc) and emission (λem) wavelengths used for fluorescence measurements. 2 Limit of detection (LOD) was calculated using LOD = 3SB/m, where SB is the standard deviation of sixteen blank signal measurements and m is the slope of the calibration curve. 3 Limit of quantitation (LOQ) was calculated using LOQ = 10SB/m. 4 Linear Dynamic Range (LDR), in ng/mL, extends from the LOQ to an arbitrarily chosen upper linear concentration. 5 Correlation coefficient (R) of LDR. 6 Relative standard deviation (RSD) = S/I × 100, where I is the average intensity and S is the standard deviation of the intensity calculated from three measurements at medium linear concentrations.
Table 2. Concentrations of BaP and DBalP in binary mixtures employed for PARAFAC calibration.
Sample BaP
(ng/mL)
DBalP
(ng/mL)
128.9164.6
291.1164.6
328.9442.4
491.1442.4
516.0303.5
6104.0303.5
760.0107.0
860.0500.0
960.0303.5
100.0303.5
1160.00.0
Table 3. Concentrations of BaP and DBalP in binary mixtures employed for PARAFAC validation.
SampleBaP
(ng/mL)
DBalP
(ng/mL)
Nominal 1Predicted 2Nominal 1Predicted 2
139.537.8159.8165.0
285.587.9159.8156.9
339.540.9400.2382.9
485.589.9400.2431.5
530.032.6280.0267.2
695.087.9280.0277.2
762.564.1110.0117.2
862.565.7450.0428.4
962.564.3280.0286.9
1 Nominal concentration refer to the actual concentrations of BaP and DBalP in the binary mixture. 2 Predicted concentrations refer to the concentrations calculated by PARAFAC.
Table 4. PARAFAC predictions of BaP and DBalP concentrations spiked into samples of tobacco.
SampleBaP
(ng/mL)
DBalP
(ng/mL)
Nominal 1Predicted 2Nominal 1Predicted 2
10.00.0
285.588.40.0
30.0400.2387.2
439.538.3159.8162.1
585.587.9400.2406.1
Average Recovery (%)100.999.9
1 Nominal concentration refer to the actual concentrations of BaP and DBalP in the binary mixture. 2 Predicted concentrations refer to the concentrations calculated by PARAFAC.
Disclaimer/Publisher’s Note: The statements, opinions and data contained in all publications are solely those of the individual author(s) and contributor(s) and not of MDPI and/or the editor(s). MDPI and/or the editor(s) disclaim responsibility for any injury to people or property resulting from any ideas, methods, instructions or products referred to in the content.

