
Identification and Validation of Urea Transporter B Inhibitor from Apium graveolens L. Seeds In Vitro and In Silico

 ,
,
Abstract
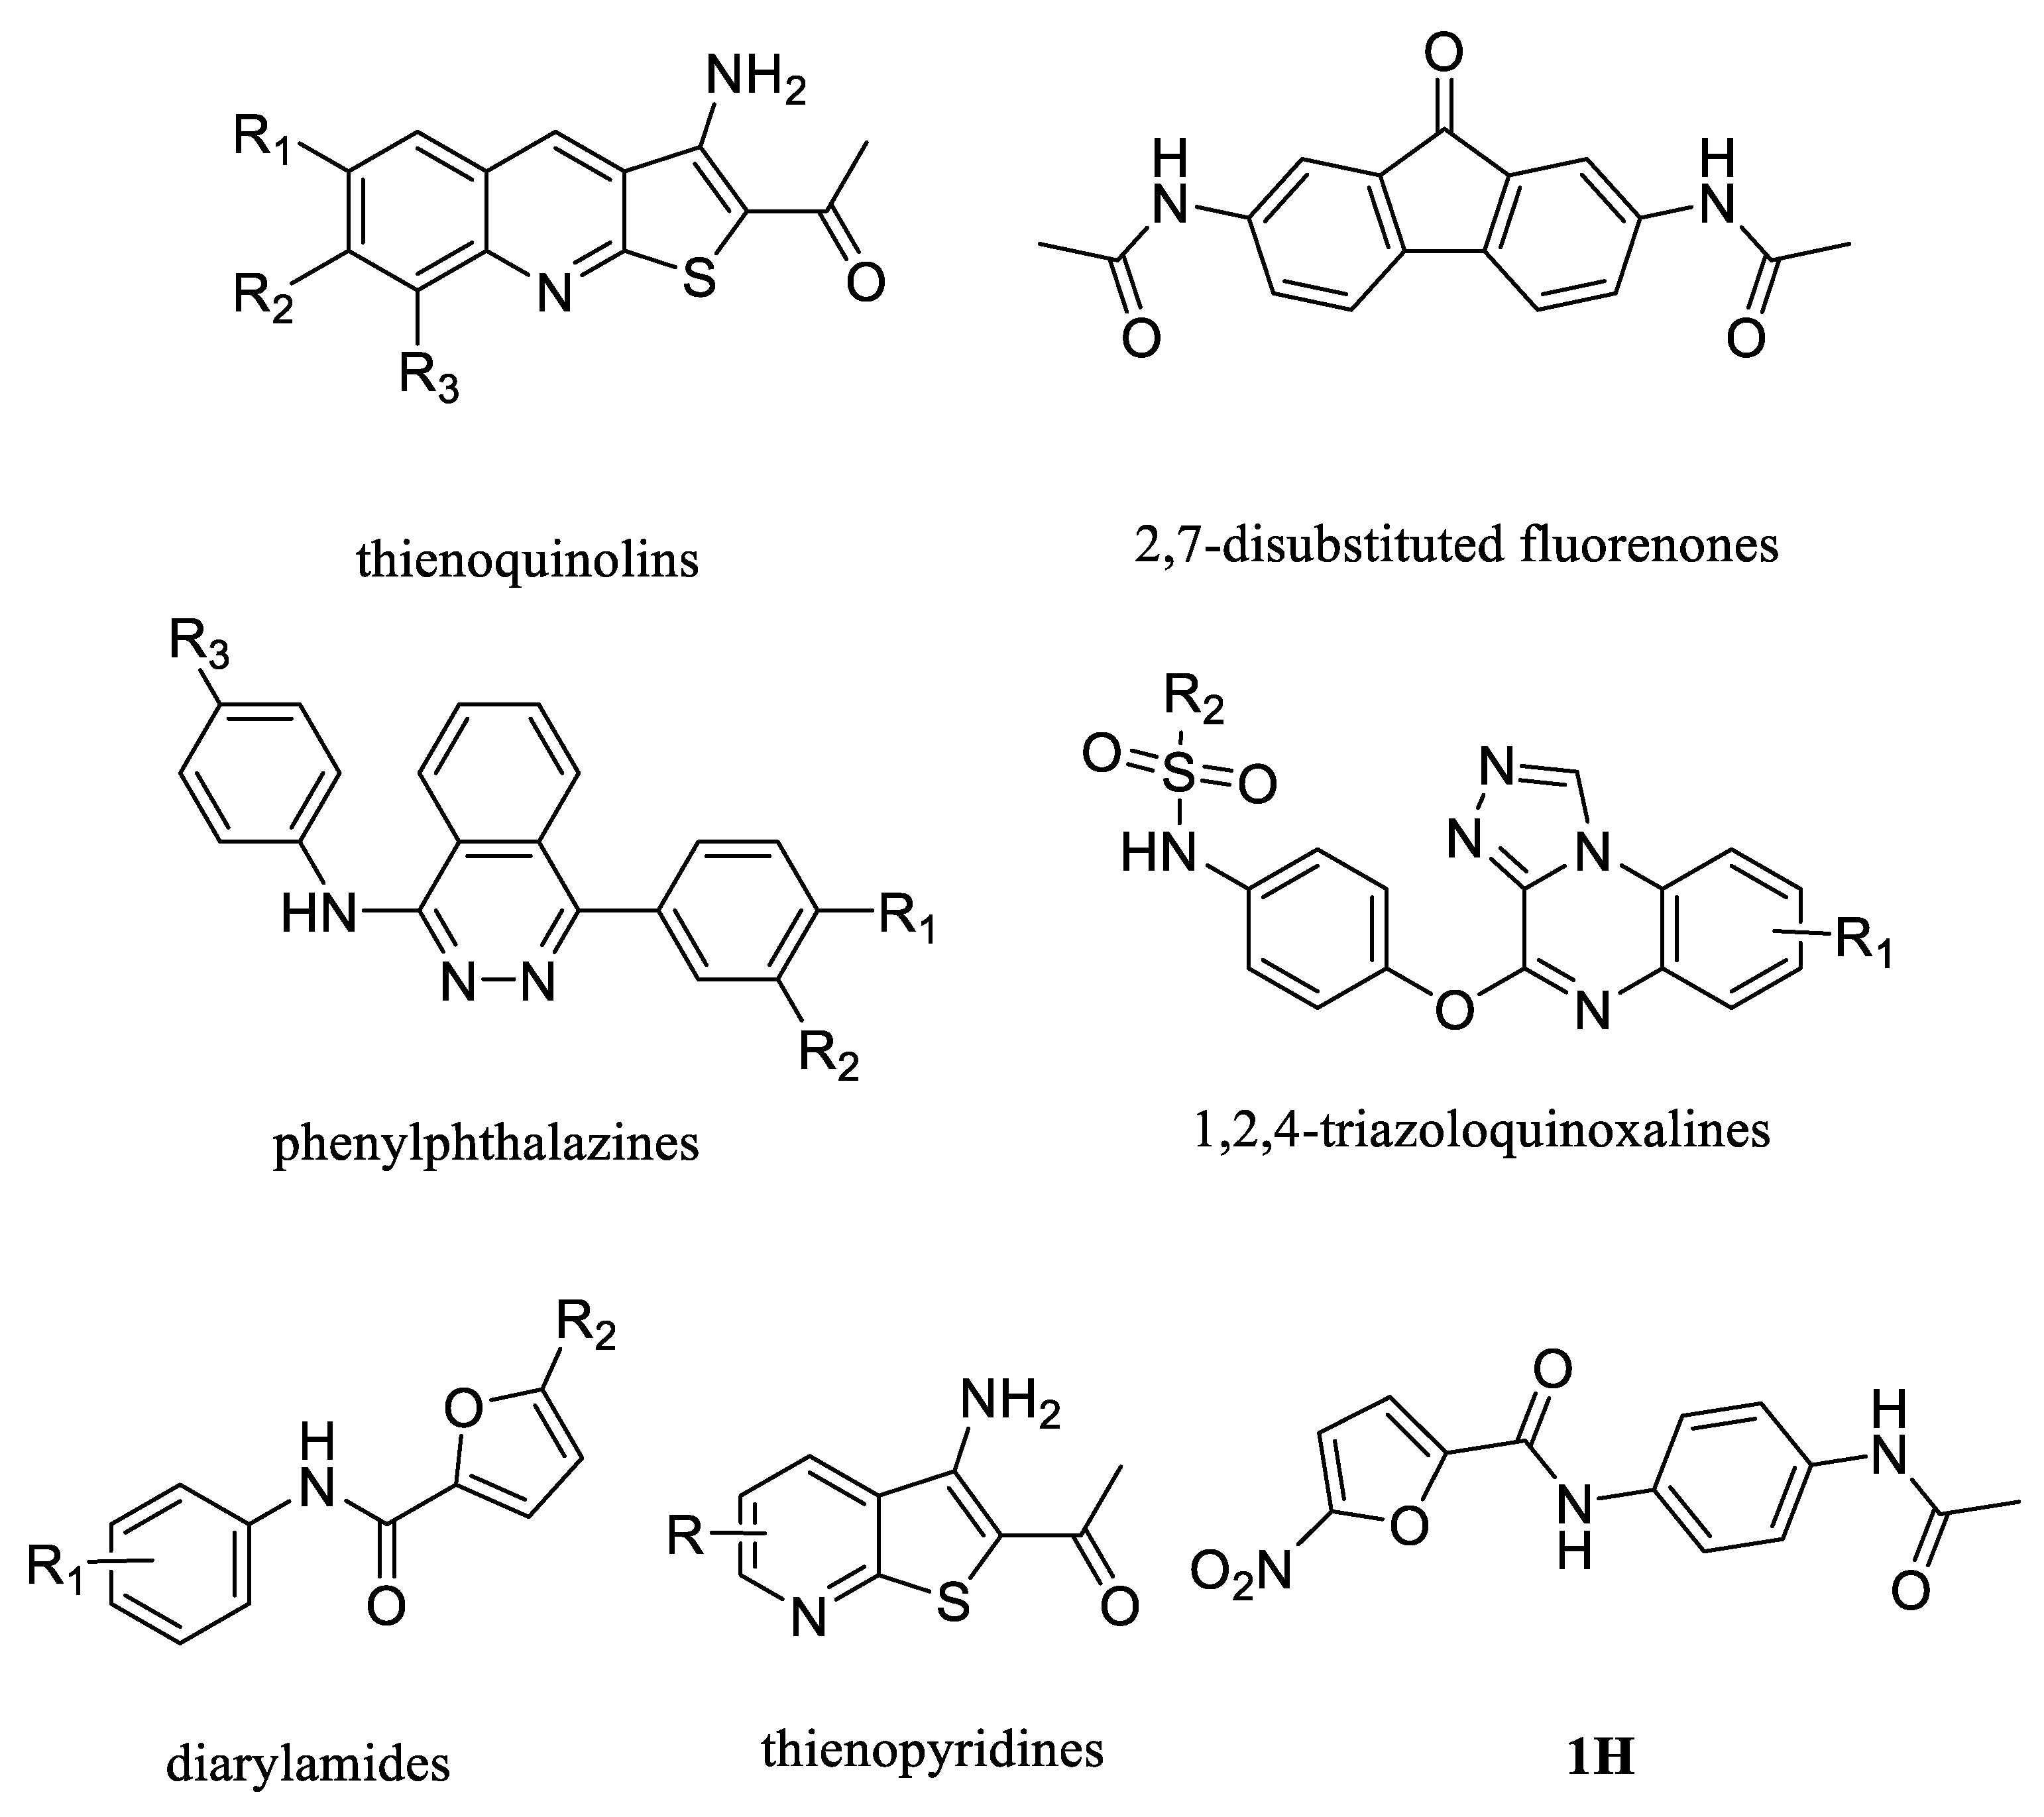
1. Introduction
2. Results and Discussion
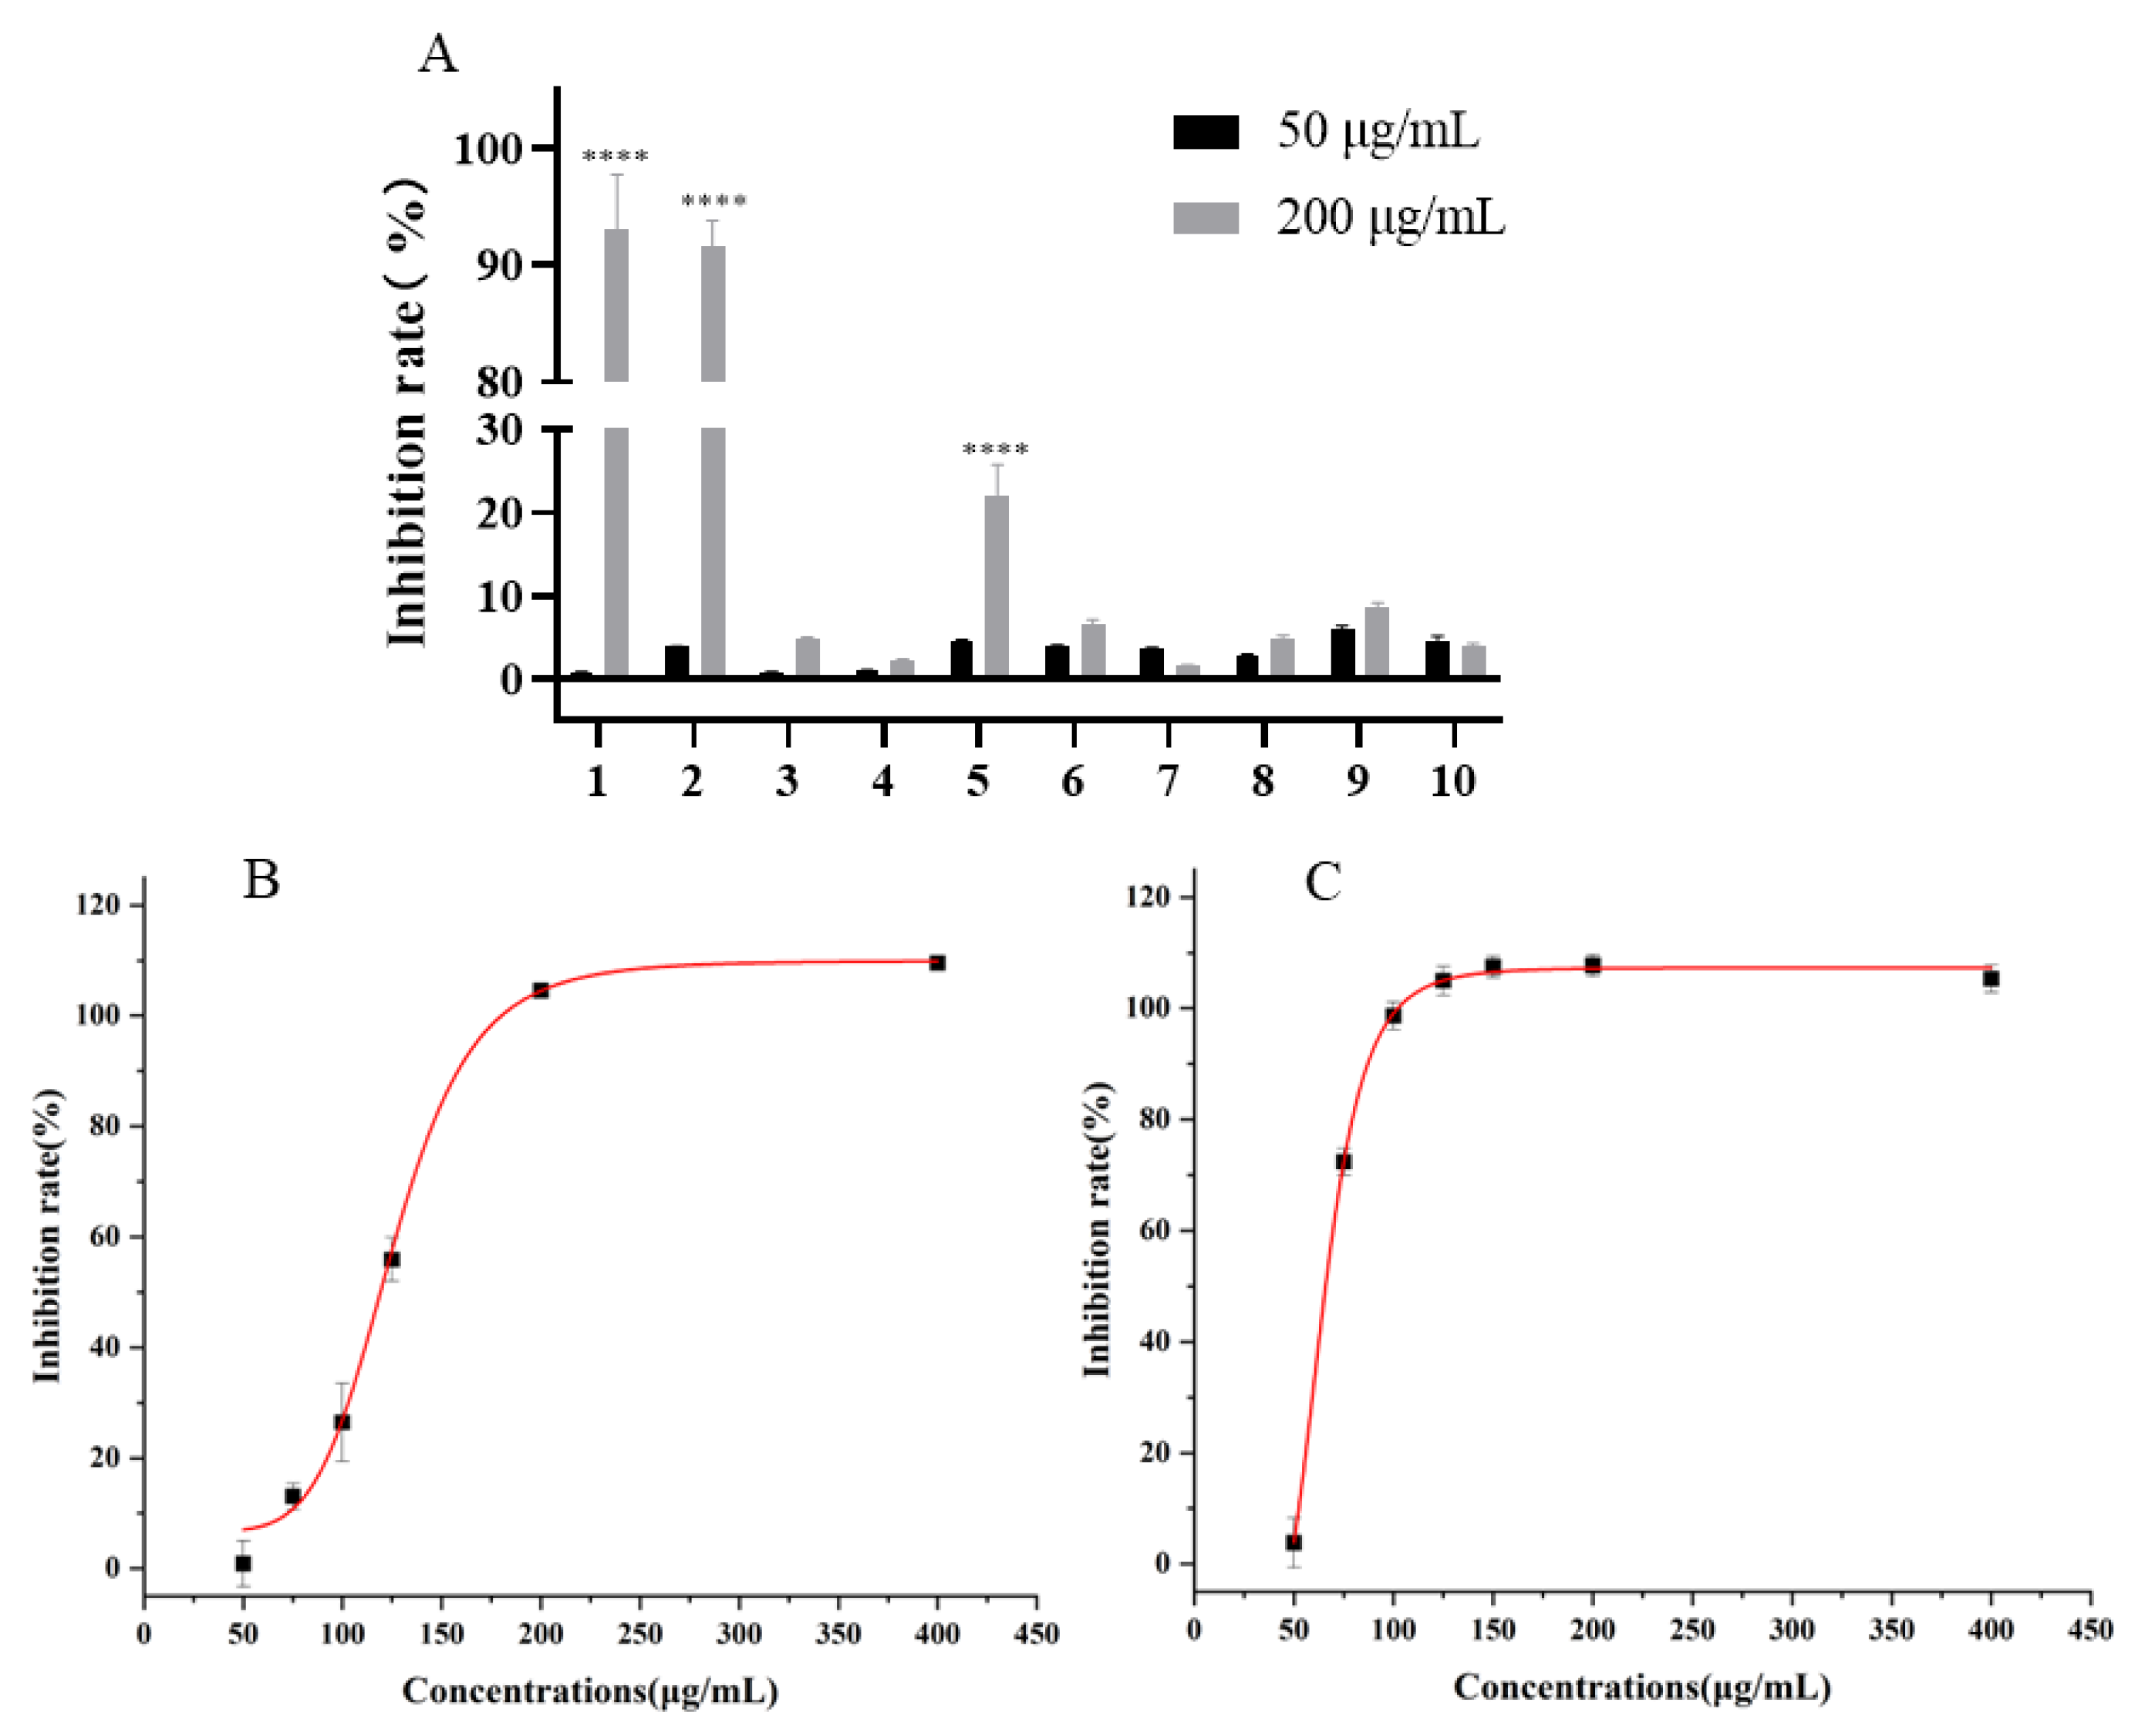
2.1. The Activity of Different Polarity Fractions In Vitro
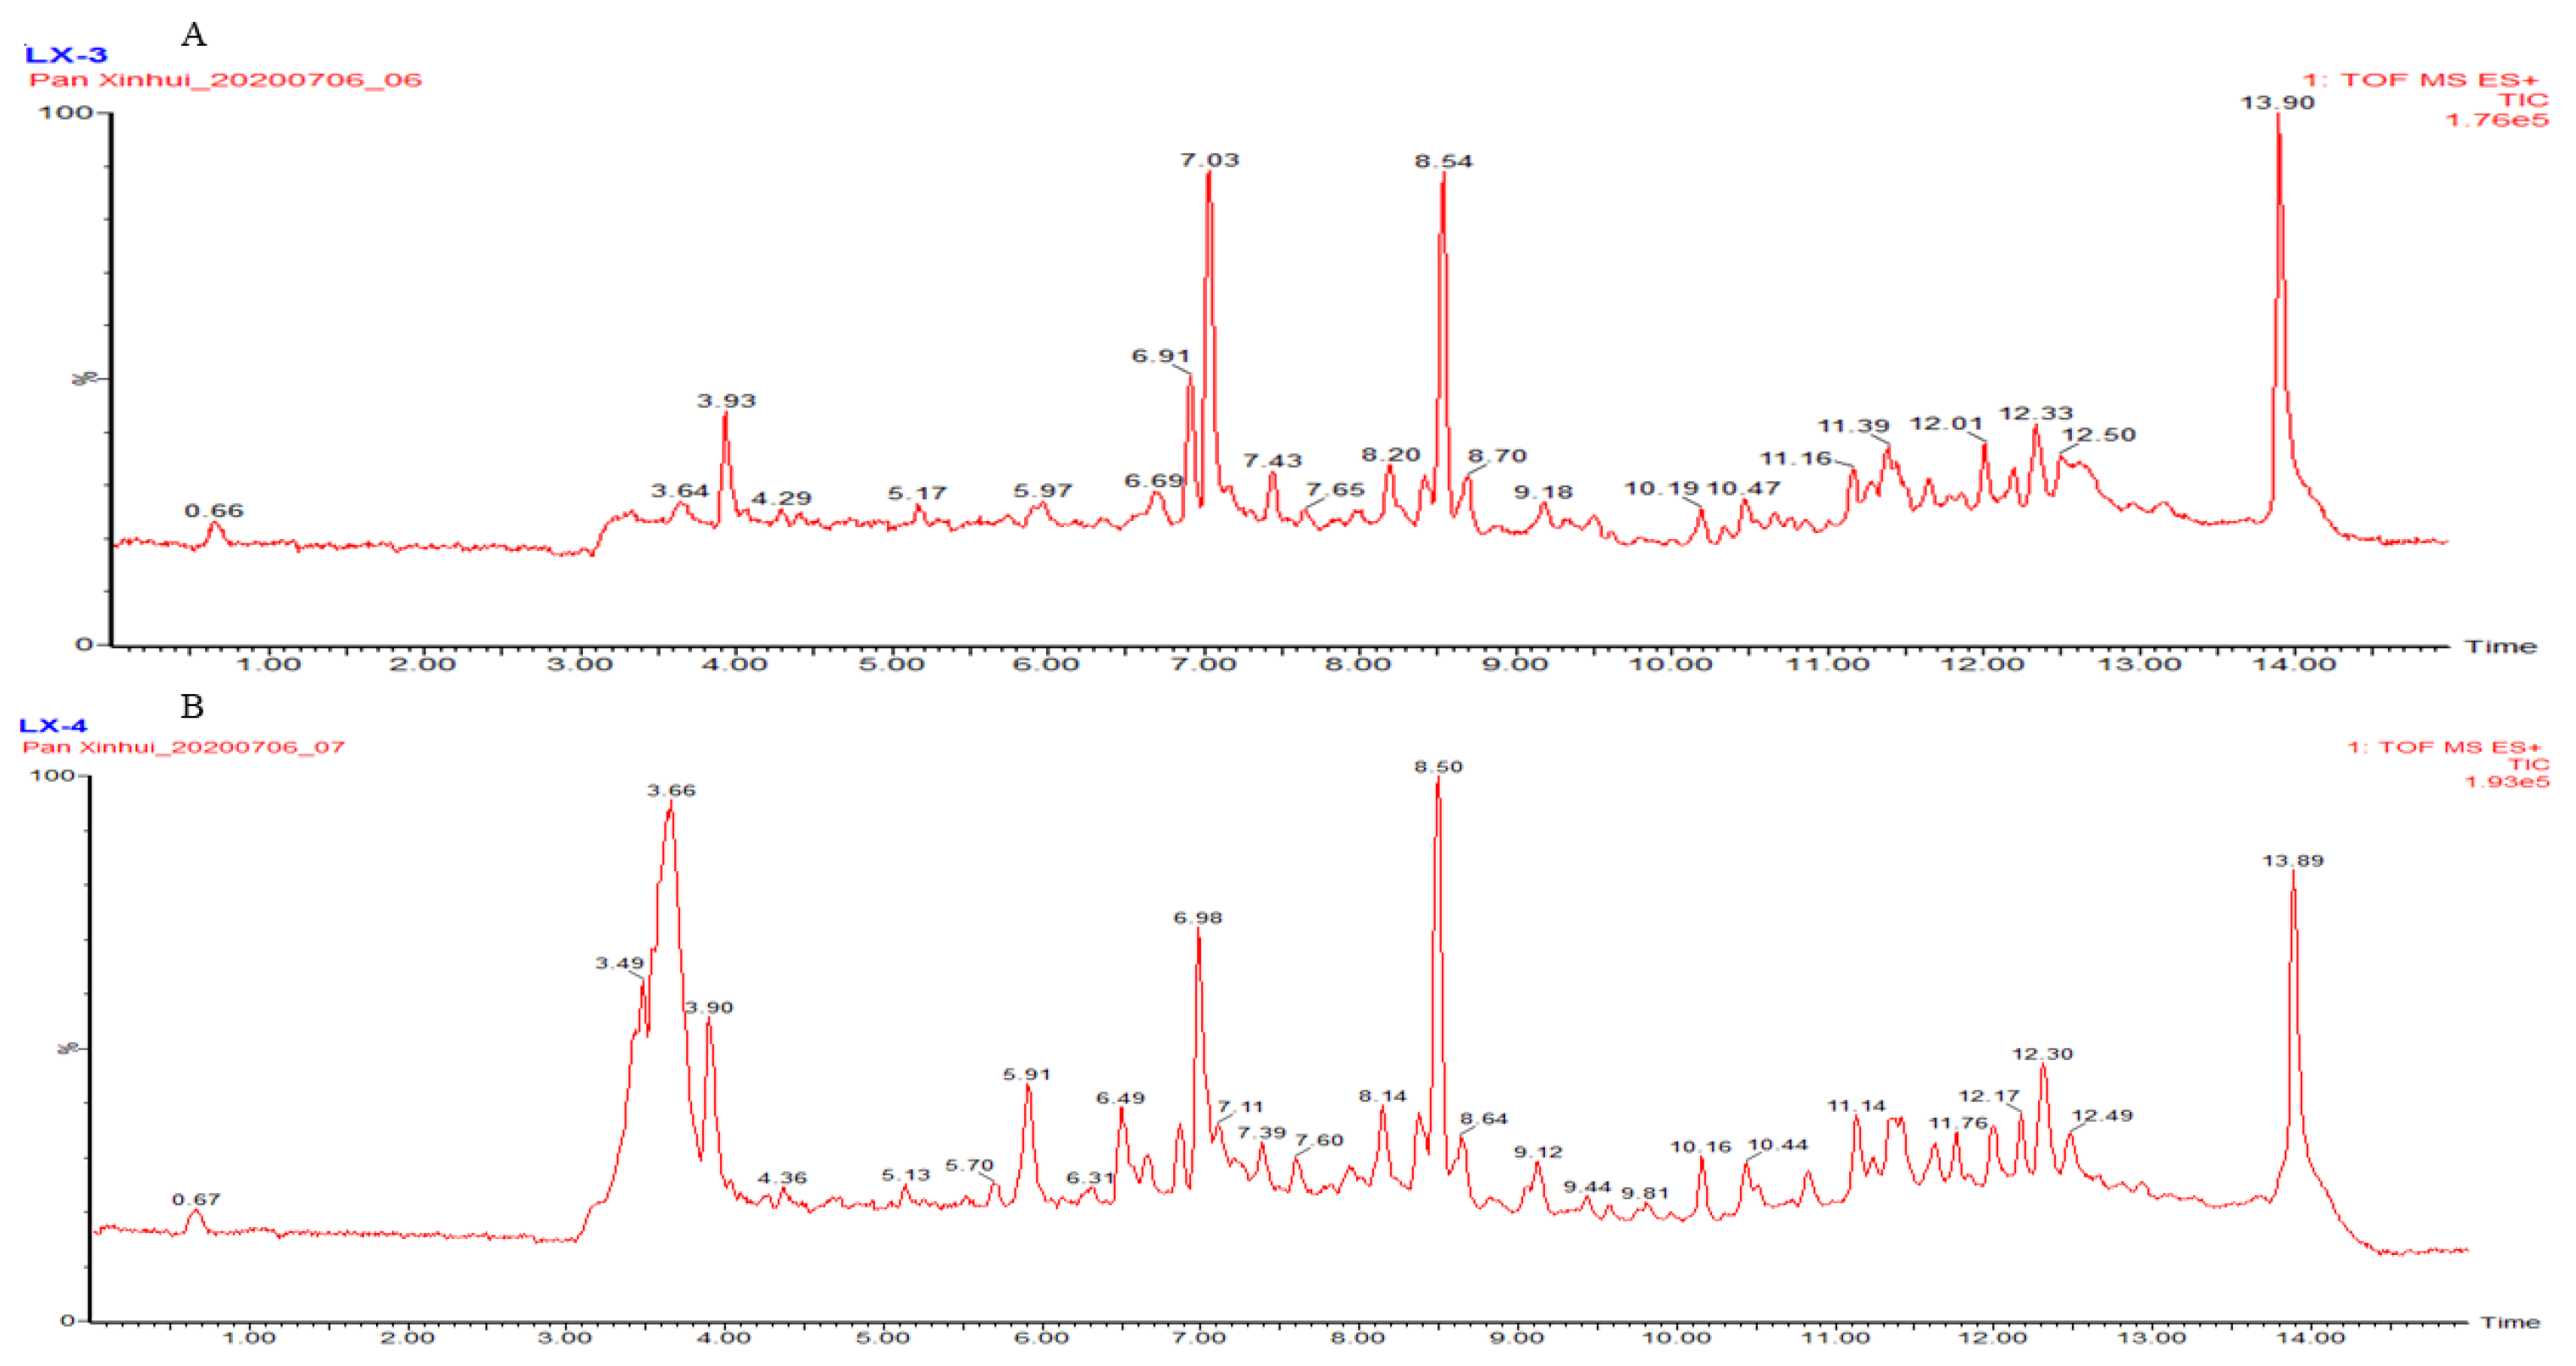
2.2. Characterization of the Constitutions of Apium graveolens L. Through HPLC-TOF-MS
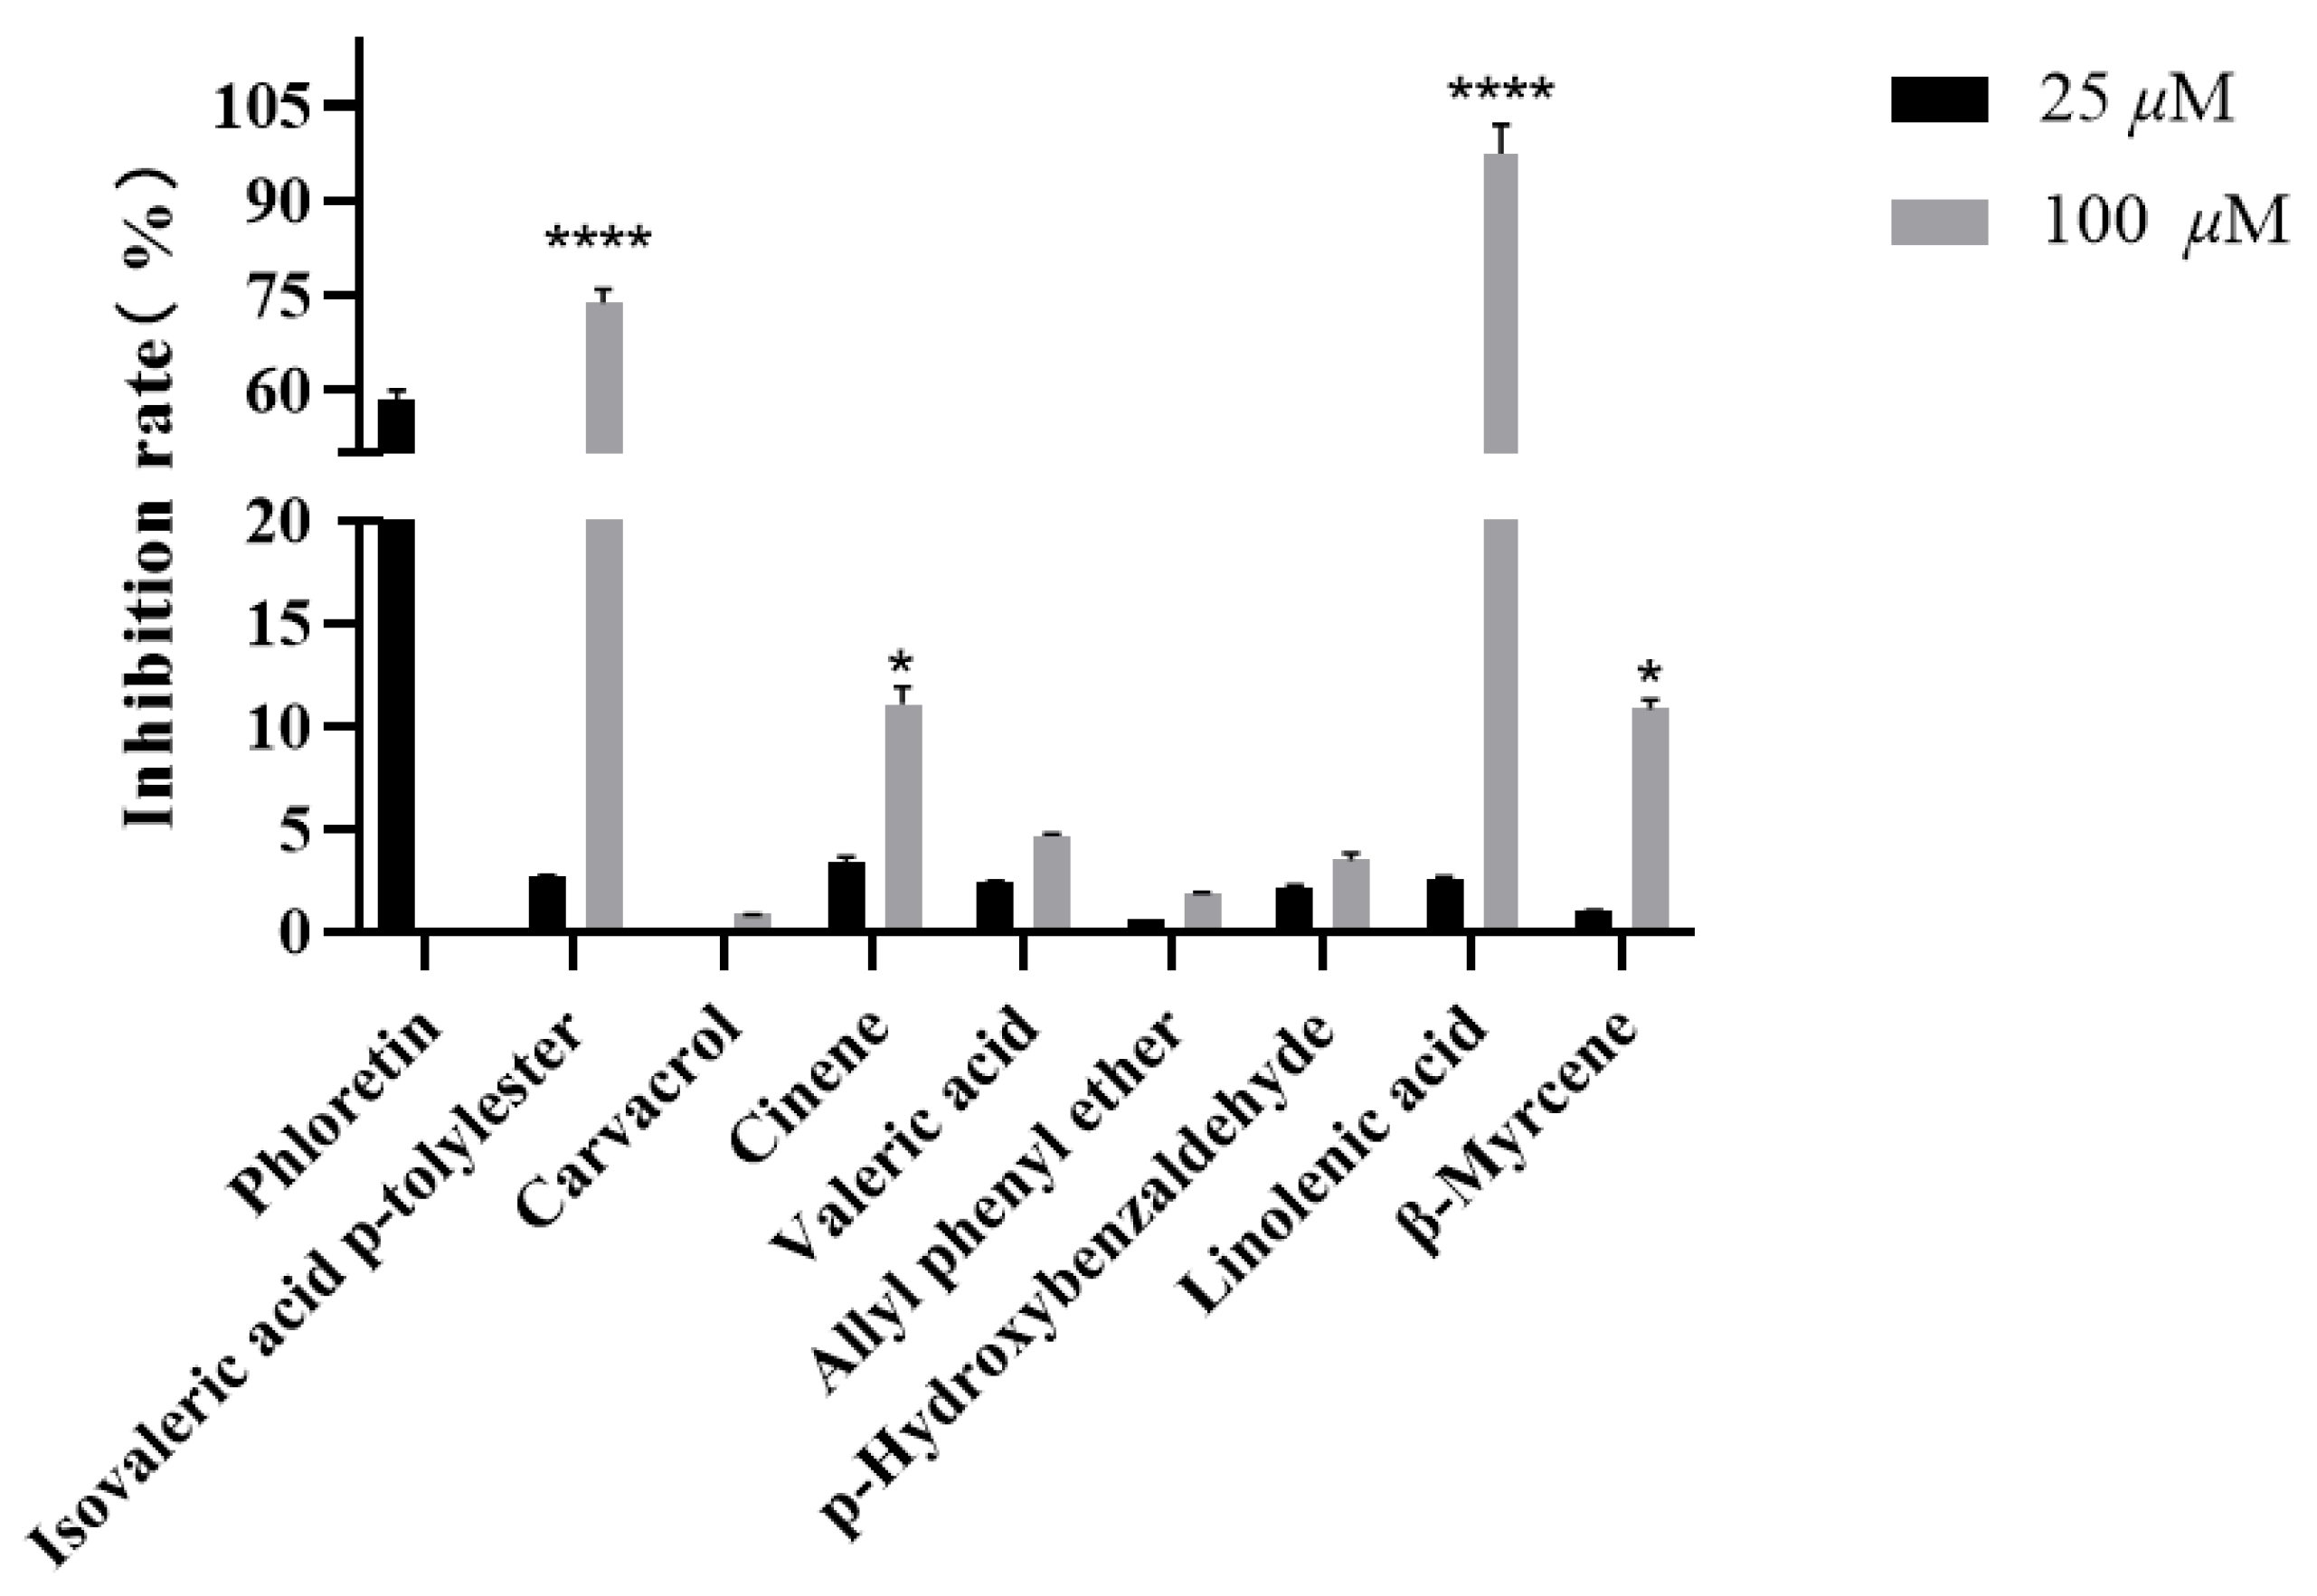
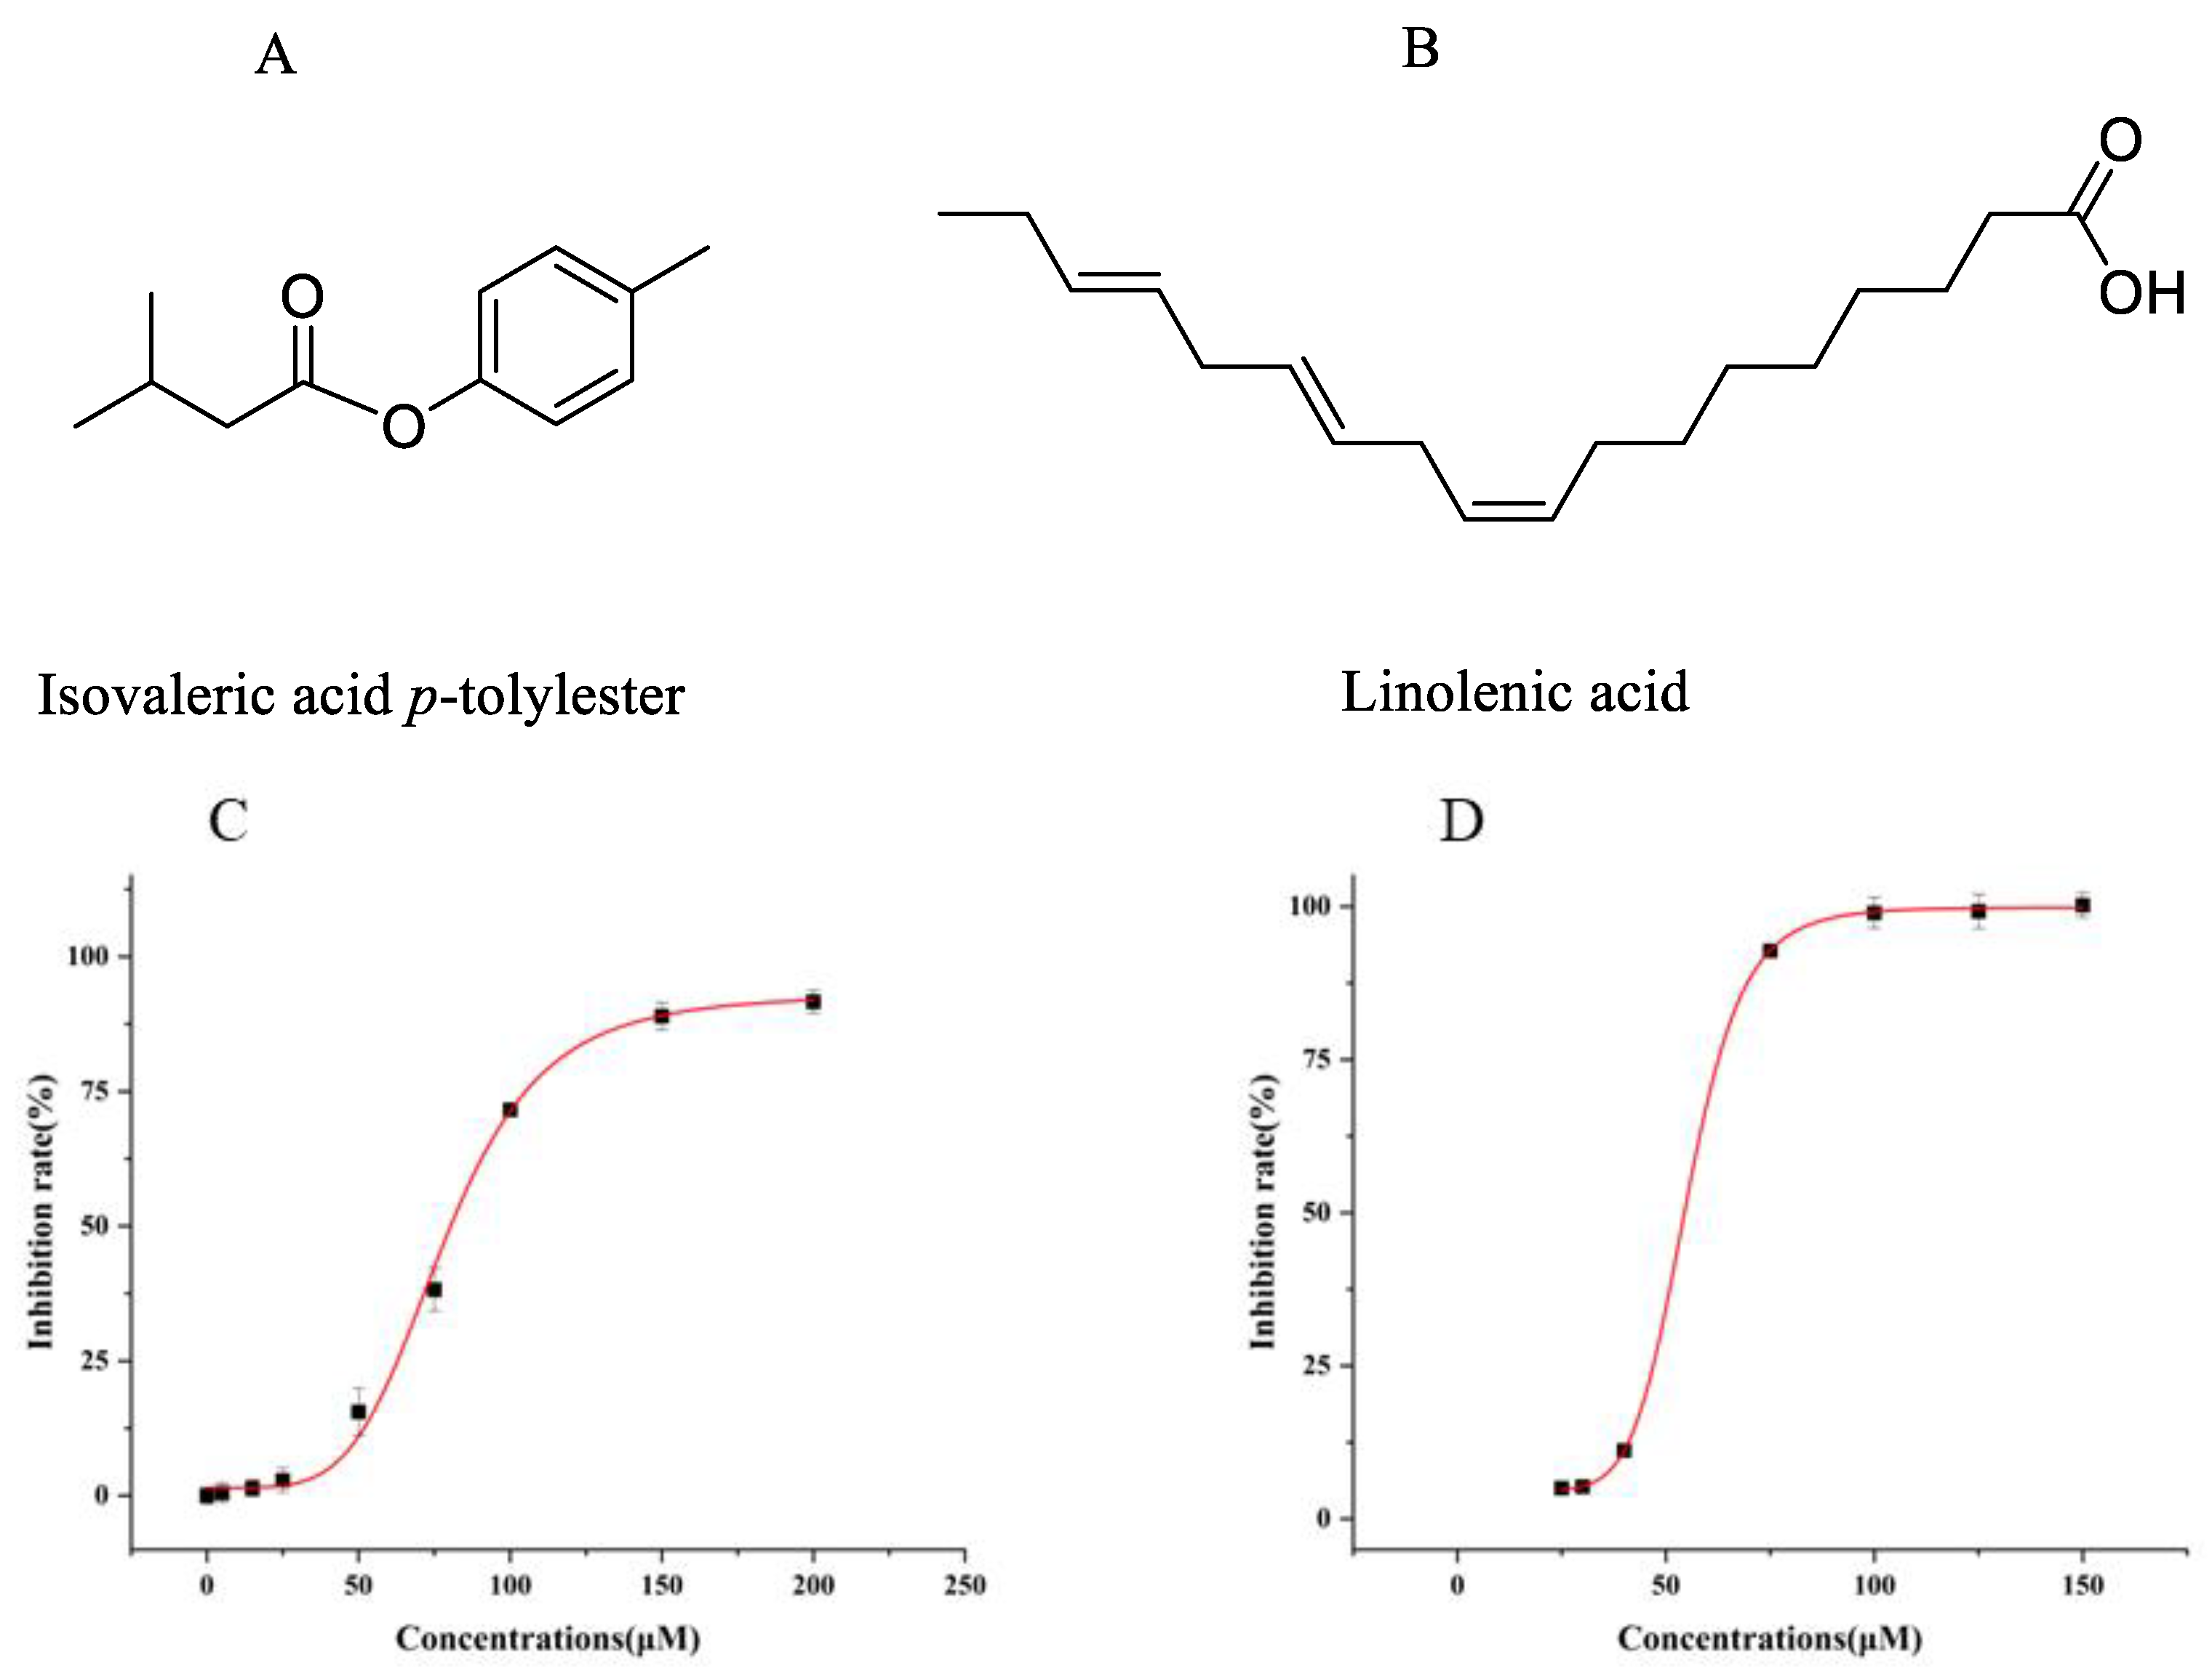
2.3. Inhibition Activity of Compounds Against UT-B
2.4. Molecular Docking Analysis
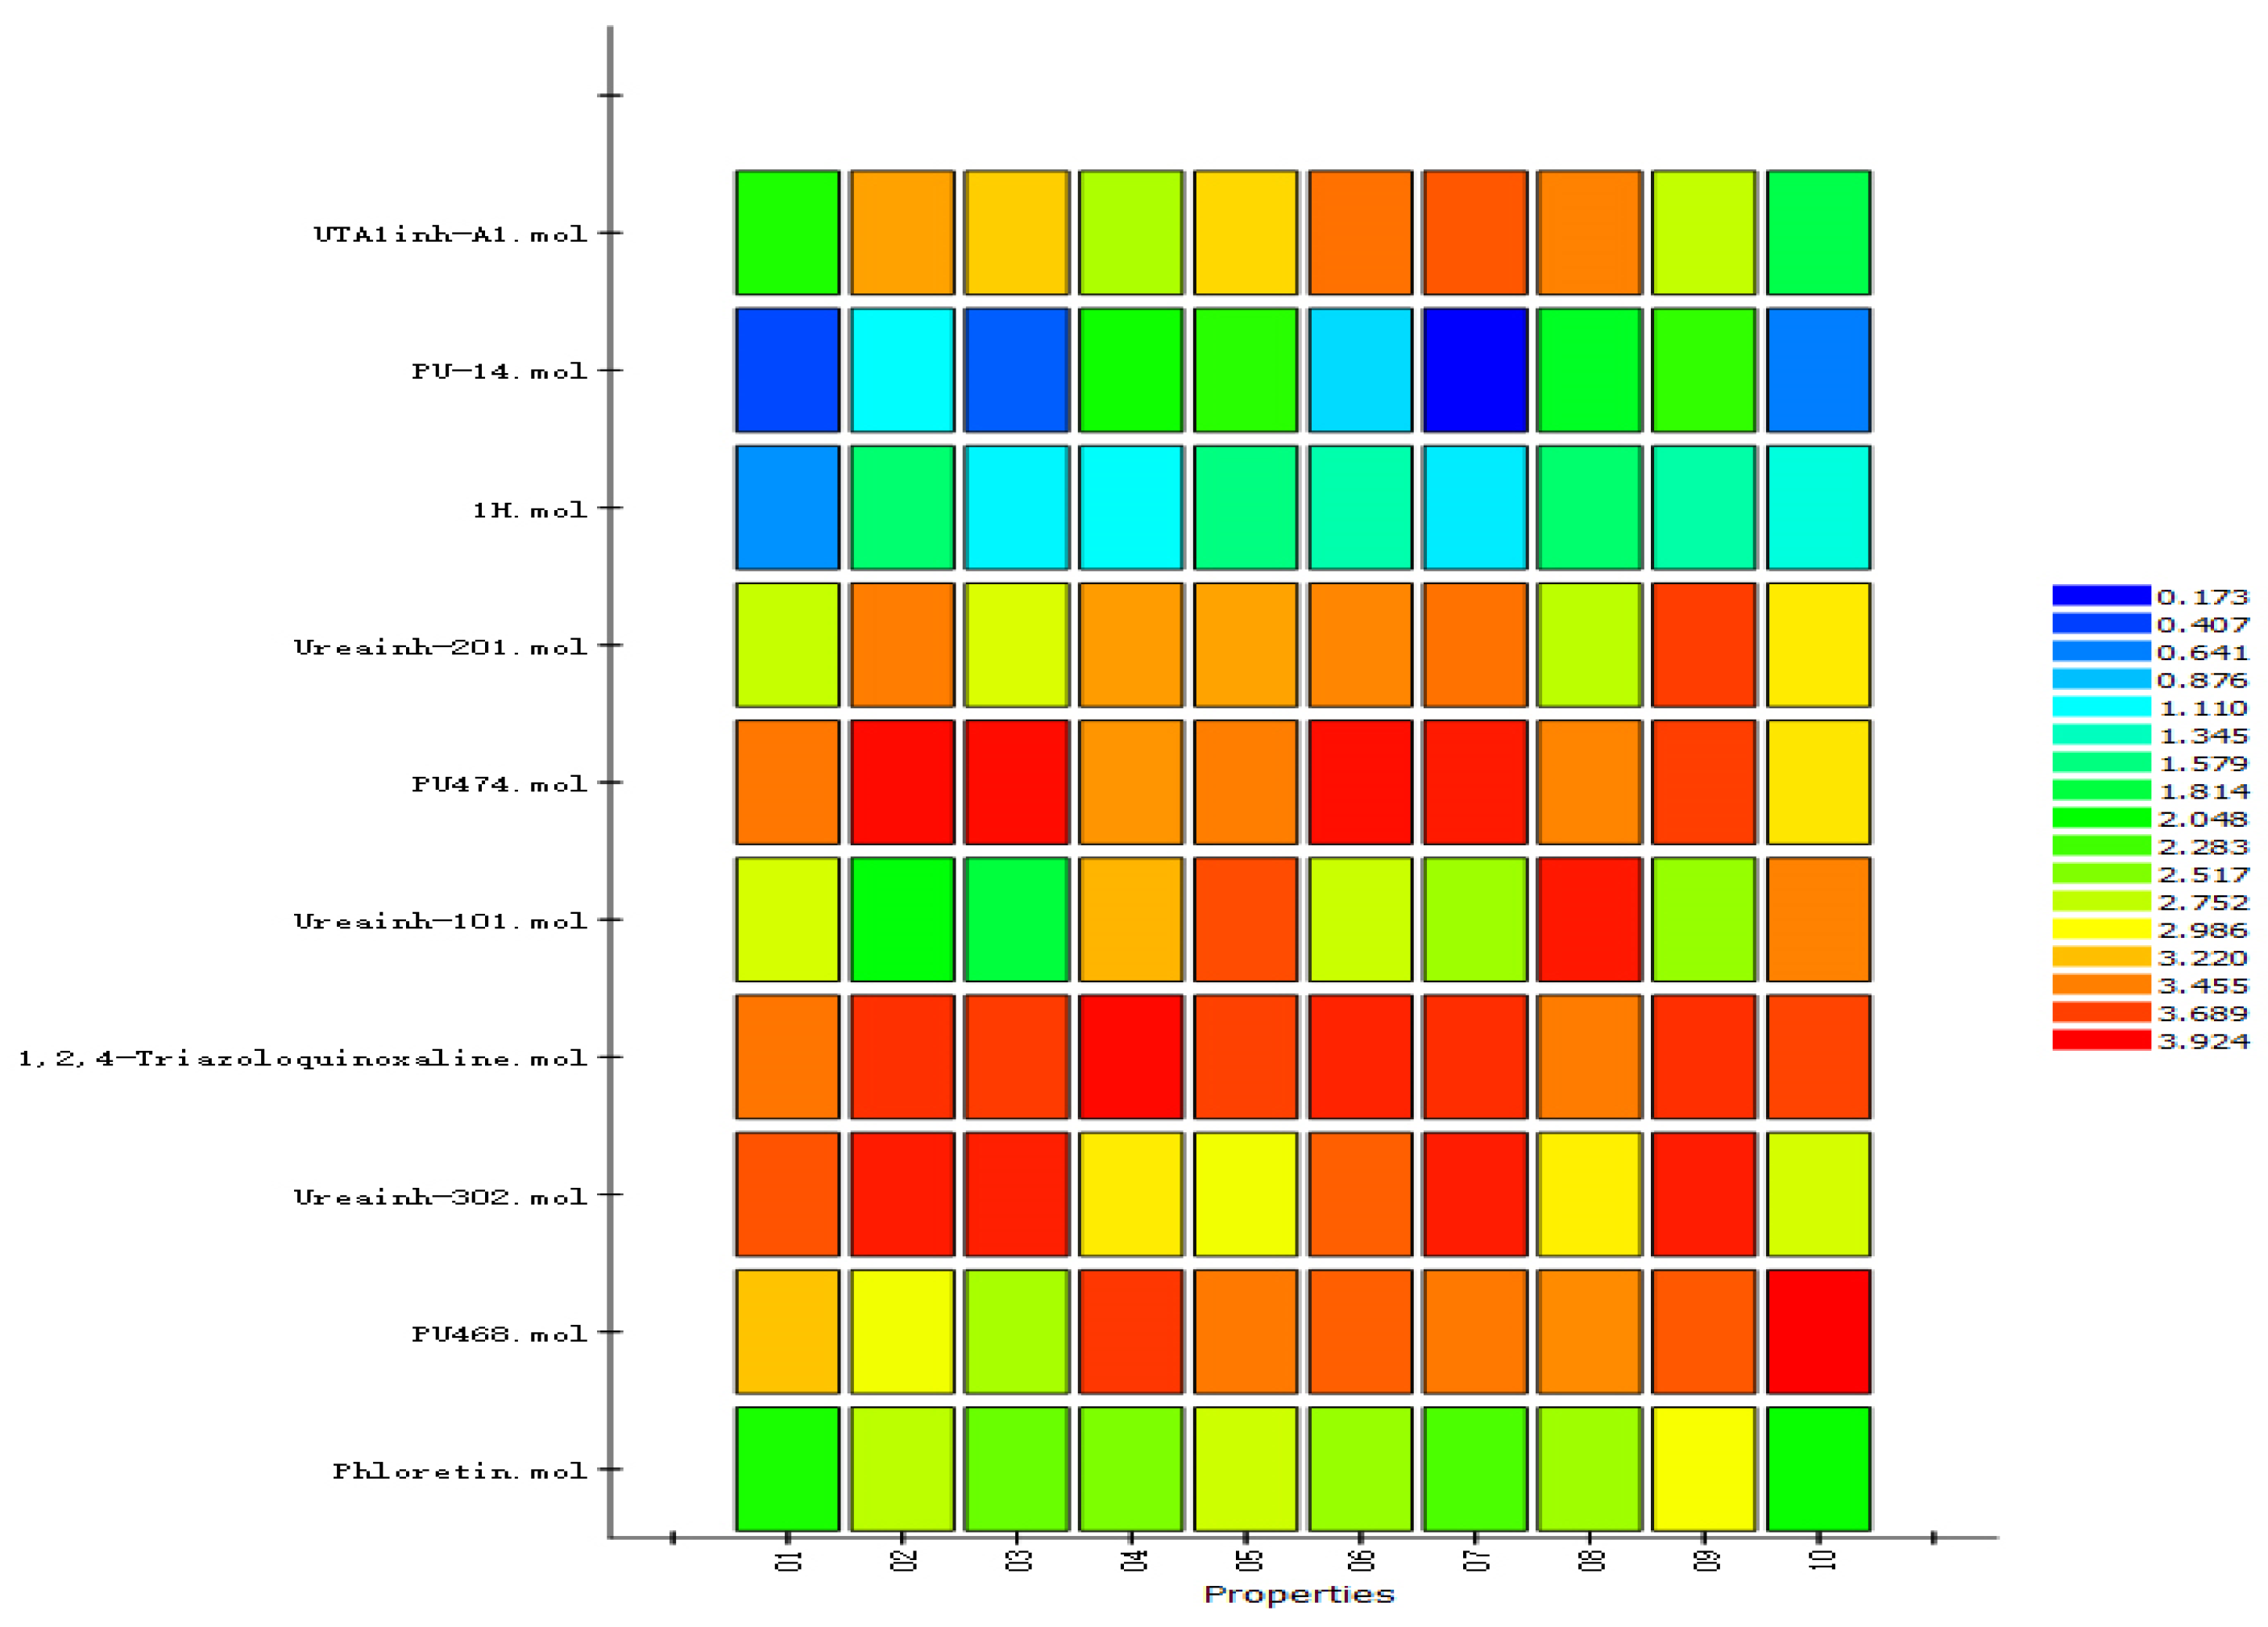
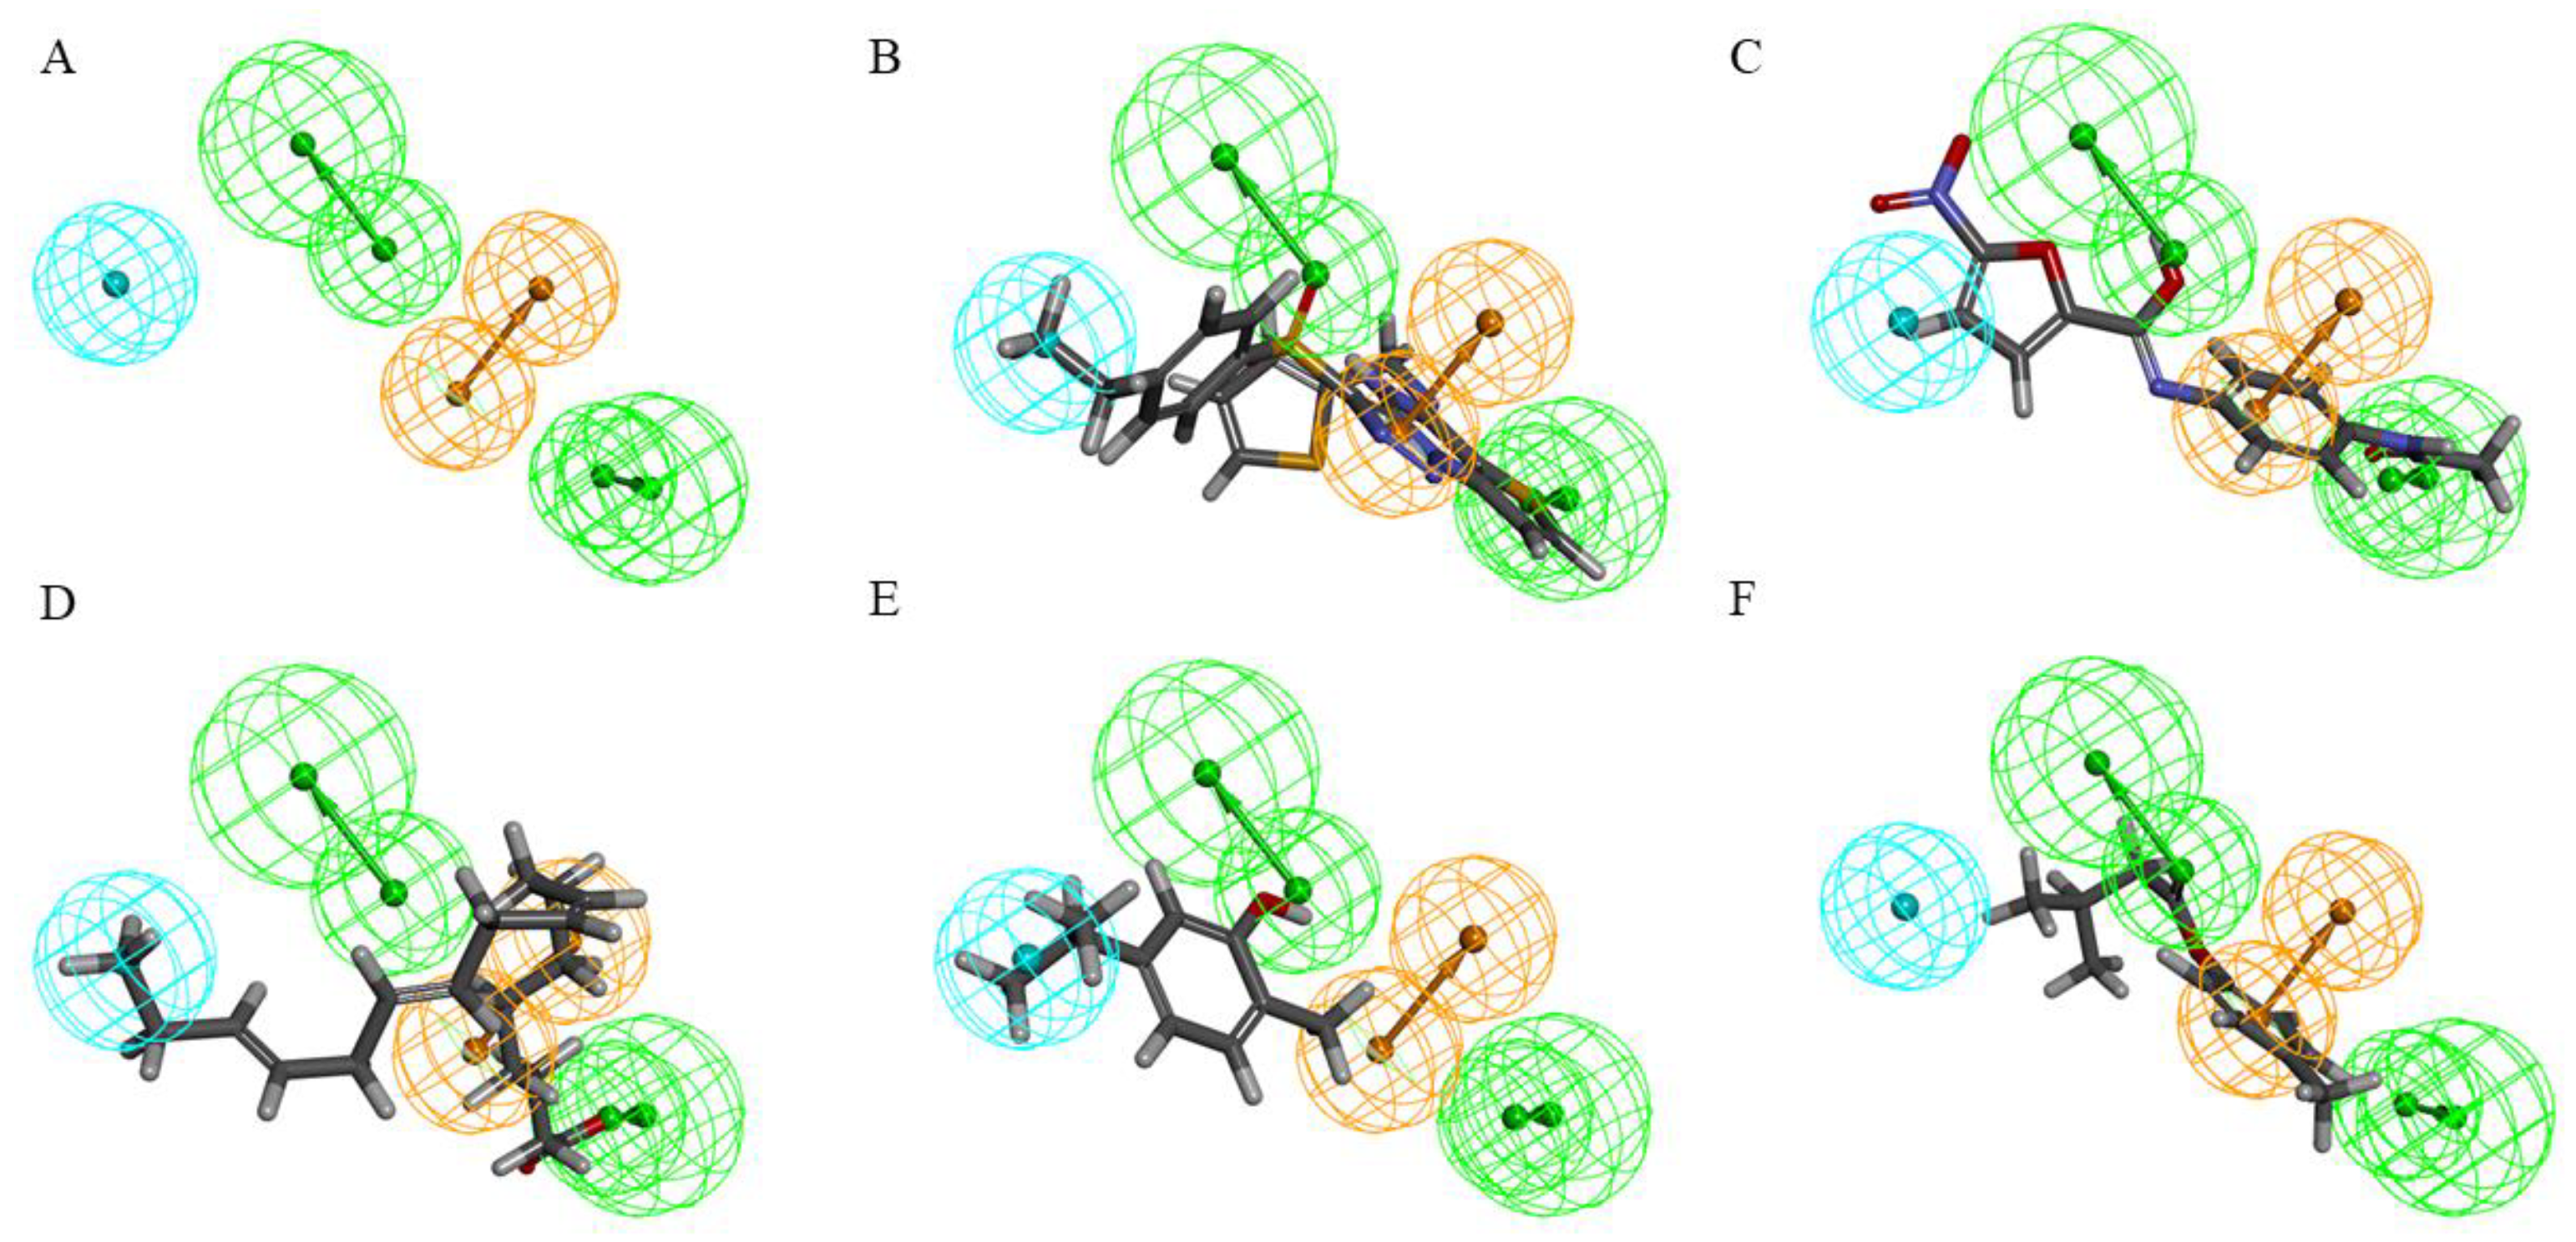
2.5. Establishment and Validation of the Common-Feature-Based Pharmacophore (HipHop)
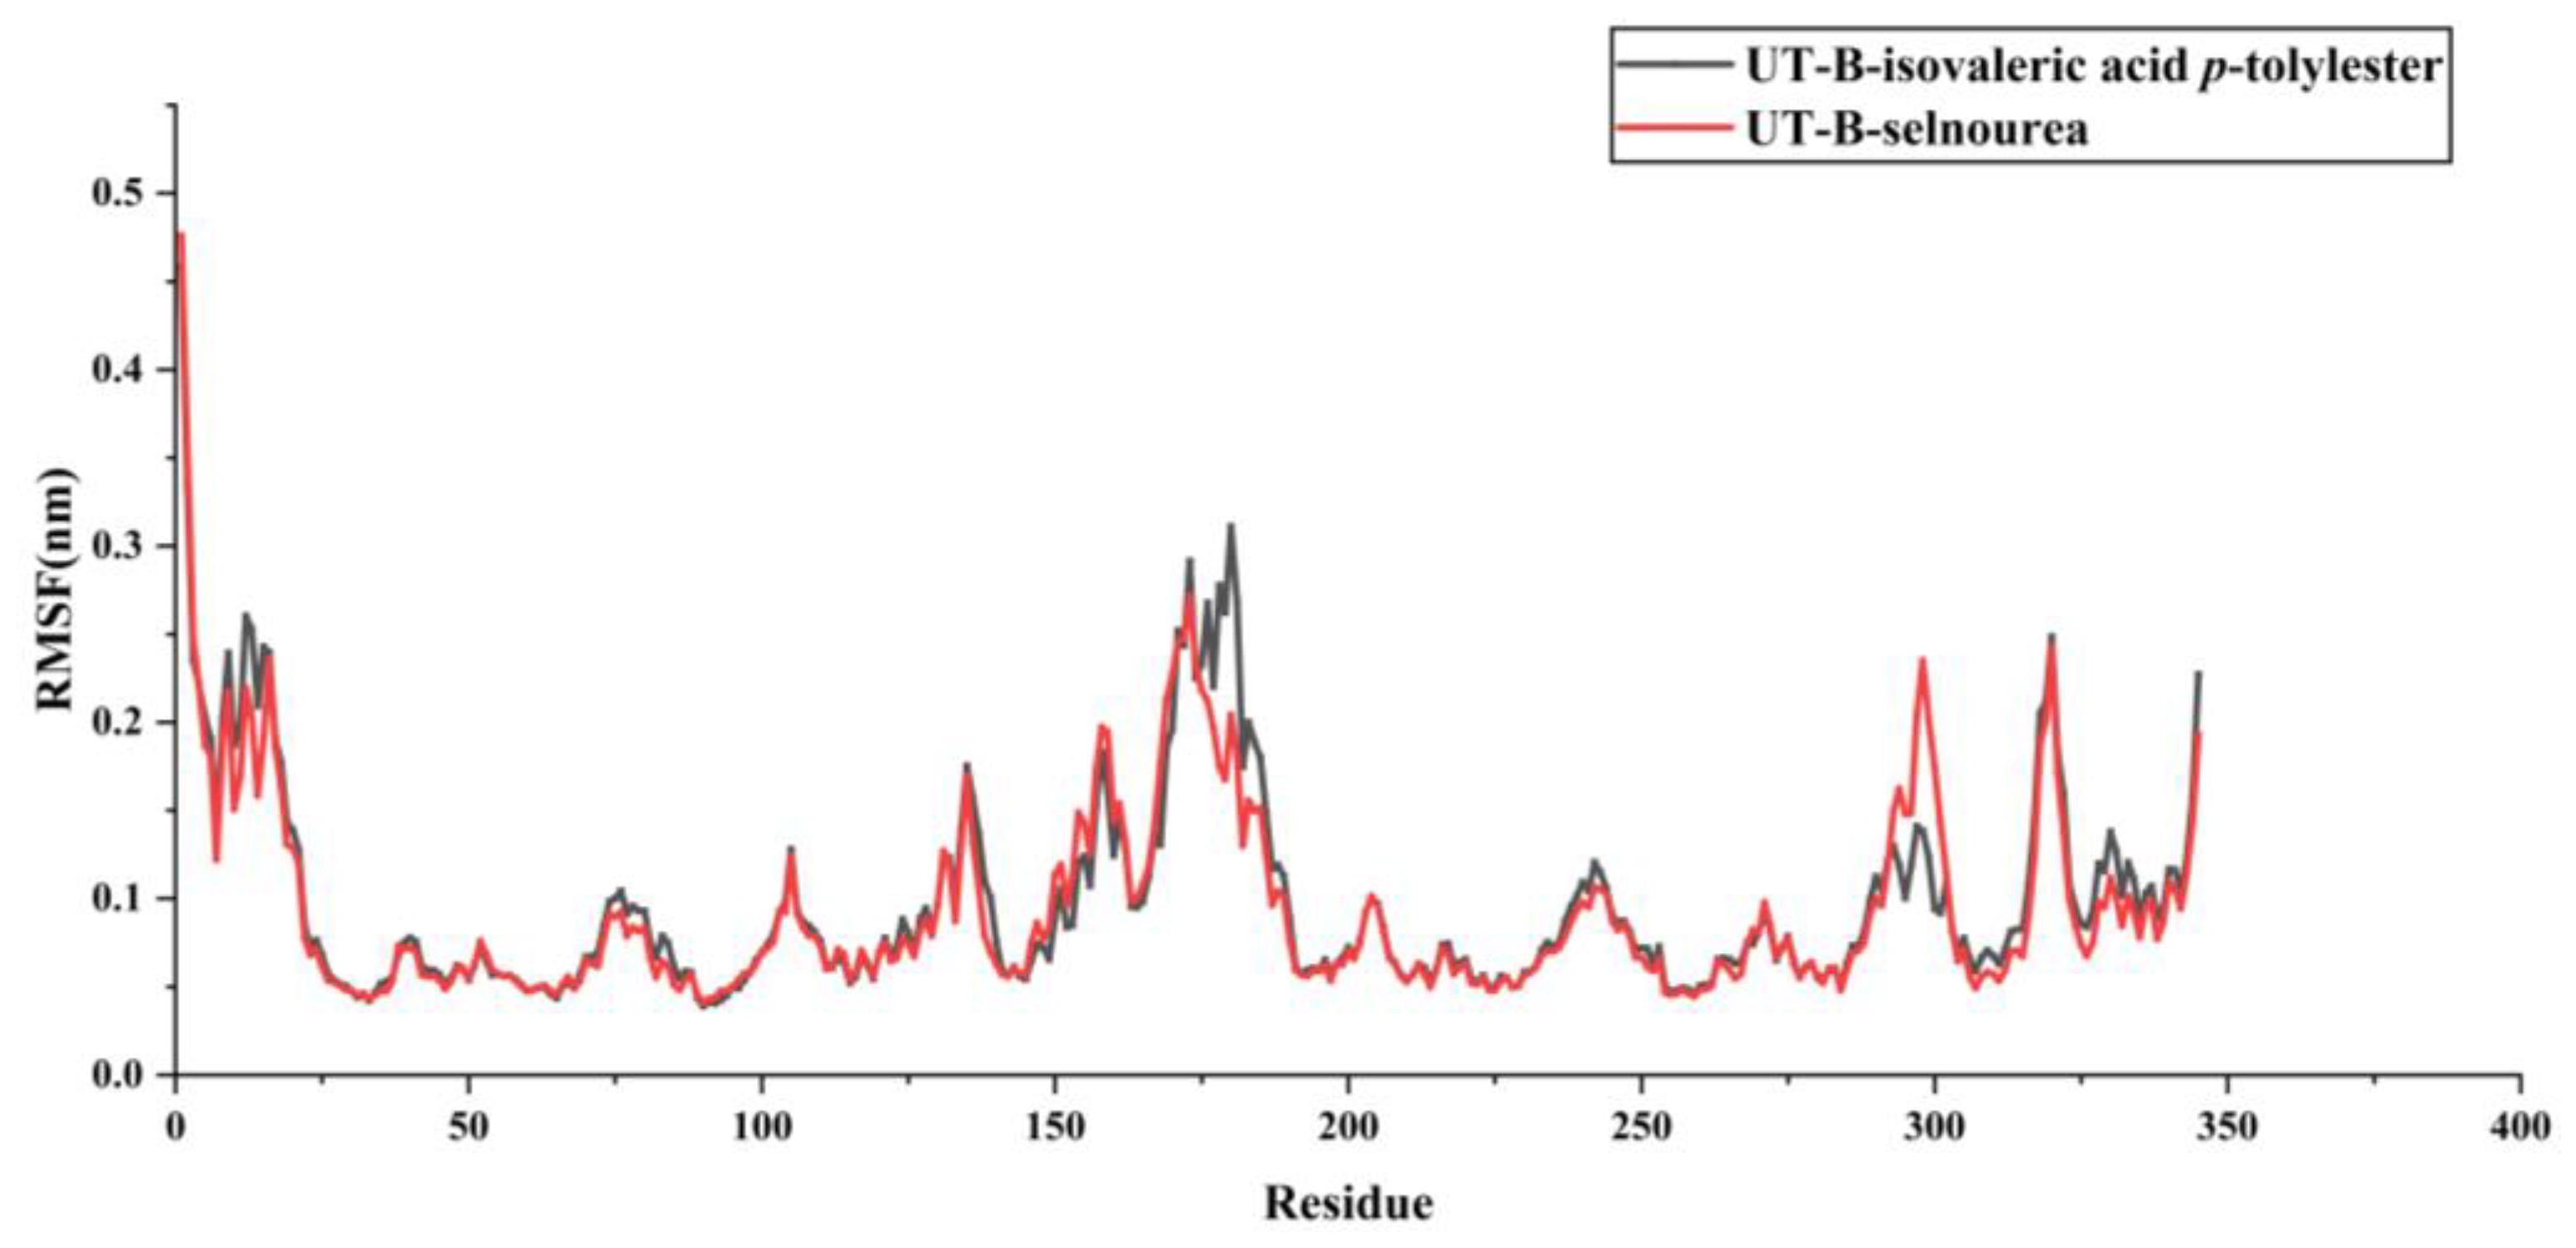
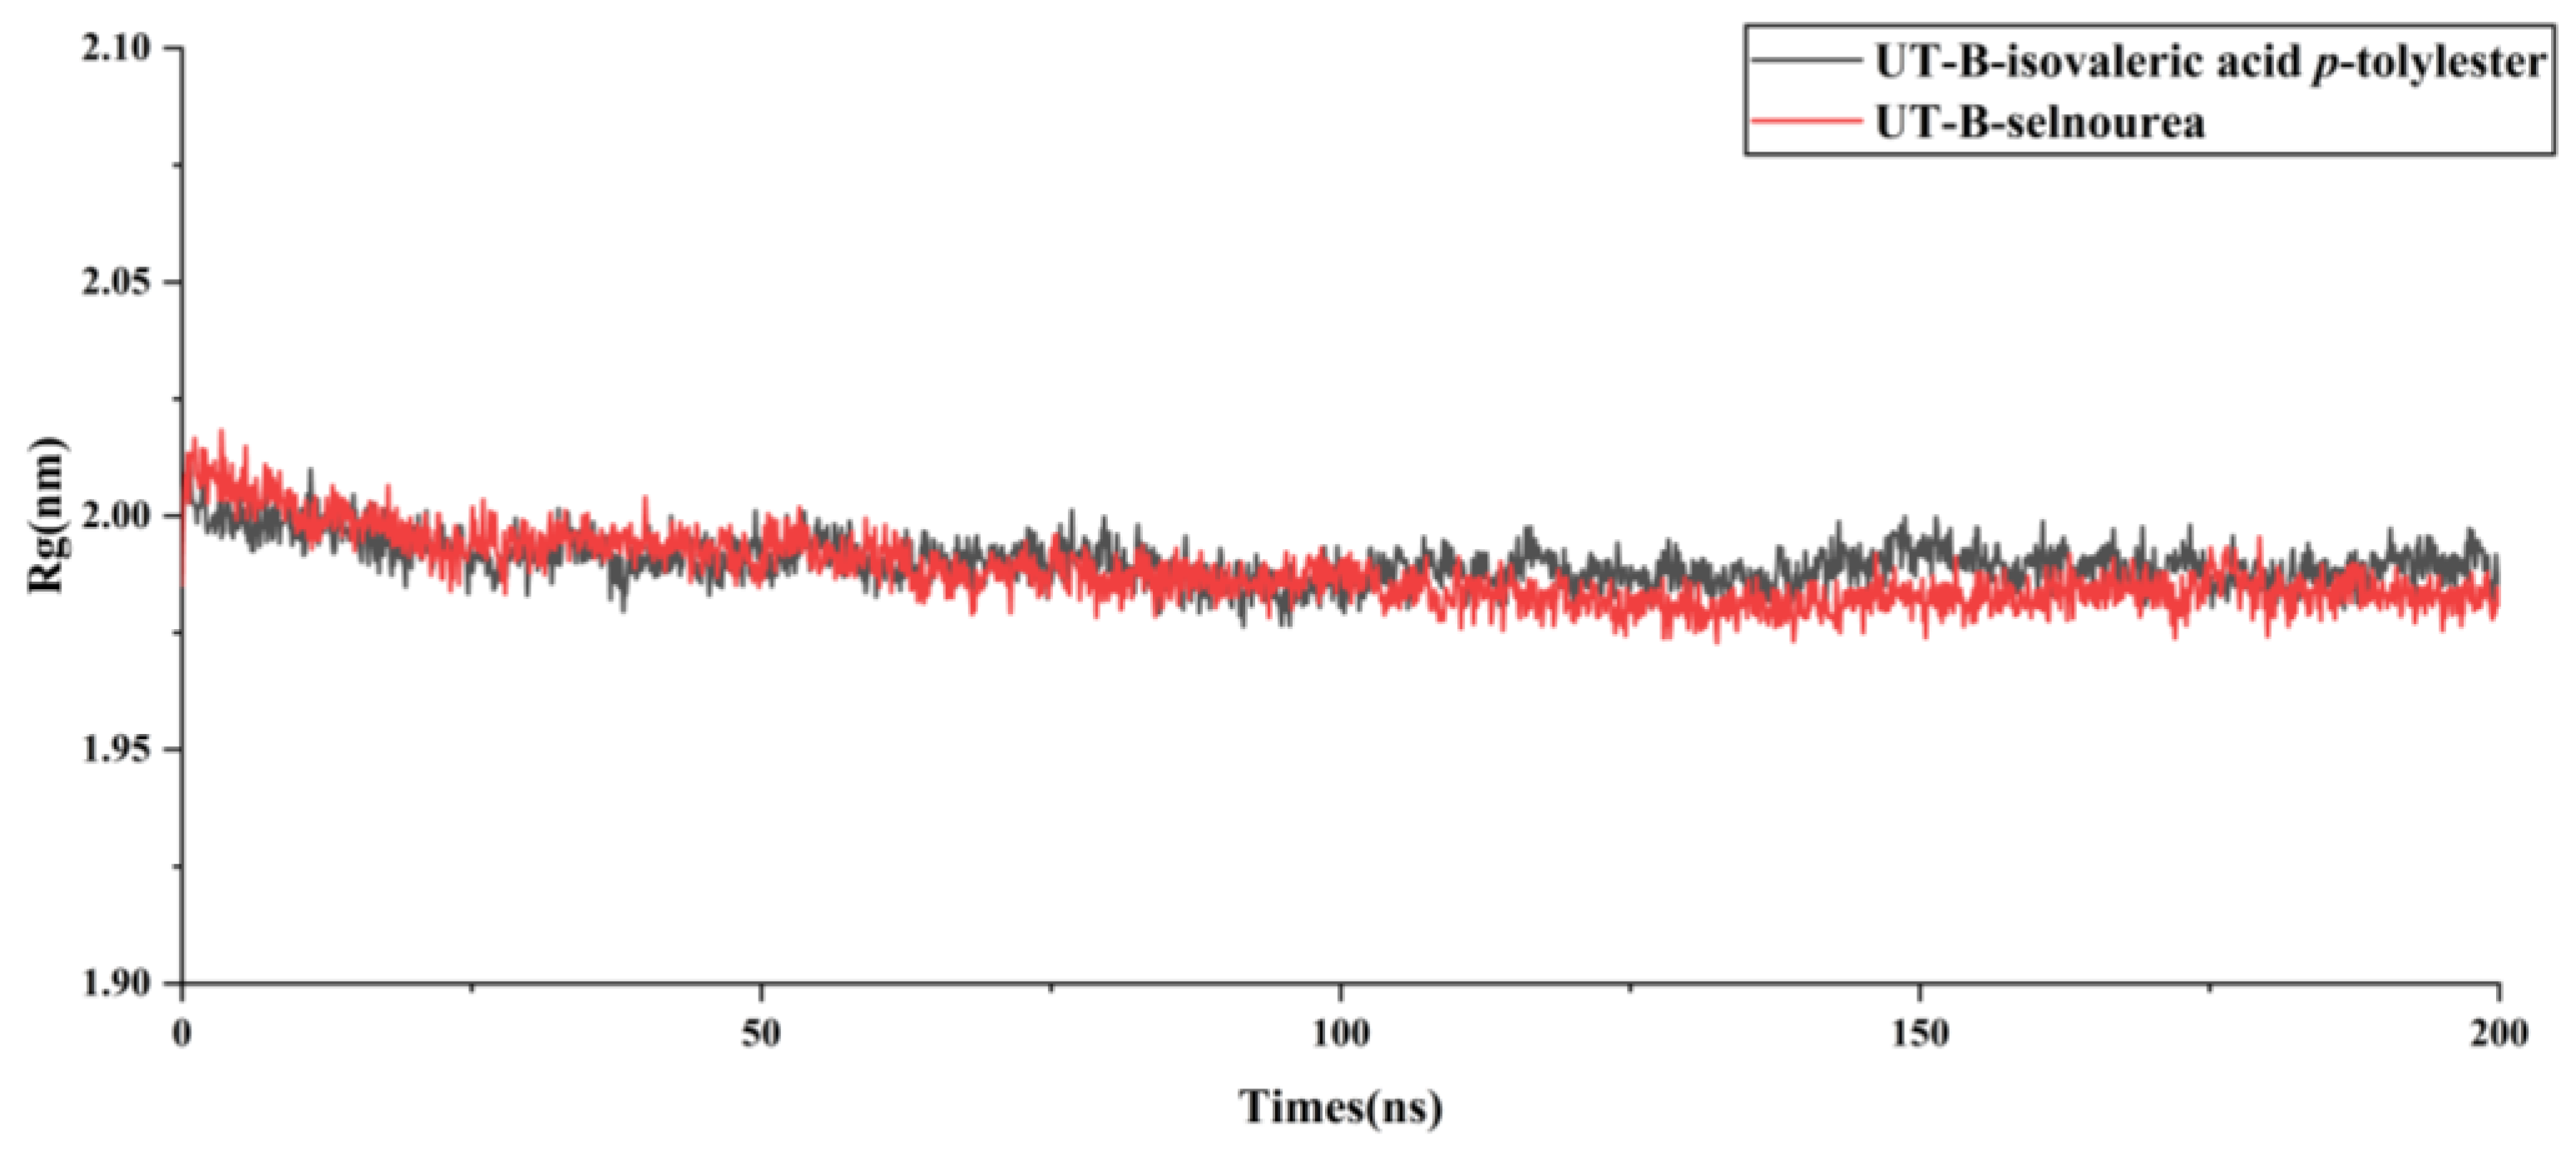
2.6. Assessment of UT-B with Isovaleric Acid p-tolylester by Using MDs Simulation
2.7. SwissADME Prediction of Isovaleric Acid p-tolylester
3. Materials and Methods
3.1. Chemicals, Drugs, and Reagents
3.2. Preparation of Extracts
3.3. Establishment of a Compound Library for Celery Seeds
3.4. Animals
3.5. Collection of Rat Blood and Erythrocyte Suspension Preparation
3.6. UT-B Inhibitory Activity
3.7. UPLC-TOF-MS Analysis
3.8. Molecular Docking
3.9. Pharmacophore Modeling
3.10. Molecular Dynamics Simulations
3.11. ADME Prediction
3.12. Statistical Analysis
4. Conclusions
Supplementary Materials
Author Contributions
Funding
Institutional Review Board Statement
Informed Consent Statement
Data Availability Statement
Conflicts of Interest
References
- Oh, S.W.; Han, S.Y. Loop Diuretics in Clinical Practice. Electrolyte Blood Press 2015, 13, 17–21. [Google Scholar] [PubMed]
- Filippone, E.J.; Ruzieh, M.; Foy, A. Thiazide-Associated Hyponatremia: Clinical Manifestations and Pathophysiology. Am. J. Kidney Dis. 2020, 75, 256–264. [Google Scholar] [PubMed]
- Yu, L.; Liu, T.; Fu, S.; Li, L.; Meng, X.; Su, X.; Xie, Z.; Ren, J.; Meng, Y.; Lv, X.; et al. Physiological functions of urea transporter B. Pflügers Arch. -Eur. J. Physiol. 2019, 471, 1359–1368. [Google Scholar] [CrossRef]
- Smith, C.P. Mammalian urea transporters. Exp. Physiol. 2009, 94, 180–185. [Google Scholar] [CrossRef] [PubMed]
- Geng, X.; Zhang, S.; He, J.; Ma, A.; Li, Y.; Li, M.; Zhou, H.; Chen, G.; Yang, B. The urea transporter UT-A1 plays a predominant role in a urea-dependent urine-concentrating mechanism. J. Biol. Chem. 2020, 295, 9893–9900. [Google Scholar] [CrossRef]
- Esteva-Font, C.; Anderson, M.O.; Verkman, A.S. Urea transporter proteins as targets for small-molecule diuretics. Nat. Rev. Nephrol. 2014, 11, 113–123. [Google Scholar]
- Yang, B.; Bankir, L.; Gillespie, A.; Epstein, C.J.; Verkman, A.S. Urea-selective Concentrating Defect in Transgenic Mice Lacking Urea Transporter UT-B. J. Biol. Chem. 2002, 277, 10633–10637. [Google Scholar]
- Sands, J.M. Critical Role of Urea in the Urine-Concentrating Mechanism. J. Am. Soc. Nephrol. 2007, 18, 670–671. [Google Scholar] [CrossRef]
- Li, M.; Tou, W.I.; Zhou, H.; Li, F.; Ren, H.; Chen, C.Y.-C.; Yang, B. Developing Hypothetical Inhibition Mechanism of Novel Urea Transporter B Inhibitor. Sci. Rep. 2014, 4, 5775. [Google Scholar] [CrossRef]
- Li, X.; Ran, J.; Zhou, H.; Lei, T.; Zhou, L.; Han, J.; Yang, B. Mice Lacking Urea Transporter UT-B Display Depression-Like Behavior. J. Mol. Neurosci. 2012, 46, 362–372. [Google Scholar] [CrossRef]
- Wang, H.; Huang, B.; Wang, W.; Li, J.; Chen, Y.; Flynn, T.; Zhao, M.; Zhou, Z.; Lin, X.; Zhang, Y.; et al. High urea induces depression and LTP impairment through mTOR signalling suppression caused by carbamylation. EBioMedicine 2019, 48, 478–490. [Google Scholar] [CrossRef] [PubMed]
- Zhang, Z.; Dmitrieva, N.I.; Park, J.-H.; Levine, R.L.; Burg, M.B. High urea and NaCl carbonylate proteins in renal cells in culture and in vivo, and high urea causes 8-oxoguanine lesions in their DNA. Proc. Natl. Acad. Sci. USA 2004, 101, 9491–9496. [Google Scholar] [CrossRef] [PubMed]
- Dong, Z.; Ran, J.; Zhou, H.; Chen, J.; Lei, T.; Wang, W.; Sun, Y.; Lin, G.; Bankir, L.; Yang, B. Urea Transporter UT-B Deletion Induces DNA Damage and Apoptosis in Mouse Bladder Urothelium. PLoS ONE 2013, 8, 76952. [Google Scholar] [CrossRef]
- Chi, G.; Dietz, L.; Tang, H.; Snee, M.; Scacioc, A.; Wang, D.; Mckinley, G.; Mukhopadhyay, S.M.M.; Pike, A.C.W.; Chalk, R.; et al. Structural characterization of human urea transporters UT-A and UT-B and their inhibition. Sci. Adv. 2023, 9, 8229. [Google Scholar] [CrossRef]
- Li, F.; Lei, T.; Zhu, J.; Wang, W.; Sun, Y.; Chen, J.; Dong, Z.; Zhou, H.; Yang, B. A novel small-molecule thienoquinolin urea transporter inhibitor acts as a potential diuretic. Kidney Int. 2013, 83, 1076–1086. [Google Scholar] [CrossRef]
- Lee, S.; Esteva-Font, C.; Phuan, P.-W.; Anderson, M.O.; Verkman, A.S. Discovery, synthesis and structure–activity analysis of symmetrical 2,7-disubstituted fluorenones as urea transporter inhibitors. MedChemComm 2015, 6, 1278–1284. [Google Scholar] [CrossRef] [PubMed]
- Ran, J.; Li, M.; Tou, W.; Lei, T.; Zhou, H.; Chen, C.Y.; Yang, B. Phenylphthalazines as small-molecule inhibitors of urea transporter UT-B and their binding model. Acta Pharmacol. Sin. 2016, 37, 973–983. [Google Scholar] [CrossRef]
- Lee, S.; Cil, O.; Diez-Cecilia, E.; Anderson, M.O.; Verkman, A.S. Nanomolar-Potency 1,2,4-Triazoloquinoxaline Inhibitors of the Kidney Urea Transporter UT-A1. J. Med. Chem. 2018, 61, 3209–3217. [Google Scholar] [CrossRef]
- Zhang, S.; Zhao, Y.; Wang, S.; Li, M.; Xu, Y.; Ran, J.; Geng, X.; He, J.; Meng, J.; Shao, G.; et al. Discovery of novel diarylamides as orally active diuretics targeting urea transporters. Acta Pharm. Sin. B 2021, 11, 181–202. [Google Scholar] [CrossRef]
- Wang, S.; Xu, Y.; Zhao, Y.; Zhang, S.; Li, M.; Li, X.; He, J.; Zhou, H.; Ge, Z.; Li, R.; et al. N-(4-acetamidophenyl)-5-acetylfuran-2-carboxamide as a novel orally available diuretic that targets urea transporters with improved PD and PK properties. Eur. J. Med. Chem. 2021, 226, 113859. [Google Scholar] [CrossRef]
- Ying, Y.; Li, N.; Wang, S.; Zhang, H.; Zuo, Y.; Tang, Y.; Qiao, P.; Quan, Y.; Li, M.; Yang, B. Urea Transporter Inhibitor 25a Reduces Ascites in Cirrhotic Rats. Biomedicines 2023, 11, 607. [Google Scholar] [CrossRef] [PubMed]
- Yarnell, E. Botanical medicines for the urinary tract. World J. Urol. 2002, 20, 285–293. [Google Scholar]
- Xinjiang Science, Technology, and Health Press. Uyghur Medicinal Materials Standards; Xinjiang Science, Technology, and Health Press: Urumqi, China, 1993; 428p. [Google Scholar]
- Abulimiti, L.; Liu, L.; HajiA, A.; Liao, L. Study of the chemical constituents in the essential oil from celery seed. Nat. Prod. Res. Dev. 2004, 16, 36–37. [Google Scholar]
- Chen, W.; Shen, G.; Chen, H. Higt purity preparation and inentification of three phthalide compounds from Apium gravolens. J. Pharm. Pract. 2017, 35, 138–140. [Google Scholar]
- Destaillats, F.; Lipids, P.A.J. Base-catalyzed derivatization methodology for FA analysis. application to milk fat and celery seed lipid TAG. Lipids 2002, 37, 527–532. [Google Scholar] [CrossRef]
- Guo, L.; Chen, T.; Chen, X.; Qu, L.; Lu, J.; Zhao, Y. Study on the chemical composition of volatile oil in the celery seed. Henan Sci. 2003, 21, 728–729. [Google Scholar]
- Liu, H. Study on Extraction, Purification and Hypolipidemic Biological Function of Celery Seeds Oil. Ph.D. Thesis, Shenyang Agriculural University, Shenyang, China, 2009. [Google Scholar]
- Lu, Z.G.; Li, W.; Wang, P.J. Chemical Composition and Ability of Scavenging DPPH Radical of Essential Oil and Residue from the Celery Seed. Adv. Mater. Res. 2011, 183–185, 18–21. [Google Scholar] [CrossRef]
- Lv, J.; Mou, X.; Wang, W.; Liao, L.; HajiAkber, A. Studies on chemical constituents of seeds of Apium graveolens L. Lishizhen Med. Mater. Medica Res. 2006, 17, 6–7. [Google Scholar]
- Qu, C.; Wang, Y.; Zhang, B.; Lin, Z. Advances in pharmacology research of celery seed. China J. Tradit. Chin. Med. Pharm. 2019, 34, 5295–5299. [Google Scholar]
- Zeng, Q.; Gong, R.; Yang, H.; Pang, Y. Analysis of Essential Oil from Hunan Celery Seeds by GC/MS Combined with Retention Index. Tradit. Chin. Drug Res. Clin. Pharmacol. 2016, 27, 677–680. [Google Scholar]
- Zhang, J.; Wang, J.; Li, T.; Hui, R.; Hou, D. GC/MS Analysis of Volatile Components in Western Celery Seeds from the United States. Food Sci. 2002, 23, 225–227. [Google Scholar]
- Kooti, W.; Ali-Akbari, S.; Asadi-Samani, M.; Ghadery, H.; Ashtary-Larky, D.J.A.H.M. A review on medicinal plant of Apium graveolens. Adv. Herb. Med. 2015, 1, 48–59. [Google Scholar]
- Moghadam, M.H.; Imenshahidi, M.; Mohajeri, S.A. Antihypertensive Effect of Celery Seed on Rat Blood Pressure in Chronic Administration. J. Med. Food 2013, 16, 558–563. [Google Scholar] [CrossRef]
- Zhu, J.; Zhang, Y.; Yang, C. Protective effect of 3-n-butylphthalide against hypertensive nephropathy in spontaneously hypertensive rats. Mol. Med. Rep. 2015, 11, 1448–1454. [Google Scholar] [CrossRef] [PubMed]
- Shayani Rad, M.; Moohebati, M.; MohammadEbrahimi, S.; Motamedshariaty, V.S.; Mohajeri, S.A. Safety evaluation and biochemical efficacy of celery seed extract (Apium graveolens) capsules in hypertensive patients: A randomized, triple-blind, placebo-controlled, cross-over, clinical trial. Inflammopharmacology 2022, 30, 1669–1684. [Google Scholar] [CrossRef]
- Wang, L.; Hai, Y.; An, L.; Chen, J.; Liang, R.; He, X. Rapid screening the potential mechanism-based inhibitors of CYP3A4 from Tripterygium wilfordi based on computer approaches combined with in vitro bioassay. Bioorganic Med. Chem. 2017, 25, 2689–2700. [Google Scholar] [CrossRef]
- Hutter, C.M. In Silico Prediction of Drug Properties. Curr. Med. Chem. 2009, 16, 189–202. [Google Scholar] [CrossRef]
- Seidel, T.; Wieder, O.; Garon, A.; Langer, T. Applications of the Pharmacophore Concept in Natural Product inspired Drug Design. Mol. Inform. 2020, 39, 2000059. [Google Scholar] [CrossRef]
- Madzhidov, T.I.; Rakhimbekova, A.; Kutlushuna, A.; Polishchuk, P. Probabilistic Approach for Virtual Screening Based on Multiple Pharmacophores. Molecules 2020, 25, 385. [Google Scholar] [CrossRef]
- Giordano, D.; Biancaniello, C.; Argenio, M.A.; Facchiano, A. Drug Design by Pharmacophore and Virtual Screening Approach. Pharmaceuticals 2022, 15, 646. [Google Scholar] [CrossRef]
- Mkhize, S.S.; Simelane, M.B.C.; Mongalo, N.I.; Pooe, O.J.; Maltar Strmečki, N.A.D. Bioprospecting the Biological Effects of Cultivating Pleurotus ostreatus Mushrooms from Selected Agro-Wastes and Maize Flour Supplements. J. Food Biochem. 2023, 2023, 2762972–2762987. [Google Scholar] [CrossRef]
- PRINCIPATO, M.A.; Via, G.C. Protective Agent for Food Products and the like and for Curing and/or Storage Rooms of the Same. International Publication Number WO 2019/243869 A1, 26 December 2019. [Google Scholar]
- Yao, C.; Anderson, M.O.; Zhang, J.; Yang, B.; Phuan, P.; Verkman, A.S. Triazolothienopyrimidine Inhibitors of Urea Transporter UT-B Reduce Urine Concentration. J. Am. Soc. Nephrol. 2012, 23, 1210–1220. [Google Scholar] [PubMed]
- Li, M.; Zhao, Y.; Zhang, S.; Xu, Y.; Wang, S.; Li, B.; Ran, J.; Li, R.; Yang, B. A thienopyridine, CB-20, exerts diuretic activity by inhibiting urea transporters. Acta Pharmacol. Sin. 2020, 41, 65–72. [Google Scholar] [CrossRef]
- Macey, R.L.; Farmer, R.E.L. Inhibition of water and solute permeability in human red cells. Biochim. Biophys. Acta- Biomembr. 1970, 211, 104–106. [Google Scholar]
- Levin, M.H.; Fuente, R.; Verkman, A.S. Urearetics: A small molecule screen yields nanomolar potency inhibitors of urea transporter UT-B. FASEB J. 2007, 21, 551–563. [Google Scholar] [PubMed]
- Esteva-Font, C.; Phuan, P.; Anderson, M.O.; Verkman, A.S. A Small Molecule Screen Identifies Selective Inhibitors of Urea Transporter UT-A. Chem. Biol. 2013, 20, 1235–1244. [Google Scholar]
- Morris, G.M.; Huey, R.; Lindstrom, W.; Sanner, M.F.; Belew, R.K.; Goodsell, D.S.; Olson, A.J. AutoDock4 and AutoDockTools4: Automated docking with selective receptor flexibility. J. Comput. Chem. 2009, 30, 2785–2791. [Google Scholar]
- Van Der Spoel, D.; Lindahl, E.; Hess, B.; Groenhof, G.; Mark, A.E.; Berendsen, H.J.C. GROMACS: Fast, flexible, and free. J. Comput. Chem. 2005, 26, 1701–1718. [Google Scholar] [CrossRef]
- Lu, T.; Chen, F. Multiwfn: A multifunctional wavefunction analyzer. J. Comput. Chem. 2012, 33, 580–592. [Google Scholar]


| Peak | Retention Time | Formula | [M+H]+ | [M+H]+ Calculated | Error (ppm) | Compound |
|---|---|---|---|---|---|---|
| 1 | 6.91 | C12H16O2 | 193.1226 | 193.1229 | −1.6 | Isovaleric acid p-tolylester |
| 2 | 7.03 | C10H14O | 173.0942 | 173.0942 | 0.0 | Carvacrol |
| 3 | 8.54 | C12H16O2 | 385.2386 * | 385.2379 * | 1.8 | L-3-n-butyl-4,5-dihydrophth-alide |
| 4 | 8.56 | C15H24 | 205.1957 | 205.1956 | 0.5 | β-selinene |
| Peak | Retention Time | Formula | [M+H]+ | [M+H]+ Calculated | Error (ppm) | Compound |
|---|---|---|---|---|---|---|
| 1 | 3.64 | C10H16 | 273.2582 * | 273.2583 * | 0.4 | Cinene |
| 2 | 3.90 | C5H10O2 | 227.1260 * | 227.1259 * | 0.4 | Valeric acid |
| 3 | 3.89 | C9H10O | 291.1361 * | 291.1361 * | 0.0 | Allyl phenyl ether |
| 4 | 5.92 | C7H6O2 | 267.0638 * | 267.0633 * | 1.9 | p-Hydroxybenzaldehyde |
| 5 | 6.98 | C10H14O | 173.0942 | 173.0942 | 0.0 | Carvacrol |
| 6 | 8.11 | C18H30O2 | 279.2327 | 279.2324 | 1.1 | Linolenic acid |
| 7 | 8.50 | C10H16 | 273.2586 * | 273.2583 * | 0.4 | β-Myrcene |
| NO. | Name | Structural | IC50/EC50 |
|---|---|---|---|
| 1 | UTBinh-14 [45] |  | 0.025 μM |
| 2 | PU168 [9] |  | 0.2 μM |
| 3 | PU-1424 [17] |  | 0.69 μM |
| 4 | 25a [20] | 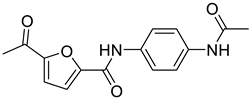 | 0.58 μM |
| 5 | CB-20 [46] |  | 2.01 μM |
| No. | Features | Rank |
|---|---|---|
| 1 | RHAA | 46.204 |
| 2 | RHAA | 46.204 |
| 3 | RHAA | 44.155 |
| 4 | RHAA | 44.155 |
| 5 | RHAA | 42.657 |
| 6 | RHAA | 42.090 |
| 7 | RHAA | 41.997 |
| 8 | RHAA | 41.102 |
| 9 | RHAA | 41.016 |
| 10 | RHAA | 40.861 |
| NO. | Name | Structural | IC50/EC50 |
|---|---|---|---|
| 1 | Phloretin [47] |  | 0.77 mM |
| 2 | PU468 [9] | 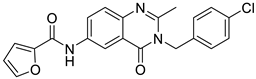 | 0.80 μM |
| 3 | 1H [19] | 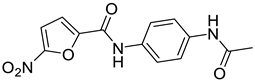 | 1.60 μM |
| 4 | PU-14 [15] |  | 0.2 μM |
| 5 | PU-474 [9] | 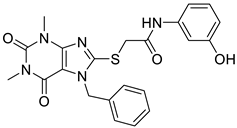 | 0.28 μM |
| 6 | Ureainh-101 [48] |  | 0.03 μM |
| 7 | Ureainh-201 [48] |  | 0.3 μM |
| 8 | Ureainh-302 [48] | 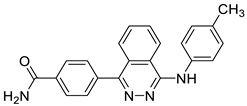 | 0.2 μM |
| 9 | 1,2,4-Triazoloquinoxaline [18] |  | 2 μM |
| 10 | UTA1inh-A1 [49] | 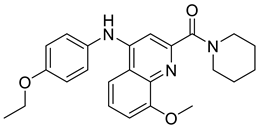 | 16 μM |
| Time | A (%) | B (%) | Curve |
|---|---|---|---|
| 0 | 10 | 90 | |
| 1.50 | 35 | 65 | 6 |
| 5.50 | 50 | 50 | 6 |
| 8.00 | 75 | 25 | 6 |
| 12.50 | 97 | 3 | 6 |
| 14.50 | 97 | 3 | 6 |
| 15.00 | 10 | 90 | 6 |
| 17.00 | 10 | 90 | 6 |
Disclaimer/Publisher’s Note: The statements, opinions and data contained in all publications are solely those of the individual author(s) and contributor(s) and not of MDPI and/or the editor(s). MDPI and/or the editor(s) disclaim responsibility for any injury to people or property resulting from any ideas, methods, instructions or products referred to in the content. |
© 2025 by the authors. Licensee MDPI, Basel, Switzerland. This article is an open access article distributed under the terms and conditions of the Creative Commons Attribution (CC BY) license (https://creativecommons.org/licenses/by/4.0/).
Share and Cite
Chen, G.; Li, X.; Pan, X.; Guo, L.; Wei, W.; Sun, X.; Wei, H.; Qin, X.; Zhang, K.; Zhang, W.; et al. Identification and Validation of Urea Transporter B Inhibitor from Apium graveolens L. Seeds In Vitro and In Silico. Molecules 2025, 30, 1540. https://doi.org/10.3390/molecules30071540
Chen G, Li X, Pan X, Guo L, Wei W, Sun X, Wei H, Qin X, Zhang K, Zhang W, et al. Identification and Validation of Urea Transporter B Inhibitor from Apium graveolens L. Seeds In Vitro and In Silico. Molecules. 2025; 30(7):1540. https://doi.org/10.3390/molecules30071540
Chicago/Turabian StyleChen, Guanzhong, Xin Li, Xinhui Pan, Li Guo, Wei Wei, Xiaoying Sun, Hongtao Wei, Xue Qin, Ke Zhang, Wei Zhang, and et al. 2025. "Identification and Validation of Urea Transporter B Inhibitor from Apium graveolens L. Seeds In Vitro and In Silico" Molecules 30, no. 7: 1540. https://doi.org/10.3390/molecules30071540
APA StyleChen, G., Li, X., Pan, X., Guo, L., Wei, W., Sun, X., Wei, H., Qin, X., Zhang, K., Zhang, W., Wei, L., Sun, P., & Yang, X. (2025). Identification and Validation of Urea Transporter B Inhibitor from Apium graveolens L. Seeds In Vitro and In Silico. Molecules, 30(7), 1540. https://doi.org/10.3390/molecules30071540