
Recovery of Natural Hypoglycemic Compounds from Industrial Distillation Wastewater of Lamiaceae

 , , ,
, , ,  ,
,  and
and
Abstract
1. Introduction
2. Results and Discussion
2.1. Recovery of Phenolics from Rosemary DWW and Antioxidant Activity
- Procedure A—Recovery by static adsorption/desorption: (i) mixing the DWW with resins, (ii) the discarding o the aqueous solution containing non-retained compounds (AP), and (iii) the desorption of retained compounds with ethanol (EP).
- Procedure B—Recovery by dynamic adsorption/desorption: (i) loading the DWW on the column packed with resins, and (ii) eluting with water (AF) and then with ethanol (EF).
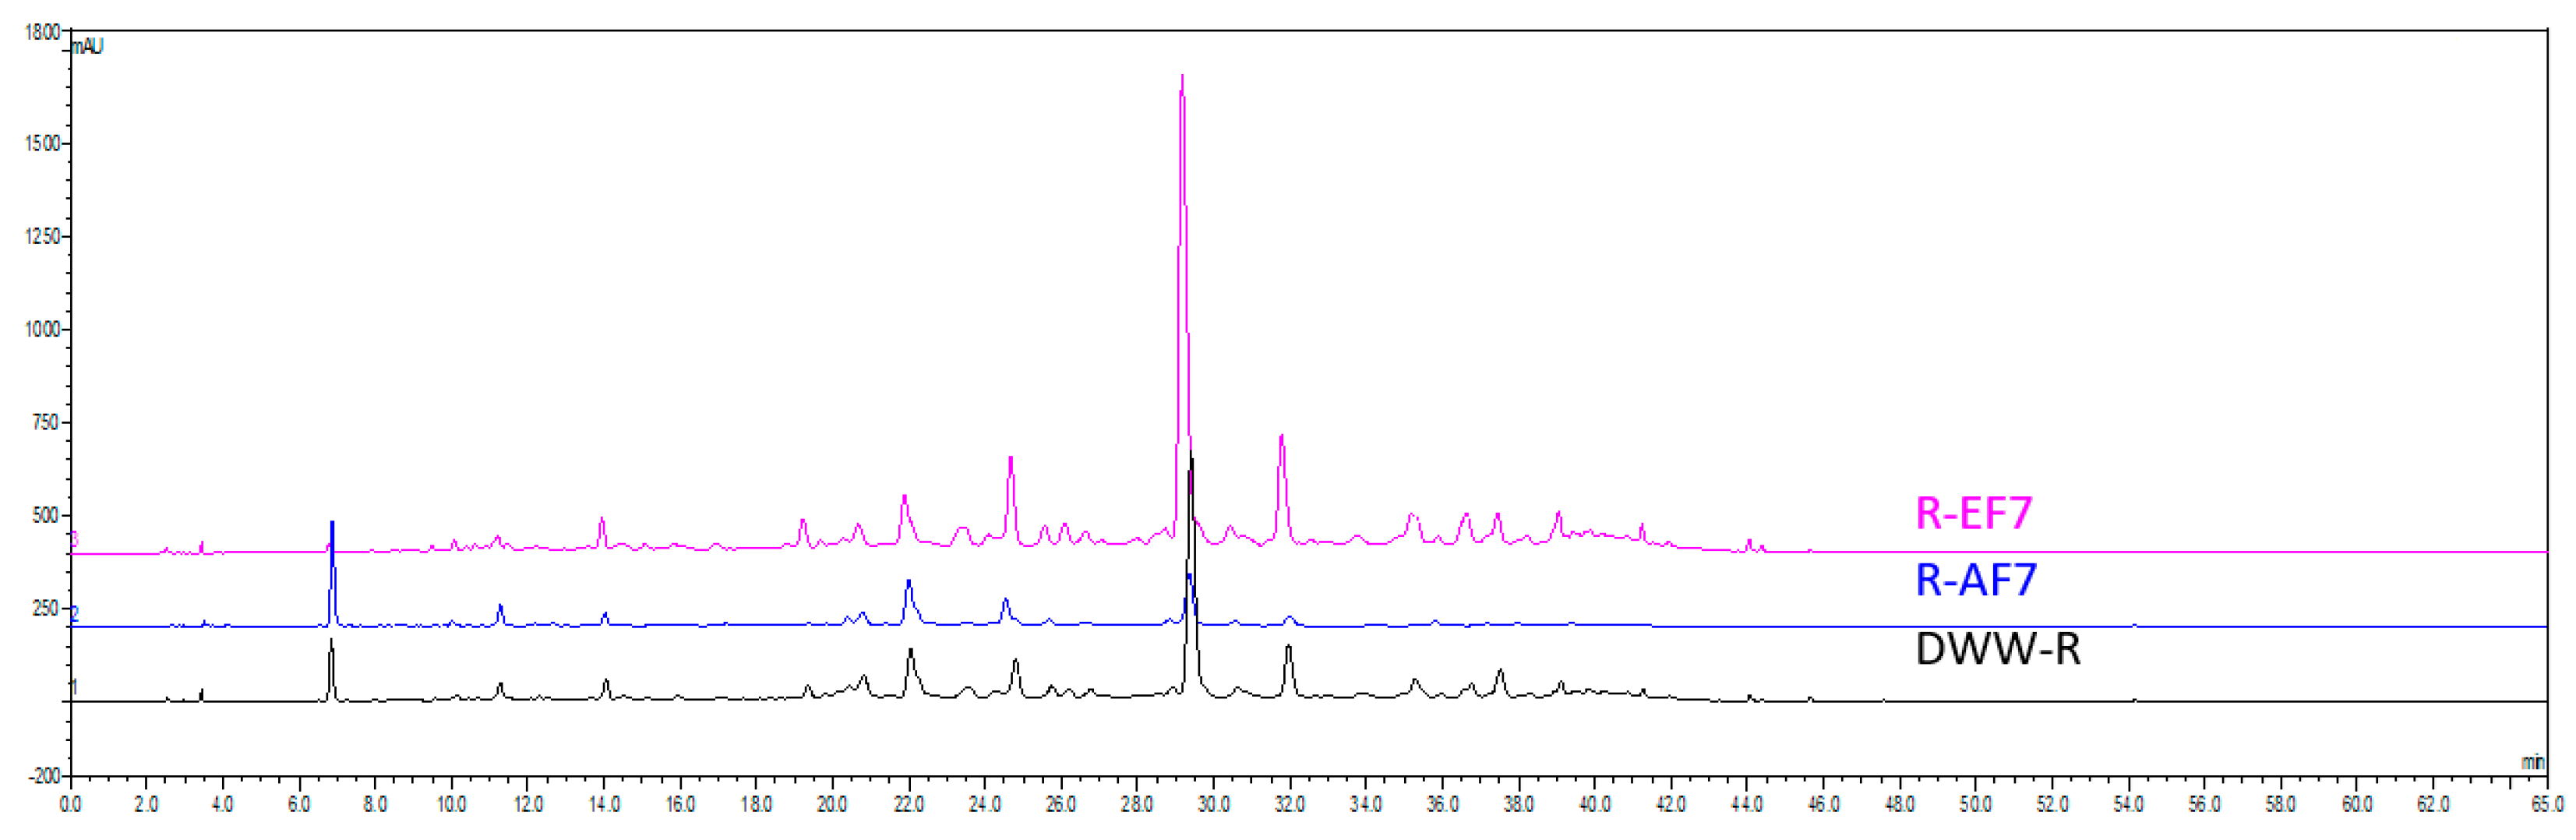
2.2. HPLC-UV Quantification of Rosmarinic Acid in DWW-R and Fractions
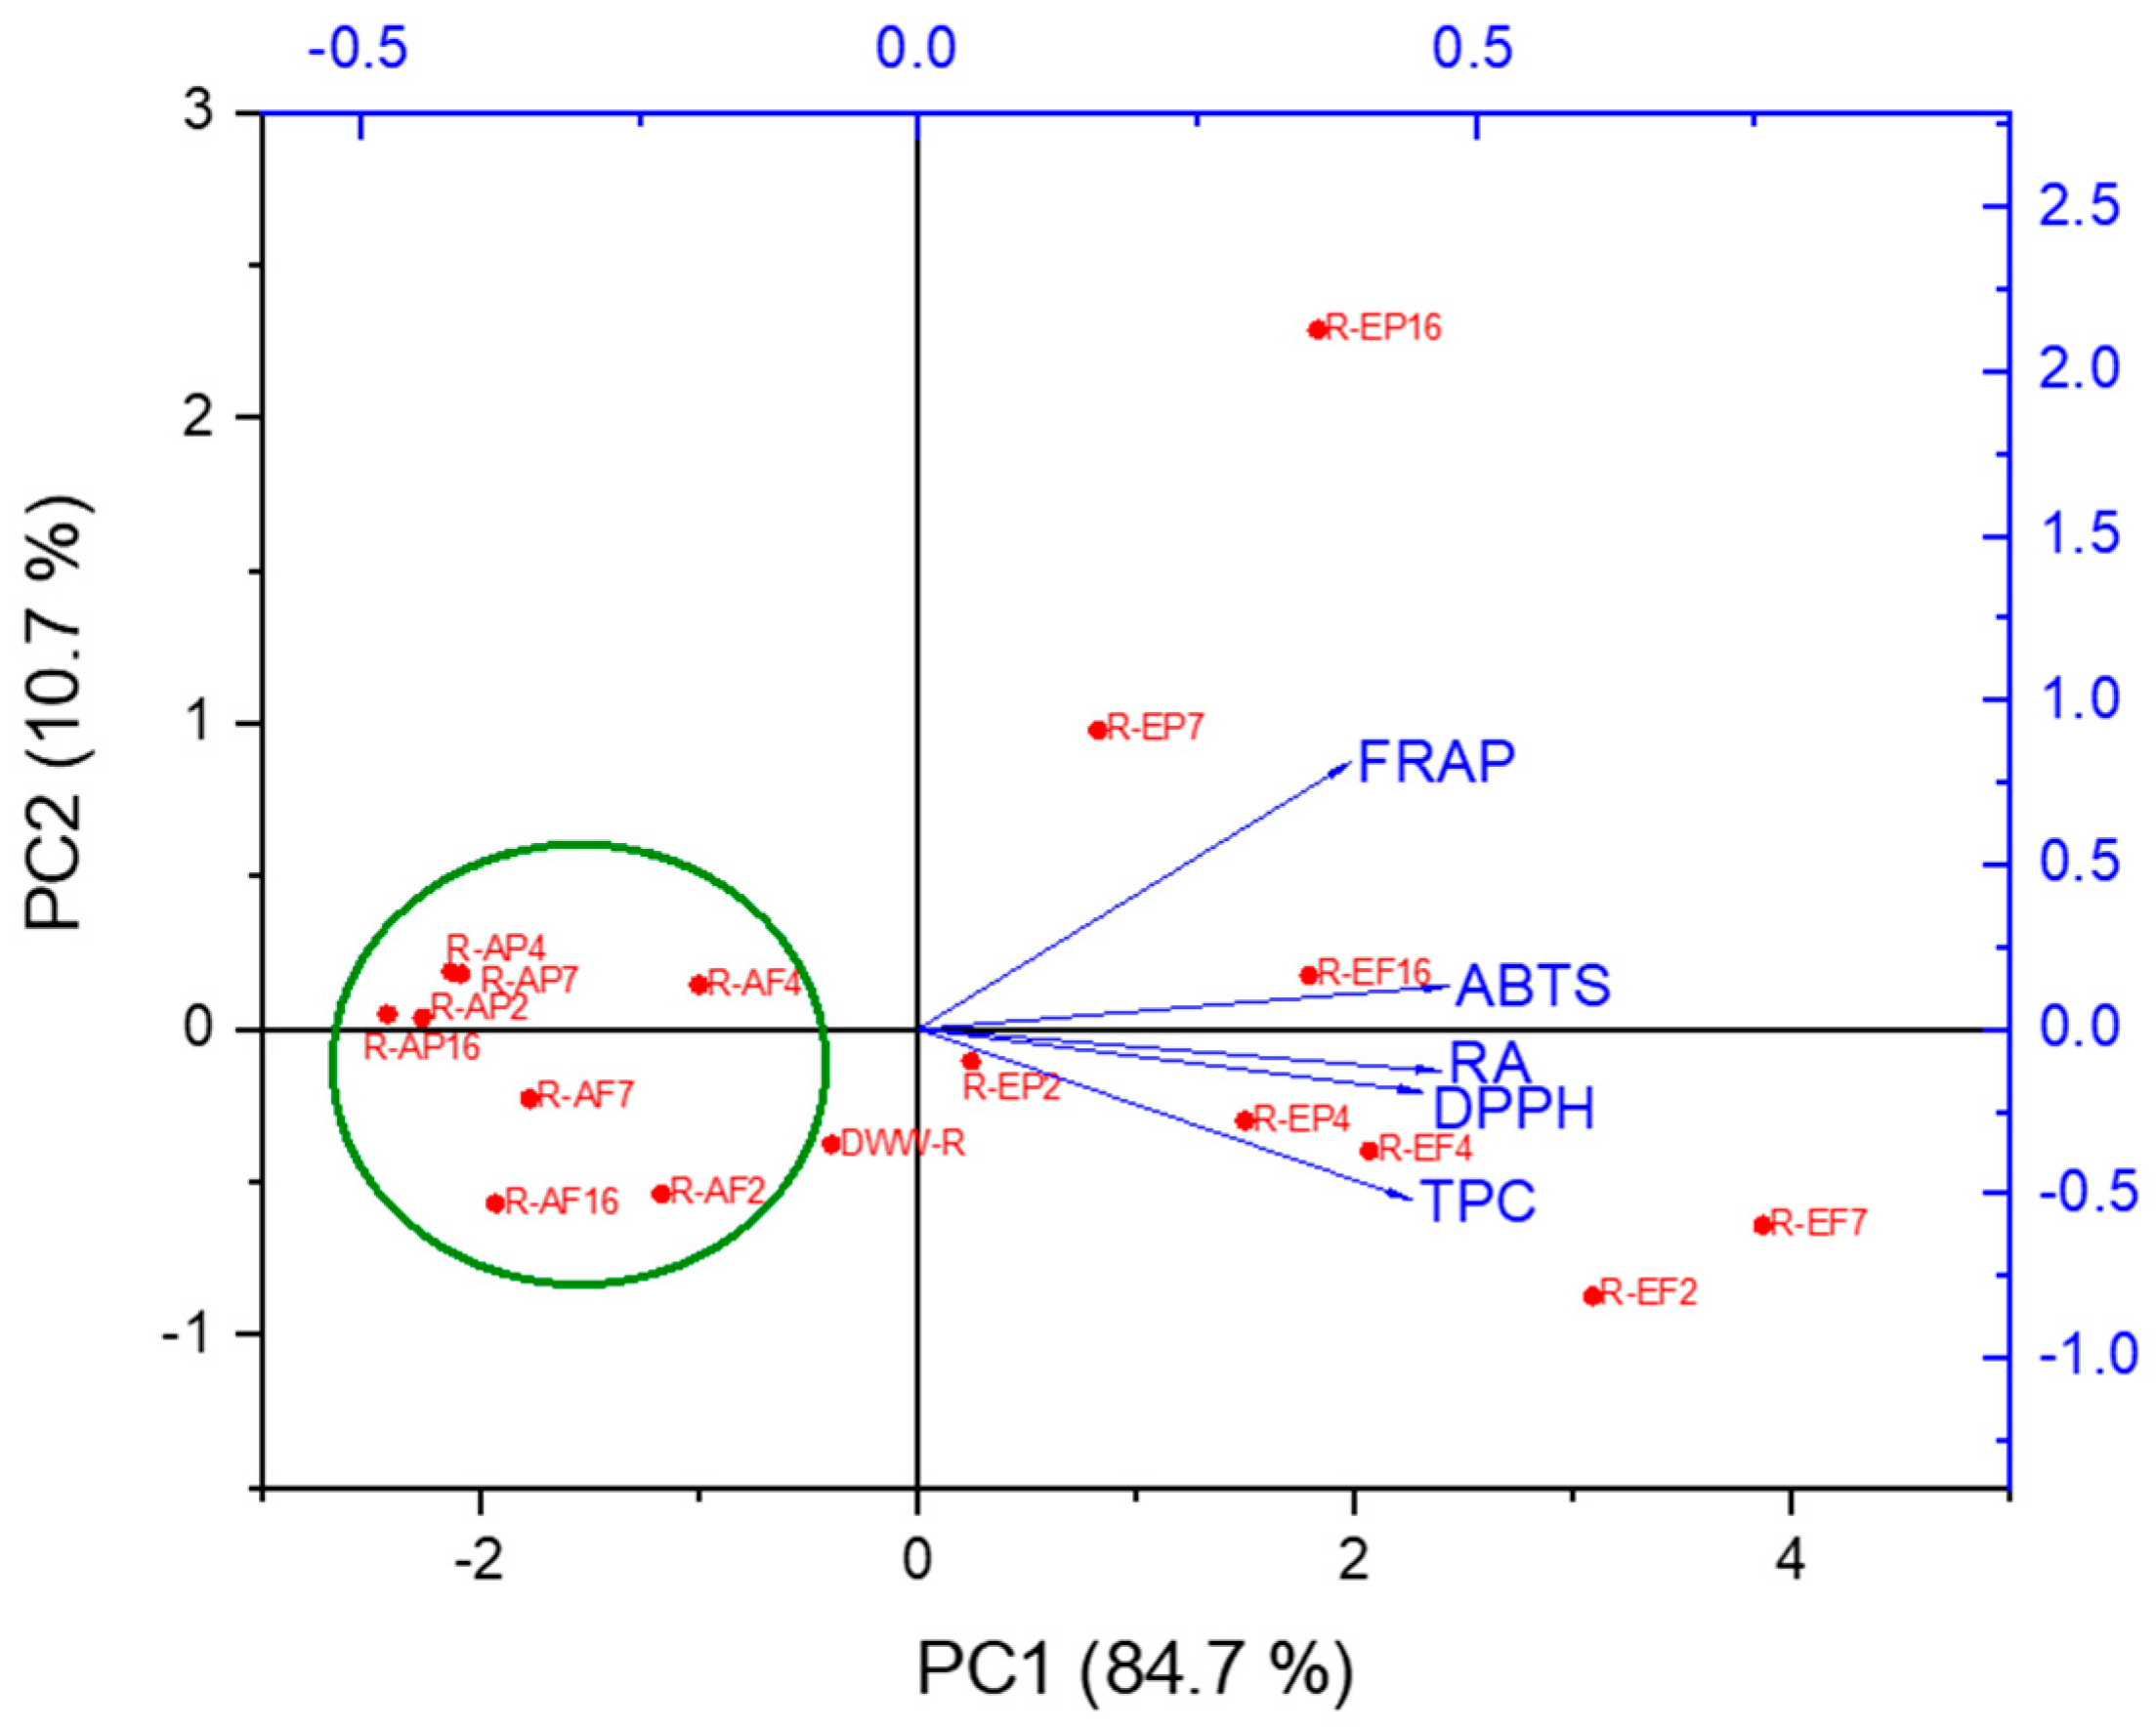
2.3. Principal Component Analysis (PCA)
2.4. Recovery of Polyphenols and RA from DWW-S, DWW-T, DWW-O and Antioxidant Activity
2.5. Evaluation of Inhibitory Activity Against α-Glucosidase and α-Amylase
2.6. HPLC-MS/MS Analysis of DWW and Enriched Fractions After Extraction

| tR (min) | m/z [M-H]− | Fragments m/z (Relative Intensity) | Identification | Reference | |
|---|---|---|---|---|---|
| 1 | 2.3 | 191 | 111 (100), 155 (10) 173 (30) | isocitric acid | [45] |
| 2 | 2.3 | 133 | 115 (100), 87 (5) | malic acid | [46] |
| 3 | 2.3 | 341 | 179 (100), 161 (20), 221 (20) | caffeoyl glucose | [47] |
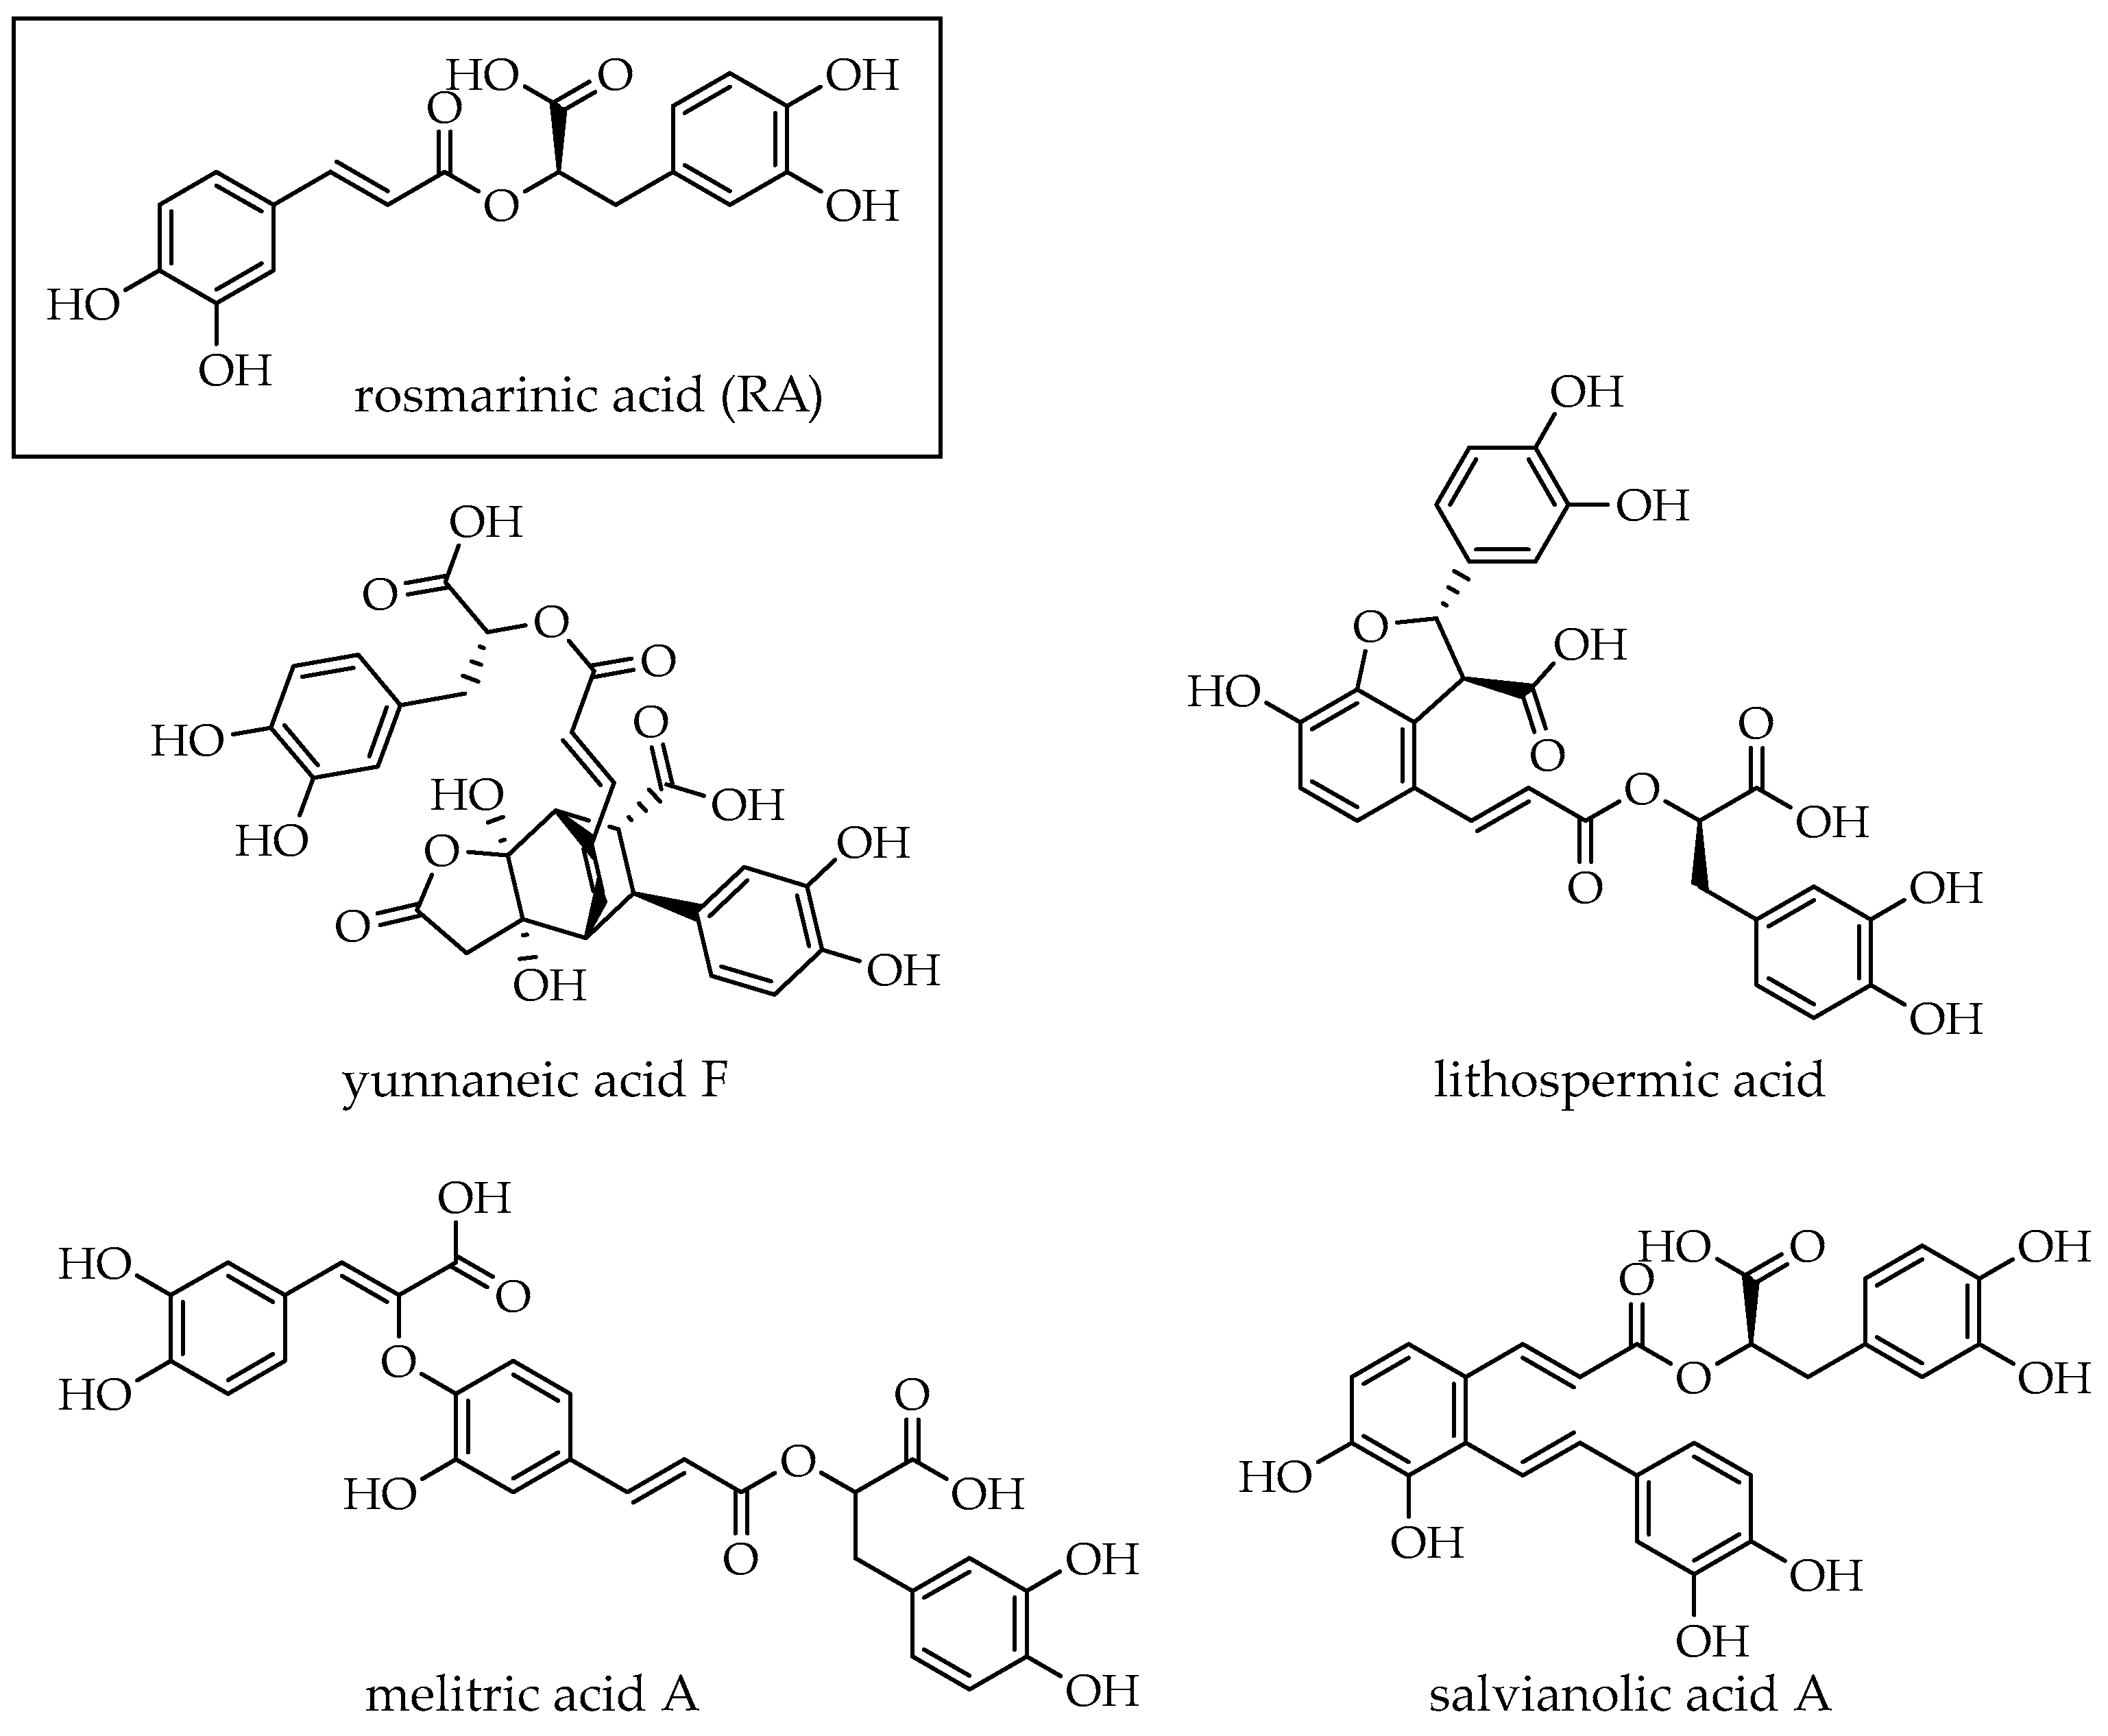
| 4 | 18.5 | 597 | 267 (20), 311.6 (100), 329 (40), 355 (20), 491 (20), 509 (20), 579 (20) | yunnaneic acid F | [47] |
| 5 | 18.7 | 463 | 301 (100) | quercetin-O-glucoside | [48] |
| 6 | 18.7 | 447 | 285 (100) | luteolin-O-glucoside | [48] |
| 7 | 18.8 | 421 | 153 (100) | 4-(3,4-dihydroxylbenzoyloxymethyl) phenyl-O-β-D-glucoside | [49] |
| 8 | 19 | 461 | 285 (100) | luteolin-O-glucuronide | [50] |
| 9 | 19.5 | 477 | 300 (10), 315 (100), 357 (5), 462 (5) | isoramnetin-3-O-glucoside | [50] |
| 10 | 21.8 | 717 | 555 (5), 519 (100), 475 (20) | salvianolic acid B/E | [48] |
| 11 | 23.5 | 359 | 161 (100), 179 (30), 197 (30), 135 (15) | rosmarinic acid | [50] |
| 12 | 23.8 | 719 | 539 (45), 359 (100), 341 (35) | sagerinic acid | [47] |
| 13 | 26.4 | 537 | 493 (100), 359 (10), 295 (5), 161(5) | lithospermic acid | [50] |
| 14 | 26.8 | 555 | 493 (100), 359 (40) | salvianolic acid K | [48] |
| 15 | 27.6 | 503 | 285 (100), 399 (20), 443 (5) | luteolin-3′-acetil-O-glucuronide | [48] |
| 16 | 30.2 | 493 | 295 (100), 313 (10), 383 (5) | salvianolic acid A | [51] |
| 17 | 50.1 | 329 | 285 (100) | carnosol | [52] |
| 18 | 52.6 | 331 | 287 (100) | carnosic acid | [52] |
| 19 | 53.8 | 345 | 301 (100) | 5,6,7,10-tetrahydro-7-hydroxy rosmariquinone | [50] |
3. Materials and Methods
3.1. Materials
3.2. Plant Material
3.3. Hydrodistillation
3.4. Solid-Phase Extraction (SPE)
- Procedure A. Recovery by static adsorption/desorption.
- Procedure B. Recovery by dynamic adsorption/desorption on column.
3.5. Total Polyphenol Content (TPC) Evaluation
3.6. Antioxidant Activity
3.7. Enzyme Inhibition Assays
3.8. HPLC-UV Analysis of Rosmarinic Acid
3.9. HPLC-MS Analysis
4. Conclusions
Supplementary Materials
Author Contributions
Funding
Institutional Review Board Statement
Informed Consent Statement
Data Availability Statement
Acknowledgments
Conflicts of Interest
References
- Fetting, C. The European Green Deal; ESDN Report; European Sustainable Development Network: Vienna, Austria, 2020; Volume 2, p. 53. [Google Scholar]
- Capanoglu, E.; Nemli, E.; Tomas-Barberan, F. Novel Approaches in the Valorization of Agricultural Wastes and Their Applications. J. Agric. Food Chem. 2022, 70, 6787–6804. [Google Scholar] [CrossRef] [PubMed]
- Cardullo, N.; Calcagno, D.; Pulvirenti, L.; Sciacca, C.; Pittalà, M.; Maccarronello, A.; Thevenard, F.; Muccilli, V. Flavonoids with lipase inhibitory activity from lemon squeezing waste: Isolation, multispectroscopic and in silico studies. J. Sci. Food Agric. 2024, 104, 7639–7648. [Google Scholar] [CrossRef]
- Maccarronello, A.E.; Cardullo, N.; Silva, A.M.; Di Francesco, A.; Costa, P.C.; Rodrigues, F.; Muccilli, V. From waste to bioactive compounds: A response surface methodology approach to extract antioxidants from Pistacia vera shells for postprandial hyperglycaemia management. Food Chem. 2024, 443, 138504. [Google Scholar] [CrossRef]
- Yadav, S.; Malik, K.; Moore, J.; Kamboj, B.; Malik, S.; Malik, V.; Arya, S.; Singh, K.; Mahanta, S.; Bishnoi, D. Valorisation of Agri-Food Waste for Bioactive Compounds: Recent Trends and Future Sustainable Challenges. Molecules 2024, 29, 2055. [Google Scholar] [CrossRef]
- Muccilli, V.; Maccarronello, A.E.; Rasoanandrasana, C.; Cardullo, N.; de Luna, M.S.; Pittalà, M.G.G.; Riccobene, P.M.; Carroccio, S.C.; Scamporrino, A.A. Green3: A green extraction of green additives for green plastics. Heliyon 2024, 10, e24469. [Google Scholar] [CrossRef] [PubMed]
- Wedamulla, N.; Fan, M.; Choi, Y.; Kim, E. Citrus peel as a renewable bioresource: Transforming waste to food additives. J. Funct. Foods 2022, 95, 105163. [Google Scholar] [CrossRef]
- Giosue, A.; Siano, F.; Di Stasio, L.; Picariello, G.; Medoro, C.; Cianciabella, M.; Giacco, R.; Predieri, S.; Vasca, E.; Vaccaro, O.; et al. Turning Wastes into Resources: Red Grape Pomace-Enriched Biscuits with Potential Health-Promoting Properties. Foods 2024, 13, 2195. [Google Scholar] [CrossRef]
- Balli, D.; Cecchi, L.; Innocenti, M.; Bellumori, M.; Mulinacci, N. Food by-products valorisation: Grape pomace and olive pomace (patè) as sources of phenolic compounds and fiber for enrichment of tagliatelle pasta. Food Chem. 2021, 355, 129642. [Google Scholar] [CrossRef]
- Galanakis, C.; Tsatalas, P.; Charalambous, Z.; Galanakis, I. Polyphenols recovered from olive mill wastewater as natural preservatives in extra virgin olive oils and refined olive kernel oils. Environ. Technol. Innov. 2018, 10, 62–70. [Google Scholar] [CrossRef]
- Pratap, B.; Kumar, S.; Nand, S.; Azad, I.; Bharagava, R.; Ferreira, L.; Dutta, V. Wastewater generation and treatment by various eco-friendly technologies: Possible health hazards and further reuse for environmental safety. Chemosphere 2023, 313, 137547. [Google Scholar] [CrossRef] [PubMed]
- Ochando-Pulido, J.; Vellido-Pérez, J.; González-Hernández, R.; Martínez-Férez, A. Optimization and modeling of two-phase olive-oil washing wastewater integral treatment and phenolic compounds recovery by novel weak-base ion exchange resins. Sep. Purif. Technol. 2020, 249, 117084. [Google Scholar] [CrossRef]
- Ochando-Pulido, J.; González-Hernández, R.; Martinez-Ferez, A. On the effect of the operating parameters for two-phase olive-oil washing wastewater combined phenolic compounds recovery and reclamation by novel ion exchange resins. Sep. Purif. Technol. 2018, 195, 50–59. [Google Scholar] [CrossRef]
- Costa, C.; Amorim, C.; Duque, A.; Reis, M.; Castro, P. Valorization of wastewater from food industry: Moving to a circular bioeconomy. Rev. Environ. Sci. Bio. 2022, 21, 269–295. [Google Scholar] [CrossRef]
- Truzzi, E.; Chaouch, M.; Rossi, G.; Tagliazucchi, L.; Bertelli, D.; Benvenuti, S. Characterization and Valorization of the Agricultural Waste Obtained from Lavandula Steam Distillation for Its Reuse in the Food and Pharmaceutical Fields. Molecules 2022, 27, 1613. [Google Scholar] [CrossRef] [PubMed]
- Fascella, G.; D’Angiolillo, F.; Ruberto, G.; Napoli, E. Agronomic performance, essential oils and hydrodistillation wastewaters of Lavandula angustifolia grown on biochar-based substrates. Ind. Crops Prod. 2020, 154, 112733. [Google Scholar] [CrossRef]
- Navarrete, A.; Herrero, M.; Martín, A.; Cocero, M.; Ibáñez, E. Valorization of solid wastes from essential oil industry. J. Food Eng. 2011, 104, 196–201. [Google Scholar] [CrossRef]
- Gavaric, N.; Kladar, N.; Misan, A.; Nikolic, A.; Samojlik, I.; Mimica-Dukic, N.; Bozin, B. Postdistillation waste material of thyme (Thymus vulgaris L., Lamiaceae) as a potential source of biologically active compounds. Ind. Crops Prod. 2015, 74, 457–464. [Google Scholar] [CrossRef]
- Napoli, E.; Ruberto, G.; Carrubba, A.; Sarno, M.; Muscarà, C.; Speciale, A.; Cristani, M.; Cimino, F.; Saija, A. Phenolic Profiles, Antioxidant and Anti-Inflammatory Activities of Hydrodistillation Wastewaters from Five Lamiaceae Species. Molecules 2022, 27, 217427. [Google Scholar] [CrossRef]
- Vladimir-Knezevic, S.; Blazekovic, B.; Kindl, M.; Vladic, J.; Lower-Nedza, A.; Brantner, A. Acetylcholinesterase Inhibitory, Antioxidant and Phytochemical Properties of Selected Medicinal Plants of the Lamiaceae Family. Molecules 2014, 19, 767–782. [Google Scholar] [CrossRef] [PubMed]
- Kim, G.; Park, Y.; Jin, Y.; Park, C. Production and applications of rosmarinic acid and structurally related compounds. Appl. Microbiol. Biotechnol. 2015, 99, 2083–2092. [Google Scholar] [CrossRef]
- Luo, C.; Zou, L.; Sun, H.; Peng, J.; Gao, C.; Bao, L.; Ji, R.; Jin, Y.; Sun, S. A Review of the Anti-Inflammatory Effects of Rosmarinic Acid on Inflammatory Diseases. Front. Pharmacol. 2020, 11, 153. [Google Scholar] [CrossRef] [PubMed]
- Ekin, H.; Deliorman Orhan, D.; Erdocan Orhan, I.; Orhan, N.; Aslan, M. Evaluation of enzyme inhibitory and antioxidant activity of some Lamiaceae plants. J. Pharm Res. 2019, 23, 749–758. [Google Scholar] [CrossRef]
- Pavlovic, M.; Lunic, T.; Graovac, S.; Mandic, M.; Repac, J.; Gasic, U.; Nedeljkovic, B.; Bozic, B. Extracts of selected Lamiaceae species as promising antidiabetics: Chemical profiling, in vitro and in silico approach combined with dynamical modeling. Ind. Crops Prod. 2022, 186, 115200. [Google Scholar] [CrossRef]
- dos Santos, F.; de Rezende, C.; Junior, V. Macroporous polymeric resins as a tool to obtain bioactive compounds in food and food-waste: A review. J. Food Compos. Anal. 2022, 114, 104703. [Google Scholar] [CrossRef]
- Huck, C.; Bonn, G. Recent developments in polymer-based sorbents for solid-phase extraction. J. Chromatogr. A 2000, 885, 51–72. [Google Scholar] [CrossRef]
- Soto, M.; Moure, A.; Domínguez, H.; Parajó, J. Recovery, concentration and purification of phenolic compounds by adsorption: A review. J. Food Eng. 2011, 105, 1–27. [Google Scholar] [CrossRef]
- Chen, Y.; Zhang, W.; Zhao, T.; Li, F.; Zhang, M.; Li, J.; Zou, Y.; Wang, W.; Cobbina, S.; Wu, X.; et al. Adsorption properties of macroporous adsorbent resins for separation of anthocyanins from mulberry. Food Chem. 2016, 194, 712–722. [Google Scholar] [CrossRef]
- Kovac, M.; Pavic, V.; Hud, A.; Cindric, I.; Molnar, M. Determination of Suitable Macroporous Resins and Desorbents for Carnosol and Carnosic Acid from Deep Eutectic Solvent Sage (Salvia officinalis) Extract with Assessment of Antiradical and Antibacterial Activity. Antioxidants 2021, 10, 556. [Google Scholar] [CrossRef]
- Pompeu, D.; Moura, F.; Silva, E.; Rogez, H. Equilibria, Kinetics, and Mechanisms for the Adsorption of Four Classes of Phenolic Compounds onto Synthetic Resins. Sep. Sci. Technol. 2010, 45, 700–709. [Google Scholar] [CrossRef]
- de Elguea-Culebras, G.; Bravo, E.; Sánchez-Vioque, R. Potential sources and methodologies for the recovery of phenolic compounds from distillation residues of Mediterranean aromatic plants. An approach to the valuation of by-products of the essential oil market-A review. Ind. Crops Prod. 2022, 175, 114261. [Google Scholar] [CrossRef]
- Ziani, I.; Bouakline, H.; Bouknana, S.; Bentouhami, N.; Sher, F.; Ansar, S.; Fauconnier, M.; Bnouham, M.; El Bachiri, A. Sustainable management of rosemary wastewater and essential oil in agri-environmental bioprocessing. Food Biosci. 2024, 62, 105263. [Google Scholar] [CrossRef]
- Dai, J.; Mumper, R. Plant Phenolics: Extraction, Analysis and Their Antioxidant and Anticancer Properties. Molecules 2010, 15, 7313–7352. [Google Scholar] [CrossRef]
- Irakli, M.; Skendi, A.; Bouloumpasi, E.; Christaki, S.; Biliaderis, C.; Chatzopoulou, P. Sustainable Recovery of Phenolic Compounds from Distilled Rosemary By-Product Using Green Extraction Methods: Optimization, Comparison, and Antioxidant Activity. Molecules 2023, 28, 6669. [Google Scholar] [CrossRef] [PubMed]
- Bouloumpasi, E.; Hatzikamari, M.; Christaki, S.; Lazaridou, A.; Chatzopoulou, P.; Biliaderis, C.; Irakli, M. Assessment of Antioxidant and Antibacterial Potential of Phenolic Extracts from Post-Distillation Solid Residues of Oregano, Rosemary, Sage, Lemon Balm, and Spearmint. Processes 2024, 12, 140. [Google Scholar] [CrossRef]
- Zhu, F.X.; Asada, T.; Sato, A.; Koi, Y.; Nishiwaki, H.; Tamura, H. Rosmarinic Acid Extract for Antioxidant, Antiallergic, and alpha-Glucosidase Inhibitory Activities, Isolated by Supramolecular Technique and Solvent Extraction from Perilla Leaves. J. Agric. Food Chem. 2014, 62, 885–892. [Google Scholar] [CrossRef]
- Lin, D.; Xiao, M.; Zhao, J.; Li, Z.; Xing, B.; Li, X.; Kong, M.; Li, L.; Zhang, Q.; Liu, Y.; et al. An Overview of Plant Phenolic Compounds and Their Importance in Human Nutrition and Management of Type 2 Diabetes. Molecules 2016, 21, 101374. [Google Scholar] [CrossRef]
- Deka, H.; Choudhury, A.; Dey, B. An Overview on Plant Derived Phenolic Compounds and Their Role in Treatment and Management of Diabetes. J. Pharmacopunct. 2022, 25, 199–208. [Google Scholar] [CrossRef] [PubMed]
- Cardullo, N.; Catinella, C.; Floresta, G.; Muccilli, V.; Rosselli, S.; Rescifina, A.; Bruno, M.; Tringali, C. Synthesis of Rosmarinic Acid Amides as Antioxidative and Hypoglycemic Agents. J. Nat. Prod. 2019, 82, 573–582. [Google Scholar] [CrossRef]
- Celano, R.; Piccinelli, A.; Pagano, I.; Roscigno, G.; Campone, L.; De Falco, E.; Russo, M.; Rastrelli, L. Oil distillation wastewaters from aromatic herbs as new natural source of antioxidant compounds. Food Res. Int. 2017, 99, 298–307. [Google Scholar] [CrossRef]
- Hauck, B.; Gallagher, J.A.; Morris, S.M.; Leemans, D.; Winters, A.L. Soluble Phenolic Compounds in Fresh and Ensiled Orchard Grass (Dactylis glomerata L.), a Common Species in Permanent Pastures with Potential as a Biomass Feedstock. J. Agric. Food Sci. 2014, 62, 468–475. [Google Scholar] [CrossRef]
- Taamalli, A.; Arráez-Román, D.; Abaza, L.; Iswaldi, I.; Fernández-Gutiérrez, A.; Zarrouk, M.; Segura-Carretero, A. LC-MS-based metabolite profiling of methanolic extracts from the medicinal and aromatic species Mentha pulegium and Origanum majorana. Phytochem Anal. 2015, 26, 320–330. [Google Scholar] [CrossRef] [PubMed]
- Taghouti, M.; Martins-Gomes, C.; Schäfer, J.; Santos, J.; Bunzel, M.; Nunes, F.; Silva, A. Chemical Characterization and Bioactivity of Extracts from Thymus mastichina: A Thymus with a Distinct Salvianolic Acid Composition. Antioxidants 2020, 9, 34. [Google Scholar] [CrossRef]
- Mena, P.; Cirlini, M.; Tassotti, M.; Herrlinger, K.; Dall’Asta, C.; Del Rio, D. Phytochemical Profiling of Flavonoids, Phenolic Acids, Terpenoids, and Volatile Fraction of a Rosemary (Rosmarinus officinalis L.) Extract. Molecules 2016, 21, 111576. [Google Scholar] [CrossRef] [PubMed]
- Masike, K.; Mhlongo, M.; Mudau, S.; Nobela, O.; Ncube, E.; Tugizimana, F.; George, M.; Madala, N. Highlighting mass spectrometric fragmentation differences and similarities between hydroxycinnamoyl-quinic acids and hydroxycinnamoyl-isocitric acids. Chem Cent. J. 2017, 11, 29. [Google Scholar] [CrossRef] [PubMed]
- Llorent-Martinez, E.J.; Gouveia, S.; Castilho, P.C. Analysis of phenolic compounds in leaves from endemic trees from Madeira Island. A contribution to the chemotaxonomy of Laurisilva forest species. Ind. Crops Prod. 2015, 64, 135–151. [Google Scholar] [CrossRef]
- Mekam, P.; Martini, S.; Nguefack, J.; Tagliazucchi, D.; Stefani, E. Phenolic compounds profile of water and ethanol extracts of Euphorbia hirta L. leaves showing antioxidant and antifungal properties. S. Afr. J. Bot. 2019, 127, 319–332. [Google Scholar] [CrossRef]
- Mona, M.M. Comparative study of Mentha species growing wild in Egypt: LC-ESI-MS analysis and chemosystematic significance. J. Appl. Pharm. Sci. 2018, 8, 116–122. [Google Scholar] [CrossRef]
- Taghouti, M.; Martins-Gomes, C.; Felix, L.M.; Schafer, J.; Santos, J.A.; Bunzel, M.; Nunes, F.M.; Silva, A.M. Polyphenol composition and biological activity of Thymus citriodorus and Thymus vulgaris: Comparison with endemic Iberian Thymus species. Food Chem. 2020, 331, 127362. [Google Scholar] [CrossRef]
- Stanojević, L.; Zvezdanović, J.; Danilović, B.; Cvetković, D.; Stanojević, J.; Ilić, D.; Cakić, M. The antioxidative and antimicrobial activity of the aqueous earth smoke (Fumaria officinalis L.) Extract. Adv. Technol. 2018, 7, 31–40. [Google Scholar] [CrossRef]
- Irakli, M.; Skendi, A.; Bouloumpasi, E.; Chatzopoulou, P.; Biliaderis, C.G. LC-MS Identification and Quantification of Phenolic Compounds in Solid Residues from the Essential Oil Industry. Antioxidants 2021, 10, 2016. [Google Scholar] [CrossRef]
- Martins, N.; Barros, L.; Santos-Buelga, C.; Henriques, M.; Silva, S.; Ferreira, I. Decoction, infusion and hydroalcoholic extract of Origanum vulgare L.: Different performances regarding bioactivity and phenolic compounds. Food Chem. 2014, 158, 73–80. [Google Scholar] [CrossRef]
- Hendel, N.; Sarri, D.; Sarri, M.; Napoli, E.; Piccionello, A.; Ruberto, G. Phytochemical Analysis and Antioxidant and Antifungal Activities of Powders, Methanol Extracts, and Essential Oils from Rosmarinus officinalis L. and Thymus ciliatus Desf. Benth. Int. J. Mol. Sci. 2024, 25, 147989. [Google Scholar] [CrossRef]
- Kaushik, A.; Basu, S.; Raturi, S.; Batra, V.; Balakrishnan, M. Recovery of antioxidants from sugarcane molasses distillery wastewater and its effect on biomethanation. J. Water Process Eng. 2018, 25, 205–211. [Google Scholar] [CrossRef]
- Buran, T.; Sandhu, A.; Li, Z.; Rock, C.; Yang, W.; Gu, L. Adsorption/desorption characteristics and separation of anthocyanins and polyphenols from blueberries using macroporous adsorbent resins. J. Food Eng. 2014, 128, 167–173. [Google Scholar] [CrossRef]
- Cardullo, N.; Muccilli, V.; Cunsolo, V.; Tringali, C. Mass Spectrometry and 1 H-NMR Study of Schinopsis lorentzii (Quebracho) Tannins as a Source of Hypoglycemic and Antioxidant Principles. Molecules 2020, 25, 143257. [Google Scholar] [CrossRef] [PubMed]
- Maccarronello, A.; Cardullo, N.; Silva, A.; Di Francesco, A.; Costa, P.; Rodrigues, F.; Muccilli, V. Unlocking the nutraceutical potential of Corylus avellana L. shells: Microwave-assisted extraction of phytochemicals with antiradical and anti-diabetic properties. J. Sci. Food Agric. 2024, 104, 9472–9485. [Google Scholar] [CrossRef]
- Sciacca, C.; Cardullo, N.; Pulvirenti, L.; Travagliante, G.; D’Urso, A.; D’Agata, R.; Peri, E.; Cancemi, P.; Cornu, A.; Deffieux, D.; et al. Synthesis of obovatol and related neolignan analogues as α-glucosidase and α-amylase inhibitors. Bioorg. Chem. 2024, 147, 107392. [Google Scholar] [CrossRef] [PubMed]

| Sample | Resin | Procedure A | Procedure B | Acronym |
|---|---|---|---|---|
| Rosemary (R) | DWW-R | |||
| XAD-2 | aqueous phase | R-AP2 | ||
| ethanol phase | R-EP2 | |||
| aqueous fraction | R-AF2 | |||
| ethanol fraction | R-EF2 | |||
| XAD-4 | aqueous phase | R-AP4 | ||
| ethanol phase | R-EP4 | |||
| aqueous fraction | R-AF4 | |||
| ethanol fraction | R-EF4 | |||
| XAD-7 | aqueous phase | R-AP7 | ||
| ethanol phase | R-EP7 | |||
| aqueous fraction | R-AF7 | |||
| ethanol fraction | R-EF7 | |||
| XAD-16 | aqueous phase | R-AP16 | ||
| ethanol phase | R-EP16 | |||
| aqueous fraction | R-AF16 | |||
| ethanol fraction | R-EF16 | |||
| Sage (S) | DWW-S | |||
| XAD-7 | aqueous fraction | S-AF7 | ||
| ethanol fraction | S-EF7 | |||
| Thyme (T) | DWW-T | |||
| XAD-7 | aqueous fraction | T-AF7 | ||
| ethanol fraction | T-EF7 | |||
| Oregano (O) | DWW-O | |||
| XAD-7 | aqueous fraction | O-AF7 | ||
| ethanol fraction | O-EF7 |
| Samples | TPC (mg GAE/g) | Antioxidant Activity (μmol TE/g ± DS) | % Yield | RA (mg/g) | ||
|---|---|---|---|---|---|---|
| DPPH | ABTS | FRAP | ||||
| DWW-R | 63.9 ± 1.4 c | 15.4 ± 0.2 h | 60.9 ± 1.7 f | 29.3 ± 1.7 f,g | - | 88.1 ± 1.2 g |
| Procedure A | ||||||
| R-AP2 | 7.9 ± 1.2 g | 5.9 ± 0.1 j,k | 29.7 ± 2.2 h,i | 9.4 ± 1.2 i | 40.0 | 6.1 ± 0.1 i,j |
| R-EP2 | 64.4 ± 9.5 c | 22.8 ± 0.1 g | 66.3 ± 7.3 f | 42.7 ± 1.5 e,f | 59.5 | 100.9 ± 2.4 f |
| R-AP4 | 12.2 ± 0.8 g | 7.4 ± 0.1 j | 26.6 ± 2.3 h,i | 18.3 ± 2.6 g,h,i | 43.0 | 7.1 ± 0.2 i,j |
| R-EP4 | 72.2 ± 8.8 c | 34.4 ± 1.9 e | 132.3 ± 0.1 e | 52.8 ± 15.3 d,e | 56.7 | 127.7 ± 0.1 d |
| R-AP7 | 13.6 ± 1.9 f,g | 6.1 ± 0.1 j,k | 27.2 ± 0.2 h.i | 18.3 ± 2.6 g,h,i | 55.6 | 2.5 ± 0.1 j,k |
| R-EP7 | 47.1 ± 2.3 d | 23.6 ± 1.5 g | 132.3 ± 2.1 e | 74.2 ± 5.6 b | 43.5 | 106.1 ± 0.4 e |
| R-AP16 | 5.7 ± 0.2 g | 4.4 ± 0.1 k | 17.9 ± 3.7 i,j | 8.9 ± 0.2 i | 55.7 | 5.7 ± 0.1 i,j |
| R-EP16 | 42.4 ± 6.2 d,e | 32.9 ± 0.2 e,f | 151.2 ± 8.3 d | 127.3 ± 1.3 a | 45.6 | 110.5 ± 0.6 e |
| Procedure B | ||||||
| R-AF2 | 46.1 ± 0.6 d | 23.9 ± 0.2 g | 35.2 ± 1.2 g,h | 14.7 ± 1.7 g,h,i | 46.3 | 18.0 ± 0.2 h |
| R-EF2 | 126.8 ± 9.4 a | 51.4 ± 0.1 b | 187.7 ± 7.2 b | 54.5 ± 1.9 d,e | 33.4 | 178.0 ± 1.3 b |
| R-AF4 | 15.6 ± 0.7 f,g | 31.2 ± 0.2 f | 65.8 ± 0.2 f | 26.6 ± 2.8 f,g,h | 74.5 | 8.3 ± 0.4 i |
| R-EF4 | 94.9 ± 3.4 b | 42.7 ± 1.0 d | 130.8 ± 4.1 e | 57.2 ± 11.8 c,d,e | 26.6 | 169.2 ± 1.9 c |
| R-AF7 | 28.2 ± 2.2 e,f | 12.3 ± 0.1 i | 45.4 ± 0.4 g | 10.5 ± 1.6 h,i | 55.8 | 0.4 ± 0.1 k |
| R-EF7 | 134.5 ± 9.1 a | 55.0 ± 1.2 a | 204.1 ± 8.9 a | 71.2 ± 9.0 b,c | 39.0 | 219.0 ± 1.4 a |
| R-AF16 | 31.6 ± 1.1 d,e | 17.2 ± 0.7 h | 9.1 ± 0.1 j | 3.9 ± 0.9 i | 42.7 | 3.4 ± 0.1 j,k |
| R-EF16 | 71.3 ± 7.6 c | 47.2 ± 0.2 c | 164.9 ± 5.8 c | 62.4 ± 2.6 b,c,d | 34.5 | 99.0 ± 0.7 f |
| DPPH | ABTS | FRAP | TPC | |
|---|---|---|---|---|
| DPPH | - | 0.8481 a | 0.5892 b | 0.8597 a |
| ABTS | 0.8481 a | - | 0.8145 a | 0.7507 a |
| FRAP | 0.5892 b | 0.8145 a | - | 0.5435 b |
| TPC | 0.8597 a | 0.7507 a | 0.5351 b | - |
| Sample | TPC (330 nm) mg/g | Antioxidant Activity (μmol TE/g ± DS) | Yield (%) | RA (mg(g) | ||
|---|---|---|---|---|---|---|
| DPPH | ABTS | FRAP | ||||
| Rosemary | ||||||
| DWW-R | 152.5 ± 39.3 g | 15.4 ± 0.2 f,g | 60.9 ± 1.7 e,f | 29.3 ± 1.7 f | 88.1 ± 1.2 g | |
| R-AF7 | 3.3 ± 0.3 i | 12.3 ± 0.1 g | 45.4 ± 0.4 f,g | 10.5 ± 1.6 g | 55.8 | 0.4 ± 0.1 h |
| R-EF7 | 399.2 ± 15.8 d | 35.5 ± 1.2 d | 204.1 ± 8.9 c,d | 71.1 ± 9.0 d | 39.0 | 219.0 ± 1.4 d |
| Sage | ||||||
| DWW-S | 345.2 ± 8.1 e | 37.9 ± 0.7 c,d | 93.6 ± 1.9 e | 111.4 ± 10.5 c | 114.2 ± 0.4 c | |
| S-AF7 | 3.6 ± 0.1 i | 18.8 ± 0.2 f | 13.1 ± 3.6 g | 41.5 ± 1.7 e,f | 55.7 | 0.4 ± 0.1 h |
| S-EF7 | 768.3 ± 12.5 b | 88.4 ± 1.6 a,b | 269.4 ± 12.4 b | 188.9 ± 14.8 a | 31.1 | 299.6 ± 0.3 a |
| Thyme | ||||||
| DWW-T | 394.4 ± 4.7 d | 39.6 ± 0.8 c,d | 73.8 ± 2.8 e.f | 114.6 ± 6.5 c | 113.3 ± 0.3 e | |
| T-AF7 | 35.1 ± 0.3 h,i | 19.6 ± 0.6 f | 14.3 ± 0.2 g | 49.6 ± 2.5 e | 50.7 | 8.8 ± 0.2 h |
| T-EF7 | 868.8 ± 19.7 a | 92.5 ± 1.0 a | 310.1 ± 7.3 a | 180.9 ± 6.1 b | 34.1 | 232.6 ± 5.0 c |
| Oregano | ||||||
| DWW-O | 260.8 ± 3.6 f | 40.7 ± 0.2 c | 172.7 ± 8.9 d | 117.7 ± 4.8 c | 104.5 ± 0.2 f | |
| O-AF7 | 46.4 ± 0.3 h | 27.7 ± 1.1 e | 54.8 ± 7.2 f | 86.7 ± 9.6 d | 24.1 | 8.9 ± 0.6 h |
| O-EF7 | 556.9 ± 4.7 c | 86.8 ± 3.6 b | 226.4 ± 27.1 c | 166.8 ± 4.4 b | 64.2 | 259.0 ± 0.7 b |
| Sample | α-Glucosidase | α-Amylase |
|---|---|---|
| DWW-R | 643.2 ± 15.0 a | 73.9 ± 3.6 a |
| R-AF7 | 460.4 ± 29.2 b | 66.5 ± 1.3 b |
| R-EF7 | 96.7 ± 2.4 g | 18.2 ± 0.3 f |
| DWW-S | 272.3 ± 35.9 d | 35.7 ± 2.1 e |
| S-AF7 | 663.7 ± 23.2 a | 43.8 ± 2.6 d |
| S-EF7 | 76.7 ± 4.3 g | 12.1 ± 1.4 f |
| DWW-T | 196.1 ± 13.4 e,f | 39.7 ± 2.5 d,e |
| T-AF7 | 216.7 ± 17.6 d,e,f | 34.9 ± 0.8 e |
| T-EF7 | 83.4 ± 5.6 g | 18.3 ± 2.1 f |
| DWW-O | 250.3 ± 30.2 d,e | 50.8 ± 2.2 c |
| O-AF7 | 391.7 ± 13.4 c | 43.5 ± 3.7 d |
| O-EF7 | 80.6 ± 2.2 g | 17.3 ± 0.9 f |
| Acarbose | 161.4 ± 8.2 f | 17.9 ± 0.6 f |
Disclaimer/Publisher’s Note: The statements, opinions and data contained in all publications are solely those of the individual author(s) and contributor(s) and not of MDPI and/or the editor(s). MDPI and/or the editor(s) disclaim responsibility for any injury to people or property resulting from any ideas, methods, instructions or products referred to in the content. |
© 2025 by the authors. Licensee MDPI, Basel, Switzerland. This article is an open access article distributed under the terms and conditions of the Creative Commons Attribution (CC BY) license (https://creativecommons.org/licenses/by/4.0/).
Share and Cite
Sciacca, C.; Cardullo, N.; Savitteri, M.; Pittalà, M.G.G.; Pulvirenti, L.; Napoli, E.M.; Muccilli, V. Recovery of Natural Hypoglycemic Compounds from Industrial Distillation Wastewater of Lamiaceae. Molecules 2025, 30, 1391. https://doi.org/10.3390/molecules30061391
Sciacca C, Cardullo N, Savitteri M, Pittalà MGG, Pulvirenti L, Napoli EM, Muccilli V. Recovery of Natural Hypoglycemic Compounds from Industrial Distillation Wastewater of Lamiaceae. Molecules. 2025; 30(6):1391. https://doi.org/10.3390/molecules30061391
Chicago/Turabian StyleSciacca, Claudia, Nunzio Cardullo, Martina Savitteri, Maria Gaetana Giovanna Pittalà, Luana Pulvirenti, Edoardo Marco Napoli, and Vera Muccilli. 2025. "Recovery of Natural Hypoglycemic Compounds from Industrial Distillation Wastewater of Lamiaceae" Molecules 30, no. 6: 1391. https://doi.org/10.3390/molecules30061391
APA StyleSciacca, C., Cardullo, N., Savitteri, M., Pittalà, M. G. G., Pulvirenti, L., Napoli, E. M., & Muccilli, V. (2025). Recovery of Natural Hypoglycemic Compounds from Industrial Distillation Wastewater of Lamiaceae. Molecules, 30(6), 1391. https://doi.org/10.3390/molecules30061391