

Direct 3D Mass Spectrometry Imaging Analysis of Environmental Microorganisms

 , , , ,
Abstract
1. Introduction
2. Results and Discussion
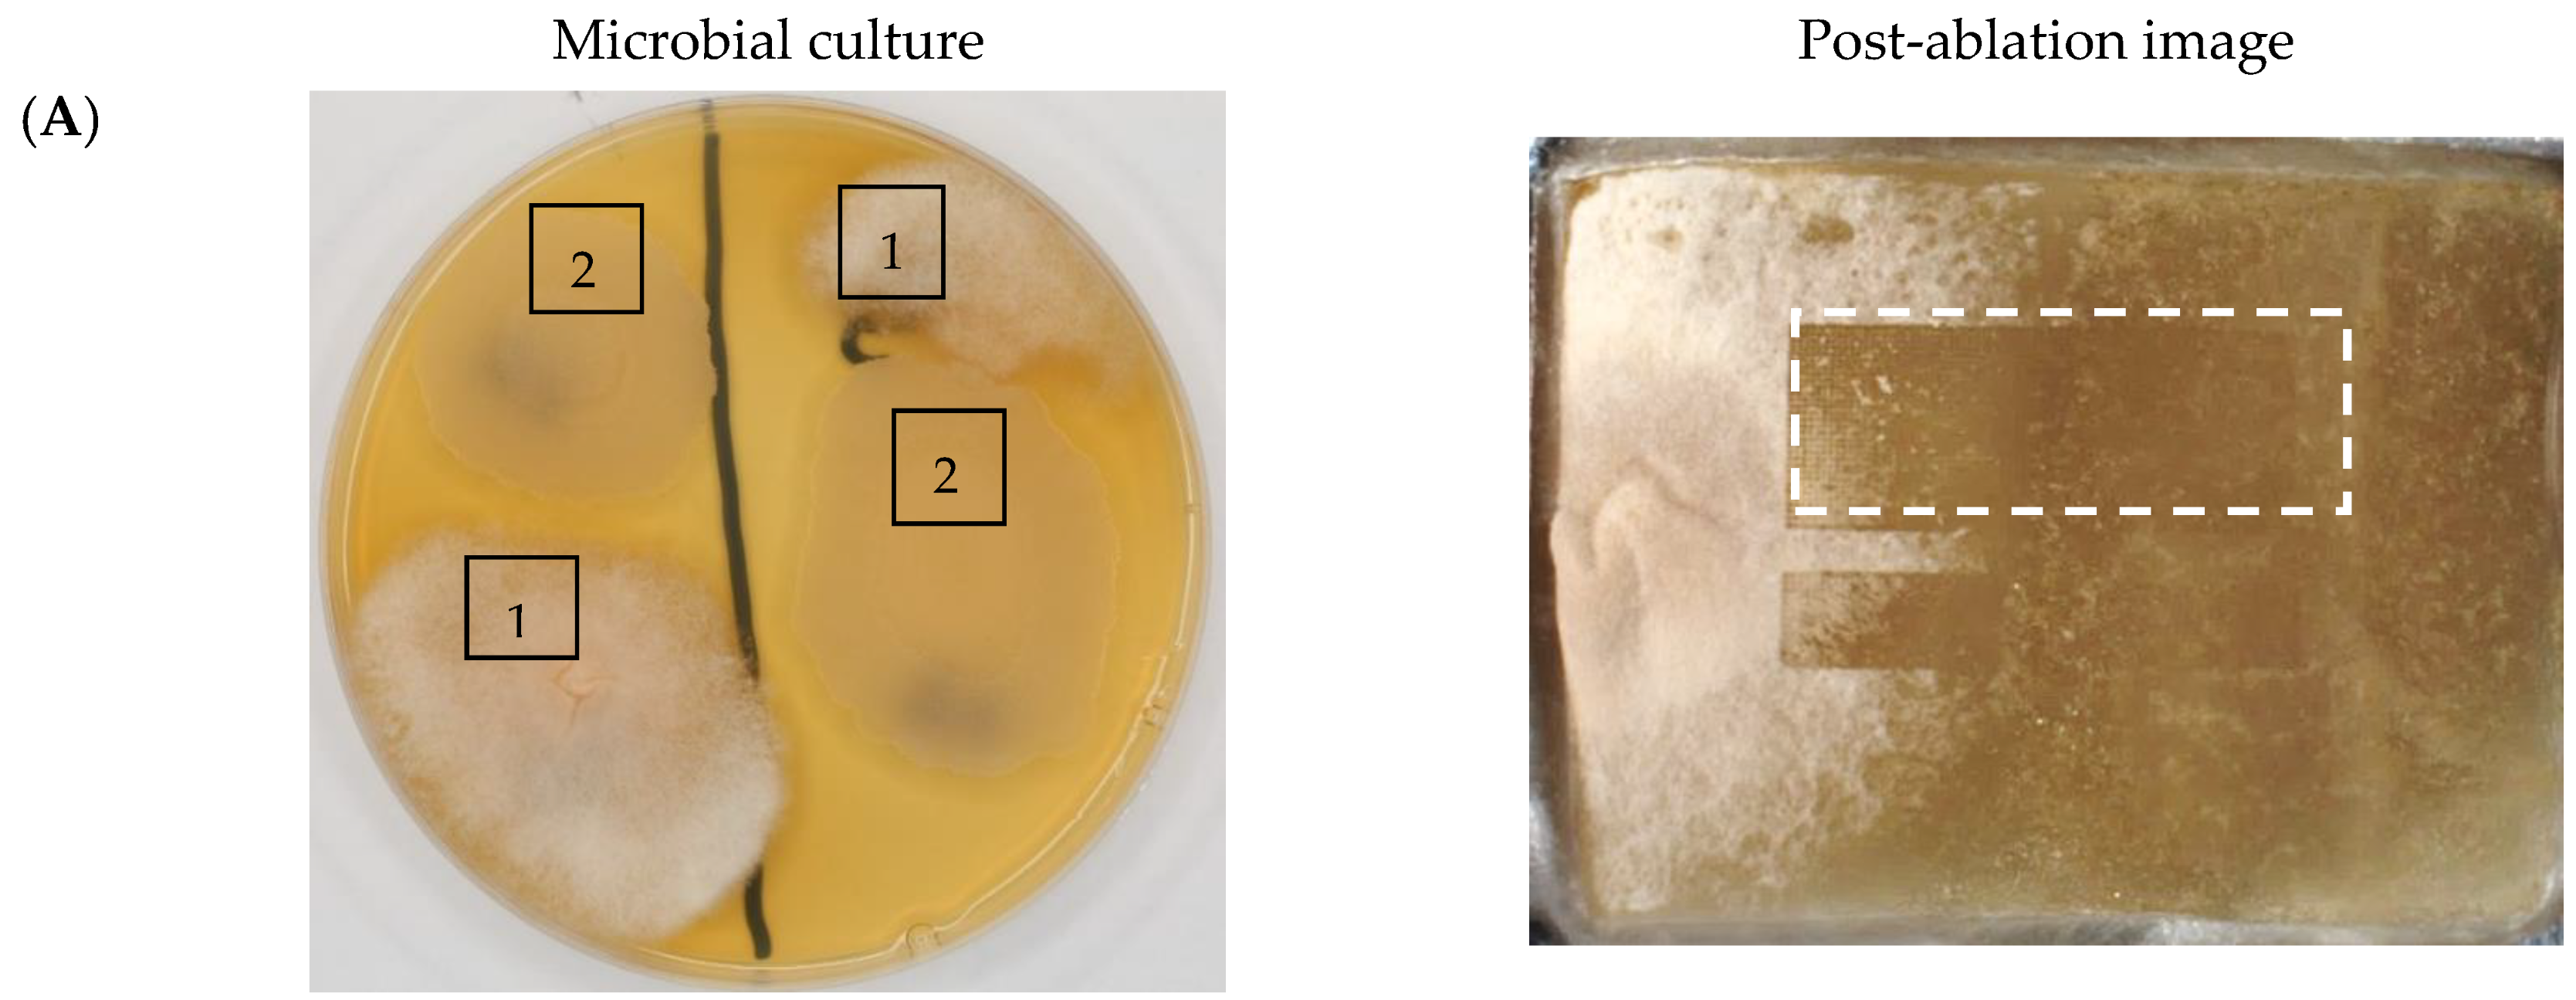
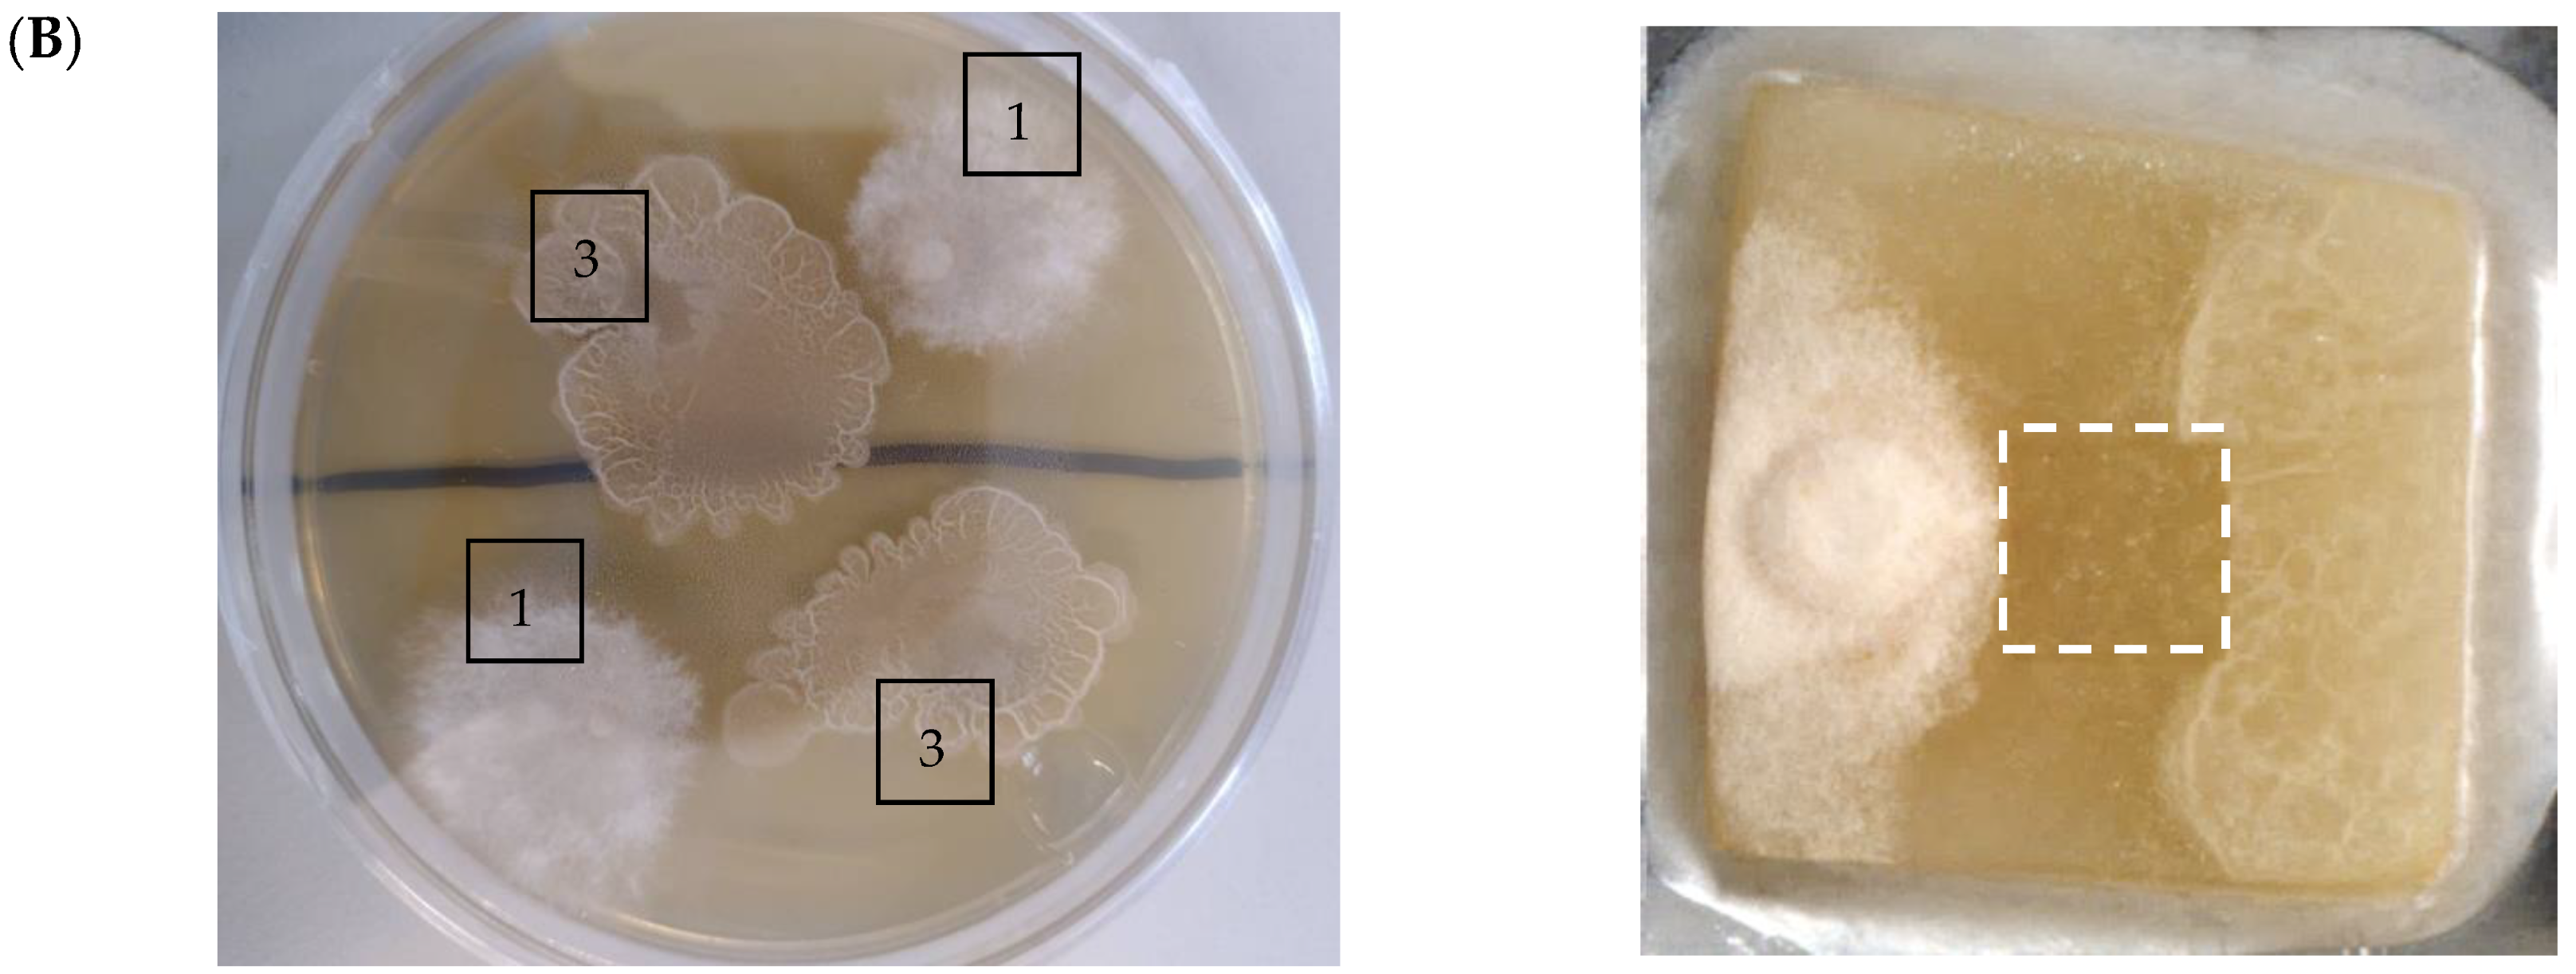
2.1. 2D Mass Spectrometry Imaging of Microbial Cultures
2.2. 3D Mass Spectrometry Imaging of Microbial Cultures
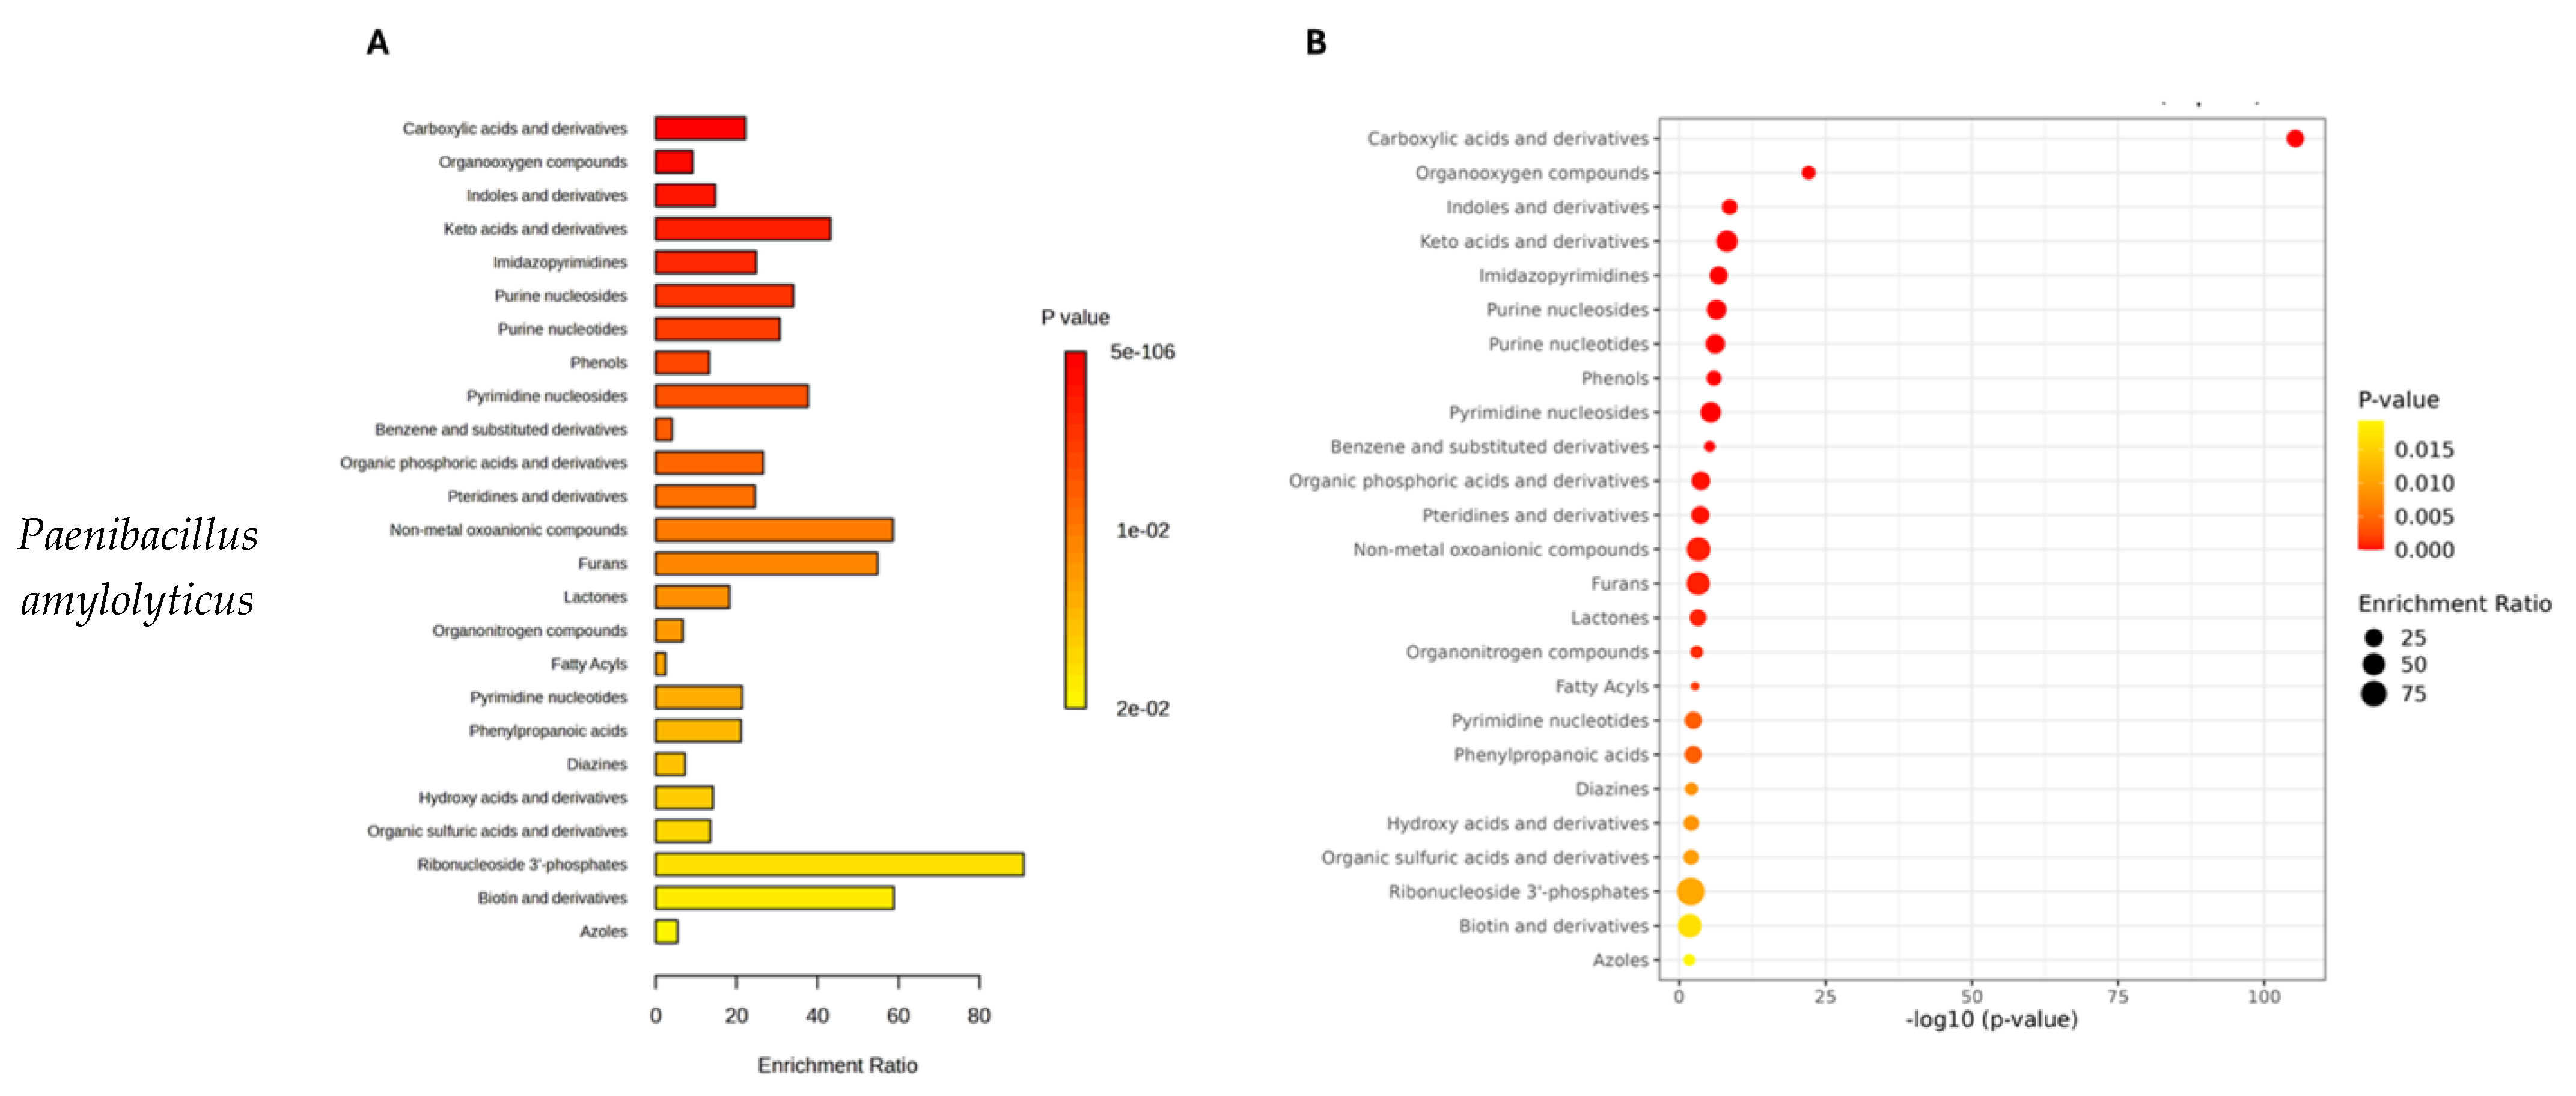
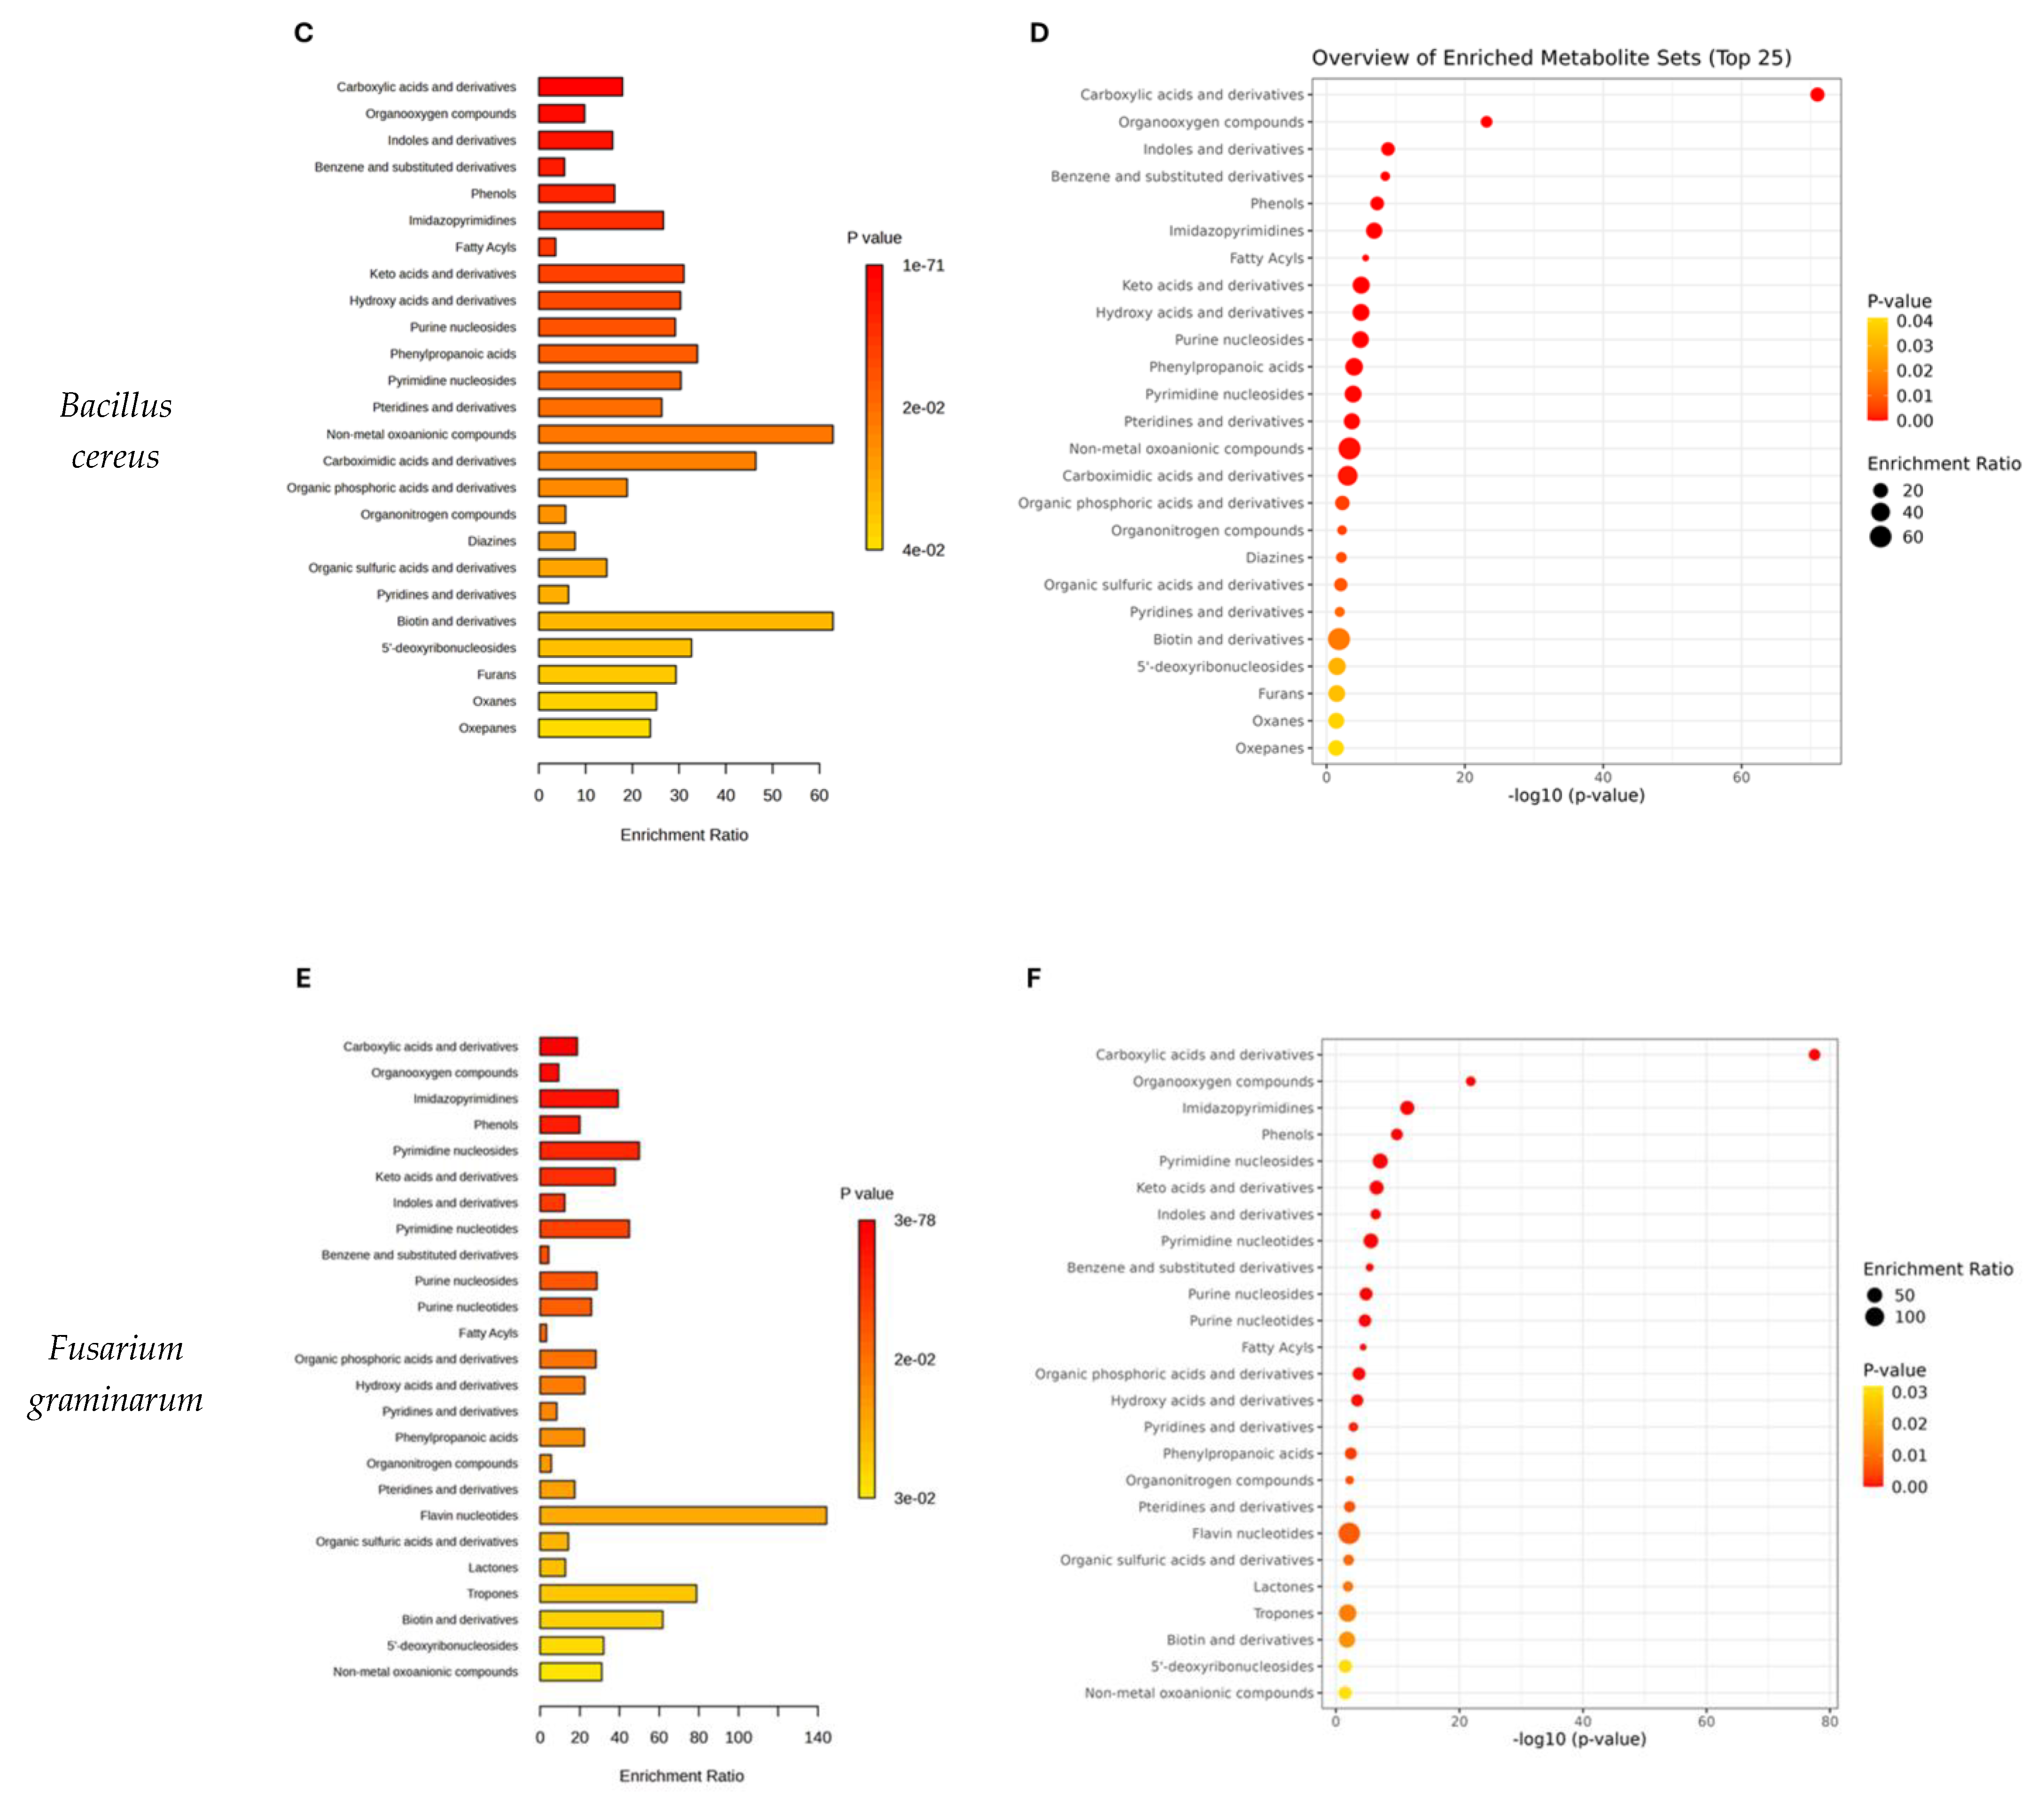
2.3. Pathway Analysis
3. Materials and Methods
3.1. Microorganisms
3.2. Microbial Cultures
3.3. Mass Spectrometry Imaging (MSI) Experiments
3.3.1. LARAPPI/CI MSI System
3.3.2. Direct Three-Dimensional Mass Spectrometry Imaging (MSI 3D)
3.3.3. Two-Dimensional Mass Spectrometry Imaging (MSI 2D)
3.4. Ultra-High-Performance Liquid Chromatography–Ultra-High-Resolution Mass Spectrometry (UHPLC–UHRMS)
3.4.1. LC–MS Sample Preparation
3.4.2. LC–MS Metabolomic Analysis
3.4.3. Statistical Analysis
4. Conclusions
Supplementary Materials
Author Contributions
Funding
Institutional Review Board Statement
Informed Consent Statement
Data Availability Statement
Acknowledgments
Conflicts of Interest
Abbreviations
| UHPLC | Ultra-high-performance liquid chromatography |
| UHRMS | Ultra-high-resolution mass spectrometry |
| LARAPPI/CI | Laser ablation remote atmospheric pressure photoionization/chemical ionization |
| MSI | Mass spectrometry imaging |
| APCI | Atmospheric pressure chemical ionization |
| ESI | Electrospray ionization |
References
- Fouillaud, M.; Dufossé, L. Microbial Secondary Metabolism and Biotechnology. Microorganisms 2022, 10, 123. [Google Scholar] [CrossRef]
- Bano, A.; Qadri, T.A.; Mahnoor; Khan, N. Bioactive Metabolites of Plants and Microbes and Their Role in Agricultural Sustainability and Mitigation of Plant Stress. S. Afr. J. Bot. 2023, 159, 98–109. [Google Scholar] [CrossRef]
- Demain, A.L. Reviews: The Business of Biotechnology. Ind. Biotechnol. 2007, 3, 269–283. [Google Scholar] [CrossRef]
- Singh, R.; Kumar, M.; Mittal, A.; Mehta, P.K. Microbial Metabolites in Nutrition, Healthcare and Agriculture. 3 Biotech 2017, 7, 15. [Google Scholar] [CrossRef]
- Rusu, A.V.; Trif, M.; Rocha, J.M. Microbial Secondary Metabolites via Fermentation Approaches for Dietary Supplementation Formulations. Molecules 2023, 28, 6020. [Google Scholar] [CrossRef]
- Shimizu, S. Vitamins and Related Compounds: Microbial Production. In Biotechnology Set; Rehm, H.-J., Reed, G., Eds.; Wiley: Hoboken, NJ, USA, 2001; pp. 318–340. ISBN 978-3-527-25762-1. [Google Scholar]
- Gurung, N.; Ray, S.; Bose, S.; Rai, V. A Broader View: Microbial Enzymes and Their Relevance in Industries, Medicine, and Beyond. BioMed Res. Int. 2013, 2013, 329121. [Google Scholar] [CrossRef] [PubMed]
- Zafar, A.; Mahmood, Z.A. Microbial Amino Acids Production. In Microbial Biotechnology—Progress and Trends; CRC Press: Boca Raton, FL, USA, 2015. [Google Scholar]
- Sun, X.; Shen, X.; Jain, R.; Lin, Y.; Wang, J.; Sun, J.; Wang, J.; Yan, Y.; Yuan, Q. Synthesis of Chemicals by Metabolic Engineering of Microbes. Chem. Soc. Rev. 2015, 44, 3760–3785. [Google Scholar] [CrossRef] [PubMed]
- Ruiz, B.; Chávez, A.; Forero, A.; García-Huante, Y.; Romero, A.; Sánchez, M.; Rocha, D.; Sánchez, B.; Rodríguez-Sanoja, R.; Sánchez, S.; et al. Production of Microbial Secondary Metabolites: Regulation by the Carbon Source. Crit. Rev. Microbiol. 2010, 36, 146–167. [Google Scholar] [CrossRef]
- Bentley, R. Microbial Secondary Metabolites Play Important Roles in Medicine; Prospects for Discovery of New Drugs. Perspect. Biol. Med. 1997, 40, 364–394. [Google Scholar] [CrossRef]
- Demain, A.L.; Sanchez, S. Microbial Drug Discovery: 80 Years of Progress. J. Antibiot. 2009, 62, 5–16. [Google Scholar] [CrossRef]
- Silva Dias, B.H.; Jung, S.-H.; Castro Oliveira, J.V.D.; Ryu, C.-M. C4 Bacterial Volatiles Improve Plant Health. Pathogens 2021, 10, 682. [Google Scholar] [CrossRef] [PubMed]
- Lee, D.A.; Lee, T.C.; Cortes, A.E.; Kitada, S. Effects of Mithramycin, Mitomycin, Daunorubicin, and Bleomycin on Human Subconjunctival Fibroblast Attachment and Proliferation. Invest. Ophthalmol. Vis. Sci. 1990, 31, 2136–2144. [Google Scholar]
- Deshmukh, S.K.; Prakash, V.; Ranjan, N. Marine Fungi: A Source of Potential Anticancer Compounds. Front. Microbiol. 2018, 8, 2536. [Google Scholar] [CrossRef] [PubMed]
- Tinôco, D.; Seldin, L.; Coutinho, P.L.D.A.; Freire, D.M.G. Strategies to Reduce the Culture Medium Costs for a High-yield and High-selectivity Bio-based 2,3-butanediol Production. Biofuels Bioprod. Biorefining 2025, 19, 85–108. [Google Scholar] [CrossRef]
- Tamano, K. Enhancing Microbial Metabolite and Enzyme Production: Current Strategies and Challenges. Front. Microbiol. 2014, 5, 718. [Google Scholar] [CrossRef]
- Szulc, J.; Otlewska, A.; Ruman, T.; Kubiak, K.; Karbowska-Berent, J.; Kozielec, T.; Gutarowska, B. Analysis of Paper Foxing by Newly Available Omics Techniques. Int. Biodeterior. Biodegrad. 2018, 132, 157–165. [Google Scholar] [CrossRef]
- Szulc, J.; Karbowska-Berent, J.; Drążkowska, A.; Ruman, T.; Beech, I.; Sunner, J.A.; Gutarowska, B. Metabolomics and Metagenomics Analysis of 18th Century Archaeological Silk. Int. Biodeterior. Biodegrad. 2021, 156, 105120. [Google Scholar] [CrossRef]
- Welker, M.; Moore, E.R.B. Applications of Whole-Cell Matrix-Assisted Laser-Desorption/Ionization Time-of-Flight Mass Spectrometry in Systematic Microbiology. Syst. Appl. Microbiol. 2011, 34, 2–11. [Google Scholar] [CrossRef]
- Carbonnelle, E.; Mesquita, C.; Bille, E.; Day, N.; Dauphin, B.; Beretti, J.-L.; Ferroni, A.; Gutmann, L.; Nassif, X. MALDI-TOF Mass Spectrometry Tools for Bacterial Identification in Clinical Microbiology Laboratory. Clin. Biochem. 2011, 44, 104–109. [Google Scholar] [CrossRef]
- Gautier, M.; Ranque, S.; Normand, A.-C.; Becker, P.; Packeu, A.; Cassagne, C.; L’Ollivier, C.; Hendrickx, M.; Piarroux, R. Matrix-Assisted Laser Desorption Ionization Time-of-Flight Mass Spectrometry: Revolutionizing Clinical Laboratory Diagnosis of Mould Infections. Clin. Microbiol. Infect. 2014, 20, 1366–1371. [Google Scholar] [CrossRef]
- Szulc, J.; Ruman, T. Laser Ablation Remote-Electrospray Ionisation Mass Spectrometry (LARESI MSI) Imaging—New Method for Detection and Spatial Localization of Metabolites and Mycotoxins Produced by Moulds. Toxins 2020, 12, 720. [Google Scholar] [CrossRef]
- Szulc, J.; Jablonskaja, I.; Jabłońska, E.; Ruman, T.; Karbowska-Berent, J.; Gutarowska, B. Metabolomics and Metagenomics Characteristic of Historic Beeswax Seals. Int. Biodeterior. Biodegrad. 2020, 152, 105012. [Google Scholar] [CrossRef]
- Ruman, T.; Krupa, Z.; Nizioł, J. Direct Three-Dimensional Mass Spectrometry Imaging with Laser Ablation Remote Atmospheric Pressure Photoionization/Chemical Ionization. Anal. Chem. 2024, 96, 13326–13334. [Google Scholar] [CrossRef]
- Shen, Y.; Wang, Y.; Wang, J.; Xie, P.; Xie, C.; Chen, Y.; Banaei, N.; Ren, K.; Cai, Z. High-Resolution 3D Spatial Distribution of Complex Microbial Colonies Revealed by Mass Spectrometry Imaging. J. Adv. Res. 2024, in press. [Google Scholar] [CrossRef]
- Krupa, S.; Ruman, T.; Szuberla, W.; Nizioł, J. Analysis of the Spatial Distribution of Metabolites in Aloe Vera Leaves by Mass Spectrometry Imaging and UHPLC-UHRMS. Sci. Rep. 2025, 15, 3502. [Google Scholar] [CrossRef] [PubMed]
- Wischmeyer, P.E. Clinical Applications of l-Glutamine: Past, Present, and Future. Nutr. Clin. Pr. 2003, 18, 377–385. [Google Scholar] [CrossRef]
- Piattoly, T.; Parish, T.R.; Welsch, M.A. L-Glutamine Supplementation: Effects on Endurance, Power and Recovery. Curr. Top. Nutraceutical Res. 2013, 11, 55–62. [Google Scholar]
- Grady, E.N.; MacDonald, J.; Liu, L.; Richman, A.; Yuan, Z.-C. Current Knowledge and Perspectives of Paenibacillus: A Review. Microb. Cell Factories 2016, 15, 203. [Google Scholar] [CrossRef]
- Xing, S.-C.; Mi, J.-D.; Chen, J.-Y.; Hu, J.-X.; Liao, X.-D. Metabolic Activity of Bacillus Coagulans R11 and the Health Benefits of and Potential Pathogen Inhibition by This Species in the Intestines of Laying Hens under Lead Exposure. Sci. Total Environ. 2020, 709, 134507. [Google Scholar] [CrossRef]
- Thapa, P.; Thapa, A.; Khadka, S.; Sapkota, S.; Panta, O.P.; Sharma, S.; Karki, T.B.; Poudel, P. Screening and Characterization of Potent Poly Glutamic Acid Producing Bacillus Sp. Isolated from Kinema, Water and Soil Samples. Heliyon 2021, 7, e07715. [Google Scholar] [CrossRef]
- Lawal, A.K.; Oso, B.A.; Sanni, A.I.; Olatunji, O.O. L-Glutamic Acid Production by Bacillus Spp. Isolated from Vegetable Proteins. Afr. J. Biotechnol. 2011, 10, 5337–5345. [Google Scholar]
- Harper, M.S.; Amanda Shen, Z.; Barnett, J.F.; Krsmanovic, L.; Dakoulas, E.W.; Delaney, B. Toxicology Studies with N-Acetylglycine. Food Chem. Toxicol. 2010, 48, 1321–1327. [Google Scholar] [CrossRef]
- Dzierzbicka, K. Synthesis of 2,6-Diaminopimelic Acid (DAP) and Its Analogues. ChemInform 2007, 38. [Google Scholar] [CrossRef]
- Bach, T.M.H.; Takagi, H. Properties, Metabolisms, and Applications of l-Proline Analogues. Appl. Microbiol. Biotechnol. 2013, 97, 6623–6634. [Google Scholar] [CrossRef]
- Aiyelabola, T.O.; Isabirye, D.A.; Akinkunmi, E.O.; Ogunkunle, O.A.; Ojo, I.A.O. Synthesis, Characterization, and Antimicrobial Activities of Coordination Compounds of Aspartic Acid. J. Chem. 2016, 2016, 1–8. [Google Scholar] [CrossRef]
- Bahri, S.; Zerrouk, N.; Aussel, C.; Moinard, C.; Crenn, P.; Curis, E.; Chaumeil, J.-C.; Cynober, L.; Sfar, S. Citrulline: From Metabolism to Therapeutic Use. Nutrition 2013, 29, 479–484. [Google Scholar] [CrossRef] [PubMed]
- Friedman, M. Analysis, Nutrition, and Health Benefits of Tryptophan. Int. J. Tryptophan Res. 2018, 11, 1178646918802282. [Google Scholar] [CrossRef] [PubMed]
- Comai, S.; Bertazzo, A.; Brughera, M.; Crotti, S. Tryptophan in Health and Disease. In Advances in Clinical Chemistry; Elsevier: Amsterdam, The Netherlands, 2020; Volume 95, pp. 165–218. ISBN 978-0-12-821165-6. [Google Scholar]
- Kreider, R.B.; Stout, J.R. Creatine in Health and Disease. Nutrients 2021, 13, 447. [Google Scholar] [CrossRef]
- Esmahan, C.; Alvarez, E.; Montenegro, E.; Martin, J.F. Catabolism of Lysine in Penicillium Chrysogenum Leads to Formation of 2-Aminoadipic Acid, a Precursor of Penicillin Biosynthesis. Appl. Environ. Microbiol. 1994, 60, 1705–1710. [Google Scholar] [CrossRef]
- Eswaranandam, S.; Hettiarachchy, N.S.; Johnson, M.G. Antimicrobial Activity of Citric, Lactic, Malic, or Tartaric Acids and Nisin-incorporated Soy Protein Film Against Listeria monocytogenes, Escherichia coli O157:H7, and Salmonella gaminara. J. Food Sci. 2004, 69, FMS79–FMS84. [Google Scholar] [CrossRef]
- Villeneuve, P.; Barēa, B.; Sarrazin, P.; Davrieux, F.; Boulanger, R.; Caro, Y.; Figueroa-Espinoza, M.C.; Pina, M.; Graille, J. Synthesis of Pyroglutamic Acid Fatty Esters through Lipase-Catalyzed Esterification with Medium Chains Alcohols. Enzym. Microb. Technol. 2003, 33, 79–84. [Google Scholar] [CrossRef]
- Urbanek, A.; Szadziewski, R.; Stepnowski, P.; Boros-Majewska, J.; Gabriel, I.; Dawgul, M.; Kamysz, W.; Sosnowska, D.; Gołębiowski, M. Composition and Antimicrobial Activity of Fatty Acids Detected in the Hygroscopic Secretion Collected from the Secretory Setae of Larvae of the Biting Midge Forcipomyia Nigra (Diptera: Ceratopogonidae). J. Insect Physiol. 2012, 58, 1265–1276. [Google Scholar] [CrossRef]
- Raybaudi-Massilia, R.M.; Mosqueda-Melgar, J.; Martín-Belloso, O. Antimicrobial Activity of Malic Acid against Listeria Monocytogenes, Salmonella Enteritidis and Escherichia Coli O157:H7 in Apple, Pear and Melon Juices. Food Control 2009, 20, 105–112. [Google Scholar] [CrossRef]
- Ling, N.; Raza, W.; Ma, J.; Huang, Q.; Shen, Q. Identification and Role of Organic Acids in Watermelon Root Exudates for Recruiting Paenibacillus Polymyxa SQR-21 in the Rhizosphere. Eur. J. Soil Biol. 2011, 47, 374–379. [Google Scholar] [CrossRef]
- In, Y.; Kim, J.; Kim, H.; Oh, S. Antimicrobial Activities of Acetic Acid, Citric Acid and Lactic Acid against S. higella Species. J. Food Saf. 2013, 33, 79–85. [Google Scholar] [CrossRef]
- Tadi, S.R.R.; Nehru, G.; Sivaprakasam, S. Microbial Production of Pantothenic Acid. In Microbial Production of Food Bioactive Compounds; Jafari, S.M., Harzevili, F.D., Eds.; Springer International Publishing: Cham, Switzerland, 2022; pp. 1–18. ISBN 978-3-030-81403-8. [Google Scholar]
- Mohan, A.; Purohit, A.S. Anti-Salmonella Activity of Pyruvic and Succinic Acid in Combination with Oregano Essential Oil. Food Control 2020, 110, 106960. [Google Scholar] [CrossRef]
- Mani-López, E.; Arrioja-Bretón, D.; López-Malo, A. The Impacts of Antimicrobial and Antifungal Activity of Cell-free Supernatants from Lactic Acid Bacteria in Vitro and Foods. Comp. Rev. Food Sci. Food Safe 2022, 21, 604–641. [Google Scholar] [CrossRef]
- Unver, T. A Preliminary Study of Fumaric Acid, Called Allomaleic Acid, as a Pharmaceutical Antimicrobial Compound. Med. Sci. Int. Med. J. 2024, 13, 383. [Google Scholar] [CrossRef]
- Garg, A.; Jers, C.; Hwang, H.J.; Kalantari, A.; Ventina, I.; Mijakovic, I. Engineering Bacillus Subtilis for Production of 3-Hydroxypropanoic Acid. Front. Bioeng. Biotechnol. 2023, 11, 1101232. [Google Scholar] [CrossRef]
- Secara, N.; Duca, G.; Vlad, L.; Macaev, F. Observations on the Antioxidant Activity of Novel Dihydroxyfumaric Acid Derivatives. Chem. J. Mold. 2010, 5, 59–67. [Google Scholar] [CrossRef]
- Yang, S.Y.; Park, M.R.; Kim, I.S.; Kim, Y.C.; Yang, J.W.; Ryu, C.-M. 2-Aminobenzoic Acid of Bacillus sp. BS107 as an ISR Determinant against Pectobacterium carotovorum subsp. carotovotrum SCC1 in Tobacco. Eur. J. Plant Pathol. 2011, 129, 371–378. [Google Scholar] [CrossRef]
- Lei, H.-M.; Wang, J.-T.; Hu, Q.-Y.; Li, C.-Q.; Mo, M.-H.; Zhang, K.-Q.; Li, G.-H.; Zhao, P.-J. 2-Furoic Acid Associated with the Infection of Nematodes by Dactylellina haptotyla and Its Biocontrol Potential on Plant Root-Knot Nematodes. Microbiol. Spectr. 2023, 11, e01896-23. [Google Scholar] [CrossRef]
- Tangerina, M.M.P.; Furtado, L.C.; Leite, V.M.B.; Bauermeister, A.; Velasco-Alzate, K.; Jimenez, P.C.; Garrido, L.M.; Padilla, G.; Lopes, N.P.; Costa-Lotufo, L.V.; et al. Metabolomic Study of Marine Streptomyces Sp.: Secondary Metabolites and the Production of Potential Anticancer Compounds. PLoS ONE 2020, 15, e0244385. [Google Scholar] [CrossRef]
- Alves, L.D.F.; Moore, J.B.; Kell, D.B. The Biology and Biochemistry of Kynurenic Acid, a Potential Nutraceutical with Multiple Biological Effects. Int. J. Mol. Sci. 2024, 25, 9082. [Google Scholar] [CrossRef] [PubMed]
- Kumar, A.; Rao, R.; Yadav, P. Azelaic Acid: A Promising Agent for Dermatological Applications. Curr. Drug Ther. 2020, 15, 181–193. [Google Scholar] [CrossRef]
- Haghpanah, M.; Jelodar, N.B.; Zarrini, H.N.; Pakdin-Parizi, A.; Dehestani, A. New Insights into Azelaic Acid-Induced Resistance against Alternaria Solani in Tomato Plants. BMC Plant Biol. 2024, 24, 687. [Google Scholar] [CrossRef] [PubMed]
- Todea, A.; Deganutti, C.; Spennato, M.; Asaro, F.; Zingone, G.; Milizia, T.; Gardossi, L. Azelaic Acid: A Bio-Based Building Block for Biodegradable Polymers. Polymers 2021, 13, 4091. [Google Scholar] [CrossRef] [PubMed]
- Yoon, B.; Jackman, J.; Valle-González, E.; Cho, N.-J. Antibacterial Free Fatty Acids and Monoglycerides: Biological Activities, Experimental Testing, and Therapeutic Applications. Int. J. Mol. Sci. 2018, 19, 1114. [Google Scholar] [CrossRef]
- Galdiero, E.; Ricciardelli, A.; D’Angelo, C.; De Alteriis, E.; Maione, A.; Albarano, L.; Casillo, A.; Corsaro, M.M.; Tutino, M.L.; Parrilli, E. Pentadecanoic Acid against Candida Albicans-Klebsiella Pneumoniae Biofilm: Towards the Development of an Anti-Biofilm Coating to Prevent Polymicrobial Infections. Res. Microbiol. 2021, 172, 103880. [Google Scholar] [CrossRef]
- Skorochod, I.; Roy, A.; Kurdish, I.; Erdenezogt, U. Content of Organic Acids in the Cultural Medium of Bacillus Subtilis Imv B-7023 at Cultivation with Different Sources of the Phosphorus Nutrient. J. Microb. Biotechnol. Food Sci. 2020, 10, 73–77. [Google Scholar] [CrossRef]
- Santos, J.E.D.Á.; De Brito, M.V.; Pimenta, A.T.Á.; Da Silva, G.S.; Zocolo, G.J.; Muniz, C.R.; De Medeiros, S.C.; Grangeiro, T.B.; Lima, M.A.S.; Da Silva, C.D.F.B. Antagonism of Volatile Organic Compounds of the Bacillus Sp. against Fusarium Kalimantanense. World J. Microbiol. Biotechnol. 2023, 39, 60. [Google Scholar] [CrossRef] [PubMed]
- Keweloh, H.; Heipieper, H.J. Trans Unsaturated Fatty Acids in Bacteria. Lipids 1996, 31, 129–137. [Google Scholar] [CrossRef] [PubMed]
- Das, U.N. Arachidonic Acid and Other Unsaturated Fatty Acids and Some of Their Metabolites Function as Endogenous Antimicrobial Molecules: A Review. J. Adv. Res. 2018, 11, 57–66. [Google Scholar] [CrossRef]
- Corina, D.L.; Munday, K.A. Studies on Polyol Function in Aspergillus Clavatus: A Role for Mannitol and Ribitol. J. Gen. Microbiol. 1971, 69, 221–227. [Google Scholar] [CrossRef] [PubMed]
- Onose, S.; Ikeda, R.; Nakagawa, K.; Kimura, T.; Yamagishi, K.; Higuchi, O.; Miyazawa, T. Production of the α-Glycosidase Inhibitor 1-Deoxynojirimycin from Bacillus Species. Food Chem. 2013, 138, 516–523. [Google Scholar] [CrossRef]
- Silveira, M.; Jonas, R. The Biotechnological Production of Sorbitol. Appl. Microbiol. Biotechnol. 2002, 59, 400–408. [Google Scholar] [CrossRef]
- Olaitan, A.O.; Morand, S.; Rolain, J.-M. Mechanisms of Polymyxin Resistance: Acquired and Intrinsic Resistance in Bacteria. Front. Microbiol. 2014, 5, 643. [Google Scholar] [CrossRef]
- Batovska, D.I.; Todorova, I.T.; Nedelcheva, D.V.; Parushev, S.P.; Atanassov, A.I.; Hvarleva, T.D.; Djakova, G.J.; Bankova, V.S.; Popov, S.S. Preliminary Study on Biomarkers for the Fungal Resistance in Vitis Vinifera Leaves. J. Plant Physiol. 2008, 165, 791–795. [Google Scholar] [CrossRef]
- Ogawa, J.; Saito, K.; Sakai, T.; Horinouchi, N.; Kawano, T.; Matsumoto, S.; Sasaki, M.; Mikami, Y.; Shimizu, S. Microbial Production of 2-Deoxyribose 5-Phosphate from Acetaldehyde and Triosephosphate for the Synthesis of 2′-Deoxyribonucleosides. Biosci. Biotechnol. Biochem. 2003, 67, 933–936. [Google Scholar] [CrossRef]
- Li, G.; Jian, T.; Liu, X.; Lv, Q.; Zhang, G.; Ling, J. Application of Metabolomics in Fungal Research. Molecules 2022, 27, 7365. [Google Scholar] [CrossRef]
- Scigelova, M.; Crout, D.H.G. Microbial β-N-Acetylhexosaminidases and Their Biotechnological Applications. Enzym. Microb. Technol. 1999, 25, 3–14. [Google Scholar] [CrossRef]
- Song, X.-S.; Li, H.-P.; Zhang, J.-B.; Song, B.; Huang, T.; Du, X.-M.; Gong, A.-D.; Liu, Y.-K.; Feng, Y.-N.; Agboola, R.S.; et al. Trehalose 6-Phosphate Phosphatase Is Required for Development, Virulence and Mycotoxin Biosynthesis Apart from Trehalose Biosynthesis in Fusarium Graminearum. Fungal Genet. Biol. 2014, 63, 24–41. [Google Scholar] [CrossRef]
- Ossoliński, K.; Ruman, T.; Copié, V.; Tripet, B.P.; Kołodziej, A.; Płaza-Altamer, A.; Ossolińska, A.; Ossoliński, T.; Krupa, Z.; Nizioł, J. Metabolomic Profiling of Human Bladder Tissue Extracts. Metabolomics 2024, 20, 14. [Google Scholar] [CrossRef] [PubMed]
- Szulc, J.; Okrasa, M.; Nowak, A.; Ryngajłło, M.; Nizioł, J.; Kuźniar, A.; Ruman, T.; Gutarowska, B. Uncontrolled Post-Industrial Landfill—Source of Metals, Potential Toxic Compounds, Dust, and Pathogens in Environment—A Case Study. Molecules 2024, 29, 1496. [Google Scholar] [CrossRef] [PubMed]
- Nizioł, J.; Misiorek, M.; Krupa, Z.; Ruman, T. Infrared Laser-Based Selected Reaction Monitoring Mass Spectrometry Imaging of Banana (Musa Spp.) Tissue—New Method for Detection and Spatial Localization of Metabolites in Food. Food Anal. Methods 2024, 17, 236–250. [Google Scholar] [CrossRef]
- Pang, Z.; Lu, Y.; Zhou, G.; Hui, F.; Xu, L.; Viau, C.; Spigelman, A.F.; MacDonald, P.E.; Wishart, D.S.; Li, S.; et al. MetaboAnalyst 6.0: Towards a Unified Platform for Metabolomics Data Processing, Analysis and Interpretation. Nucleic Acids Res. 2024, 52, W398–W406. [Google Scholar] [CrossRef]


| Type | Name (Tested Microorganisms) | Ion Image |
|---|---|---|
| Pro-Leu | (left: F. graminarum; right: P. amylolyticus) | 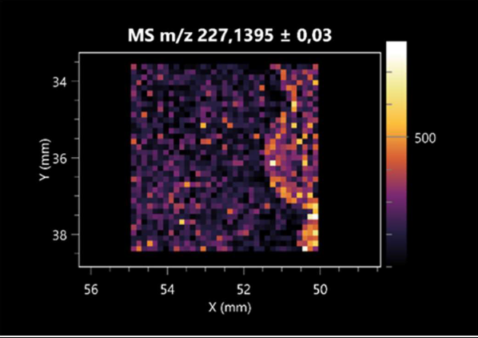 |
| PyroGlu-Ala | (left: B. cereus; right: F. graminarum) | 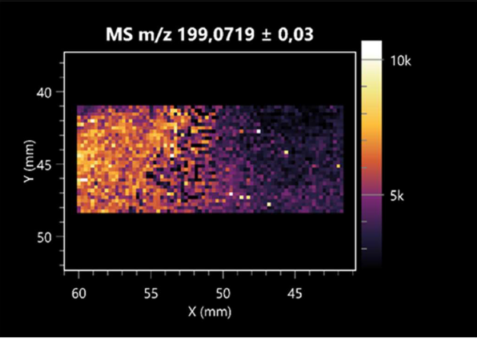 |
| Pro-Pro | (left: B. cereus; right: F. graminarum) | 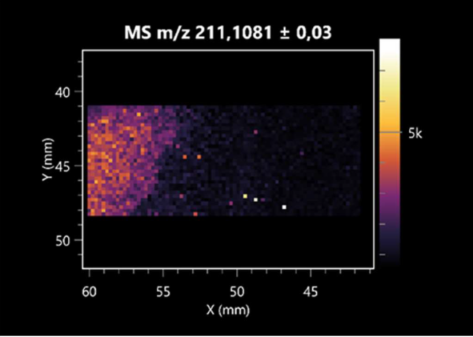 |
| Pro-Val | (left: B. cereus; right: F. graminarum) |  |
| Leu-Pro | (left: B. cereus; right: F. graminarum) | 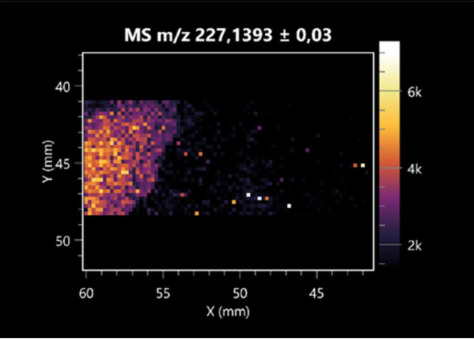 |
| Pro-Asn | (left: B. cereus; right: F. graminarum) | 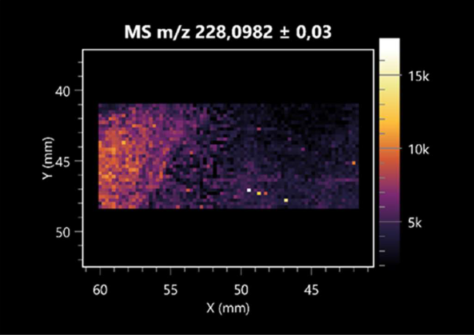 |
| Asp-Leu | (left: B. cereus; right: F. graminarum) | 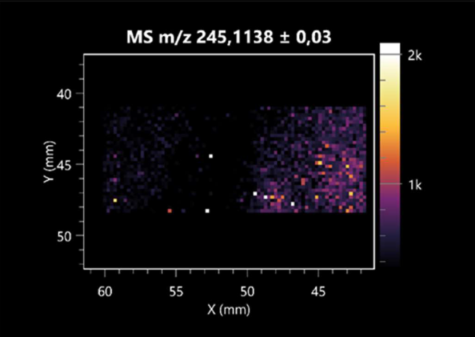 |
| Name (Tested Microorganisms) | Ion Image |
|---|---|
| L-glutamine (left: F. graminarum; right: P. amylolyticus) | 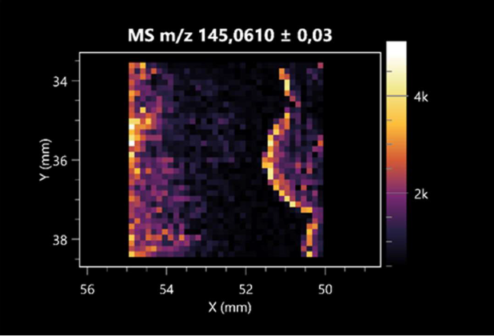 |
| L-glutamic acid (left: F. graminarum; right: P. amylolyticus) | 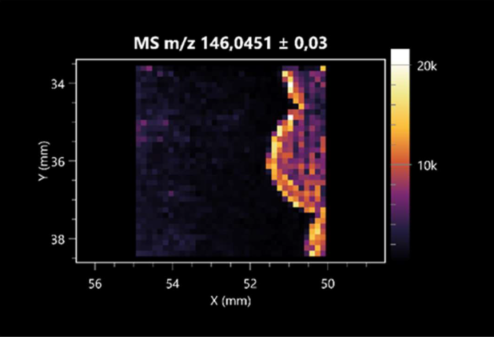 |
| L-arginine (left: F. graminarum; right: P. amylolyticus) | 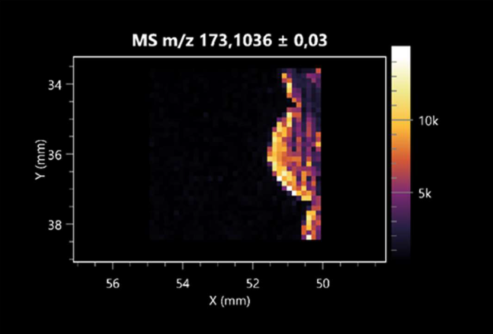 |
| Diaminopimelic acid (left: F. graminarum; right: P. amylolyticus) |  |
| L-proline (left: B. cereus right: F. graminarum) | 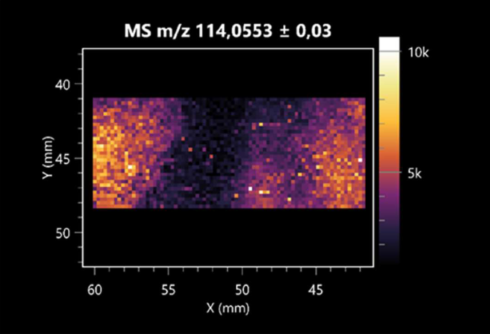 |
| L-aspartic acid (left: B. cereus; right: F. graminarum) | 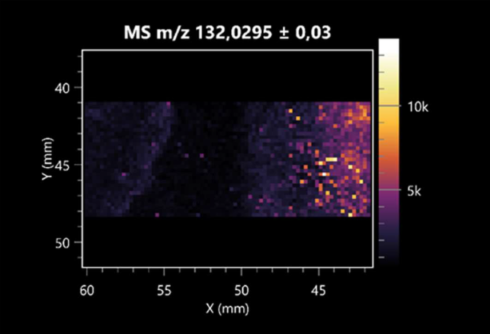 |
| Citrulline (left: B. cereus; right: F. graminarum) | 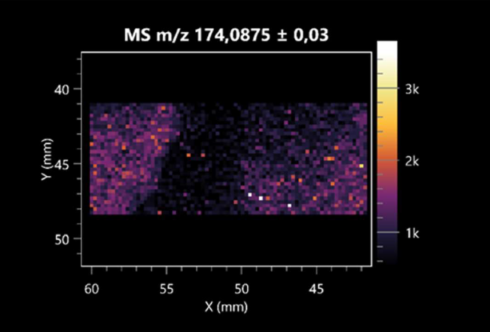 |
| L-tryptophan (left: B. cereus; right: F. graminarum) |  |
| N-acetylglycine (left: F. graminarum; right: P. amylolyticus) |  |
| Creatine (left: B. cereus; right: F. graminarum) |  |
| Aminoadipic acid (left: B. cereus; right: F. graminarum) |  |
| 4-acetamidobutanoic acid (left: B. cereus; right: F. graminarum) |  |
| Name | Tested Microorganisms | Ion Image |
|---|---|---|
| Pyrrolidonecarboxylic acid | (left: F. graminarum; right: P. amylolyticus) |  |
| Malic acid | (left: F. graminarum; right: P. amylolyticus) |  |
| Citric acid | (left: B. cereus; right: F. graminarum) | 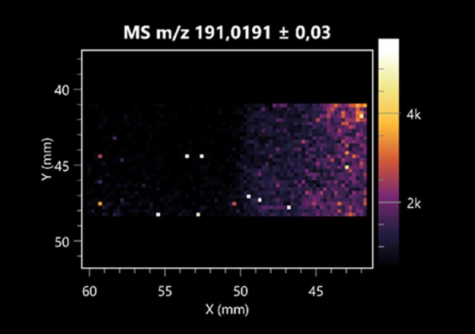 |
| Sebacic acid | (left: B. cereus; right: F. graminarum) |  |
| Pantothenic acid | (left: B. cereus; right: F. graminarum) |  |
| Propionic acid | (left: B. cereus; right: F. graminarum) |  |
| Lactic acid | (left: B. cereus; right: F. graminarum) |  |
| 2-furoic acid | (left: B. cereus; right: F. graminarum) |  |
| Fumaric acid | (left: B. cereus; right: F. graminarum) |  |
| Succinic acid | (left: B. cereus; right: F. graminarum) |  |
| Hydroxypropanedioic acid | (left: B. cereus; right: F. graminarum) | 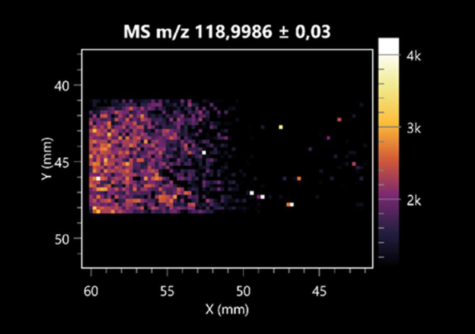 |
| Dihydroxyfumaric acid | (left: B. cereus; right: F. graminarum) | 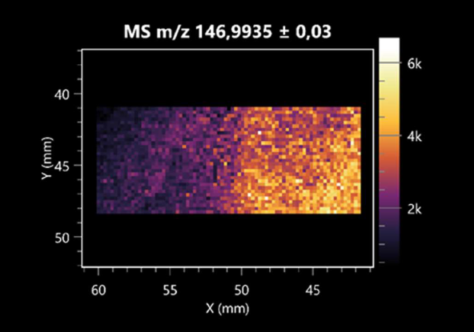 |
| 2-Aminobenzoic acid | (left: B. cereus right: F. graminarum) | 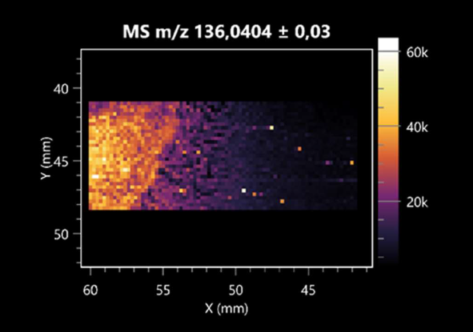 |
| Xanthurenic acid | (left: B. cereus; right: F. graminarum) |  |
| Kynurenic acid | (left: B. cereus; right: F. graminarum) | 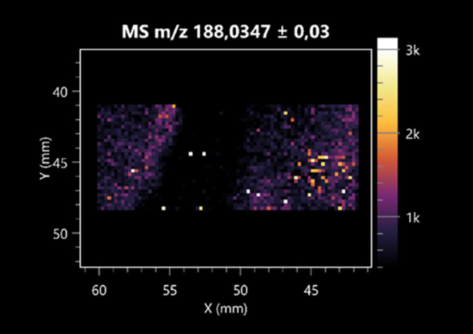 |
| Name | Tested Microorganisms | Ion Image |
|---|---|---|
| Azelaic acid | (left: F. graminarum; right: P. amylolyticus) | 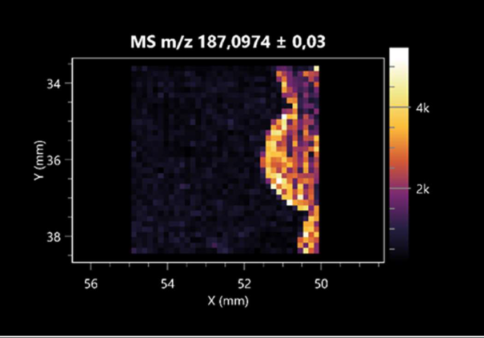 |
| (left: B. cereus; right: F. graminarum) |  | |
| Elaidic acid | (left: B. cereus; right: F. graminarum) | 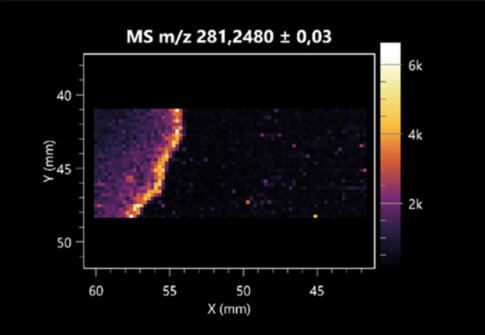 |
| Linolenic acid | (left: B. cereus; right: F. graminarum) |  |
| Linoleic acid | (left: B. cereus; right: F. graminarum) | 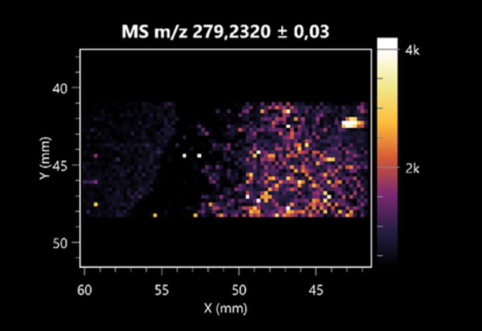 |
| Pentadecanoic acid | (left: B. cereus; right: F. graminarum) |  |
| Valeric acid | (left: B. cereus; right: F. graminarum) | 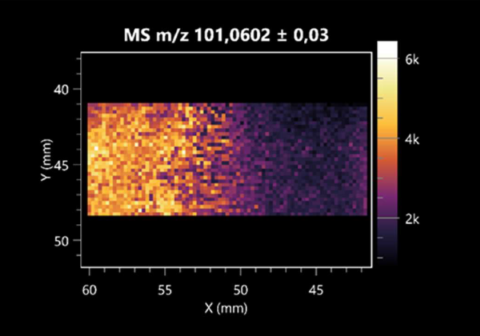 |
| Name | Tested Microorganisms | Ion Image |
|---|---|---|
| Ribitol | (left: F. graminarum; right: P. amylolyticus) | 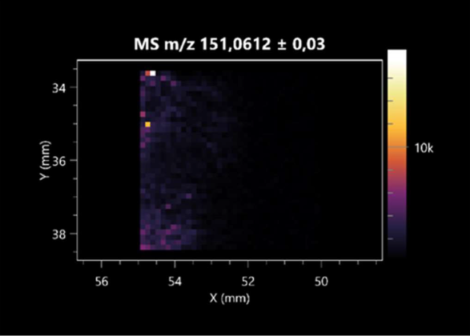 |
| Sorbitol | (left: F. graminarum; right: P. amylolyticus) |  |
| 2-amino-2-deoxy-D-mannitol | (left: B. cereus; right: F. graminarum) | 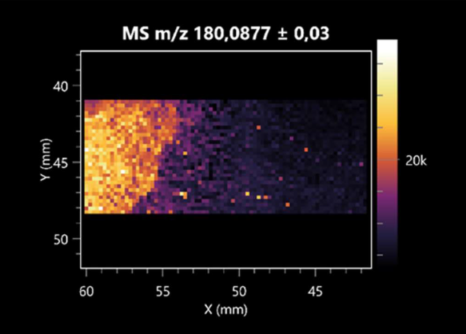 |
| 4-amino-4-deoxy-L-arabinose | (left: B. cereus; right: F. graminarum) | 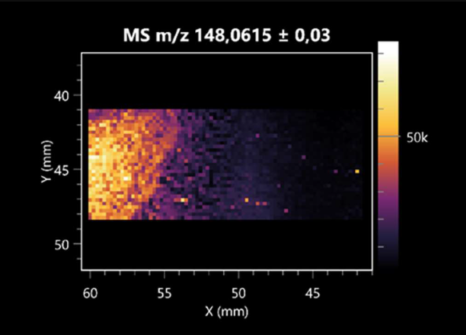 |
| Erythronic acid | (left: B. cereus; right: F. graminarum) |  |
| Deoxyribose 5-phosphate | (left: B. cereus; right: F. graminarum) |  |
| N-acetylmannosamine | (left: B. cereus; right: F. graminarum) |  |
| Trehalose | (left: B. cereus; right: F. graminarum) | 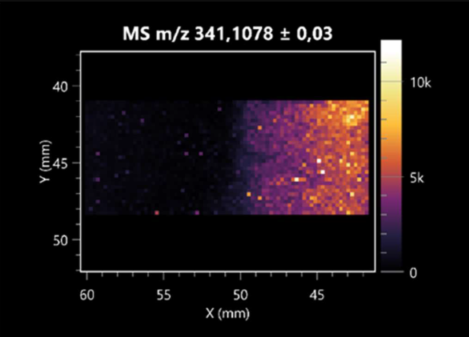 |
| Compound | Ion Images | |
|---|---|---|
| Amino acids and derivatives | L-glutamine |  |
| L-glutamic acid | 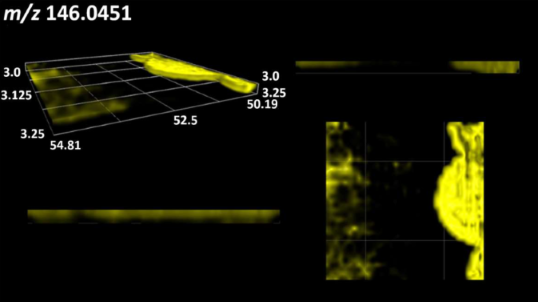 | |
| L-arginine | 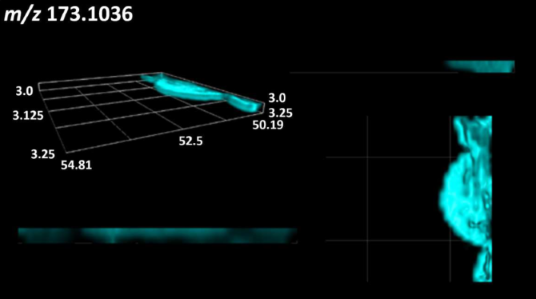 | |
| N-acetylglycine | 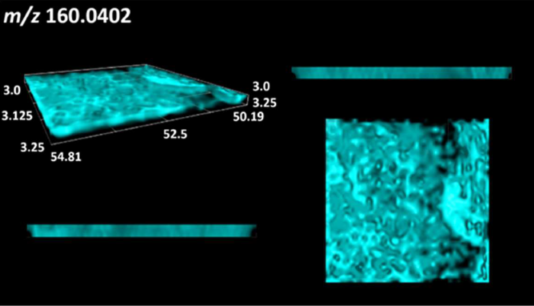 | |
| Diaminopimelic acid | 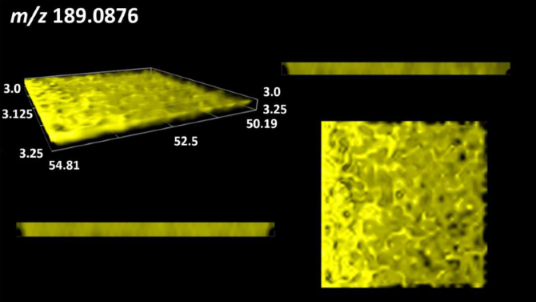 | |
| Organic acids | Pyrrolidonecarboxylic acid | 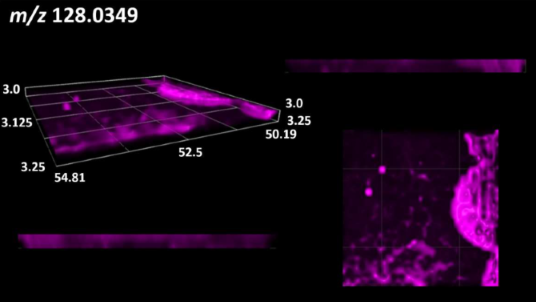 |
| Malic acid | 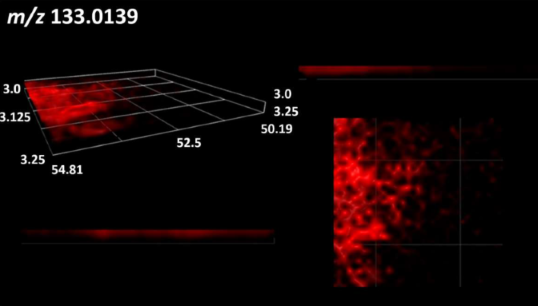 | |
| Dipeptides | Pro-Leu | 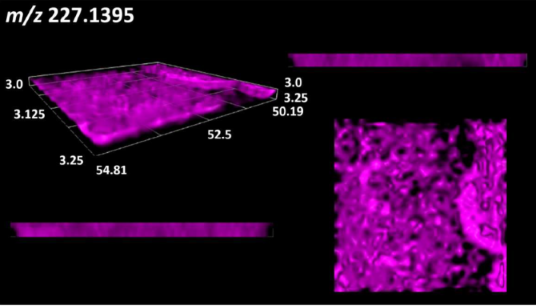 |
| Fatty acids | Azelaic acid | 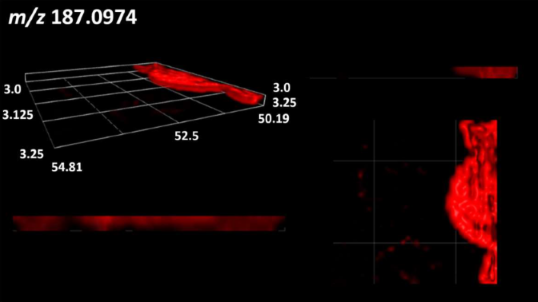 |
| Sugars and sugar derivatives | Ribitol | 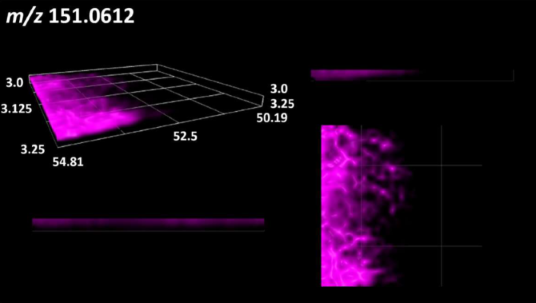 |
| Sorbitol |  | |
| Deoxyguanosine |  | |
| Benzene derivatives | N-methylbenzamide | 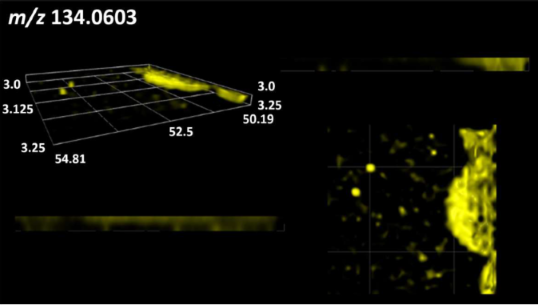 |
| Indoles | Indole-3-carboxylic acid |  |
Disclaimer/Publisher’s Note: The statements, opinions and data contained in all publications are solely those of the individual author(s) and contributor(s) and not of MDPI and/or the editor(s). MDPI and/or the editor(s) disclaim responsibility for any injury to people or property resulting from any ideas, methods, instructions or products referred to in the content. |
© 2025 by the authors. Licensee MDPI, Basel, Switzerland. This article is an open access article distributed under the terms and conditions of the Creative Commons Attribution (CC BY) license (https://creativecommons.org/licenses/by/4.0/).
Share and Cite
Szulc, J.; Grzyb, T.; Nizioł, J.; Krupa, S.; Szuberla, W.; Ruman, T. Direct 3D Mass Spectrometry Imaging Analysis of Environmental Microorganisms. Molecules 2025, 30, 1317. https://doi.org/10.3390/molecules30061317
Szulc J, Grzyb T, Nizioł J, Krupa S, Szuberla W, Ruman T. Direct 3D Mass Spectrometry Imaging Analysis of Environmental Microorganisms. Molecules. 2025; 30(6):1317. https://doi.org/10.3390/molecules30061317
Chicago/Turabian StyleSzulc, Justyna, Tomasz Grzyb, Joanna Nizioł, Sumi Krupa, Wiktoria Szuberla, and Tomasz Ruman. 2025. "Direct 3D Mass Spectrometry Imaging Analysis of Environmental Microorganisms" Molecules 30, no. 6: 1317. https://doi.org/10.3390/molecules30061317
APA StyleSzulc, J., Grzyb, T., Nizioł, J., Krupa, S., Szuberla, W., & Ruman, T. (2025). Direct 3D Mass Spectrometry Imaging Analysis of Environmental Microorganisms. Molecules, 30(6), 1317. https://doi.org/10.3390/molecules30061317