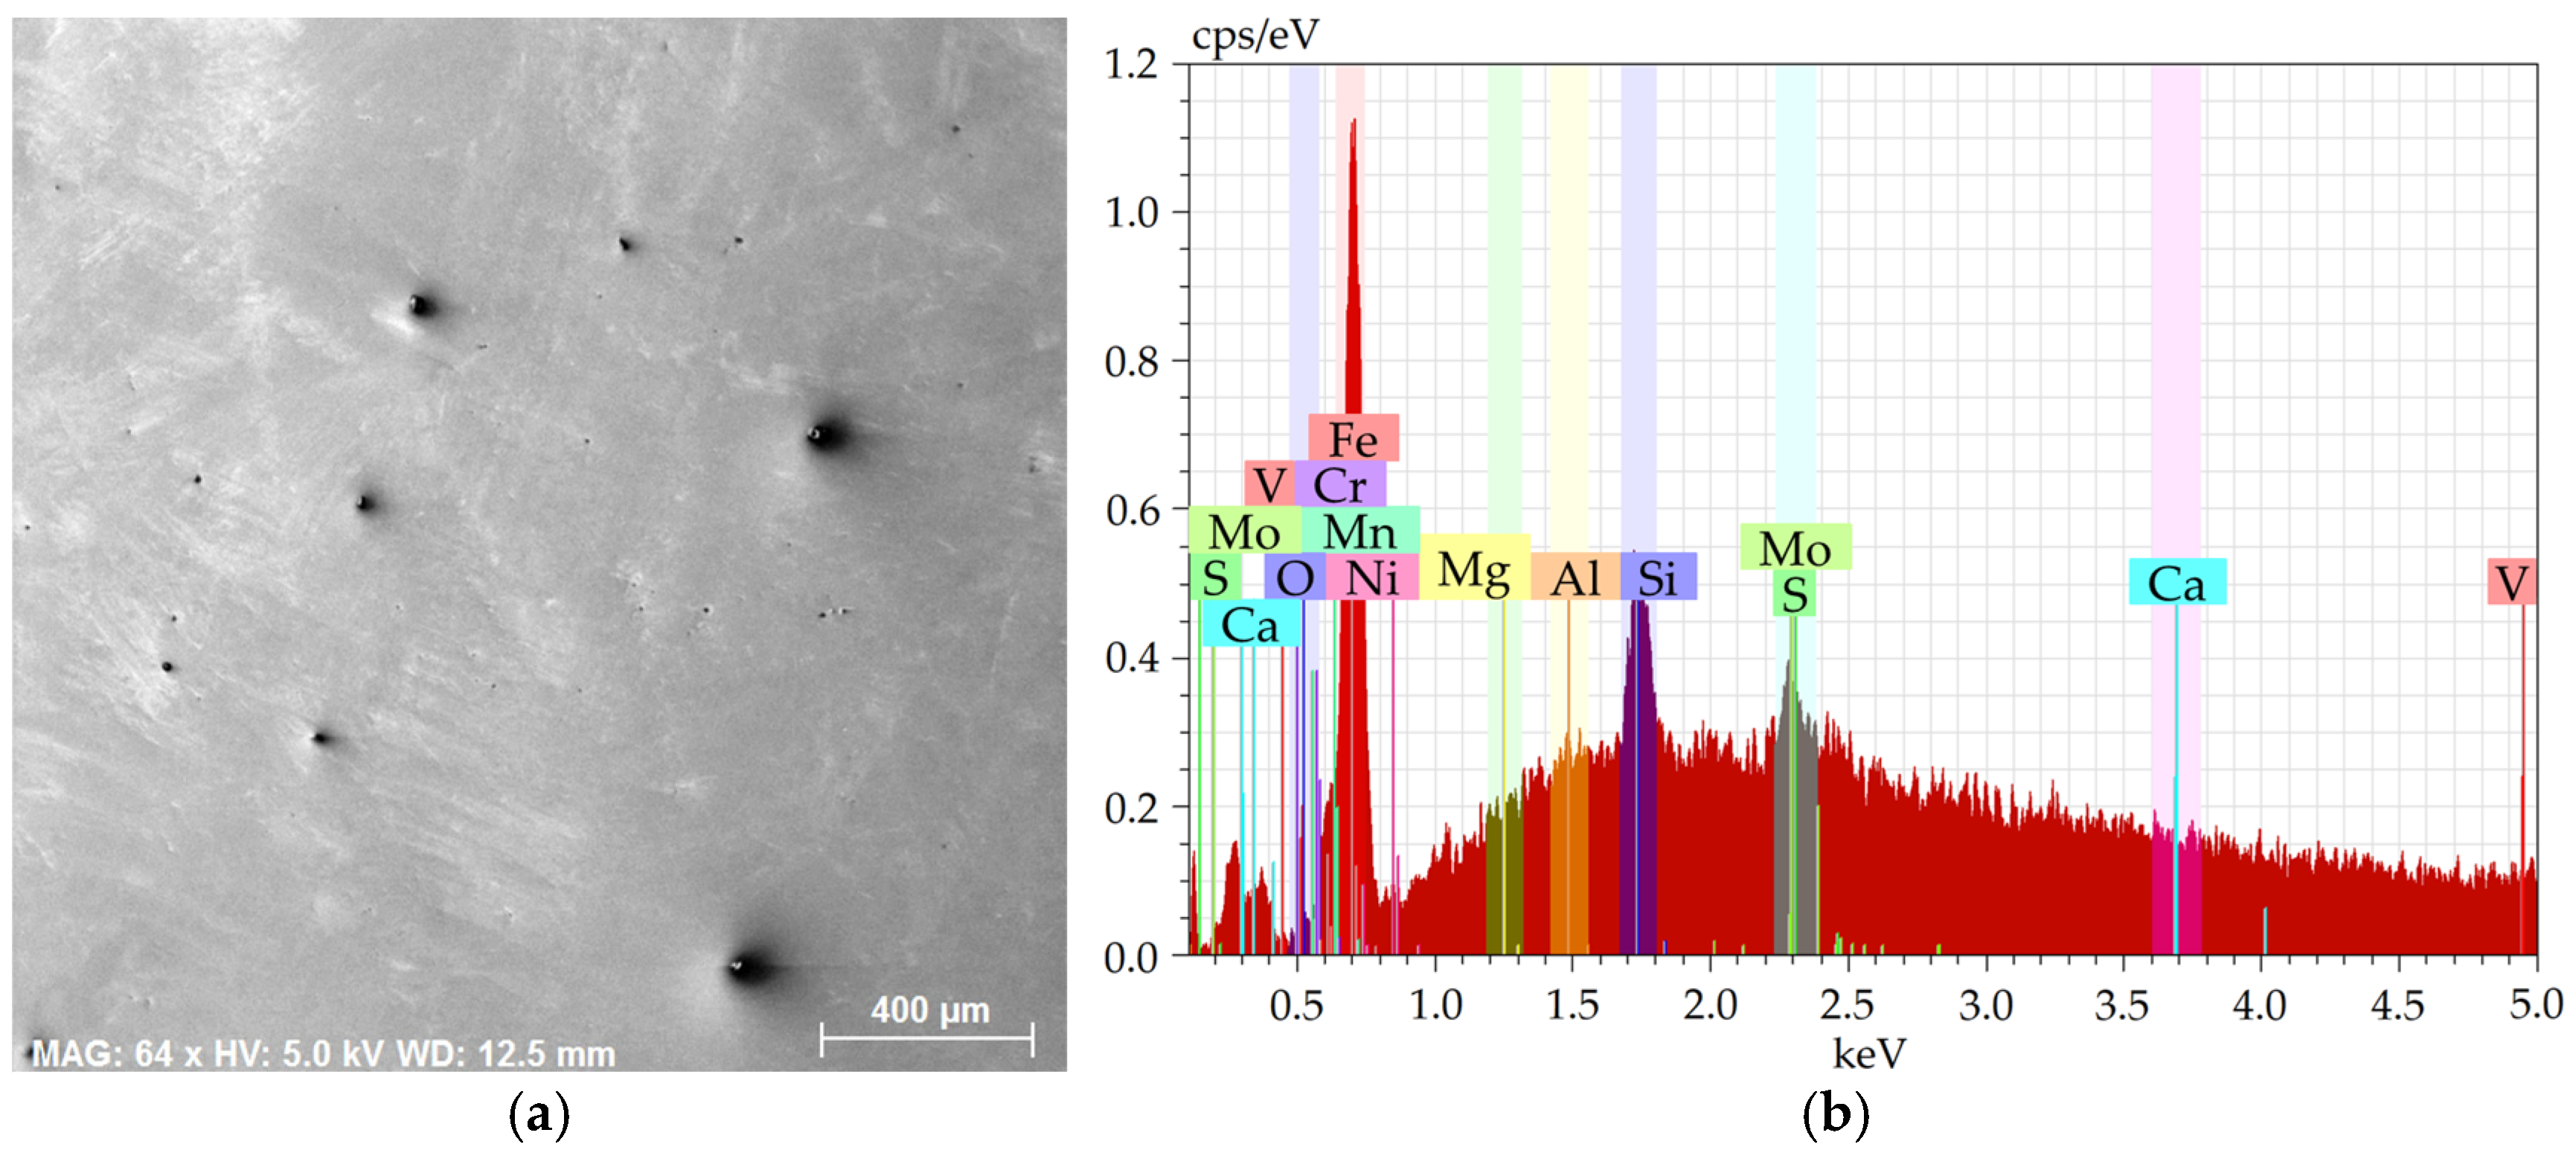
2.1. Energy Dispersive X-Ray Analysis of the Chemical Compositions
Figure 1a shows an SEM-SE image of the investigated 2 × 2 mm
2 area from the 601 sample, while
Figure 1b depicts the EDX chart from the respective area.
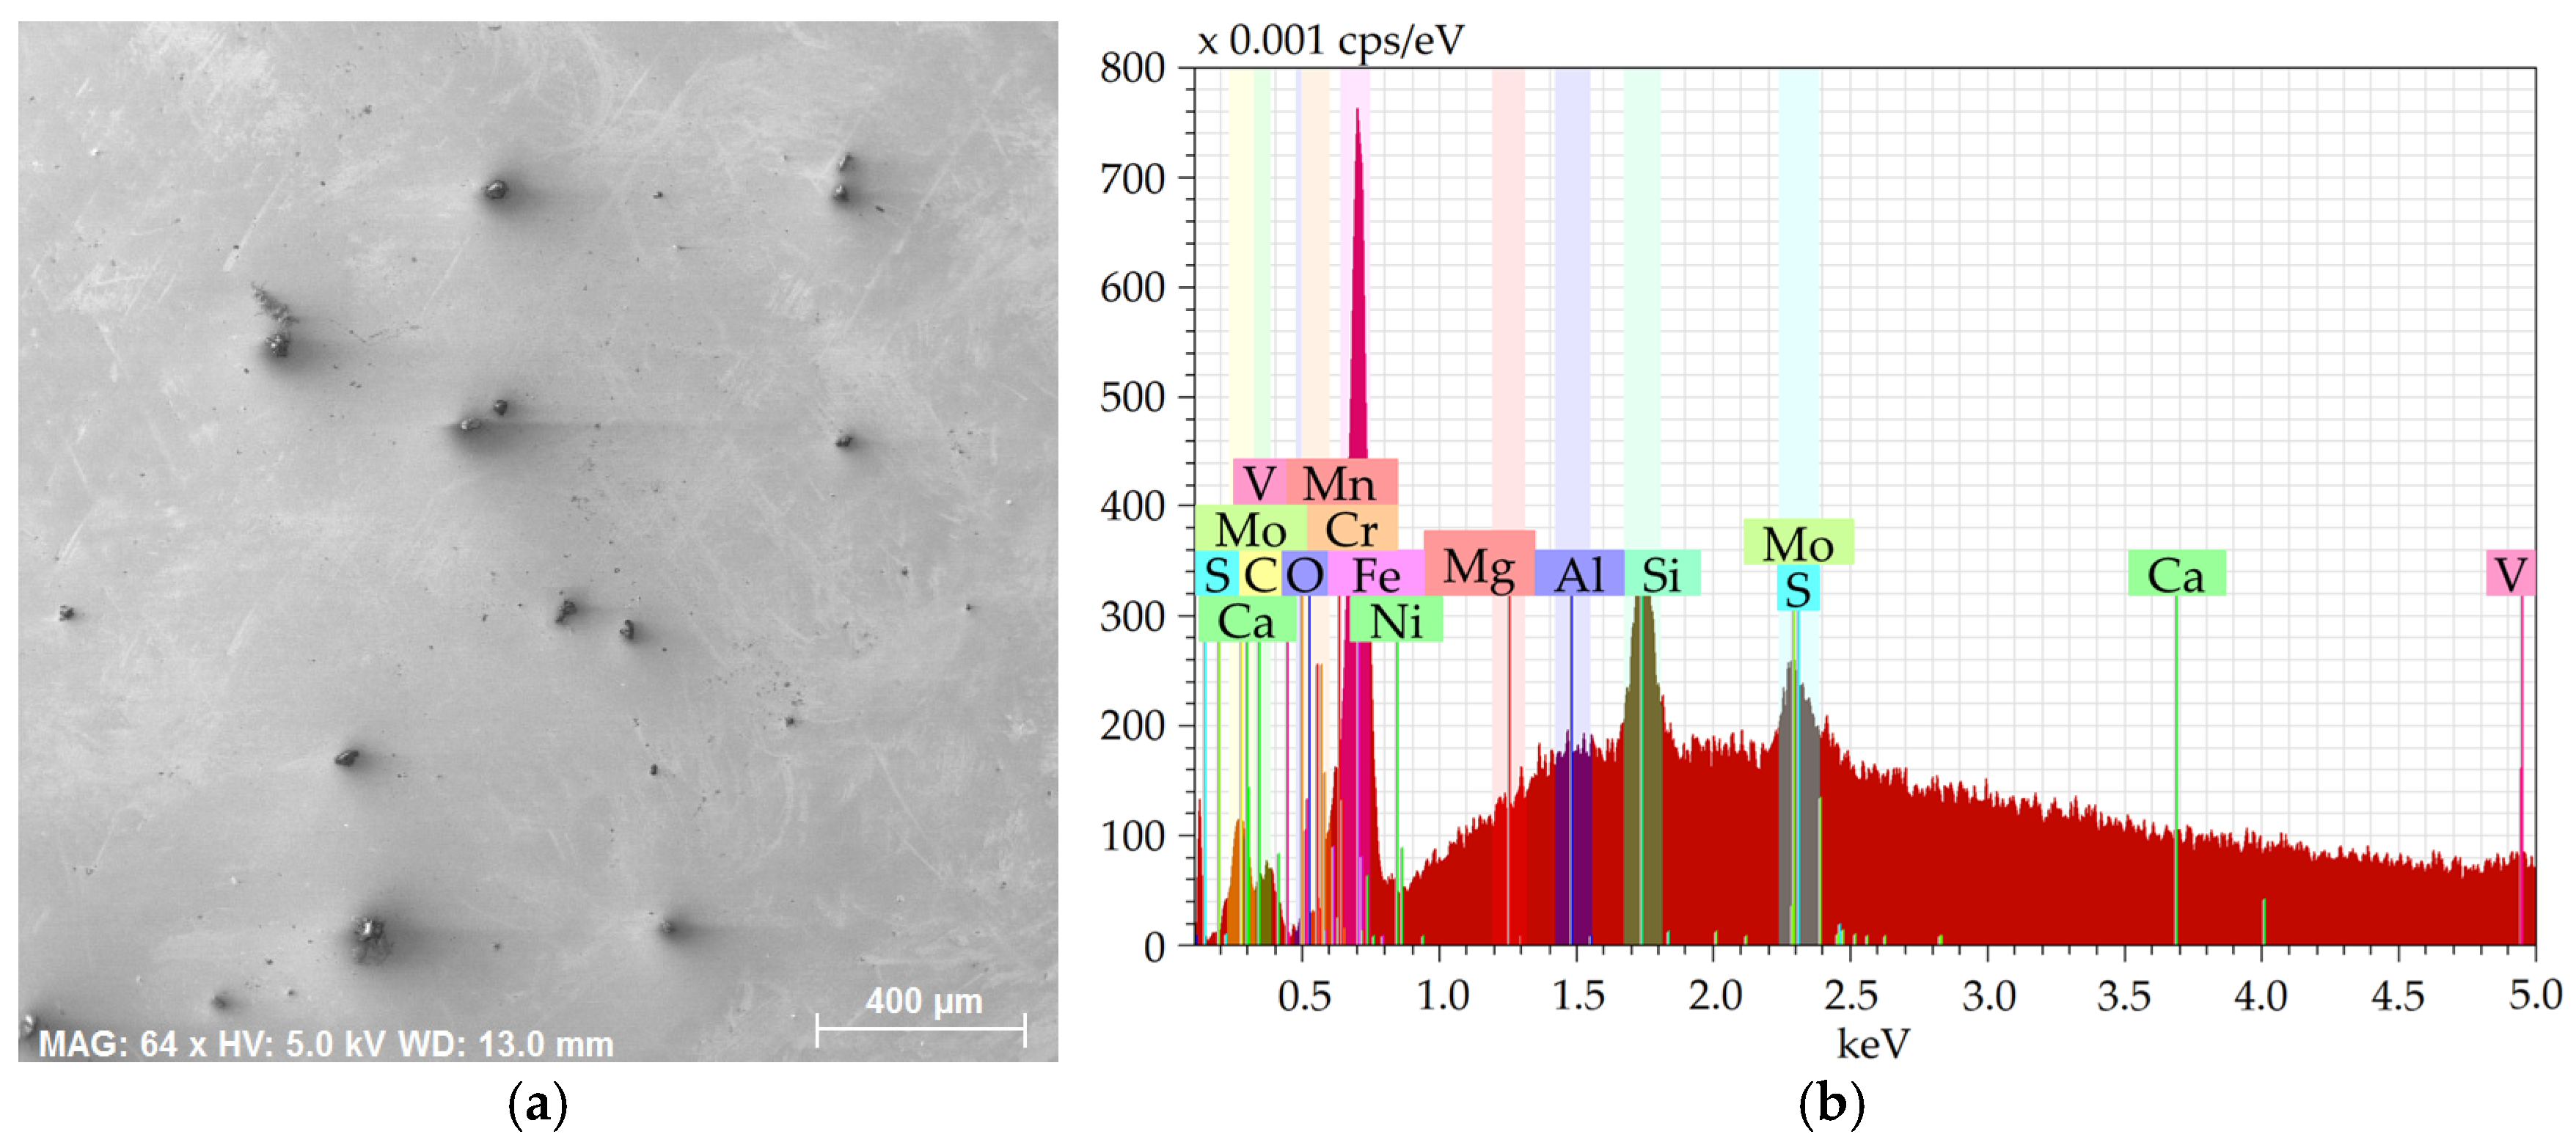
Figure 2a then shows an SEM-SE image of the 2 × 2 mm
2 area from the 602 sample, and
Figure 2b depicts the EDX chart from the respective area.
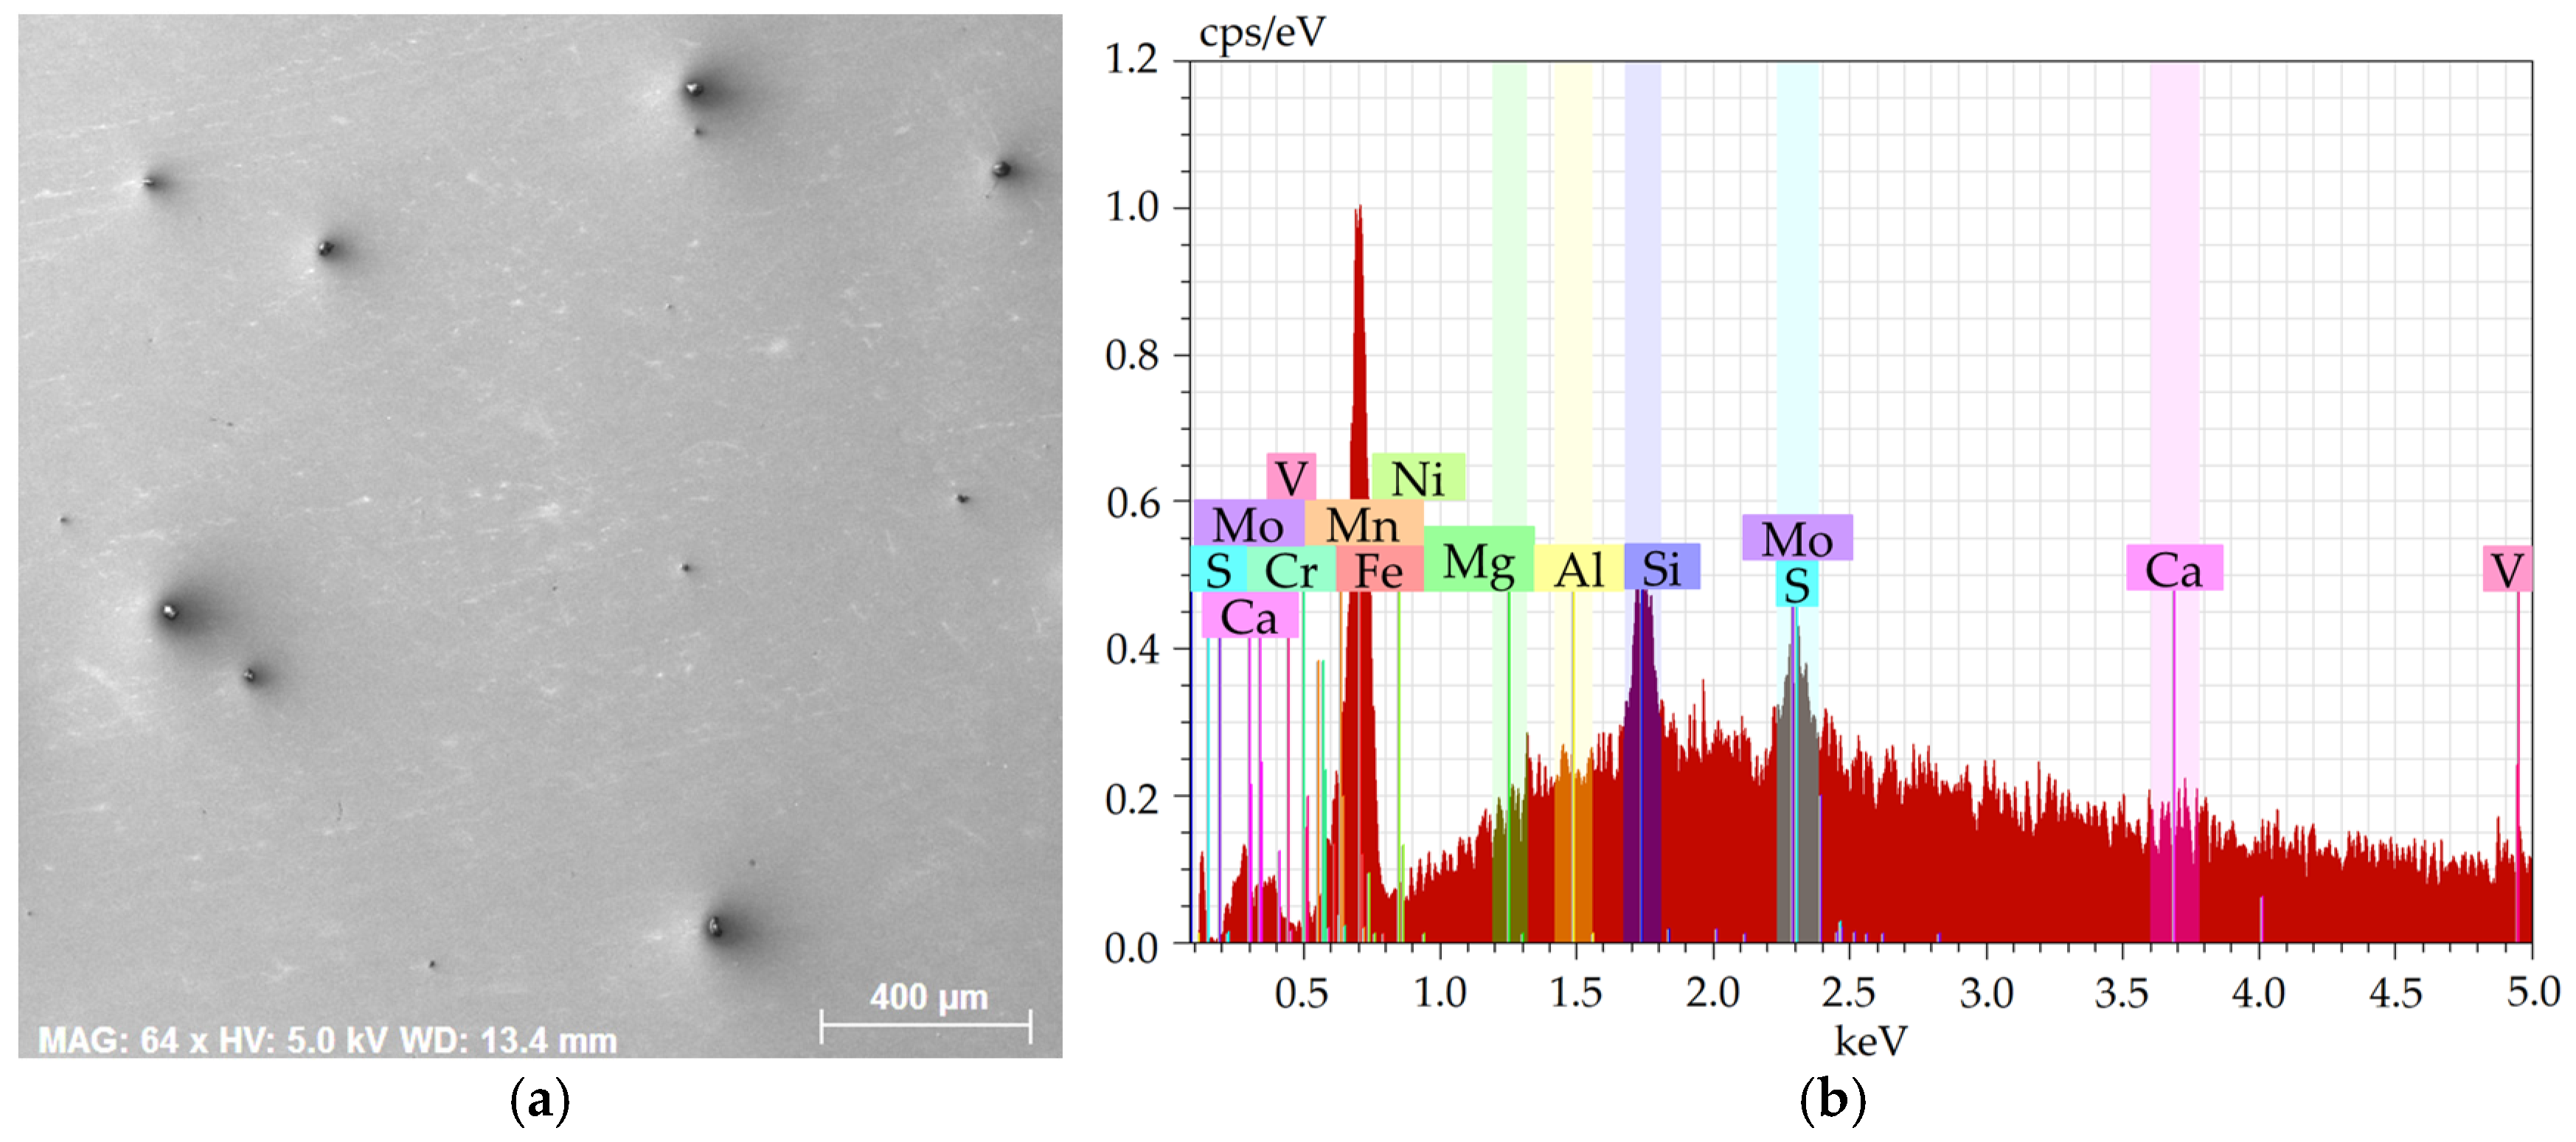
Figure 3a shows an SEM-SE image of the investigated area from the 276 sample, while
Figure 3b depicts the EDX chart from the respective area. Lastly,
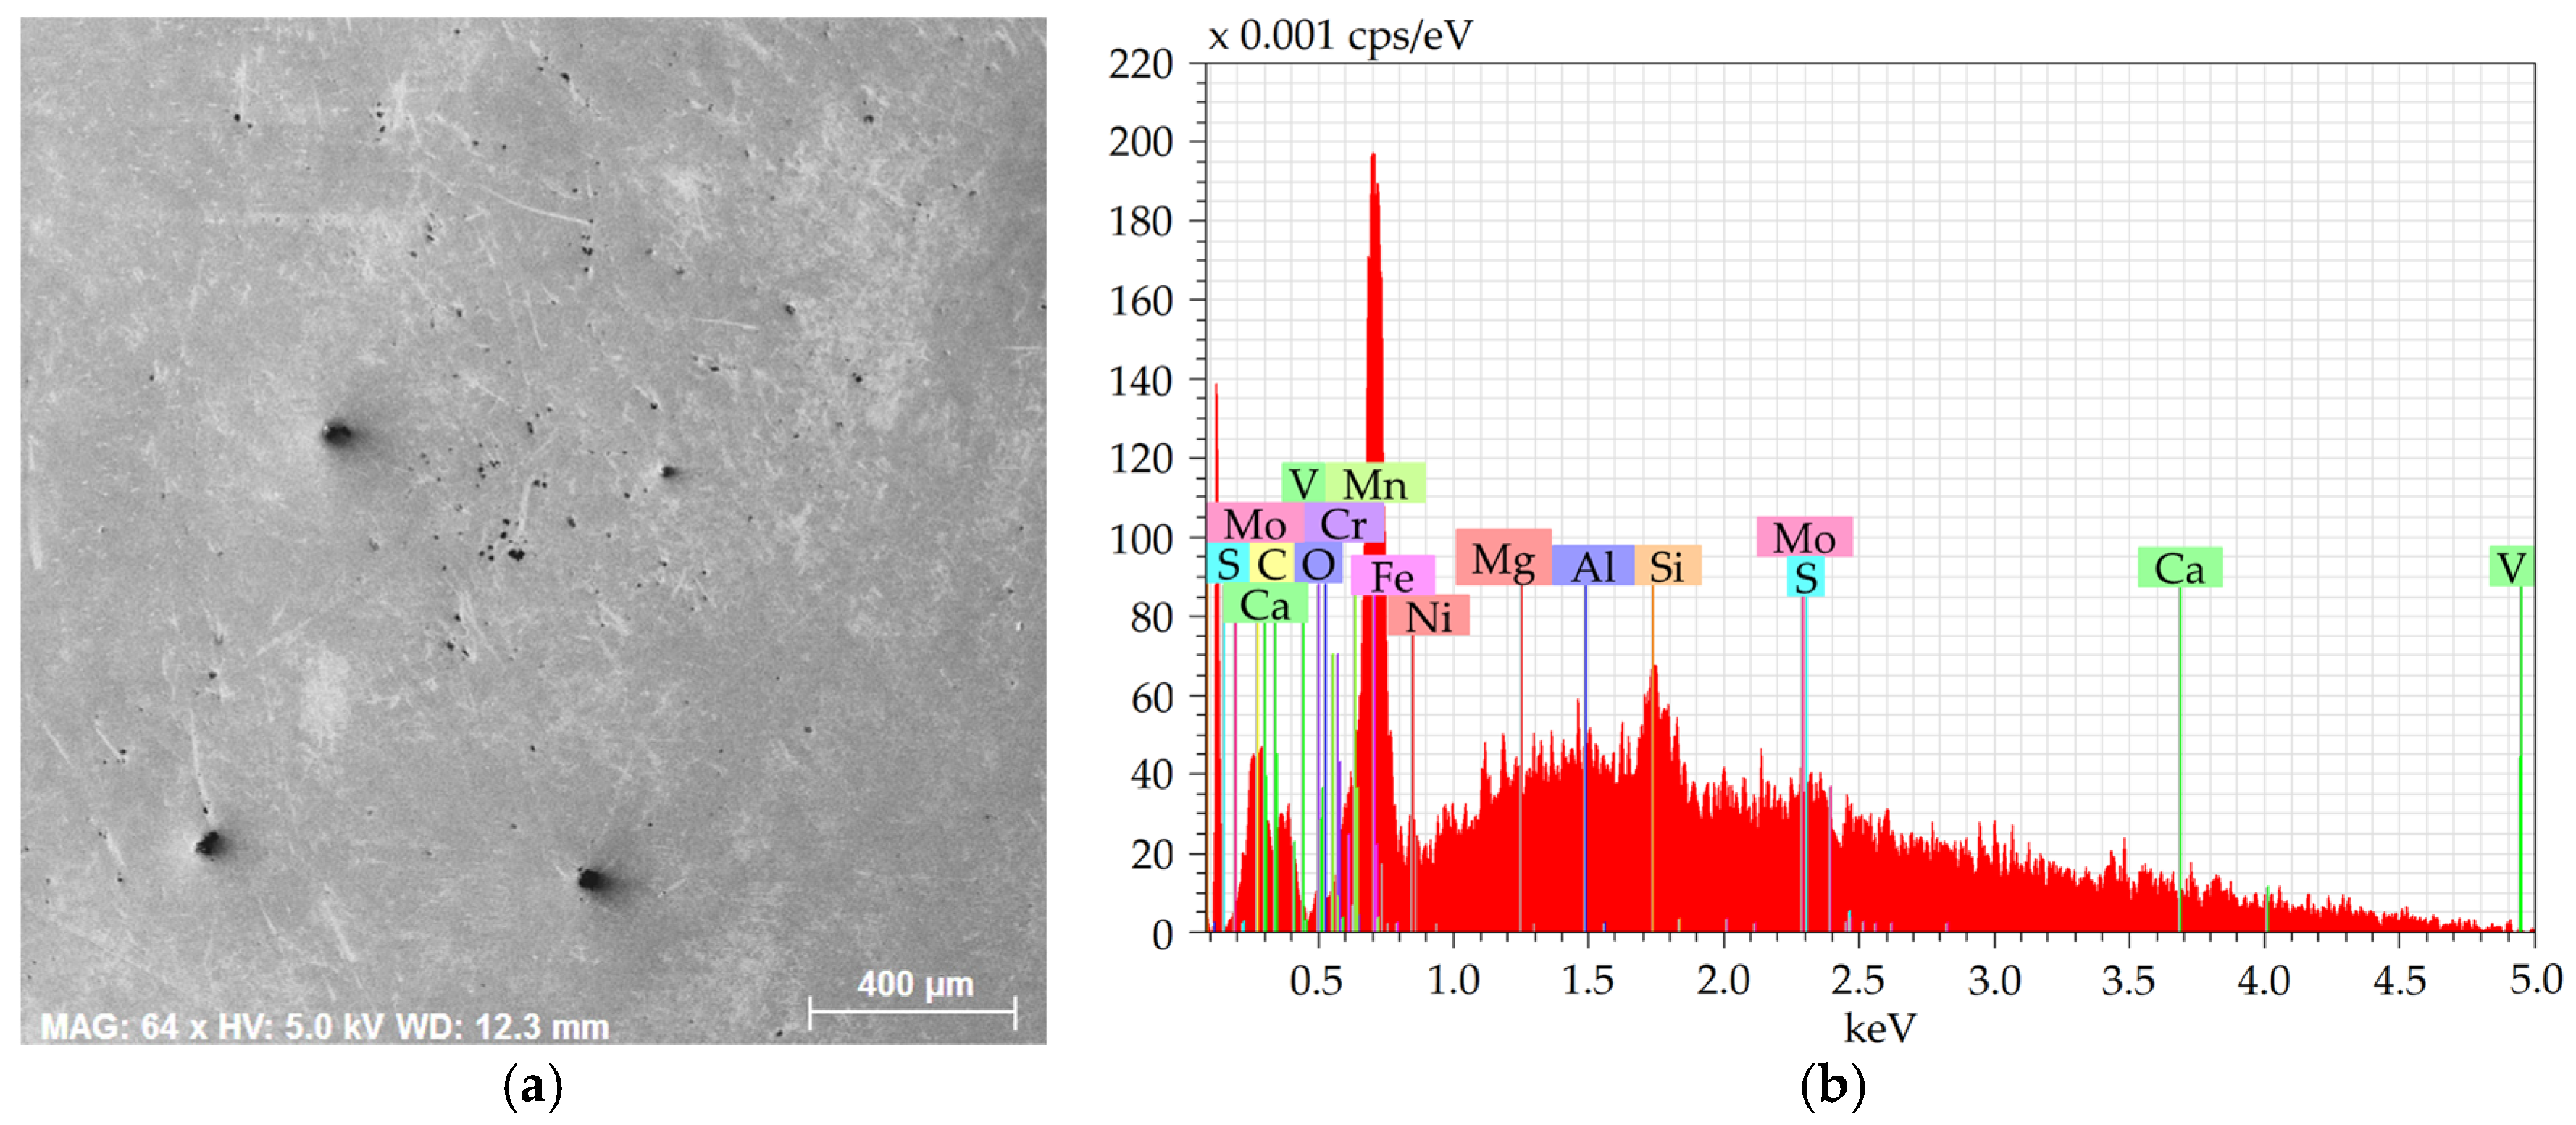
Figure 4a shows an SEM-SE image of the investigated area from the 277 sample, and
Figure 4b depicts the EDX chart from the respective area.
The charts depict that the samples contained the majority of Fe plus other elements, especially Si, Mg, Al, Ca, and also C, S, and O. The majority of the Mg, Al, Ca, and S were bound within more or less coarse inclusions, which will further be characterized for each examined steel batch.
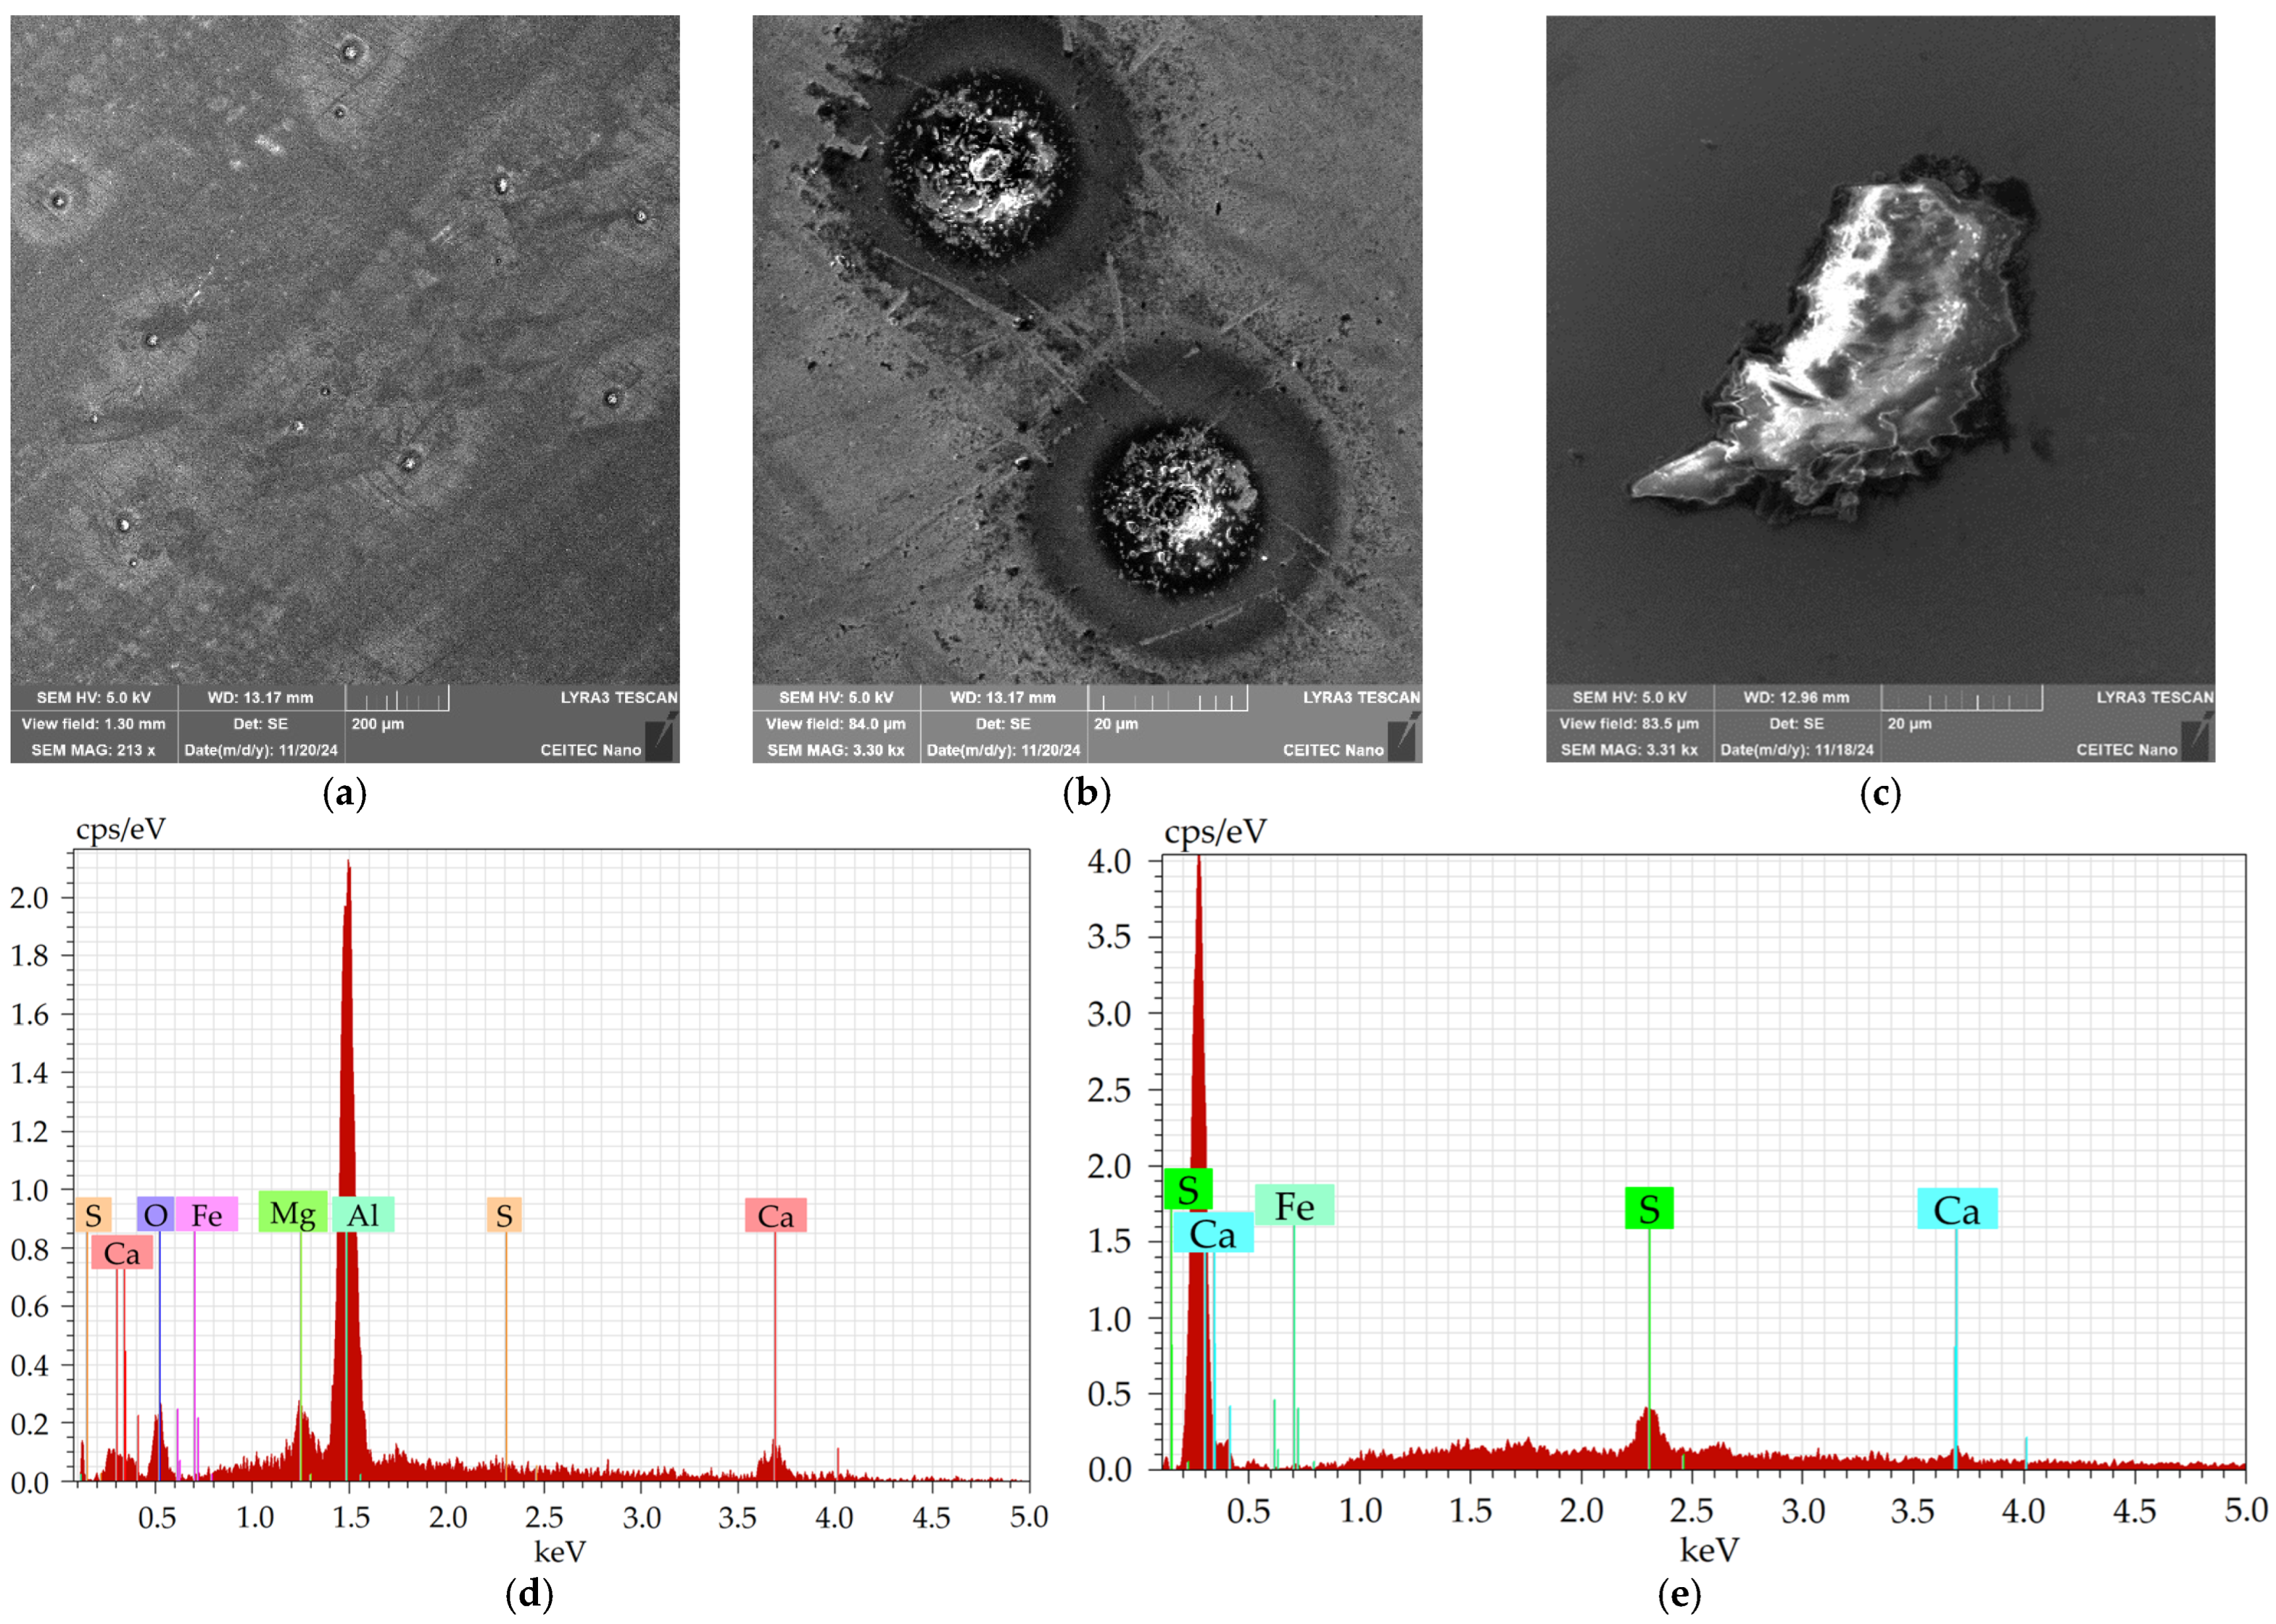
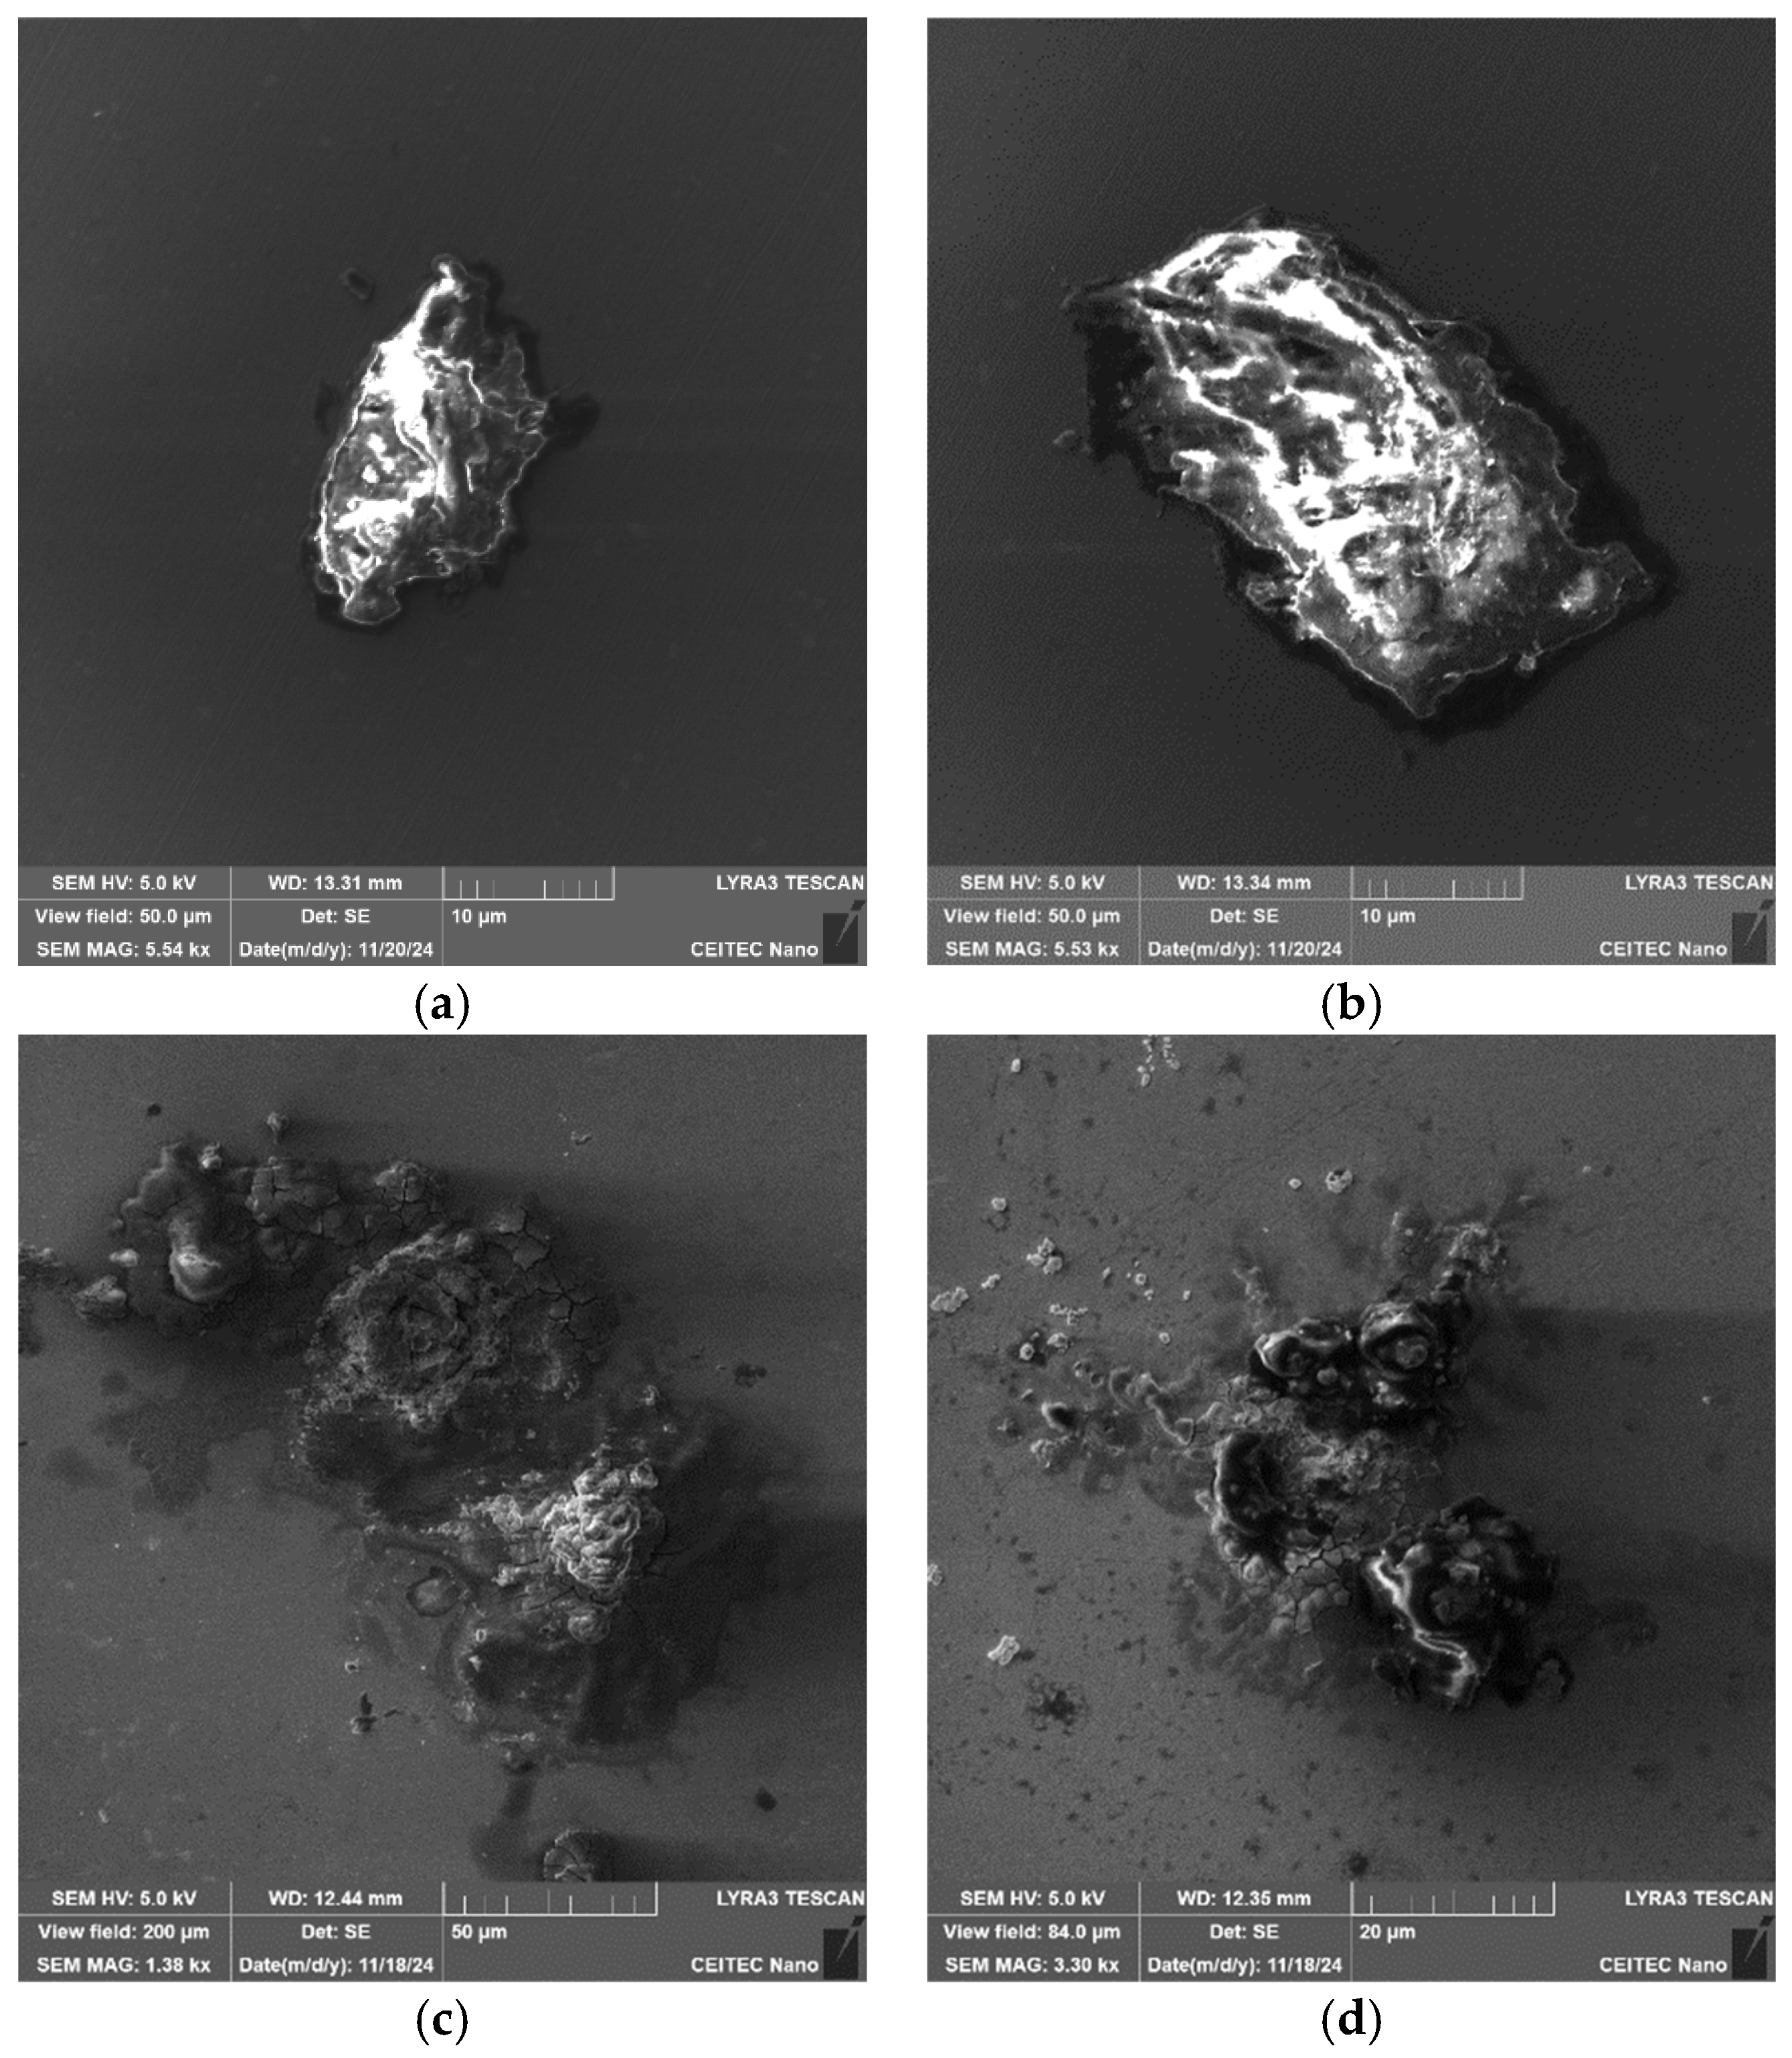
Figure 5a shows an SEM-SE image depicting examples of the coarsest inclusions present within the 601 sample. The inclusions were of two types, a more or less spherical Al
2O
3-MgO type (depicted in greater detail in
Figure 5b), and a sharp-edged CaS type (depicted in greater detail in
Figure 5c). Typical chemical compositions of the inclusions are depicted in
Table 1 (spherical inclusions) and
Table 2 (sharp-edged inclusions), as well as in the EDX graphs in
Figure 5d (spherical inclusions) and
Figure 5e (sharp-edged inclusions); note that the presence of Fe was detected from the surroundings.
Table 3 then shows the size distribution of the spherical inclusions, whereas
Table 4 depicts the size distribution of the sharp-edged inclusions. As documented by the tables, the majority of the Al
2O
3-MgO-type inclusions had the diameters around 20 µm, and the average size of such a spherical inclusion was 20.7 µm. On the other hand, the majority of the sharp-edged CaS-type inclusions had diameters between 20 and 50 µm, and the average size of such an inclusion was 41.9 µm.
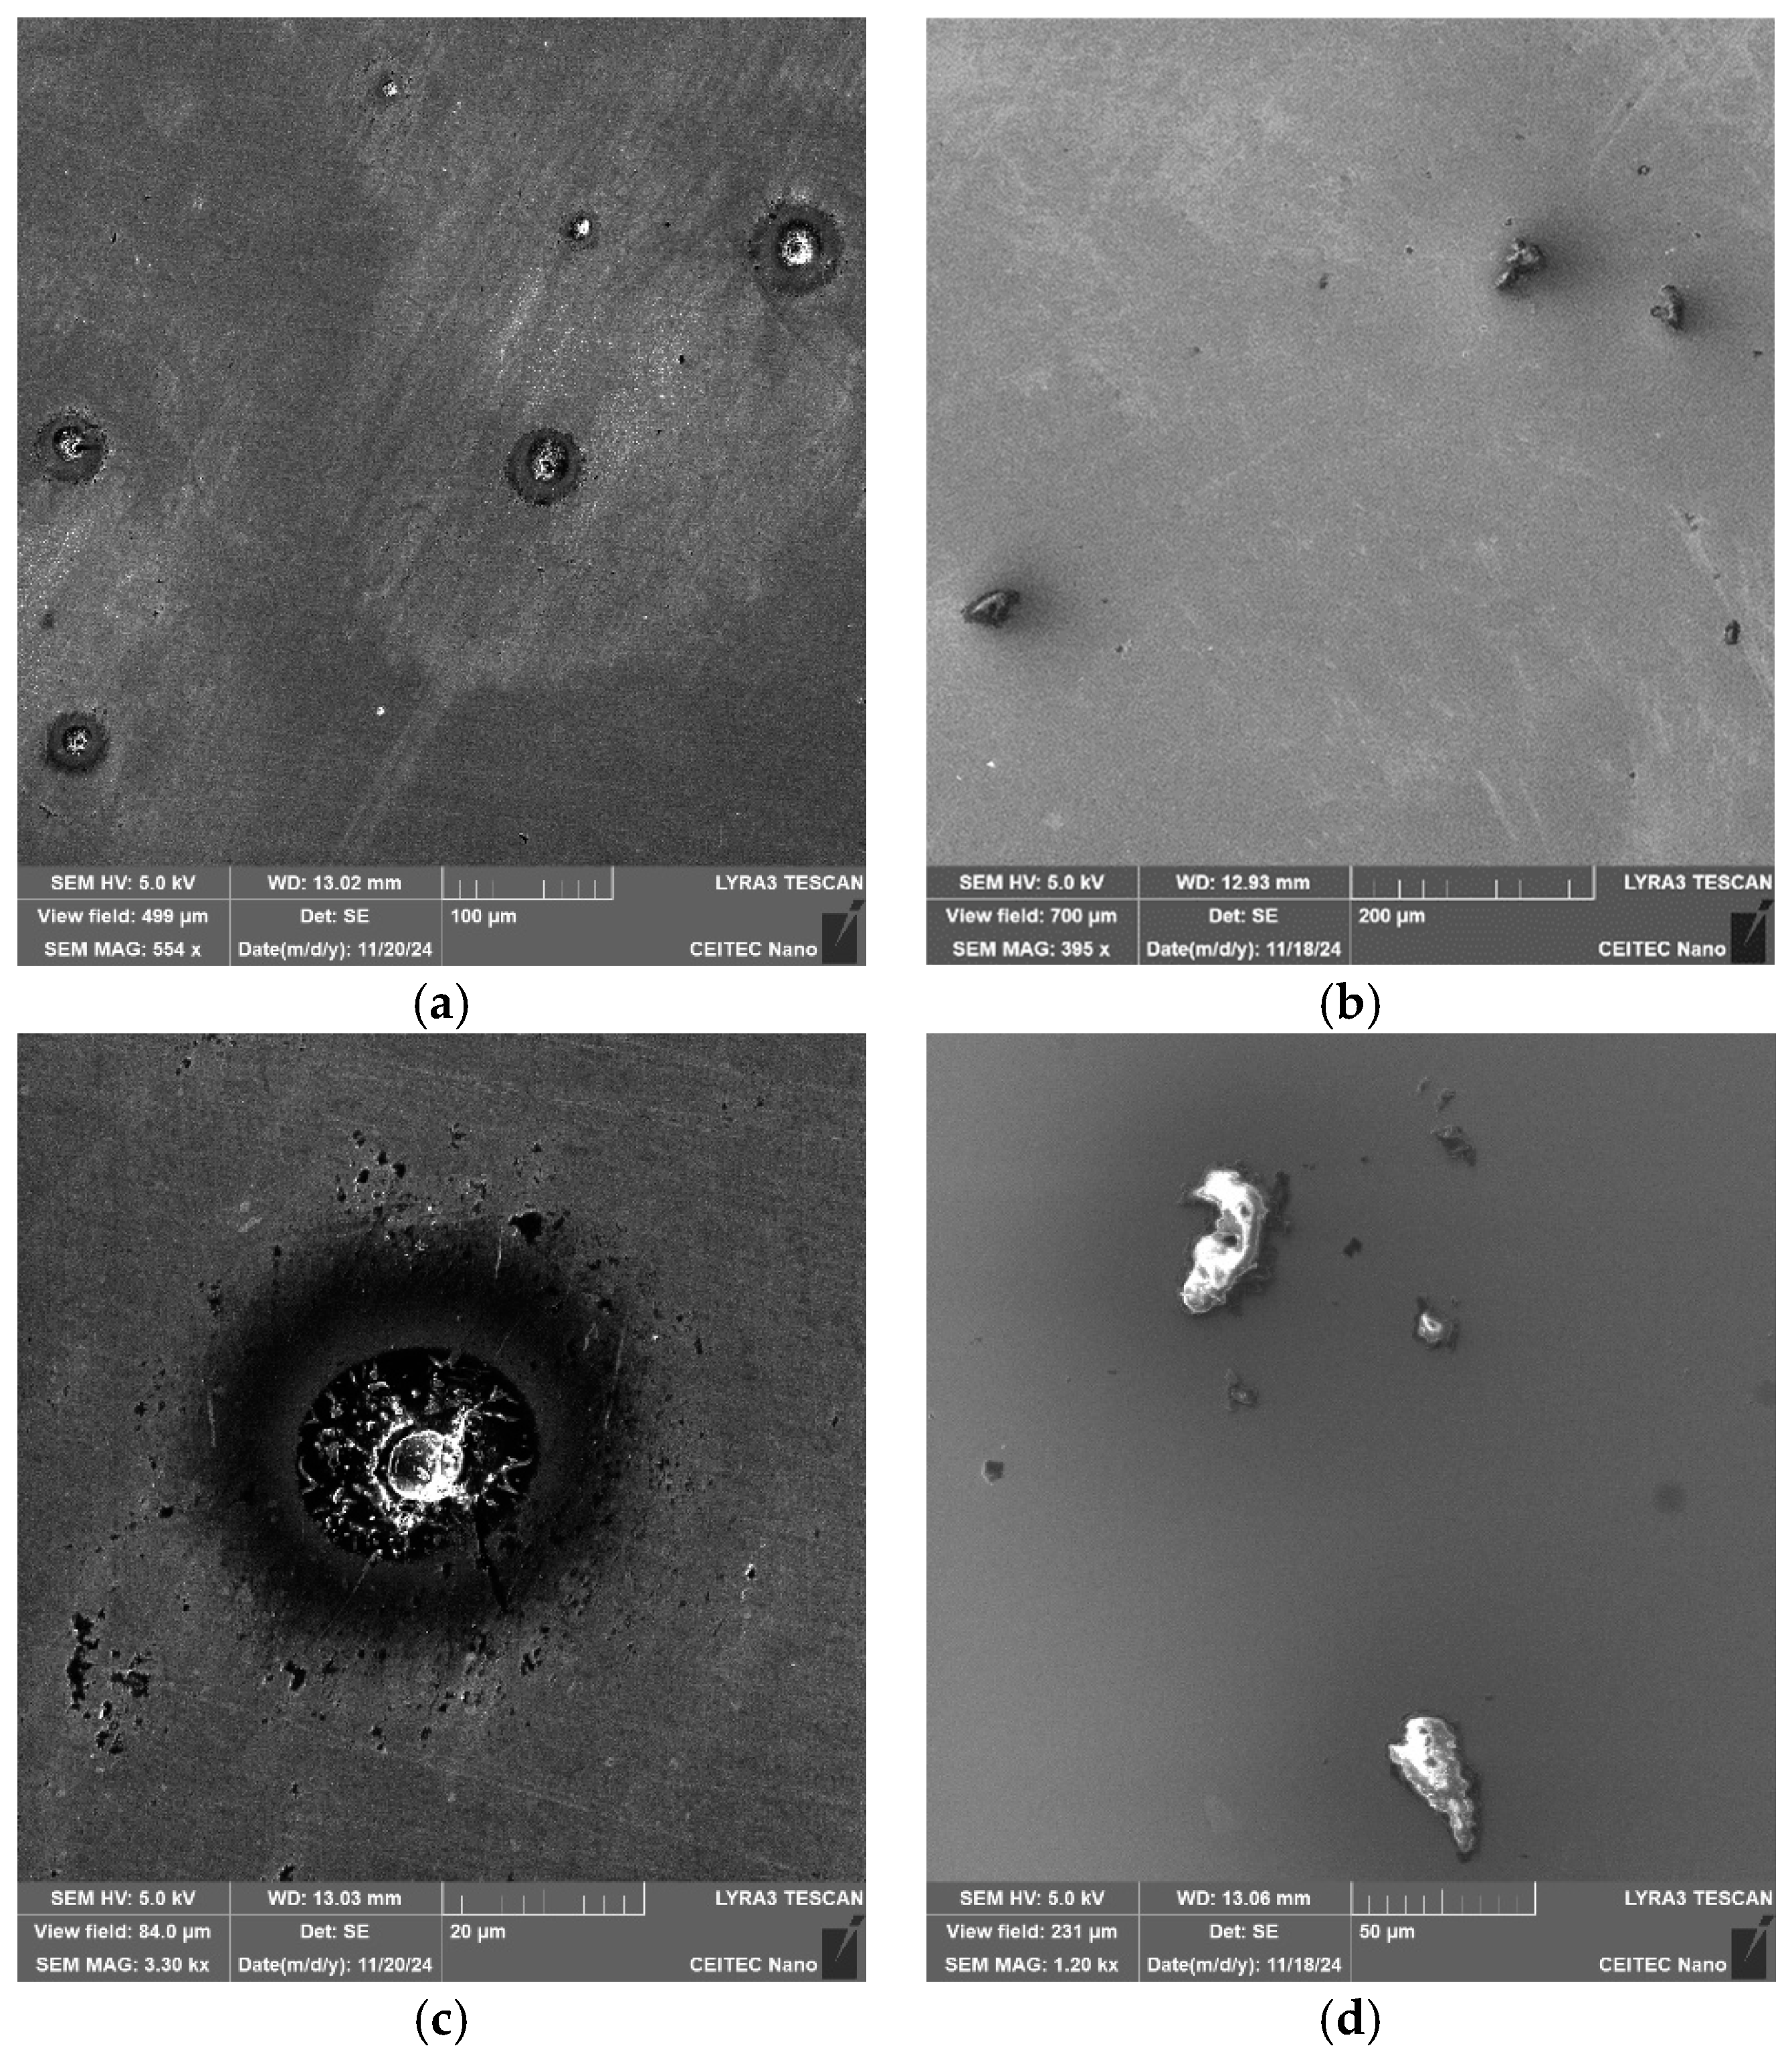
Figure 6a,b show SEM-SE images of the coarsest inclusions present within the 602 sample. Similarly to the 601 sample, the inclusions within the 602 one, were of the Al
2O
3-MgO and CaS types.
Figure 6c,d show detailed SEM-SE images of the Al
2O
3-MgO- and CaS-type inclusions, respectively. As can be seen from the figures, the Al
2O
3-MgO-type inclusions were of more or less spherical shapes, while the CaS inclusions were sharp-edged, similar to the 601 sample.
Table 5 shows the size distribution of the spherical inclusions, while
Table 6 depicts the size distribution of the sharp-edged inclusions. The data in the tables reveals that the average size of the precipitates within the 602 sample was slightly smaller than within the 601 one, especially with regards to the CaS-type inclusions. The average size of the spherical inclusions was 19.2 µm, which is comparable to the average size of such inclusions within the 601 sample. On the other hand, the average size of the sharp-edged inclusions was 32.3 µm, which is almost by 25% smaller than for the 601 sample.
Among the two typical types of inclusions, the 602 sample also featured crust-like inclusions.
Figure 7 shows a detailed map of chemical composition of a crust-like inclusion present within the 602 sample. As can be seen, such an inclusion primarily consisted of Ca, other elements (Mg, Al) were present, but with negligible contrasts. These were CaS and CaS-CaO inclusions.
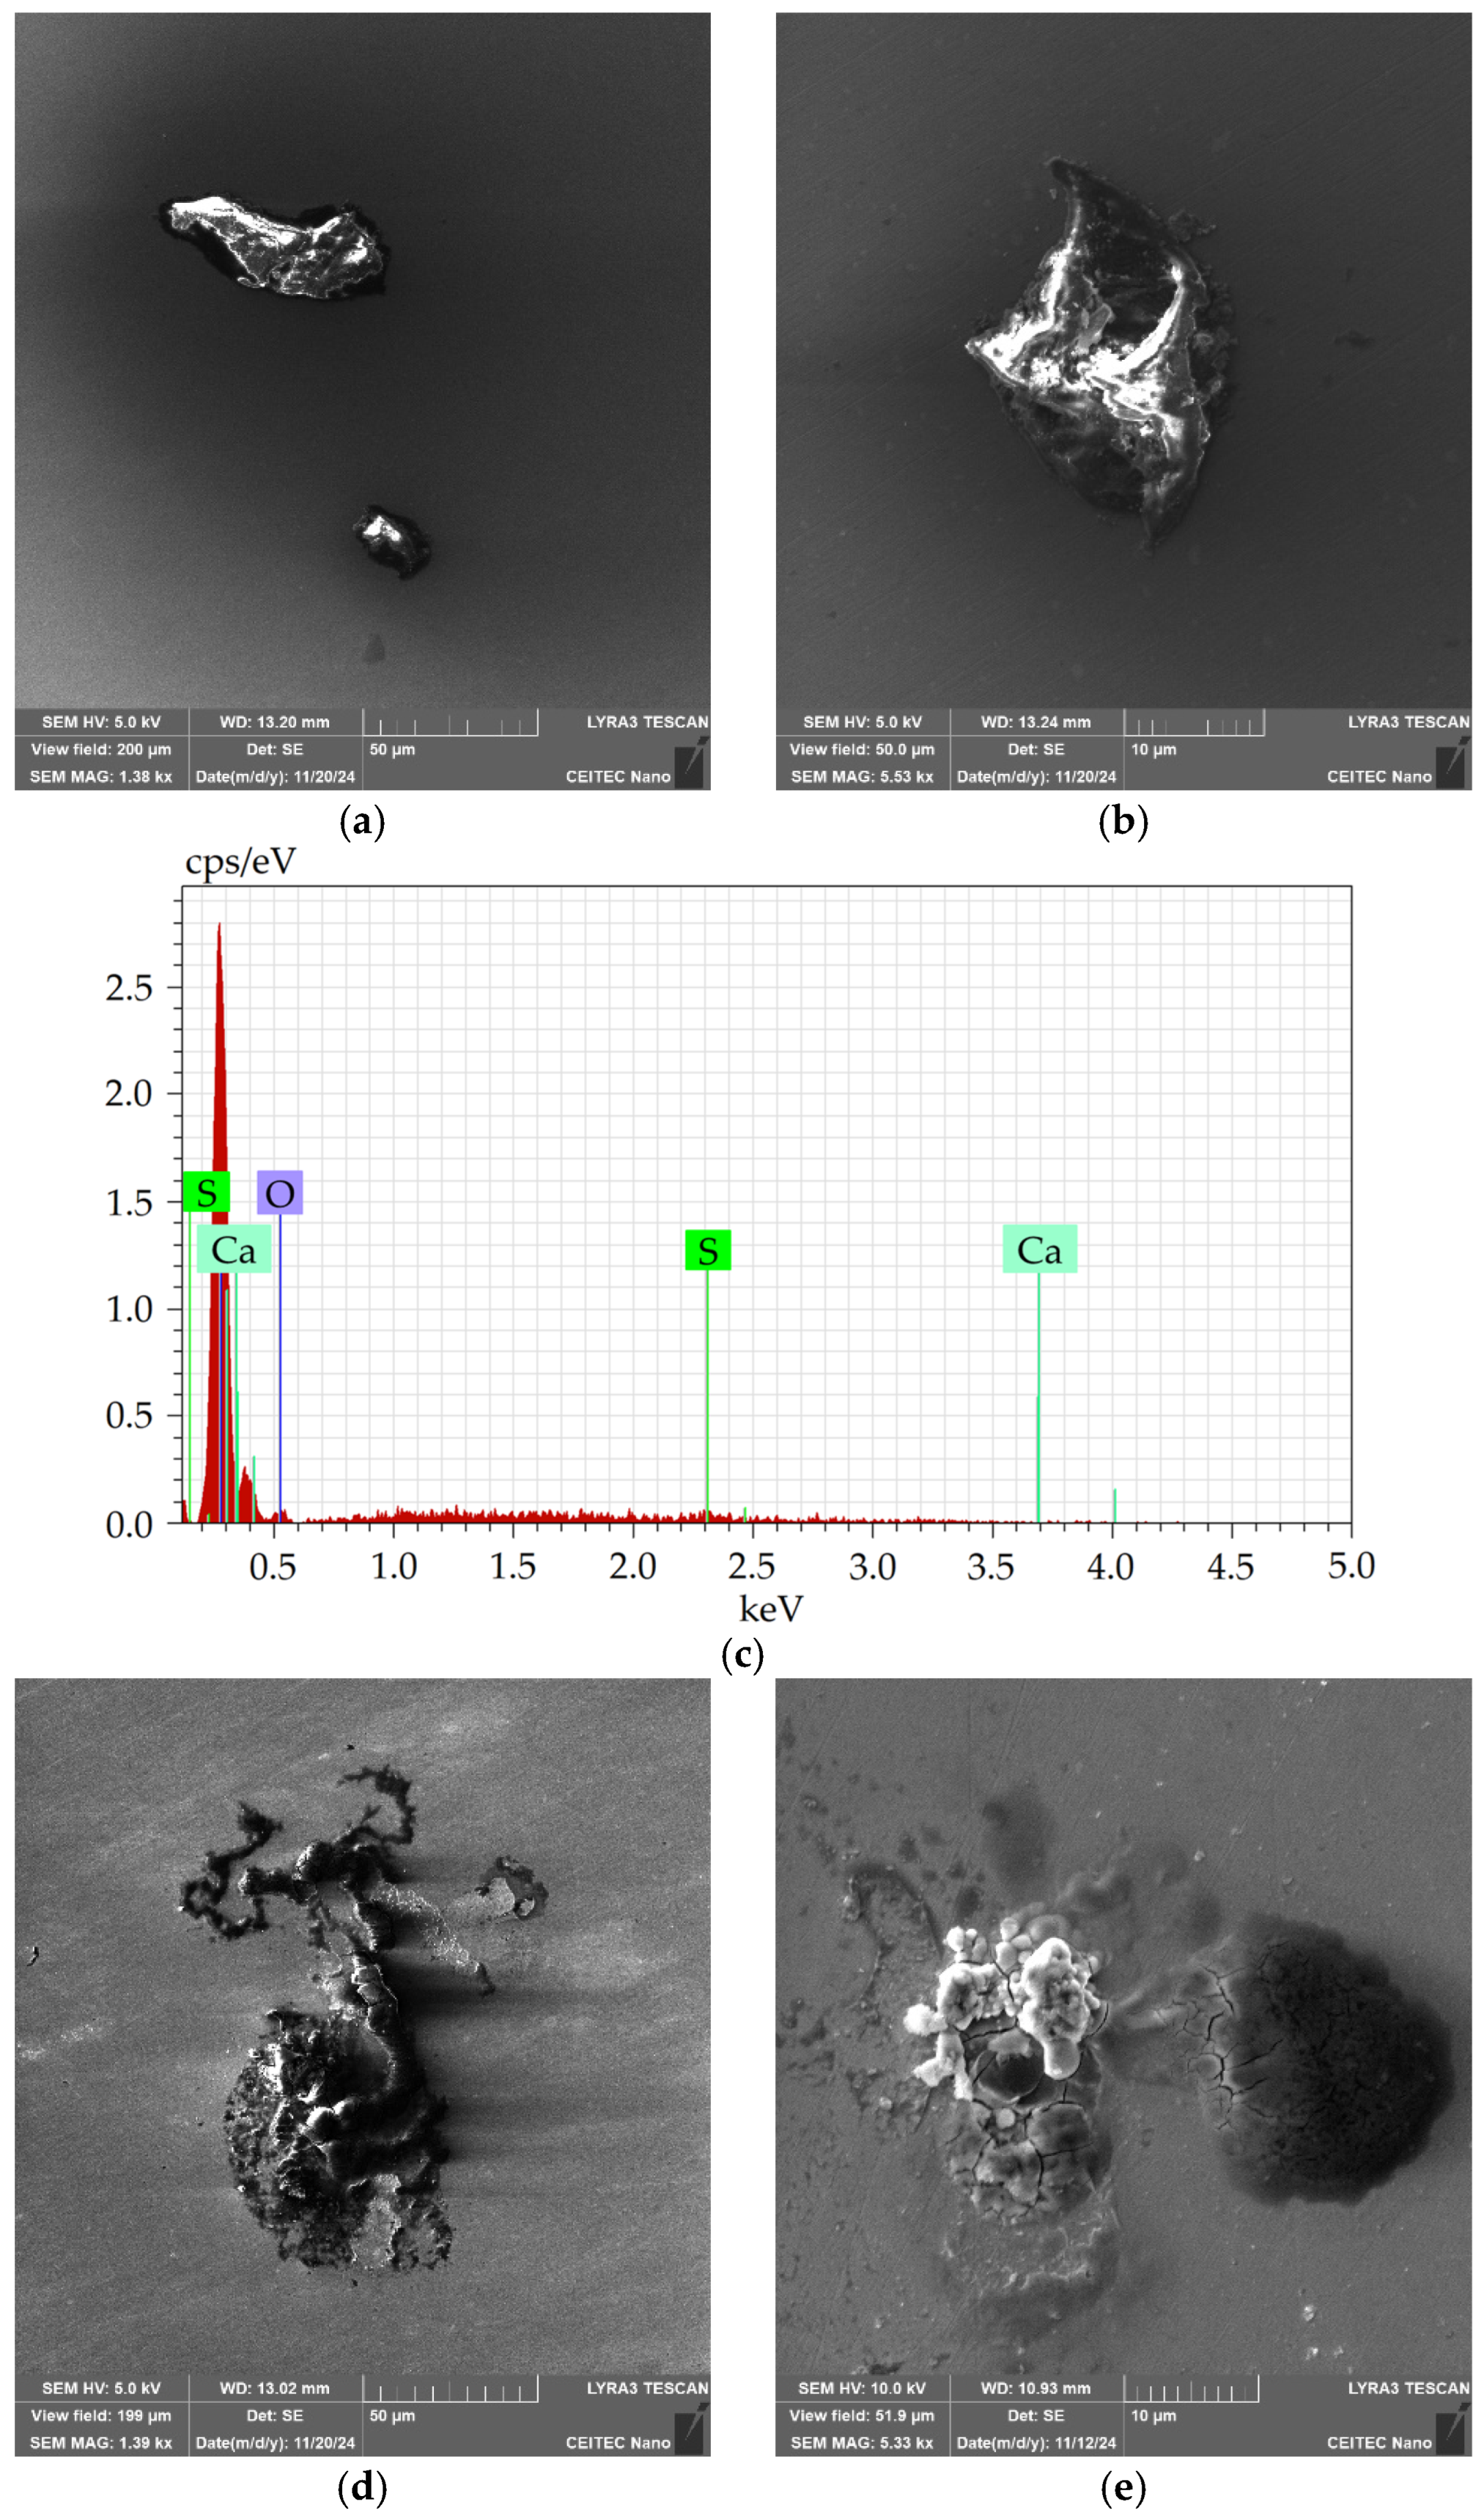
The 276 sample also featured the presence of coarse sharp-edged inclusions, see
Figure 8a,b. However, this sample did not exhibit any notable presence of the spherical Al
2O
3-MgO-type inclusions. The coarse inclusions were of the CaS type, see the EDX graph in
Figure 8c showing a typical chemical composition of such an inclusion within the 276 sample. Among the sharp-edged inclusions, the 276 sample also exhibited crust-like ones, which points to a certain similarity with the 602 sample. However, the inclusion within the 276 sample were of a slightly different nature, see
Figure 8d,e (and compare to
Figure 7).
Table 7 then depicts the size distribution of the sharp-edged CaS-type inclusions. The size distribution evidently featured greater variations than that observed for the 601 and 602 samples, although the average inclusion size was comparable to that acquired for the 601 sample). The 276 sample featured a mixture of finer and very coarse inclusions, with the average size of 42.6 µm.
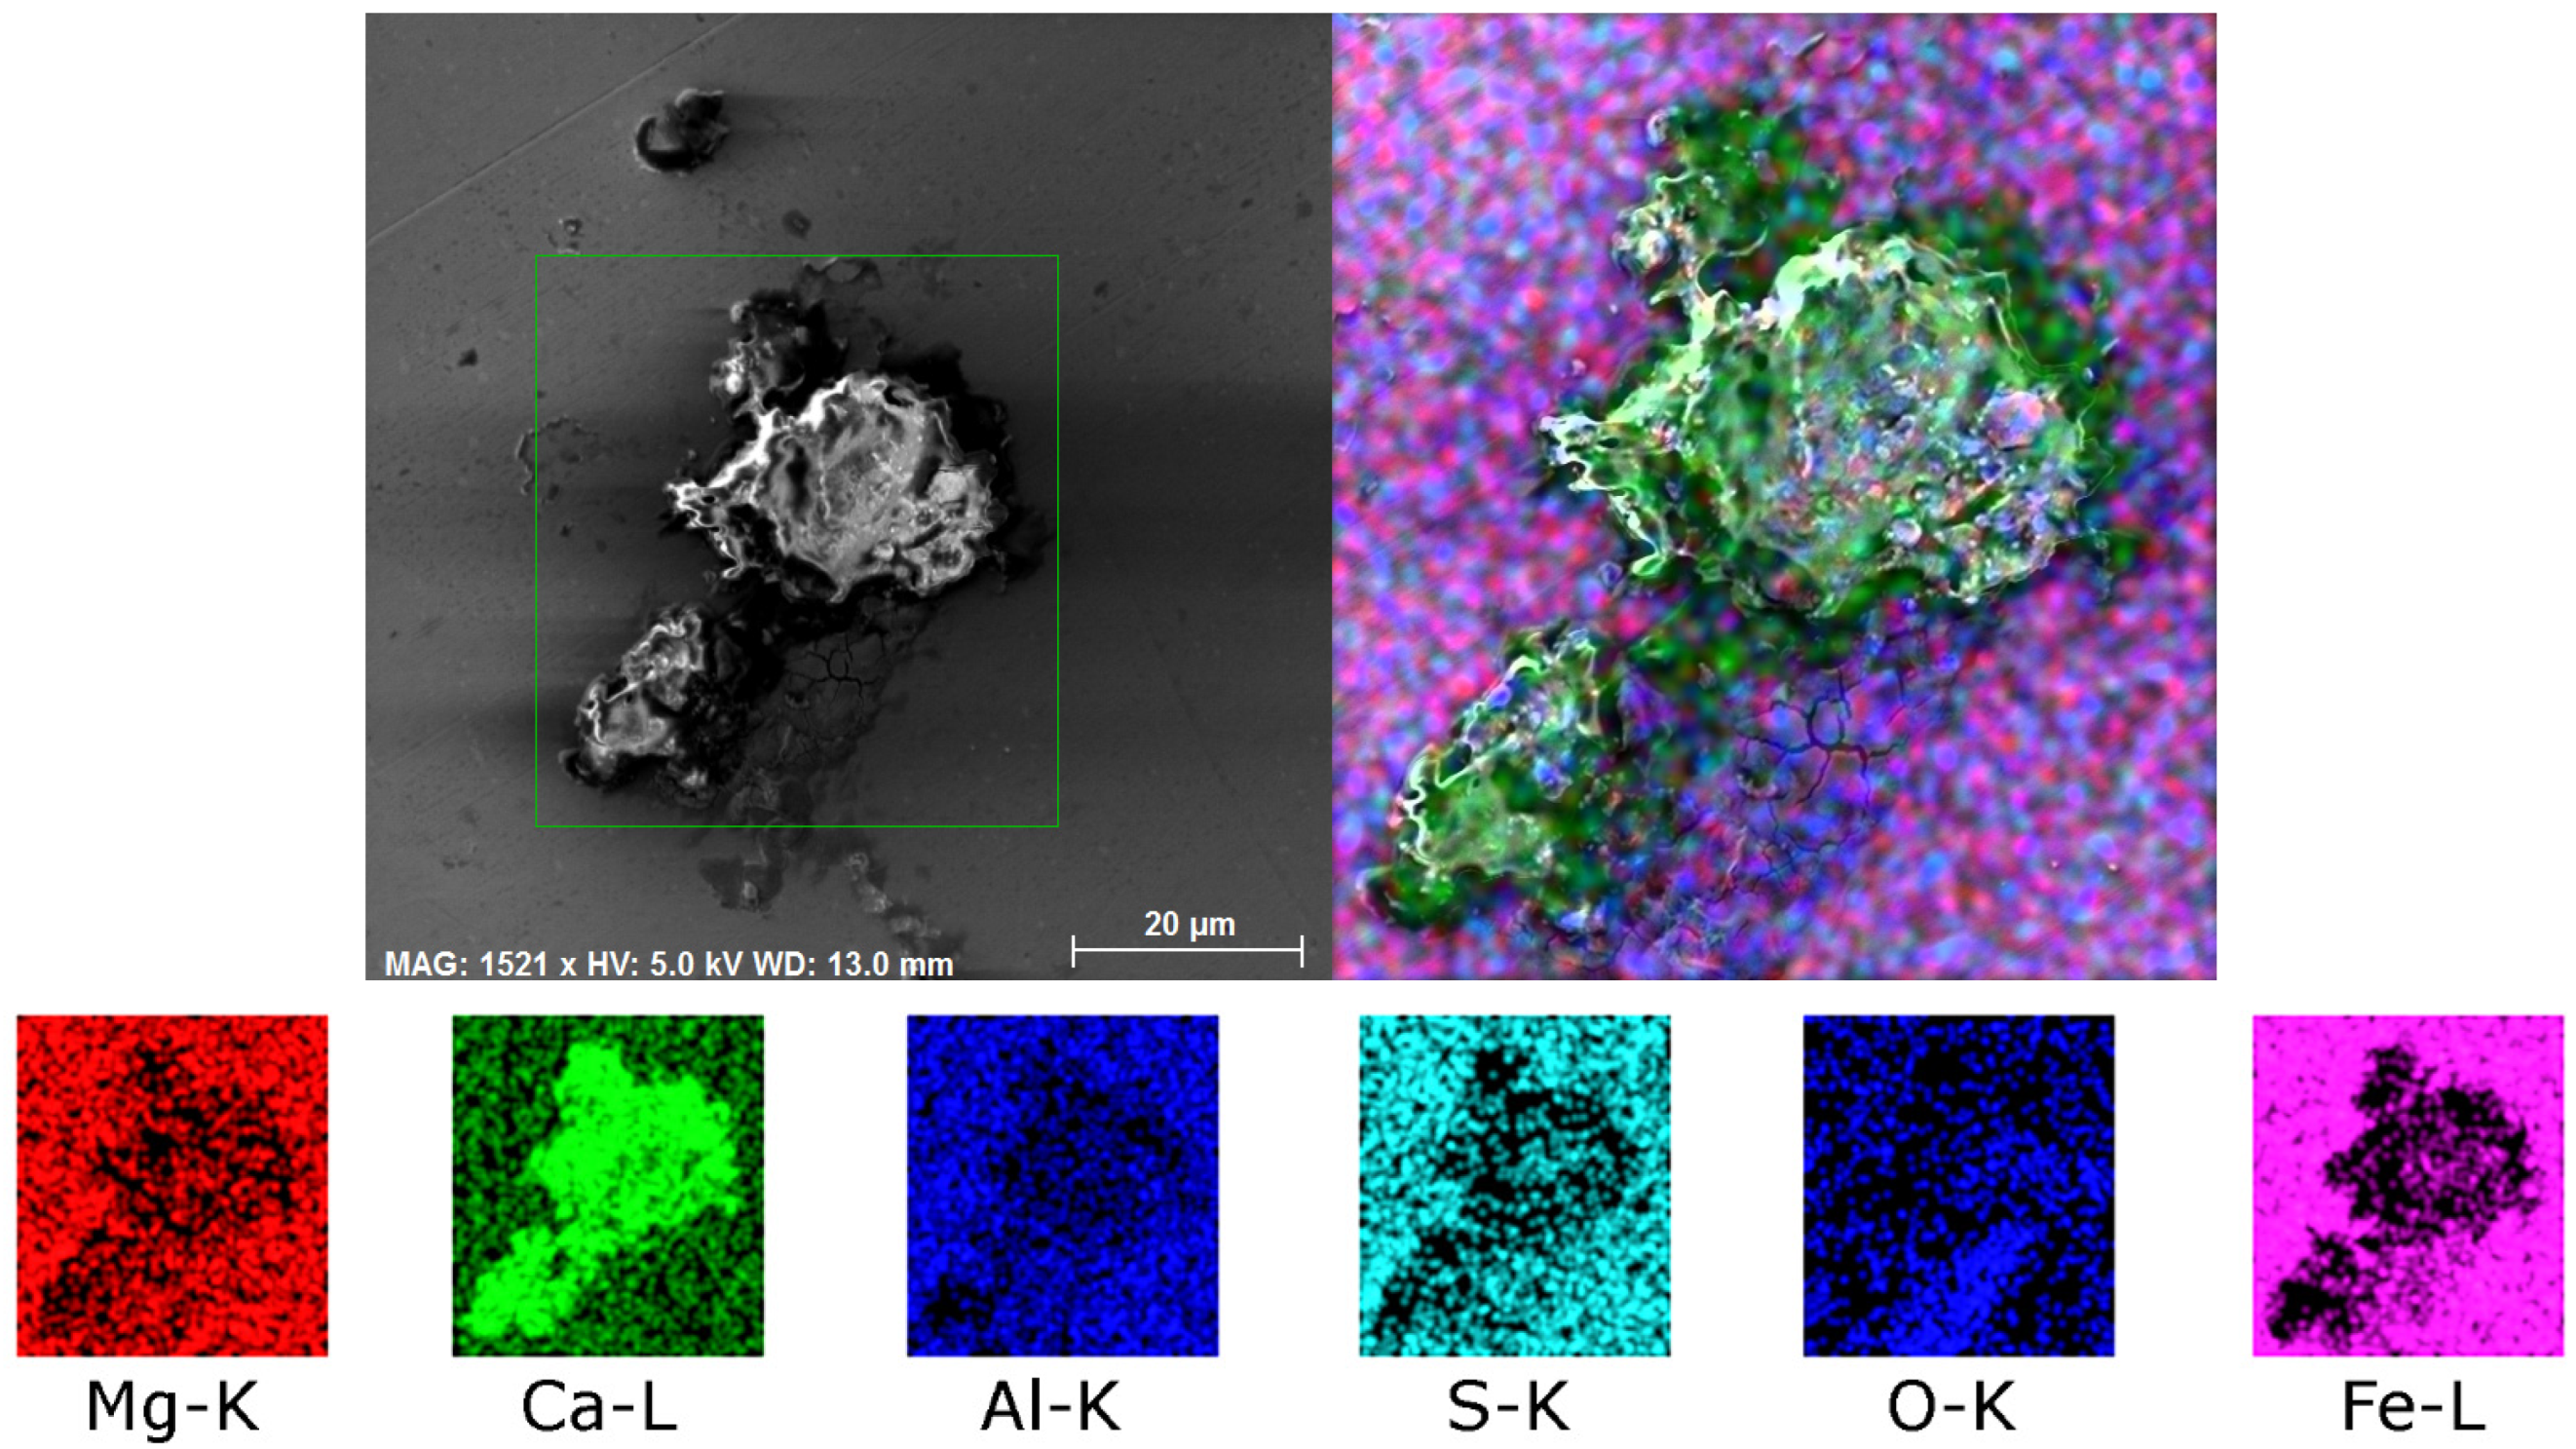
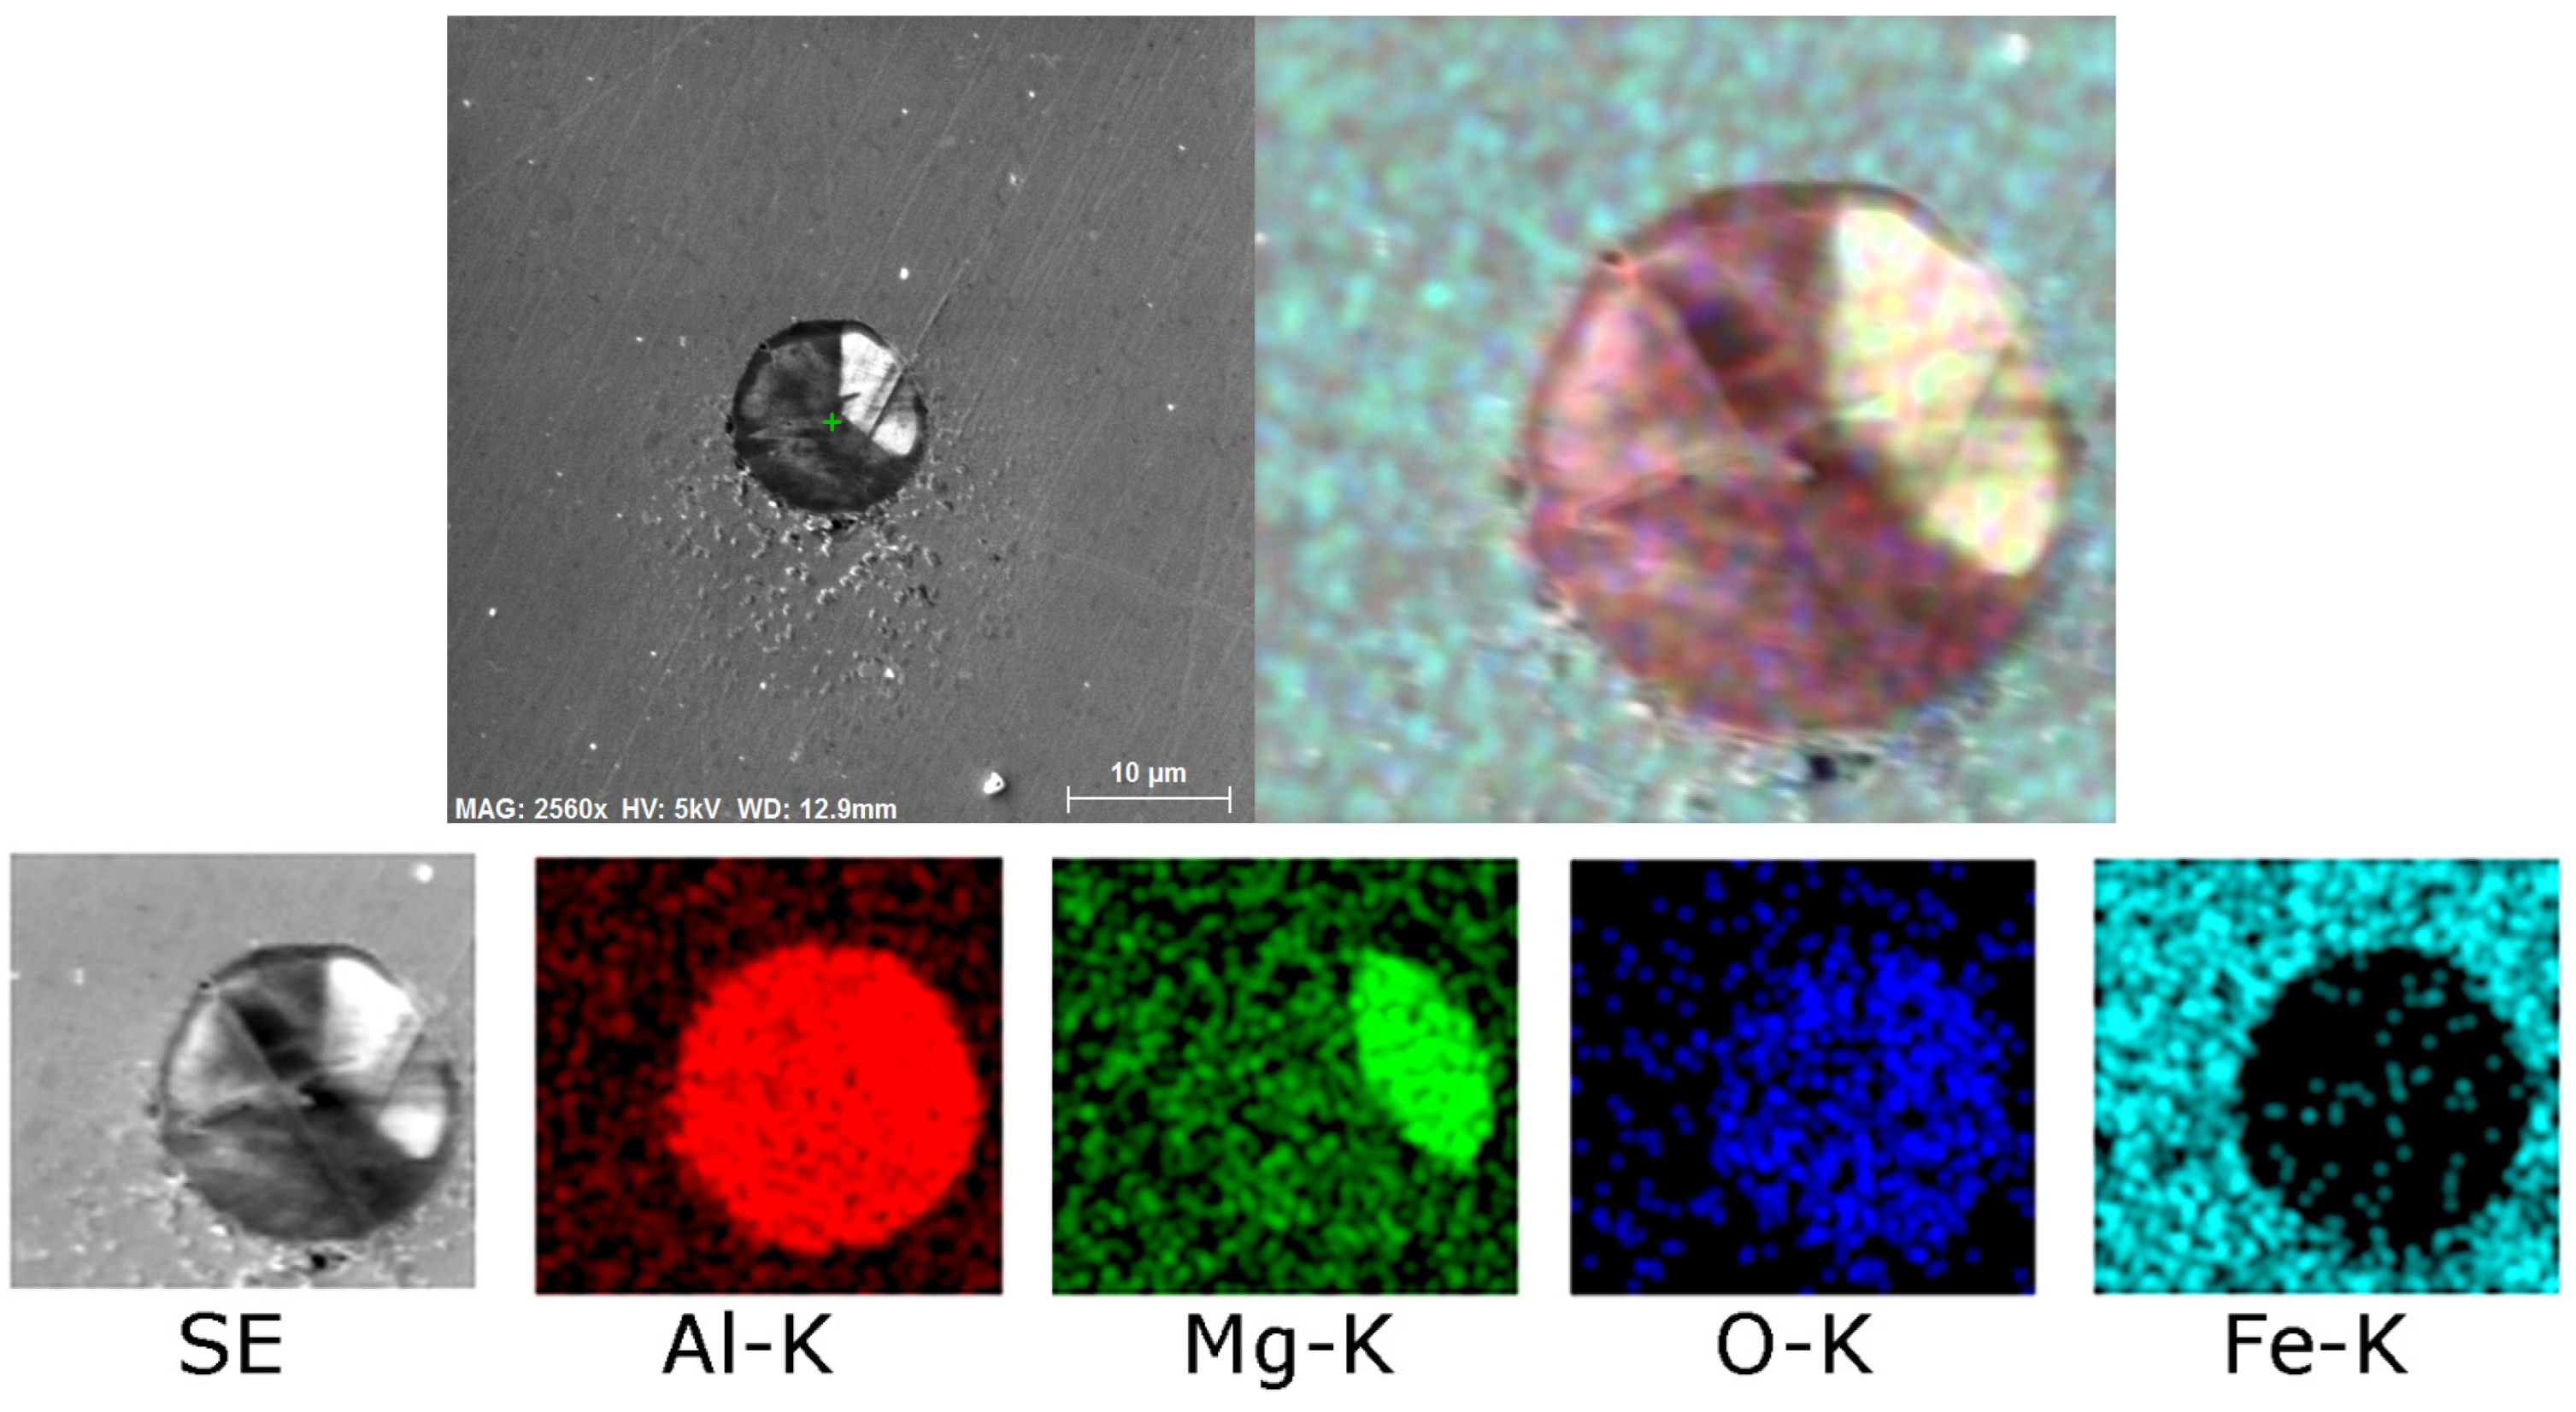
Figure 9 depicts detailed maps depicting the chemical composition of a crust-like inclusion present within the 276 sample (see
Figure 8e). As can be seen, such an inclusion consisted of a mixture of Ca, Mg, and Al (complex non-metallic inclusions of Al
2O
3-MgO-CaO) oxides; the crust-like precipitates also typically featured the presence of Al and Mg oxides (complex non-metallic inclusions of Al
2O
3-MgO), as clearly seen in the maps in
Figure 9. The crust featured an increase in the presence of S, too.
Last but not least, the analysis performed for the 277 sample revealed that this sample exhibited the presence of coarse sharp-edged CaS inclusions, similar to the other examined samples (see
Figure 10a,b). However, compared to the other samples, the presence of such inclusions was scarce; the majority of the inclusions present within the 277 sample were the crust-like ones, as seen in
Figure 10c,d.
Table 8 depicts the size distribution of the (scarcely present) sharp-edged inclusions. As can be seen, the size variation featured a lower range when compared to the 276 sample. Also, the average size of an inclusion was smaller within the 277 sample than within the 276 one. Nevertheless, the average size was comparable to that calculated for the 602 sample. An intriguing fact is that the average size of a CaS-type inclusion was comparable for samples 601 and 276, and 602 and 276.
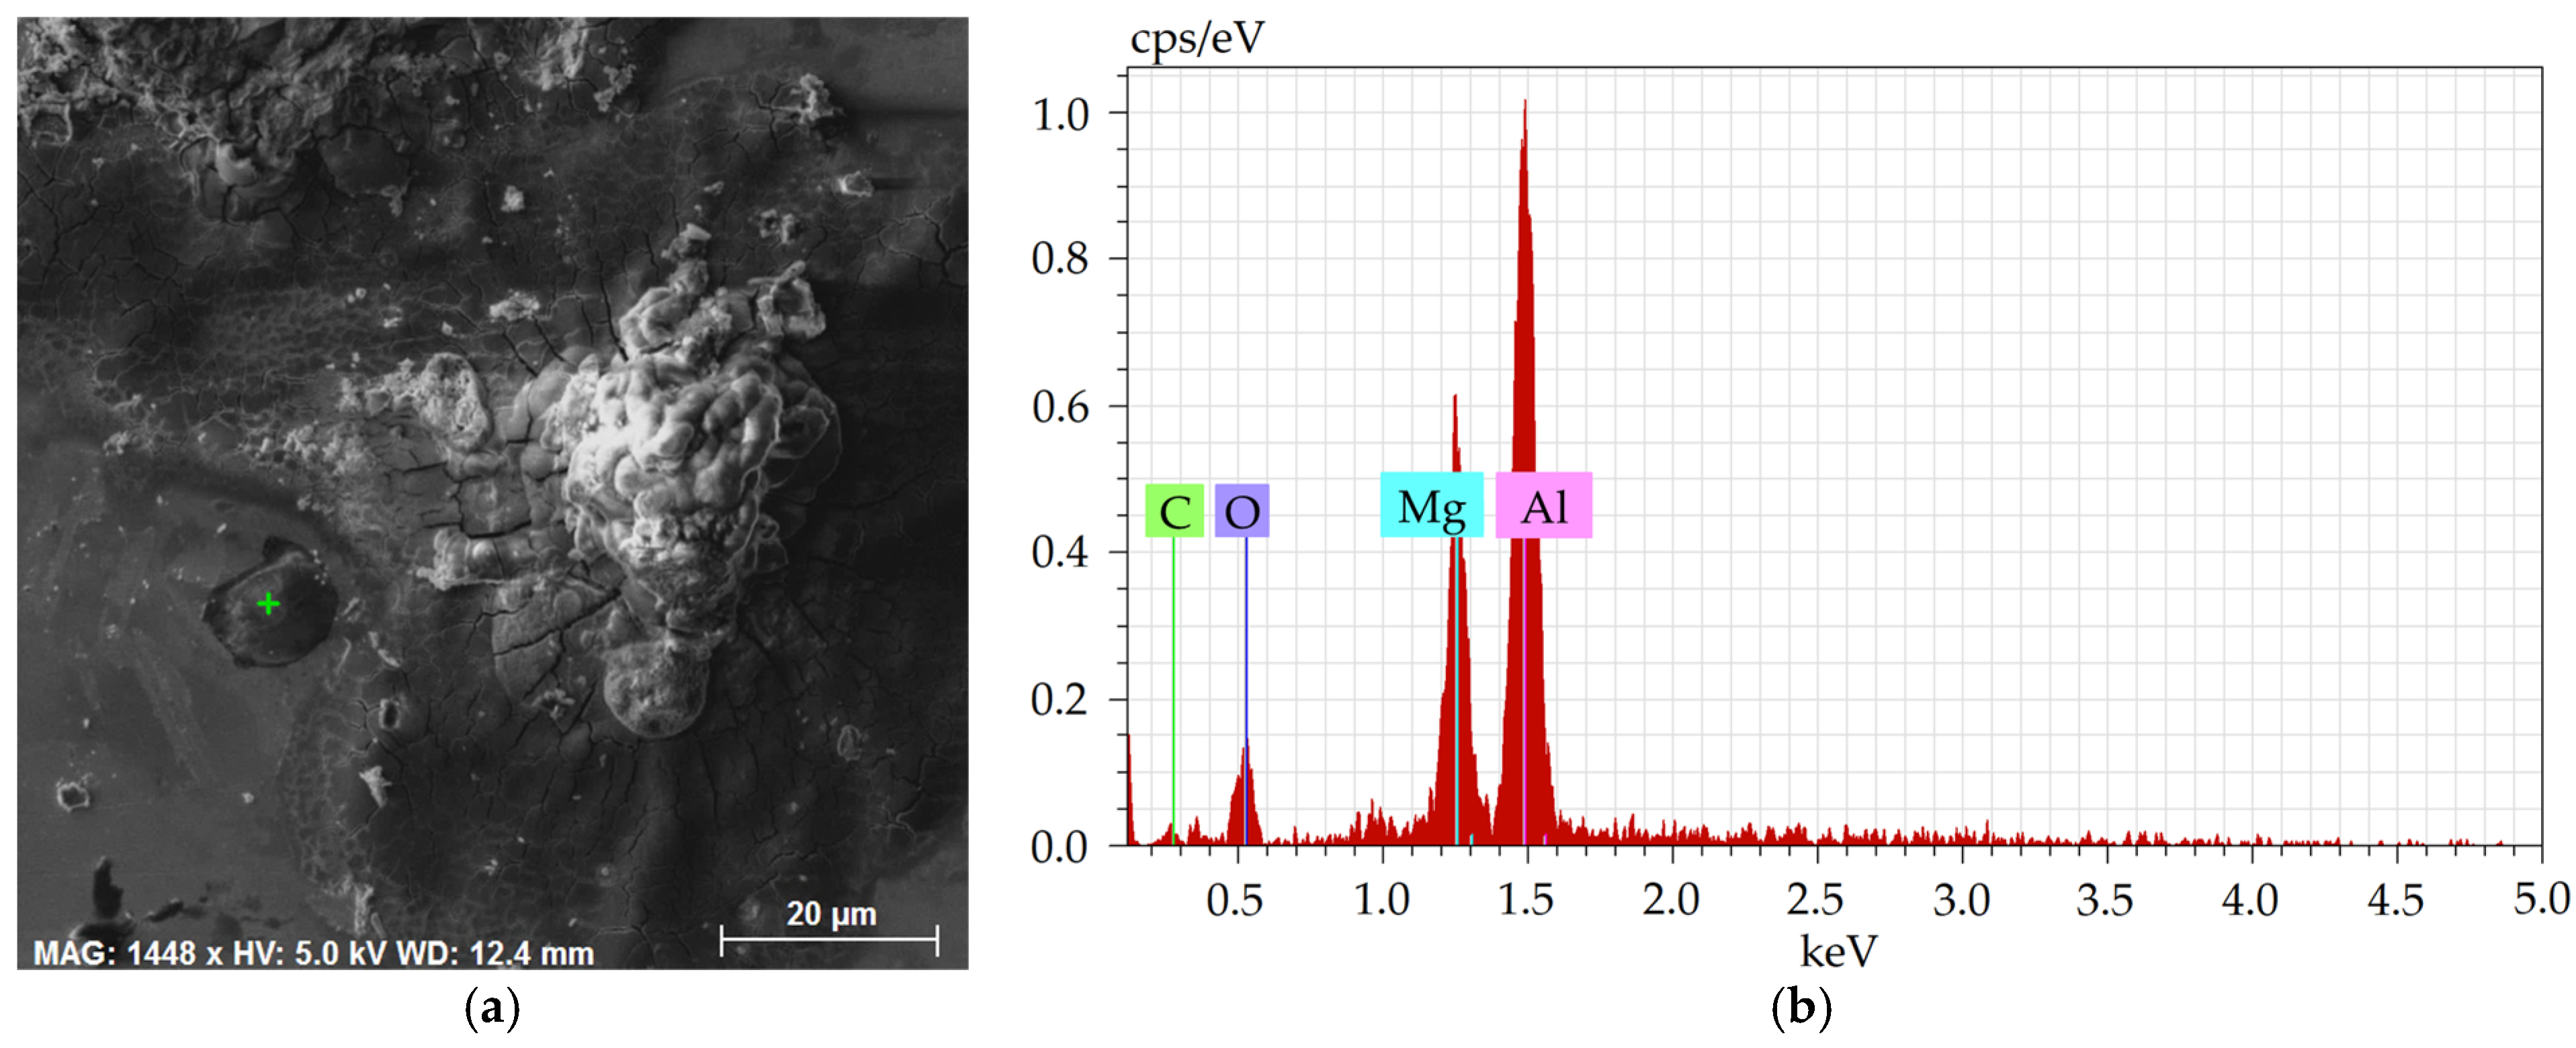
Detailed depiction of the presence of non-formable oxidic inclusions, occurring typically as a part of the crust-like inclusions, is shown in
Figure 11a, depicting a detailed SEM-SE image of the oxide inclusion with marked location of analysis of chemical composition, the results of which are then shown in
Figure 11b.
Figure 12 then shows detailed maps of chemical composition of an oxidic inclusion present within the 277 sample. As can be seen, similar to the 276 sample, the chemical composition of such an inclusion was a mixture of oxides of Ca, Mg, and Al (complex non-metallic inclusions of Al
2O
3-MgO-CaO), the crust featured an increased presence of S, as well as the presence of Al and Mg oxides (complex non-metallic inclusions of Al
2O
3-MgO), as clearly seen in the maps in
Figure 12. Finally,
Table 9 depicts a typical chemical composition of such an oxidic inclusion.
Overall, all the examined samples exhibited the presence of Al2O3-MgO-type spherical inclusions and CaS-type sharp-edged inclusions. The average size of the sharp-edged CaS-type inclusions was larger for the 601 sample than for the 602 one, and for the 276 sample than for the 277 one. Nevertheless, the average size of the CaS inclusions within the 601 sample was comparable to that acquired for the 276 sample, and the average size acquired for the 602 sample was comparable to that acquired for the 277 one. Moreover, among the CaS-type inclusions, the 601 and 602 samples featured a frequent presence of spherical Al2O3-MgO-type inclusions, contrary to the 276 and 277 samples, which featured crust-like inclusions with a local presence of coarse Al2O3-MgO inclusions. The occurrence of the Al2O3-MgO-type inclusions was thus more frequent within the 601 and 602 samples.
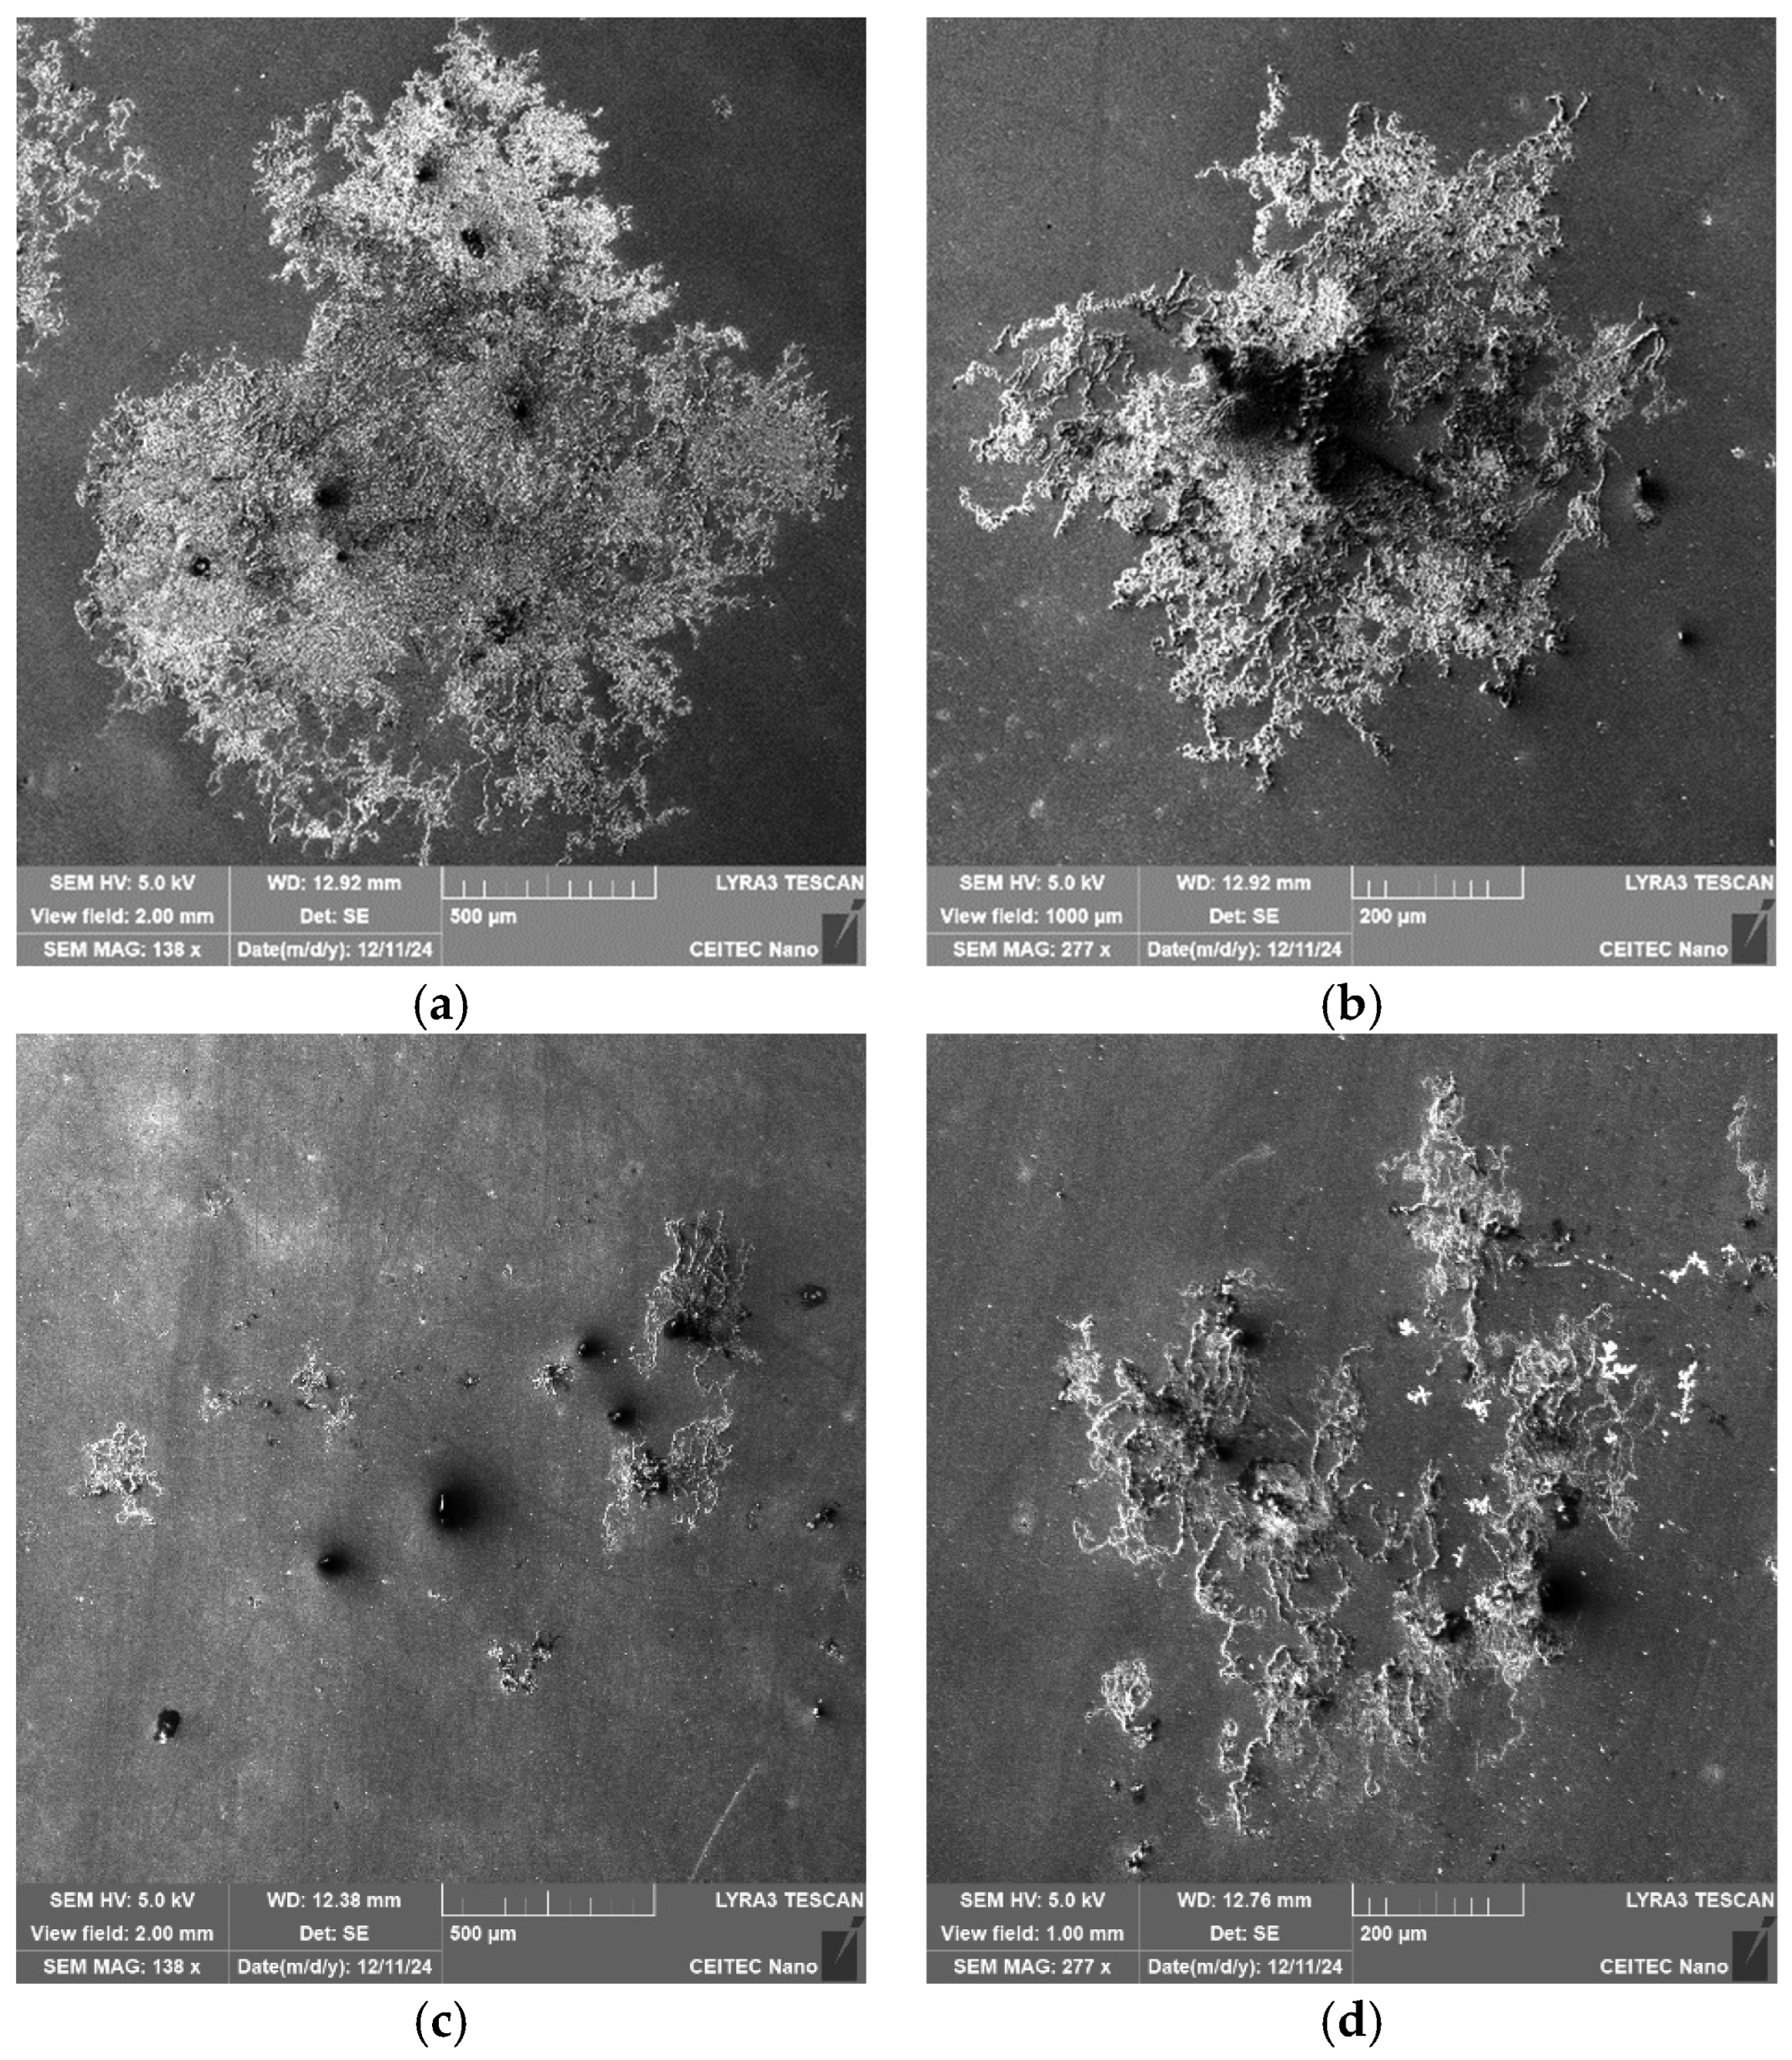
Another intriguing fact is that the 276 and 277 samples are also highly prone to atmospheric corrosion. After two months of exposure of the polished samples to the atmosphere, the 276 and 277 samples started to exhibit traces of localized corrosion (contrary to the 601 and 602 samples, which did not exhibit any corrosion during that time period).
Figure 13a,b show SEM-SE images depicting the corrosion products on the surface of the 276 sample, while
Figure 13c,d show SEM-SE images of the corrosion products on the surface of the 277 sample. The corrosion evidently started to nucleate around the inclusions and was more developed on the 276 sample than on the 277 one.
2.2. Verification of EDX Analysis Using Factsage
As regards the chemical composition of non-metallic inclusions in the tool steel, the amount of MgO-based non-metallic inclusions increased significantly after the ESR technology. The Equilib module of the FactSage software was used to verify the results acquired experimentally via the EDX analysis, i.e., to confirm/refute the hypothesis whether these inclusions occurred as a result of the concentration of MgO in the slag. The chemical composition of the tool steel and the chemical composition of the ESR slags were used to calculate changes in the chemical compositions of the non-metallic inclusions. As an example, the calculation of the modification of the non-metallic inclusions using the AKF 235 slag, which was characterized by a relatively high MgO content (3 wt. %), is further presented.
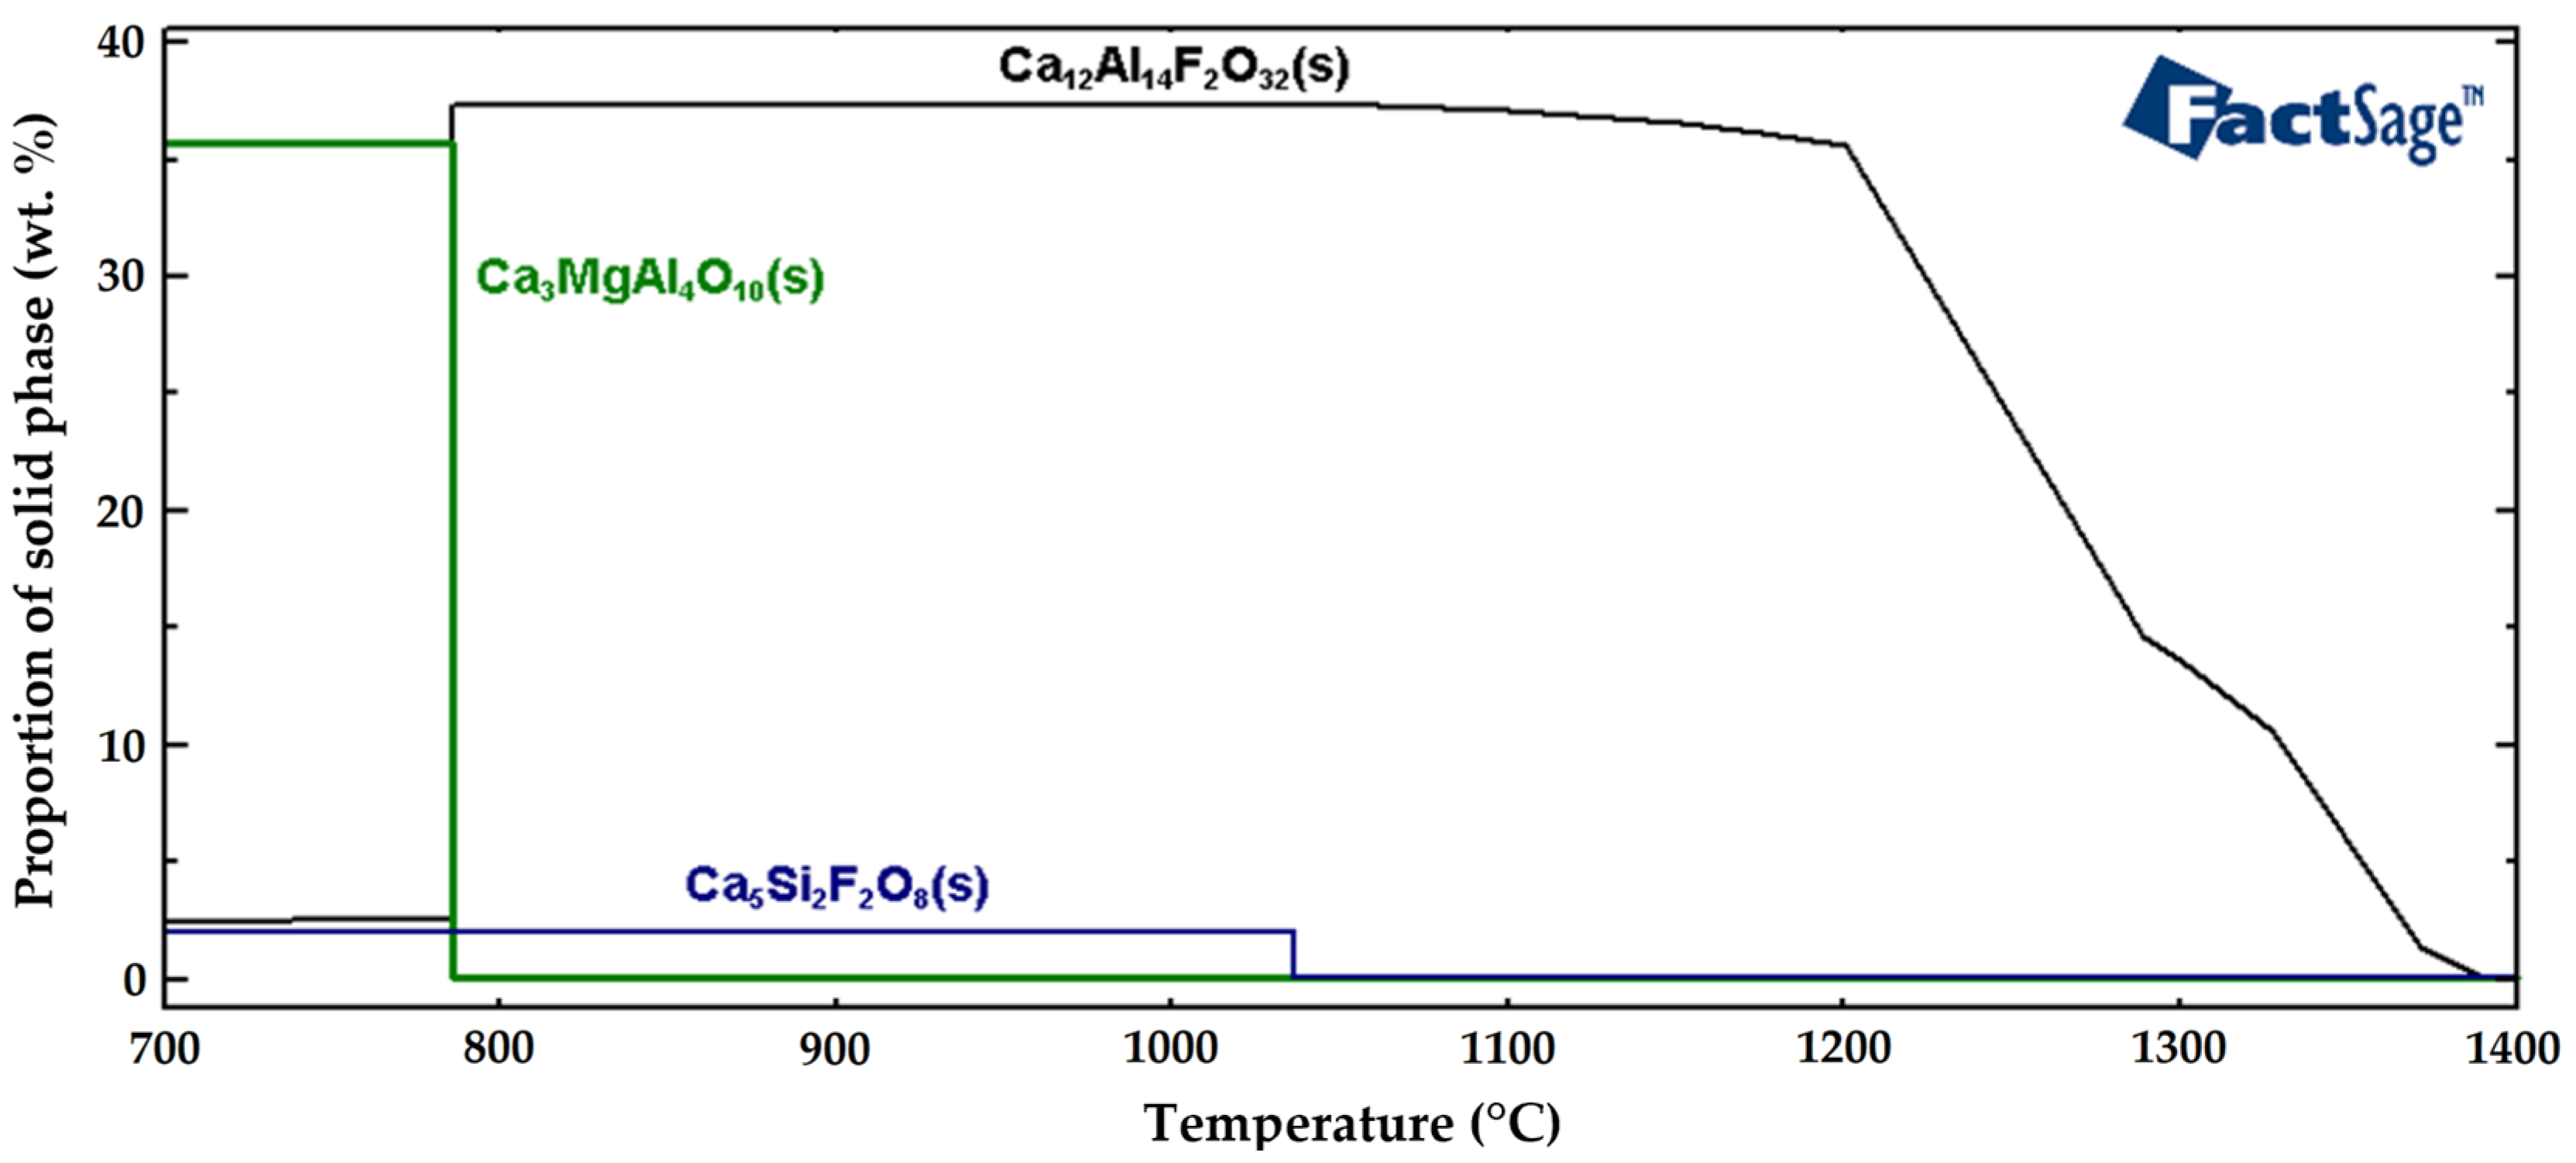
Figure 14 shows the resulting graphical representation of the solid non-metallic phases formed in the tool steel during solidification. The formation of the Ca
12Al
14F
2O
32(s) solid phase started at 1370 °C. The wt. % of the Ca
12Al
14F
2O
32(s) solid phase then decreased from 37 wt. % to 2.5 wt. % at the solidification temperature of 786 °C, and then remained constant when further cooled down to 20 °C. The formation of the Ca
5Si
2F
2O
8(s) solid phase started at 1036 °C and was constant throughout the entire range of examined temperatures, down to 20 °C, with the maximum solid phase fraction of 2 wt. %. The formation of the Ca
3MgA
4O
10(s) solid phase occurred at 786 °C. At this temperature, its concentration increased dramatically, to 36 wt. %. The results of changing of the chemical compositions of non-metallic inclusions calculated using the FactSage software confirmed that when MgO is present in the slag, the majority of the non-metallic inclusions in the tool steel consists of complex MgO-based inclusions. Calculations performed using the FactSage software also indicated the presence of Ca-based phases, which is also consistent with the EDX analyses of the examined samples. Especially in the cases of the 276 and 277 samples (remelted with the AKF 235 slag), the chemical compositions of the complex non-metallic inclusions showed mixtures of Ca, Mg, and Al oxides.
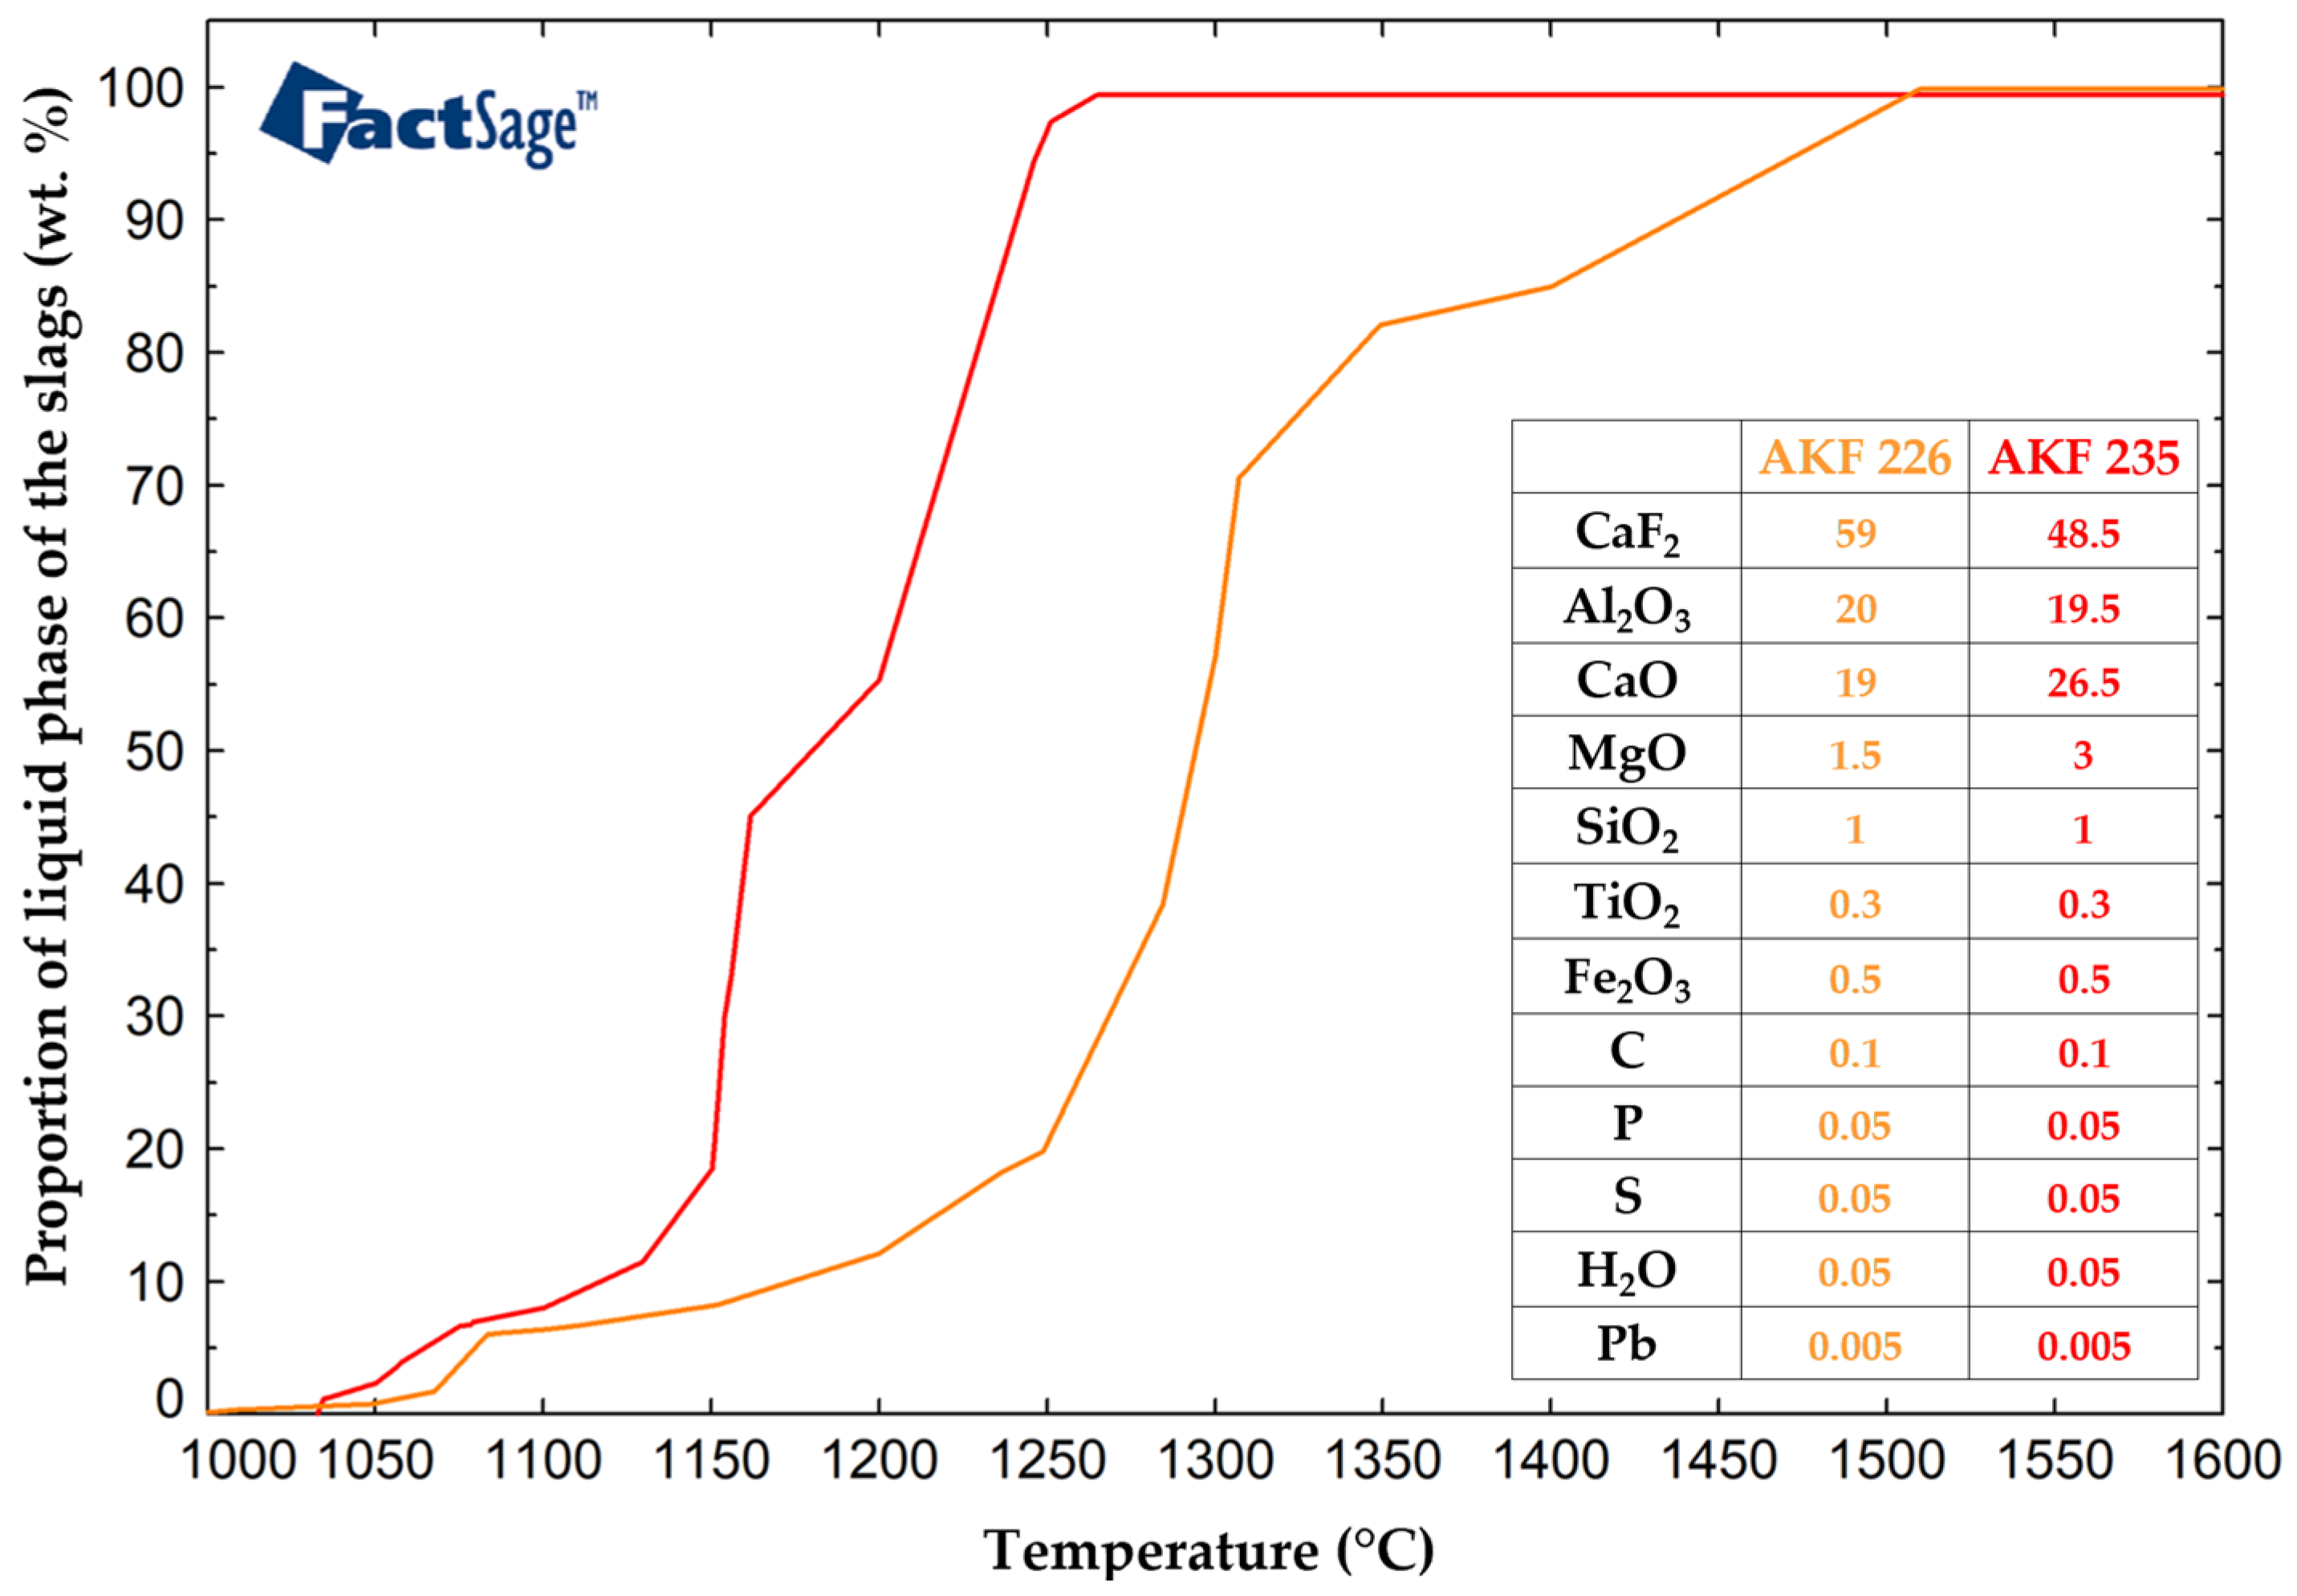
In addition to the characterization of non-metallic inclusions, other important parameters of the investigated slags (oxide systems) [
64,
65], which influence the removal of non-metallic inclusions and thus the purity of the remelted steel, were also calculated using FactSage. The ESR melting intervals of the slags were determined in the same Equilib module. Important parameters in the ESR process were the temperature of the liquid slag and the temperature interval between the solid and liquid phases. The slag melting interval calculations were performed in the temperature range of 1000 °C to 1450 °C, with a step of 100 °C, and the equilibrium was set as normal + transitions. For the AKF 226 slag, the calculated solid and liquid temperatures were 1049 °C and 1510 °C, while for the AKF 235 slag, the calculated solid and liquid temperatures were 1033 °C and 1261 °C, respectively. As can be seen, there was a significant difference between the solid and liquid temperatures of the AKF 226 slag, i.e., 461 °C, which was more than double the value acquired for the AKF 235 slag (228 °C). The results of the calculations performed using the FactSage software to determine the liquid phase fraction of the studied slags are in
Figure 15.
Last but not least, the dynamic viscosities of the slags as a function of temperature were calculated in the viscosity module of the FactSage software for all the components present in each slag. The calculations were performed in the working conditions range of the ESR slags, i.e., in the interval of 1750–1800 °C.
Table 10 shows the calculated dynamic viscosity values. From the calculated values, it can be seen that the value of the dynamic viscosity decreased with increasing temperature for both the studied slags. At the same time, the dynamic viscosity of the AKF 226 slag decreased compared to the AKF 235 slag, mainly due to the higher CaF
2 content in the slag. In addition to the effect of CaF
2 on the viscosity of the slag, CaF
2 has also a suitable fusibility and relatively high evaporation temperature, which allow the process to initiate relatively quickly and easily. It also features favorable desulphurization efficiency, and, overall, contributes to the stability of the ESR process. The effect of the temperature and viscosity of the slag is very important from the viewpoint of formation of the structure of an ingot, especially as regards its head. The release of gases from the last fraction of liquid steel crystallizing in the head of the ingot is facilitated by the use of easily fusible slags. The appearance of axial integrity in the head of the ingot is associated with the use of hardly fusible slags.


