Article

The Stability of TiO2 Phases Studied Using r2SCAN in the Hubbard-Corrected Density Functional Theory

Department of Physics, Baylor University, Waco, TX 76798, USA
*
Author to whom correspondence should be addressed.
Current address: College of Graduate Studies, Medical University of South Carolina, Charleston, SC 29425, USA.
Molecules 2025, 30(3), 560; https://doi.org/10.3390/molecules30030560
Submission received: 19 December 2024 / Revised: 21 January 2025 / Accepted: 23 January 2025 / Published: 26 January 2025

Abstract

:
Titanium dioxide is a quintessential transition metal oxide with many technologically important applications. With its richness in phases, it has also been a testing ground for numerous theoretical studies including density functional theory. We investigated several phases of TiO2 using the all-electron density functional theory with a regularized–restored strongly constrained appropriately normed (r2SCAN) exchange–correlation functional, a popular choice of meta-generalized gradient approximation (meta-GGA). Specifically, the equilibrium lattice parameters were more accurate than those predicted by GGA and agreed well overall with the experimental data. With increasing pressure, the order of stability was determined as anatase < columbite < rutile < baddeleyite < orthorhombic I < cotunnite, as in the calculations using GGA. Including the Hubbard correction term, the correct ordering between rutile, anatase, and columbite can be achieved, consistent with experimental observations. The necessary U value using r2SCAN is much smaller than that using GGA+U. In addition, the Hubbard correction method using r2SCAN is substantially less sensitive to the size of the local projection space compared to the GGA+U study reported recently. We attribute these significantly improved results to the reduced self-interaction error in the r2SCAN functional.

1. Introduction

TiO2 has attracted a long and sustained interest due to its highly desirable and often intriguing properties with respect to many technologically important applications [1,2,3,4,5,6,7,8,9,10,11,12]. For example, in heterogeneous catalysis, it has been used as a support for metal nanoparticles [4,7,11]. Its synergistic effects on various catalytic reactions, as well as the role of surface defects, have been extensively investigated. The excellent photo-reactivity of TiO2 is another subject of intense and ongoing research [6,10]. It has been studied regarding its potential in the photolysis of water [1], degradation of toxic organic molecules [5], gas sensors, and dye-sensitized solar cells [2,8], in part due to its stability, cost effectiveness, and environmental friendliness.
TiO2 also exhibits richness in its phase diagram with various polymorphs. In an ambient condition, rutile P 4 2 / m n m (Figure 1a) and anatase I 4 1 / a m d (Figure 1b) are two of the best known stoichiometric and stable forms among several polymorphs [13,14,15,16]. At elevated pressures, they undergo phase transitions to various structures, including α -PbO2-type TiO2 II, also known as columbite (Pbcn) (Figure 1c), monoclinic baddeleyite ( P 2 1 / c ) (Figure 1d), orthorhombic I (Pbca) (Figure 1e), and orthorhombic II, also known as cotunnite (Pnma) (Figure 1f) [17,18,19]. These high-pressure phases have been examined in comparison to stishovite (SiO2) for a better understanding of the Earth’s mantle, partly because TiO2 phases allow lower, more easily accessible pressures to induce structural transformation [20]. More recently, it has been reported that the high-pressure phases of several minerals can be stabilized at ambient pressure using a high-pressure torsion method [21,22,23,24,25]. These studies have renewed interest in the possibility of tailoring materials’ properties by synthesizing and quenching high-pressure structures without doping.
The stability of TiO2 phases, including high-pressure phases, has been scrutinized using density functional theory (DFT). Using local density approximation (LDA) or generalized gradient approximation (GGA), the general trend of stability and subsequent phase transitions have been successfully reproduced: rutile, anatase, and columbite → baddeleyite → OI → cotunnite, with increasing pressure [27,28,29,30,31,32,33,34,35,36]. However, the standard density functional approximations (DFAs), as well as hybrid functionals, fail to replicate the relative stability among the low-pressure phases, such as rutile, anatase, and columbite. In order to resolve this issue, a number of research groups have explored the Hubbard-corrected DFT approach to achieve the correct ordering of the stability among the low-pressure TiO2 phases. For example, Arroyo-de Dompablo et al. [37] reported that the total energy of rutile becomes lower than that of anatase with a U value larger than 5 eV in the GGA+U approach using the Perdew–Burke–Ernzerhof (PBE) functional [38,39]. The authors further suggested that with a range of U values between 5 eV and 8 eV, their study predicted the correct ordering in energetics among the phases, including columbite: E r u t i l e < E a n a t a s e < E c o l u m b i t e . Similarly, Curnan and Kitchin reported that U values between 4.7 eV and 7.0 eV with the use of the PBE functional reproduced the ordering of the stability among the rutile, anatase, brookite, and columbite phases, consistent with experiments: E r u t i l e < E a n a t a s e < E b r o o k i t e < E c o l u m b i t e [40].
While the DFT+U approach can be attractive due to its computational efficiency, the treatment of the Hubbard U on-site repulsive energy as an empirical parameter is unappealing from a theoretical point of view. More seriously, the sensitivity of the calculated results to the underlying input parameters, such as the size of the local projection space for the correlated d orbitals, can be problematic. We recently performed a systematic investigation into the size effect of the local projection space on the PBE+U calculations of rutile and anatase [41]. Our results showed that different ranges of the local projection can produce strikingly different quantitative results for the lattice constants, electronic structures, charge density maps, and the relative stability between rutile and anatase. In particular, if the local projection space for the Hubbard interaction chosen was sufficiently small, even a very large value of U, up to 10 eV, could not reproduce the correct ordering in relative energetics between rutile and anatase, sharply contradicting the aforementioned results. The quantitative discrepancies were attributed to the dependence of the occupancy numbers of the correlated orbitals on the size of the projection space, causing disparate shifts in the orbital-dependent potential energy. Thus, the study highlighted that DFT+U calculations, particularly those using the PBE, should be interpreted with caution.
As another approach to improve upon the standard DFA, meta-GGAs have been developed by including the electronic kinetic energy density in addition to the density n(r) and its gradient n (r). Among them, the more recently reported strongly constrained and appropriately normed (SCAN) functional has been under the spotlight for its ability to accurately describe the structures and energies of diversely bonded systems ranging from molecules to solids [42,43,44,45]. Its success has in part been traced back to the properties of the functional satisfying all known exact constraints for the exchange–correlation term [42]. The use of the kinetic energy density allows SCAN to be more flexible regarding the distinct types of chemical bonding, from metallic to covalent and from hydrogen to van der Waals, while retaining computational efficiency as a semi-local functional. For binary oxides and compounds, SCAN has been demonstrated to be in a better agreement with experimental data than the PBE [46,47,48,49]. Specifically, for the relative stability among TiO2 phases, Zhang et al. [47] reported that anatase, brookite, columbite, and β -TiO2 were more stable than rutile using SCAN, just as they were when using the PBE. However, the energy differences calculated using SCAN were substantially reduced compared to those calculated using the PBE. The authors further showed that the correct ordering of stability could be achieved with a very modest U value of 2 eV in the SCAN+U approach. They credited the smaller value of U necessary for reproducing the correct energetics to the reduced self-interaction error (SIE) in SCAN [50,51].
In order to better understand the performance of the SCAN functional and its use in the Hubbard-corrected DFT approach, we report DFT calculations of TiO2, including high-pressure phases, using a regularized–restored strongly constrained and appropriately normed (r2SCAN) functional, a version of SCAN with improved numerical efficiency while maintaining adherence to the exact constraints [52]. With r2SCAN implemented self-consistently in all-electron calculations, our goal was to make a systematic comparison with PBE and PBE+U calculations in terms of the equilibrium structures, relative stability, and elastic and electronic properties.

2. Results and Discussions

2.1. Equilibrium Structures and Phase Stability at 0 GPa

Table 1 lists the optimized structural parameters of TiO2 phases calculated using r2SCAN and PBE functionals. They are compared with selected experimental and theoretical values reported in the literature. The structures referred to are the equilibrium structures at p = 0 GPa unless stated otherwise. Also, the internal coordinates of the optimized structures are provided in Table S1 in the Supplementary Materials. In general, our values calculated using the PBE functional matched closely with previously reported theoretical values for rutile, anatase, and columbite [29,32,35,37,40,53,54,55]. Also, the lattice constants predicted using the r2SCAN functional deviated no more than 0.3% from those reported by Zhang et al. using the SCAN functional [53]. The lattice constants calculated using r2SCAN (or SCAN) were significantly smaller, typically by up to 1%, than those calculated using the PBE, which is known to overestimate the lattice constants. As a result, the lattice constants of the three low-pressure polymorphs calculated using r2SCAN were much closer to the experimental values, as observed in Table 1. For rutile and anatase, the lattice parameters were within 0.2% and 0.9% of the experimentally measured values, respectively. The calculated lattice constants for columbite were also no more than 0.2% away from the experimental values measured under ambient conditions after the columbite phase was pressure-quenched [17,56].
For baddeleyite, the lattice constants calculated using the PBE functional were in excellent agreement with those reported by Fu et al. [32], differing by no more than 0.3%. Similarly, for OI, our lattice constants were practically identical to the compared values when using the same PBE functional (Table 1). However, for cotunnite, the calculated lattice constants varied by a greater extent among the calculations even when using the same GGA level. A difference of about 1.0% for the lattice constants b and c was observed as compared with the value reported by Fu et al. [32], whereas the values for the lattice constant a were in good agreement. On the other hand, our results for cotunnite agreed better with those reported by Niu et al. [54] when using the same PBE functional, with the largest difference of 0.7% for the lattice constant b. Our lattice parameters were also compared with the values predicted using another GGA functional (PW91) [29]. In this case, the largest deviation was observed to be about 0.7% as well, but for the lattice constant a.
The r2SCAN functional reduced the overestimated lattice constants of the high-pressure phases by substantial amounts, just as was observed for the three low-pressure phases. The lattice constants for baddeleyite decreased by 0.5% along a and by 1% along b and c, compared to those calculated using the PBE. The calculated lattice constants also agreed well with the values reported by Zhang et al. calculated using the SCAN functional [53]. Likewise, for OI and cotunnite, the lattice constants decreased by 0.7% to 0.8% and by 0.6% to 0.9%, respectively. For OI and cotunnite, we are not aware of any reported lattice parameters calculated using the SCAN functional.
The structural parameters of the high-pressure phases calculated using the r2SCAN functional were generally closer to the experimental values than those calculated using the PBE functional as well. For baddeleyite, our calculation using the PBE predicted that the values would deviate from the experimental ones by 4.3%, −1.3%, and 4%, respectively, for a, b, and c. Using r2SCAN, the deviation decreased to 3.7% for a and 3% for c, whereas it increased to −2.3% for b. Consequently, the equilibrium volume per formula unit, V0, decreased from 29.98 Å3 to 29.23 Å3, closer to the experimental value of 28.06 Å3 (Table 1). However, it was also noted that the agreements between the theoretical lattice constants, including our own, and the experimental values for baddeleyite were less satisfactory compared to the three low-pressure TiO2 phases. We believe that the sizable discrepancy is perhaps in part due to the uncertainty involved in the extrapolation scheme in deducing the zero-pressure lattice constant [20].
For OI, the lattice parameters from the r2SCAN calculation at 0 GPa yielded V0 = 27.80 Å3 per formula unit, which was in good agreement with the values ranging from V0 = 27.27 Å3 to V0 = 27.97 Å3 deduced from experiments [18,28,58]. Just like other high-pressure phases, OI is not pressure-quenchable. The experimental lattice constants for OI in Table 1 were based on an X-ray diffraction measurement performed at 28 GPa [18]. In order to simulate the experimental structure, the OI structure was optimized, with the reduced volume corresponding to p = 28 GPa (Figure S1 in the Supplementary Materials). The lattice constants of the high-pressure structure calculated using r2SCAN were in excellent agreement with the experimental values, differing by no more than 0.2%. These values are clearly better than the ones obtained using the PBE as well as the hybrid B3LYP functionals at 28 GPa [33]. Similarly, for cotunnite, the quoted experimental lattice constants are the ones acquired at 61 GPa [19]. At 0 GPa, the equilibrium volume was estimated to be 15.82 cm−3/mol, which is about 23.02 Å3 per formula unit [58]. The lattice parameters calculated using r2SCAN yielded a better agreement with V0 = 22.14 Å3, in contrast to V0 = 26.29 Å3 calculated using the PBE as well as V0 = 25.80 Å3 calculated by Fu et al. [32] and V0 = 26.15 Å3 calculated by Ma et al. [29] using the same functional.
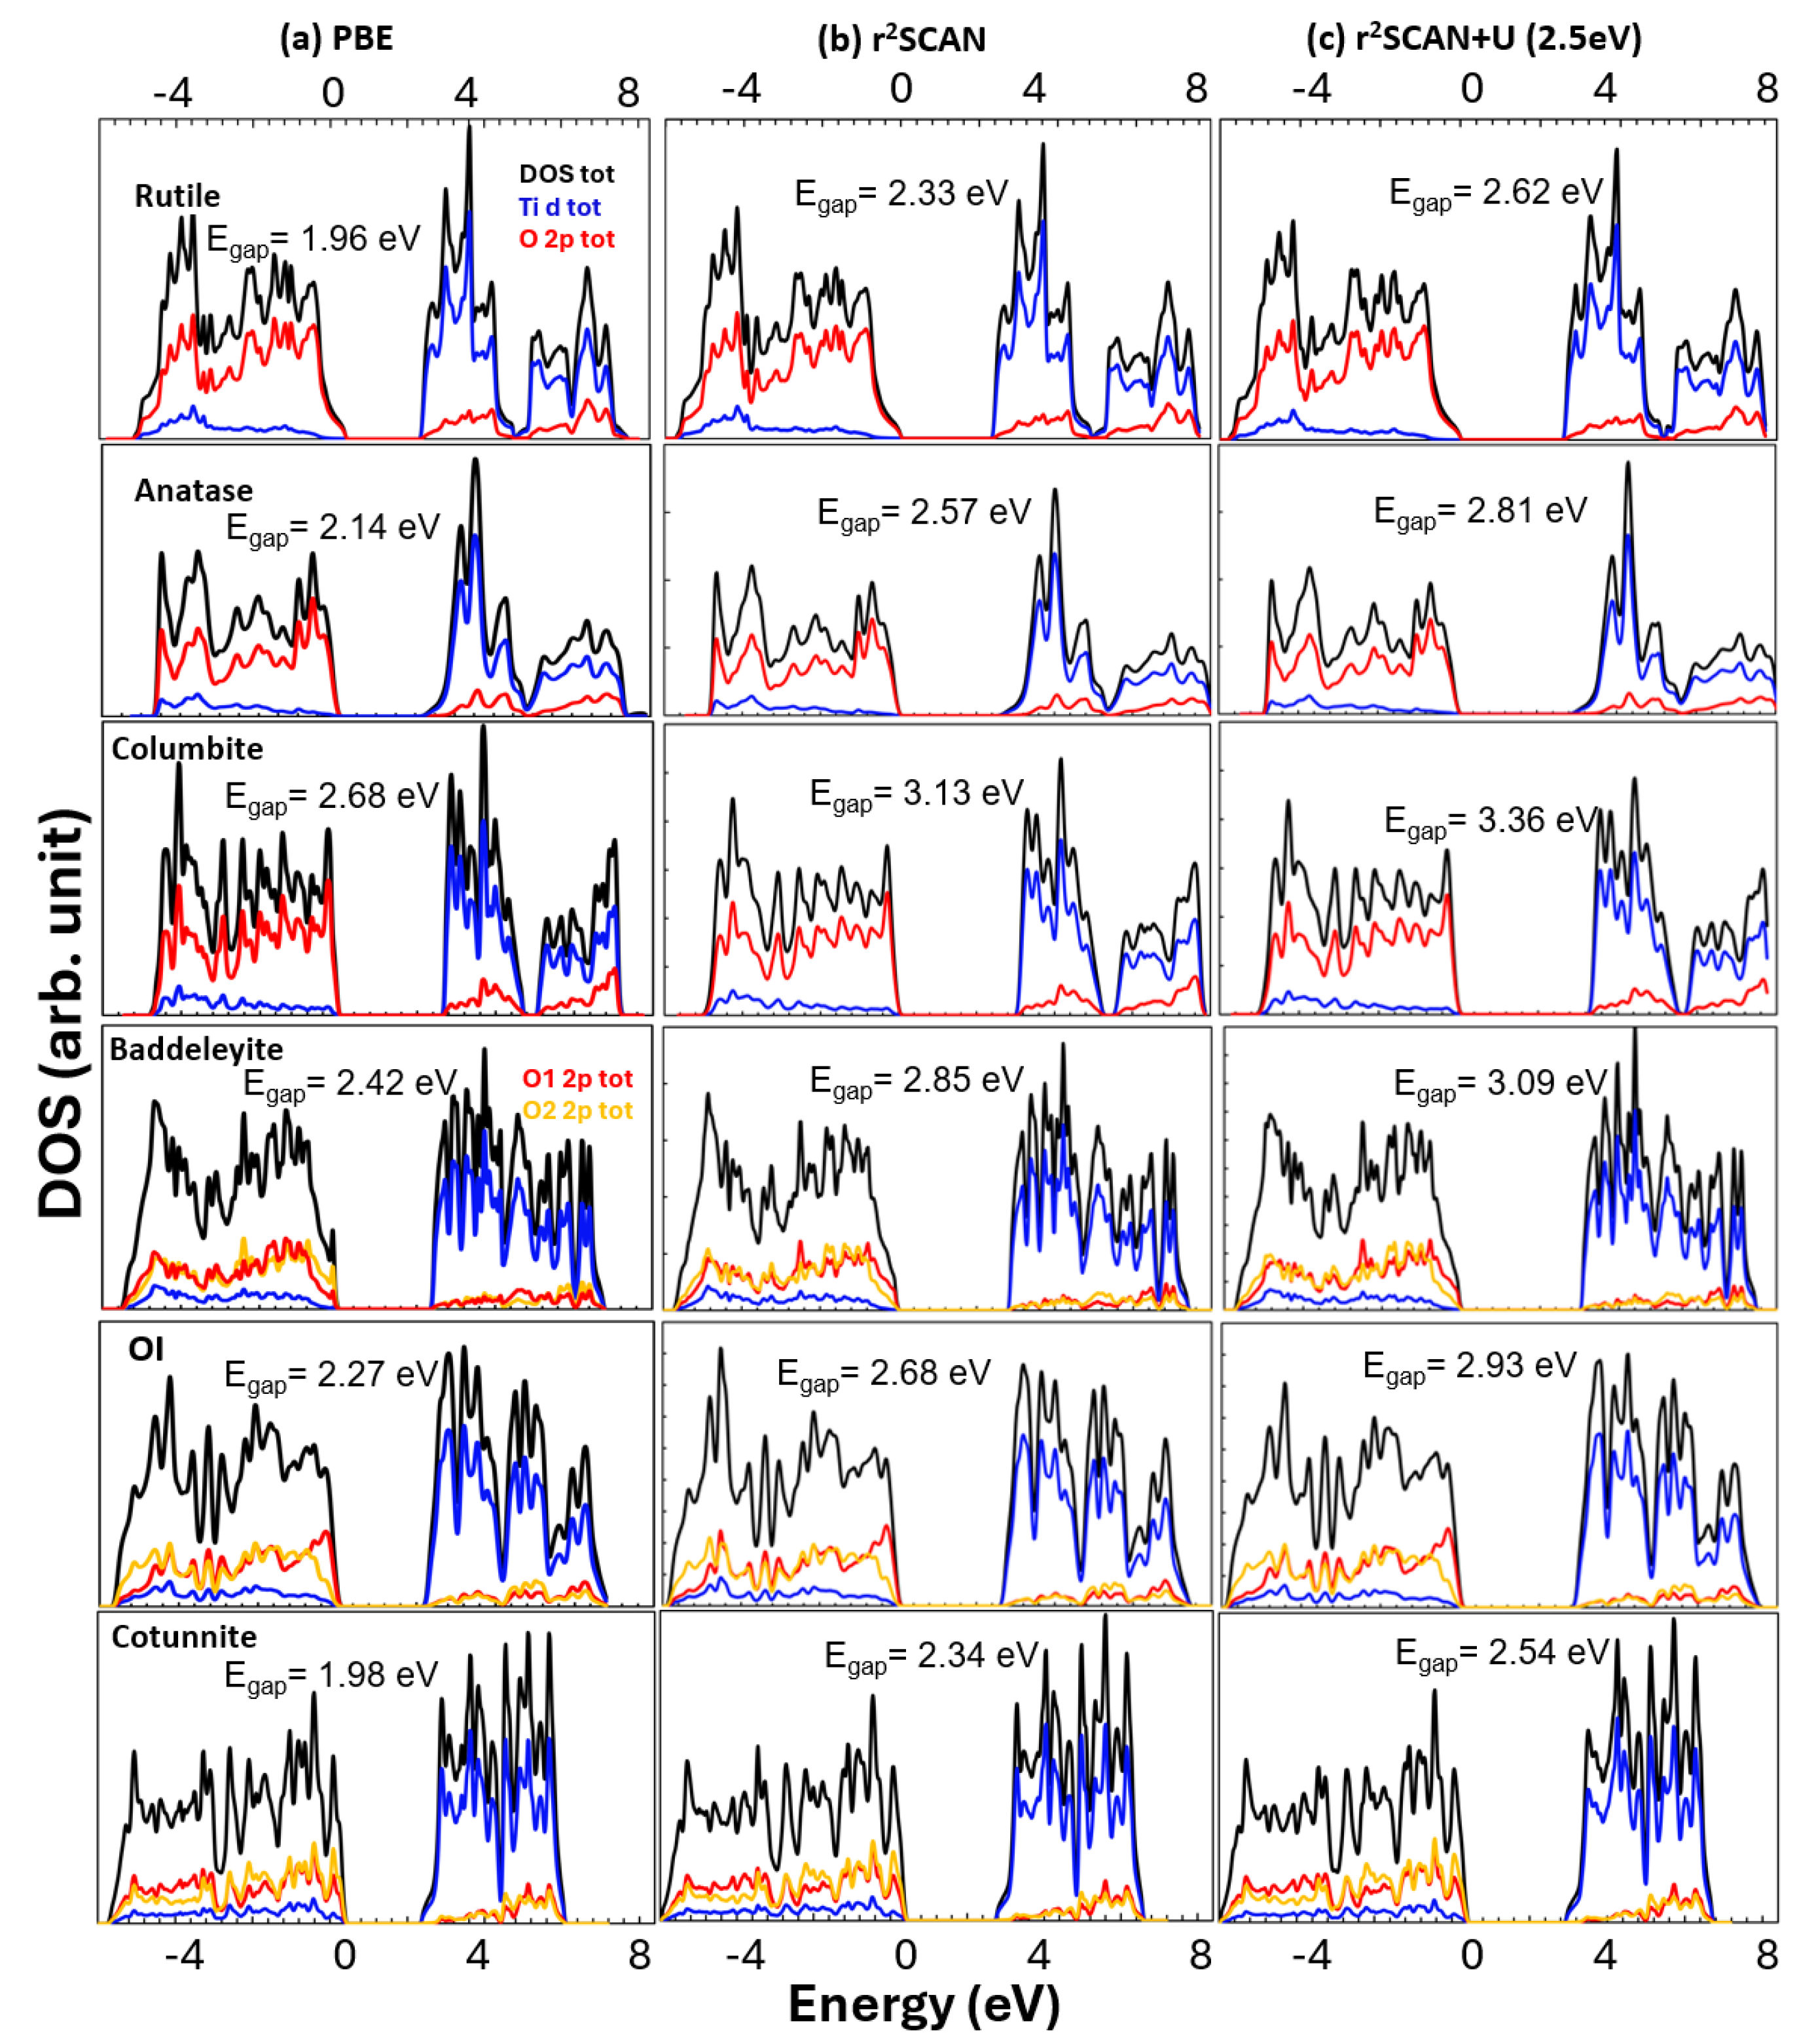
The electronic densities of states (DOSs) for the six phases in their equilibrium structures were also investigated using the r2SCAN functional. The DOS curves of all TiO2 phases show that the occupied states in the valence bands were mostly dominated by O p orbitals and the empty conduction bands by Ti d orbitals (Figure 2). While TiO2 can be characterized as a charge transfer insulator, it has substantial covalency, as evidenced by the overlaps between O p and Ti d orbitals [59]. For rutile, anatase, columbite, and baddeleyite, the Kohn–Sham band gaps (Egap) were 2.33, 2.57, 3.13, and 2.85 eV, respectively (Figure 2b), in good agreement with the values reported by Zhang et al. [53]. These values were roughly 0.4 eV greater than those predicted using the PBE functional (Figure 2a). However, they are well short of the experimental values, for example, 3.0 [60] and 3.2 eV [61] for rutile and anatase, respectively, indicating that the r2SCAN functional still suffers from the SIE, as in the PBE functional, albeit to a smaller extent [53]. For OI and cotunnite, we are not aware of any reports of the band gap or calculations of the electronic structure using the SCAN functional. Our values of 2.68 and 2.34 eV, respectively, for OI and cotunnite were larger than the 2.27 and 1.98 eV calculated using the PBE functional by about 0.4 eV, as well. The band gap values from the PBE calculations are consistent with an Egap estimated to be greater than 2 eV for OI [30] and, for cotunnite, an Egap calculated to be 2.02 eV [62].
Figure 3 presents the total energy of each phase as a function of the volume of the unit cell using the r2SCAN functional. For comparison, the energy of each phase was normalized to the energy per TiO2 formula unit. At p = −(∂E/∂V) = 0 GPa, rutile, anatase, and columbite lay very close together in terms of their energy, while the other three high-pressure phases were clearly at higher energies. A closer inspection revealed that the energy of anatase was the lowest, followed by that of columbite and then rutile. The relatively small energy differences predicted among the three low-pressure phases can be understood in terms of the structural resemblance that they share [27]. Rutile, anatase, and columbite can all be approximately described as oxygen octahedra with Ti at their centers (Figure 1). They are distinguished by different octahedral linkages: two edge-sharing octahedra along c in rutile, two edge-sharing octahedra forming zigzag chains in columbite, and four edge-sharing octahedra forming zigzag chains in the a–b plane of anatase. The close structural similarity with minute differences in the energetics implies that the phase transformation among them can be quite sensitive to and easily influenced by other factors such as the temperature, residual stress, or history of sample preparations.
The three low-pressure phases were followed by baddeleyite, OI, and cotunnite in the increasing order of the energy at equilibrium. The high-pressure phases exhibit polyhedral shapes that are more severely distorted, with an increased coordination number for Ti (Figure 1). Their energy differences were markedly greater compared to those of the three low-pressure phases. The overall ordering of the energetics was determined as E a n a t a s e < E c o l u m b i t e < E r u t i l e < E b a d d e l e y i t e < E O I < E c o t u n n i t e . The predicted ordering of the energetics was congruent with what Zhang et al. [53] reported using SCAN: E a n a t a s e < E b r o o k i t e < E c o l u m b i t e < E β T i O 2 < E r u t i l e < E b a d d e l e y i t e . Between the r2SCAN and PBE functionals, the relative energetics of the six phases remained essentially the same, apart from small quantitative differences (Figure S2 in the Supplementary Materials). Our results calculated using the PBE were also in agreement with those reported previously [29,30,32,34,35,62,63].
The dependence of the total energy on the volume further allowed us to explore the system under the condition of hydrostatic pressure. The calculated values were fitted and analyzed with the third-order Birch–Murnaghan equation of state (EOS) [64,65]:
p ( V ) = E V = 3 2 B 0 V 0 V 7 / 3 V 0 V 5 / 3 { 1 + 3 4 B 0 4 V 0 V 2 / 3 1 } ,
where B0 and B 0 are the bulk modulus and its pressure derivative, respectively, and V0 is the equilibrium volume. The bulk modulus values calculated using the r2SCAN functional were systematically larger than those calculated using the PBE, as one would expect from the smaller lattice constants predicted by r2SCAN in contrast to the overestimated lattice constants (Table 1). Also, our bulk modulus values calculated using the PBE were in good agreement with the previously reported values using the same or a similar GGA for the exchange–correlation functional. In comparison with experimental values of the bulk modulus, it is noteworthy that a substantial range of the experimental values could be found for a given phase. This is in part due to the fact that different fitting methods of V0, B0, and B 0 can introduce a substantial amount of uncertainty. This uncertainty can influence the results to the same effect as inherent experimental uncertainty due to different synthesis conditions, hydrostaticity, and the pressure calibration. In particular, Nishio-Hamane et al. [58] pointed out that a very large value of the bulk modulus for cotunnite, e.g., 419 to 485 GPa, can be obtained if a very small value of B 0 , such as 1 to 2, is used. On the other hand, with B 0 = 4.25, a bulk modulus of 294 GPa is produced. With B 0 fixed at 4, the Birch–Murnaghan EOS (Equation (1)) becomes the second order, resulting in a bulk modulus of 306 GPa. Given the variability of such fitting procedures, the bulk modulus values obtained using both the r2SCAN and the PBE functionals were considered to be in agreement with the reported experimental values.
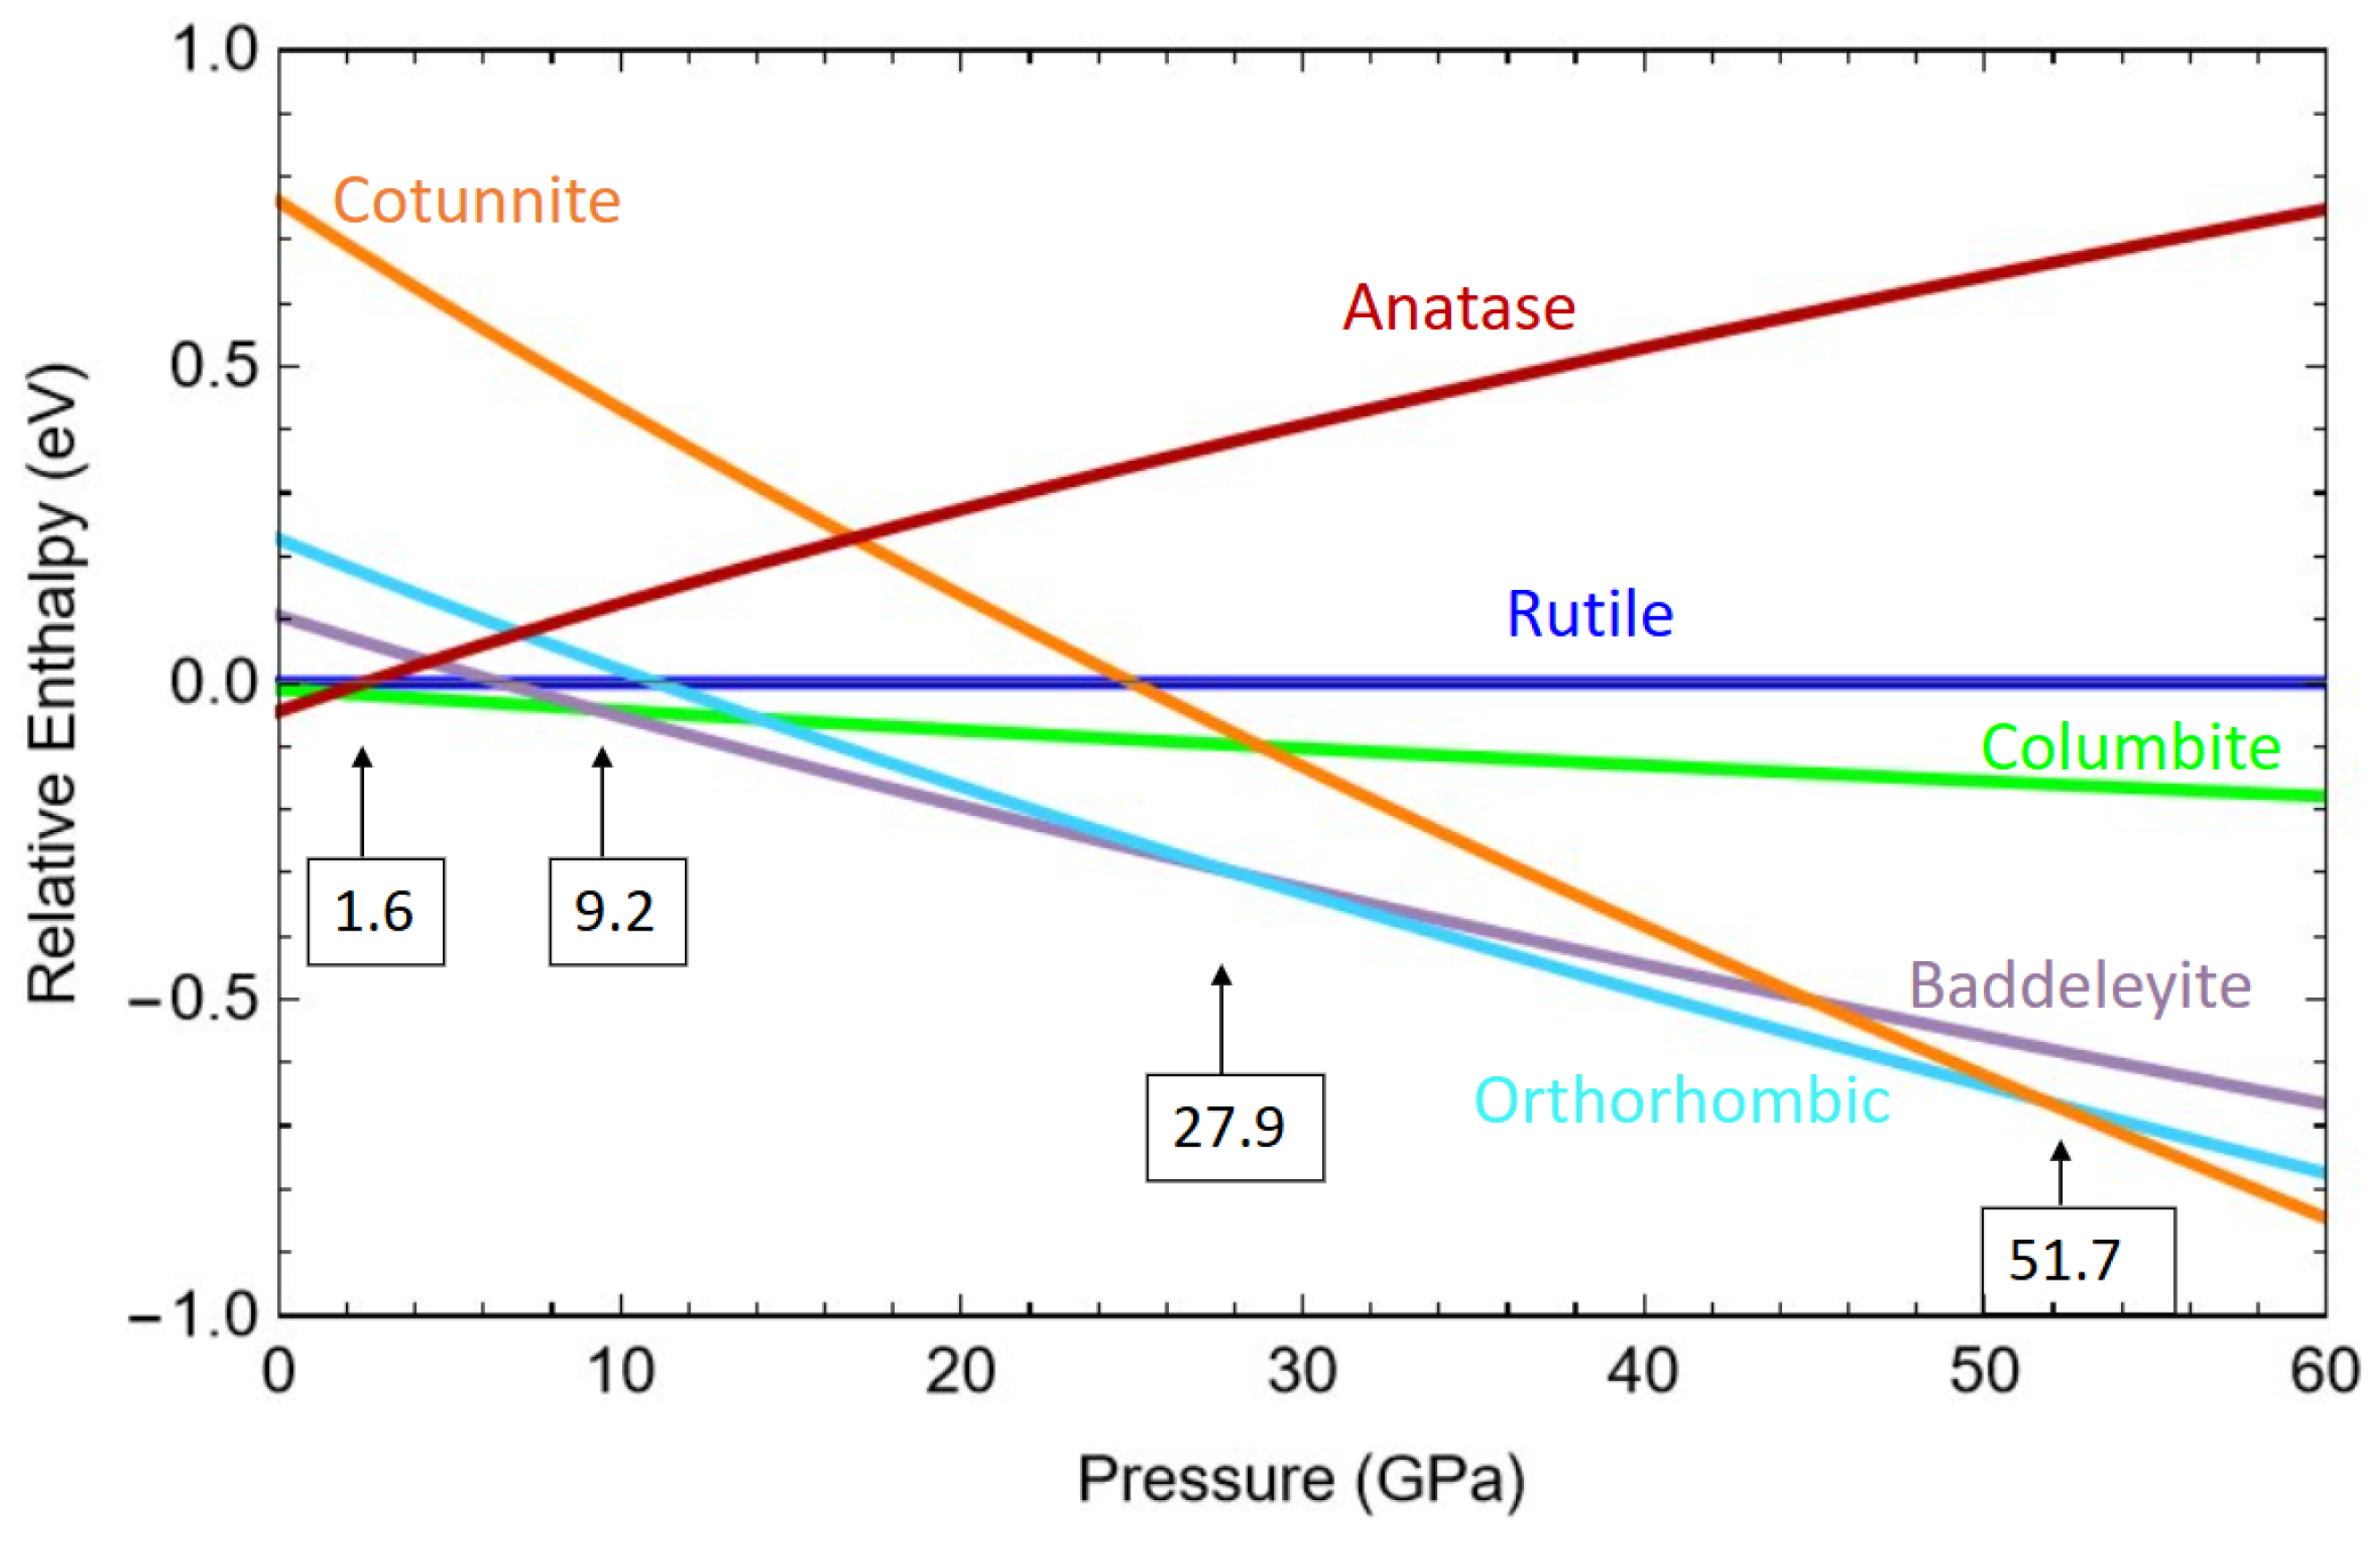
The enthalpy H = E + P V was further calculated to examine the relative stability and phase transitions at an increasing pressure. In Figure 4, the enthalpy of each TiO2 phase relative to that of rutile is displayed under hydrostatic pressure from 0 to 60 GPa. At 0 GPa, anatase had the lowest enthalpy among the phases studied in this work. Above 1.6 GPa and until 9.2 GPa, columbite became the most stable phase. This pressure range is in accordance with the observations that anatase transforms into columbite at the low-end limit of the pressure range from 2.3 [66] to 4.5 GPa [17]. It is also consistent with experimental reports in which columbite is typically formed from baddeleyite at around 7 or 8 GPa upon decompression [17,20,28]. From about 9.2 GPa to 27.9 GPa, baddeleyite had the lowest enthalpy. The large pressure range and the transition pressures agreed well with the transformations involving baddeleyite reported by various groups. It has been observed that baddeleyite transforms into columbite at 8 GPa upon decompression [17,20,28]. On the other hand, baddeleyite can convert to OI at as low as 25 GPa upon compression, as reported by Al-Khatatbeh et al. [28]. Between 27.9 and 51.7 GPa, the enthalpy calculated using r2SCAN predicted OI to be the most stable phase, and it predicted cotunnite to be the most stable for pressure beyond 51.7 GPa. The transition pressure between OI and cotunnite was in good agreement with the observed transformation of the OI phase into cotunnite taking place between 49.0 and 56.0 GPa [28]. Thus, for the six phases studied in this work, the sequence of the phase transitions was calculated to be anatase ⟶ columbite ⟶ baddeleyite ⟶ OI ⟶ cotunnite, with rutile being slightly less stable than anatase at ambient pressure.

2.2. The Effect of the Hubbard Correction

The addition of the Hubbard correction term to the r2SCAN functional results in an increase in the band gap as the most notable change. Figure 2c shows that the band gap energies of all TiO2 phases increased by approximately 0.2 to 0.3 eV upon U = 2.5 eV being applied to the r2SCAN functional calculations. The band gaps for rutile, anatase, columbite, and baddeleyite were now 2.62, 2.81, 3.36, and 3.09 eV, respectively. The increase in the band gap energy was in accordance with a similar increase reported based on SCAN+U(2eV) calculations [53]. The increase in or opening up of a band gap is understood to be a direct consequence of on-site electron–electron repulsion favoring electron localization as it prevails over the delocalization caused by the kinetic energy term. Although the increased band gap energies were still smaller than the experimental values, they represent improvements as one of the original objectives envisioned in the DFT+U approach [67].
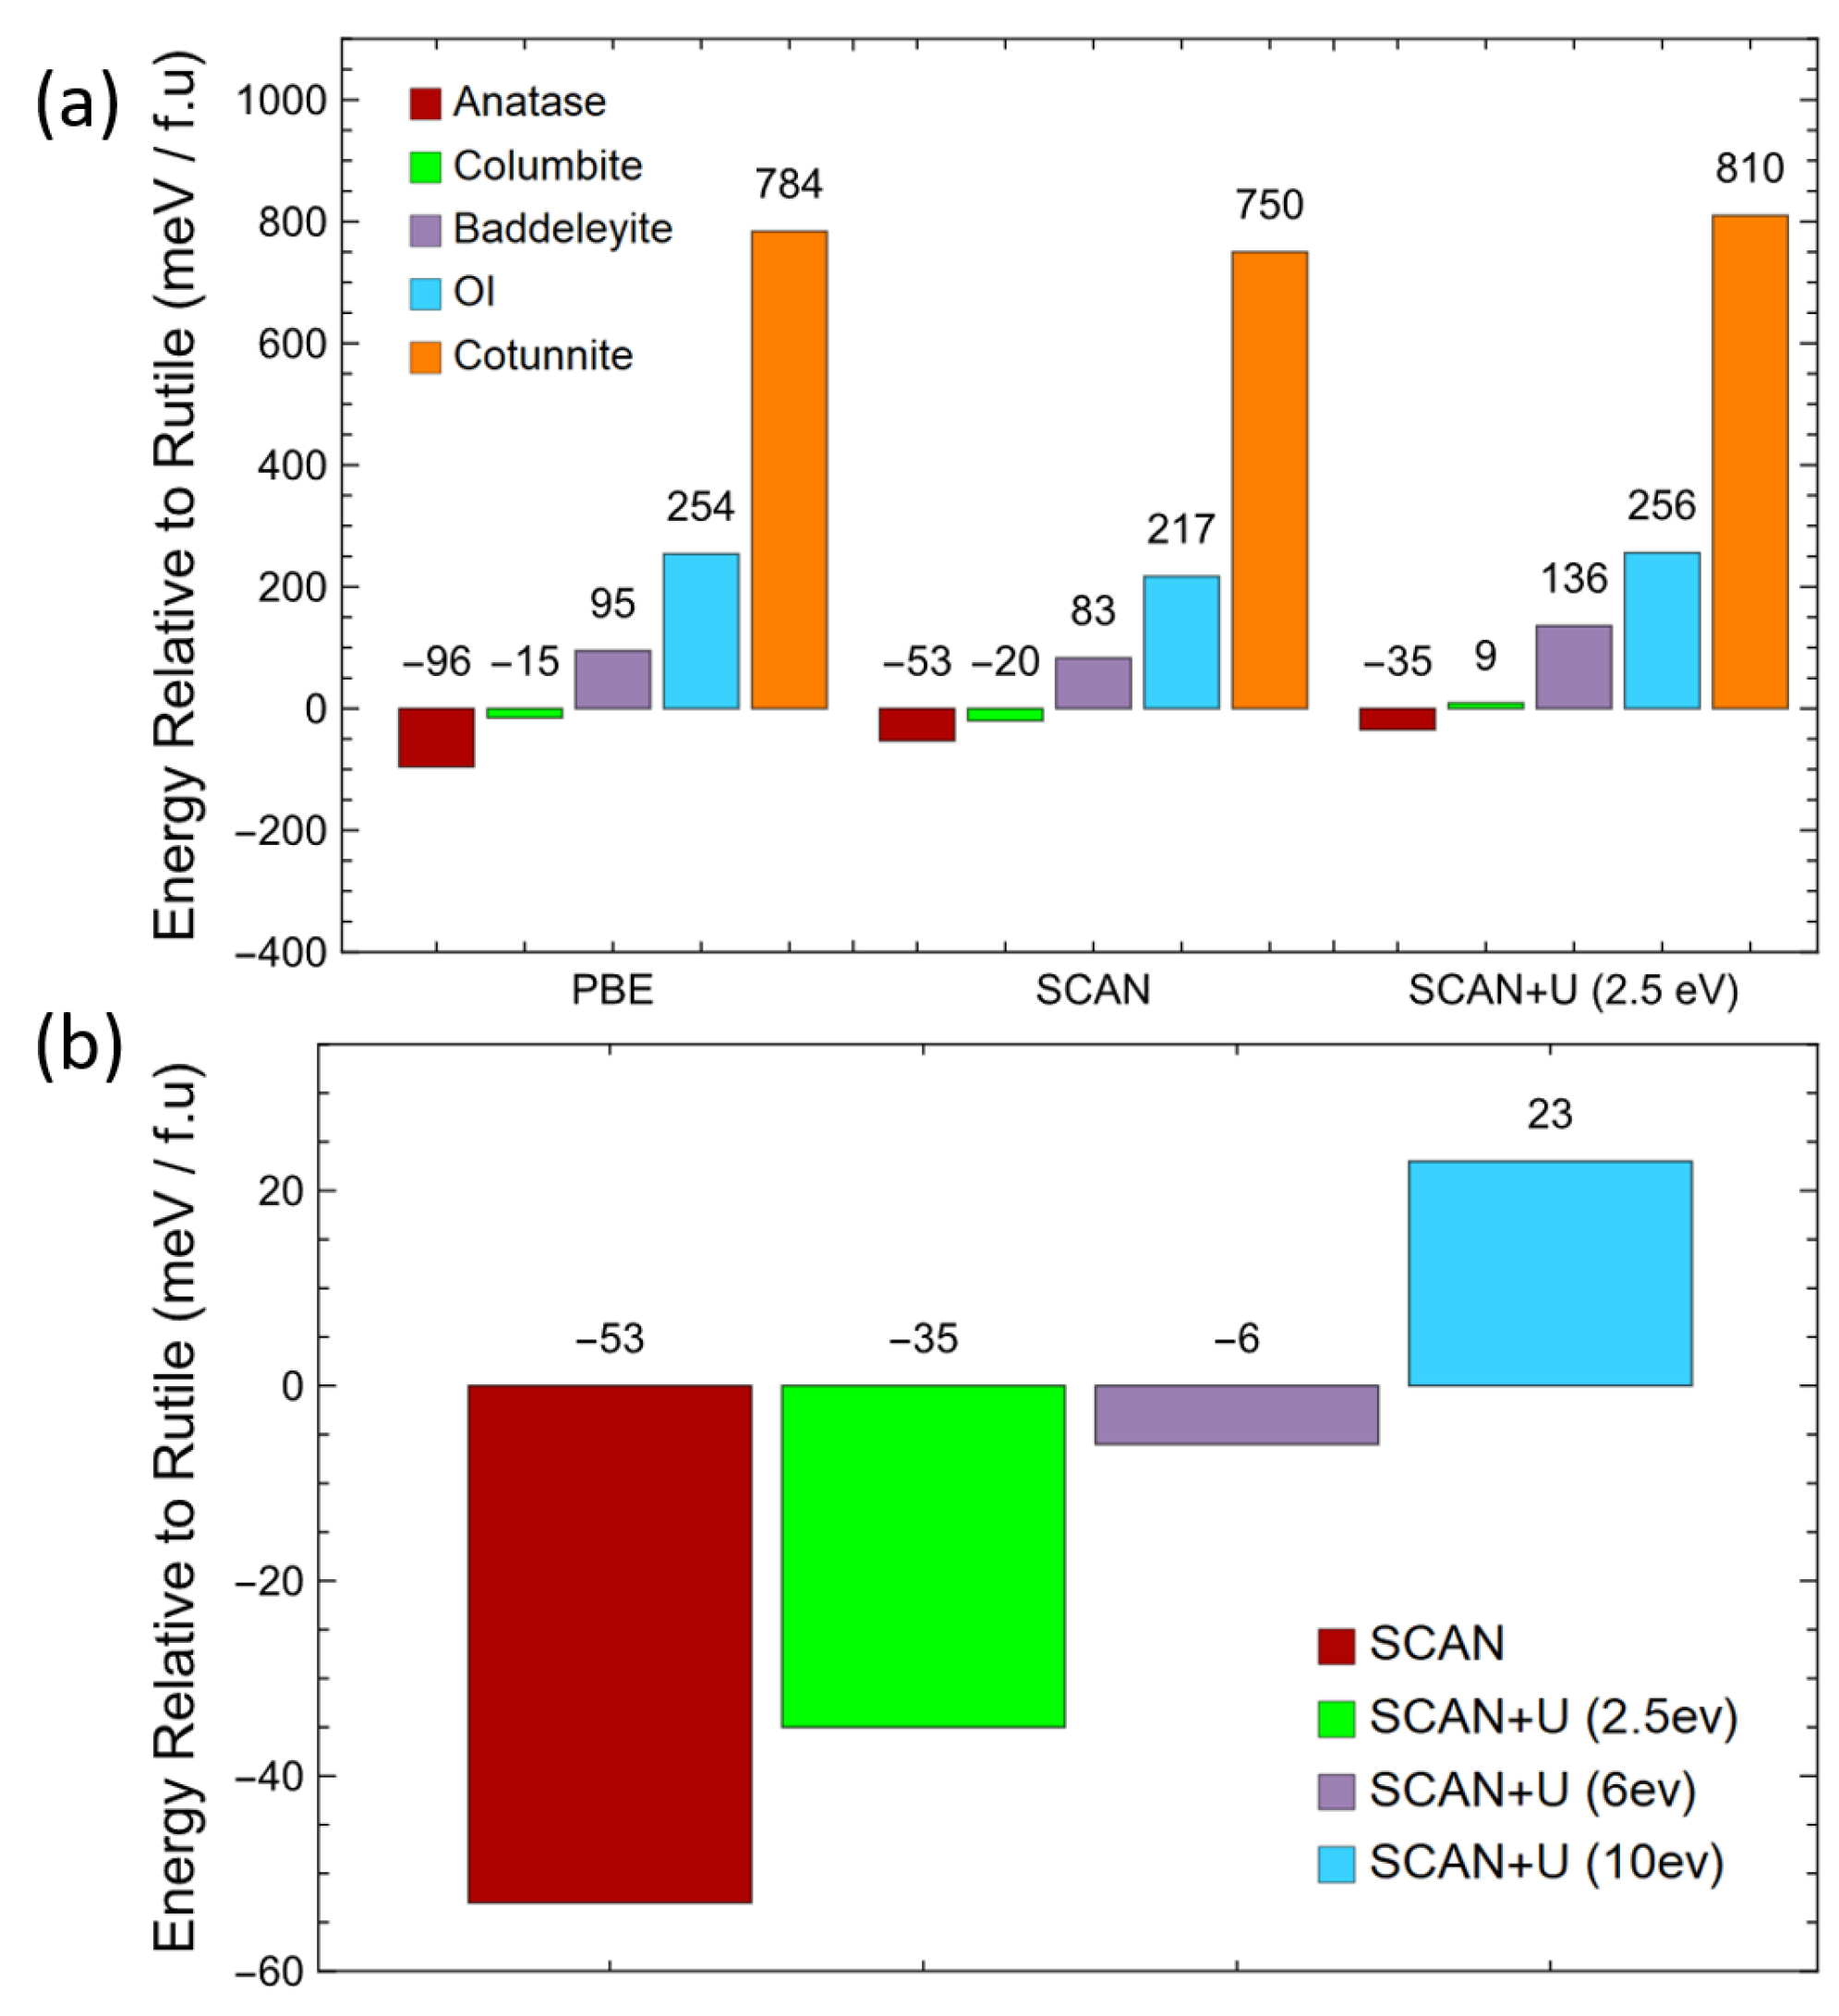
The relative energetics among the TiO2 phases can be considerably influenced by the Hubbard correction as well. In Figure 5a, the total energies of the six phases calculated with r2SCAN with the Hubbard U correction are quantitatively compared to those calculated with r2SCAN and the PBE at 0 GPa. Using r2SCAN, anatase and columbite were slightly lower in energy compared to rutile by −53 and −20 meV, respectively. These values were in a similar range to the previously reported values of −25 and −11 meV [53]. Although r2SCAN incorrectly predicted the relative stability among the three low-pressure phases, it is noticeable that the stability gap between rutile and anatase was reduced to −53 meV from the −96 predicted using the PBE. The inclusion of the Coulomb repulsion U = 2.5 eV for d orbitals raised the energy for anatase and columbite by 18 and 29 meV, respectively, relative to that of rutile. The increase in energy for columbite was apparently sufficient to make it unstable with respect to rutile. However, the energy of anatase still remained lower than that of rutile. For baddeleyite, OI, and cotunnite, the Hubbard correction increased their total energies by about 40 to 60 meV relative to the energy of rutile. Since they were well separated in terms of their relative energetics as well as in terms of the significantly higher energy in the low-pressure phases, the effect of the Hubbard U was to push up their total energies more or less uniformly.
The relative stability of rutile and anatase could be further altered with an increasing value of U in the r2SCAN+U calculations. With a U value increased to 6 eV (Figure 5b), anatase was still more stable than rutile but by merely 6 meV. After U was increased to 10 eV, rutile finally became more stable than anatase by 23 meV. The apparently larger U value, which was necessary to reverse the relative stability between rutile and anatase, is in clear contrast to the much smaller U = 2 eV needed to produce the correct ordering reported by Zhang et al. [53].
In our recent study of TiO2 using the PBE+U approach, we reported that the size of the local projection in the application of the Coulomb interaction can play a crucial role in quantitative assessments [41]. After comparing several studies of rutile and anatase calculated using the same PBE+U approach with various DFT codes, we concluded that systematic discrepancies in the structural parameters, electronic structures, charge density distribution, and energetics can be traced to the different effective ranges of the local projection space used to apply the Hubbard correction. This sensitivity directly results from the formulation as the local orbital occupancy n (Equations (5) and (6) in Section 3) depends on the size of the local projection space. In an APW method, such as the one used in this study, the local projection space is defined by the augmented sphere. Moreover, it can be varied independently using the muffin-tin radius R M T . In the pseudopotential approach using the projector-augmented wave (PAW) method, the local density matrix is usually calculated using the pseudo-wavefunction and the projection function within the PAW radius. However, the PAW radius is not generally an independent parameter because it varies with different pseudopotentials, which in turn depend on the valence electron configuration as well as the inclusion or exclusion of semicore electrons, among other factors. In the SCAN+U study, Zhang et al. [53] used the PAW potential, with Ti 3 s and 3 p treated as valence states. The corresponding R P A W s 2.3 aB, which is much larger than the R M T = 1.78 aB used in this study.
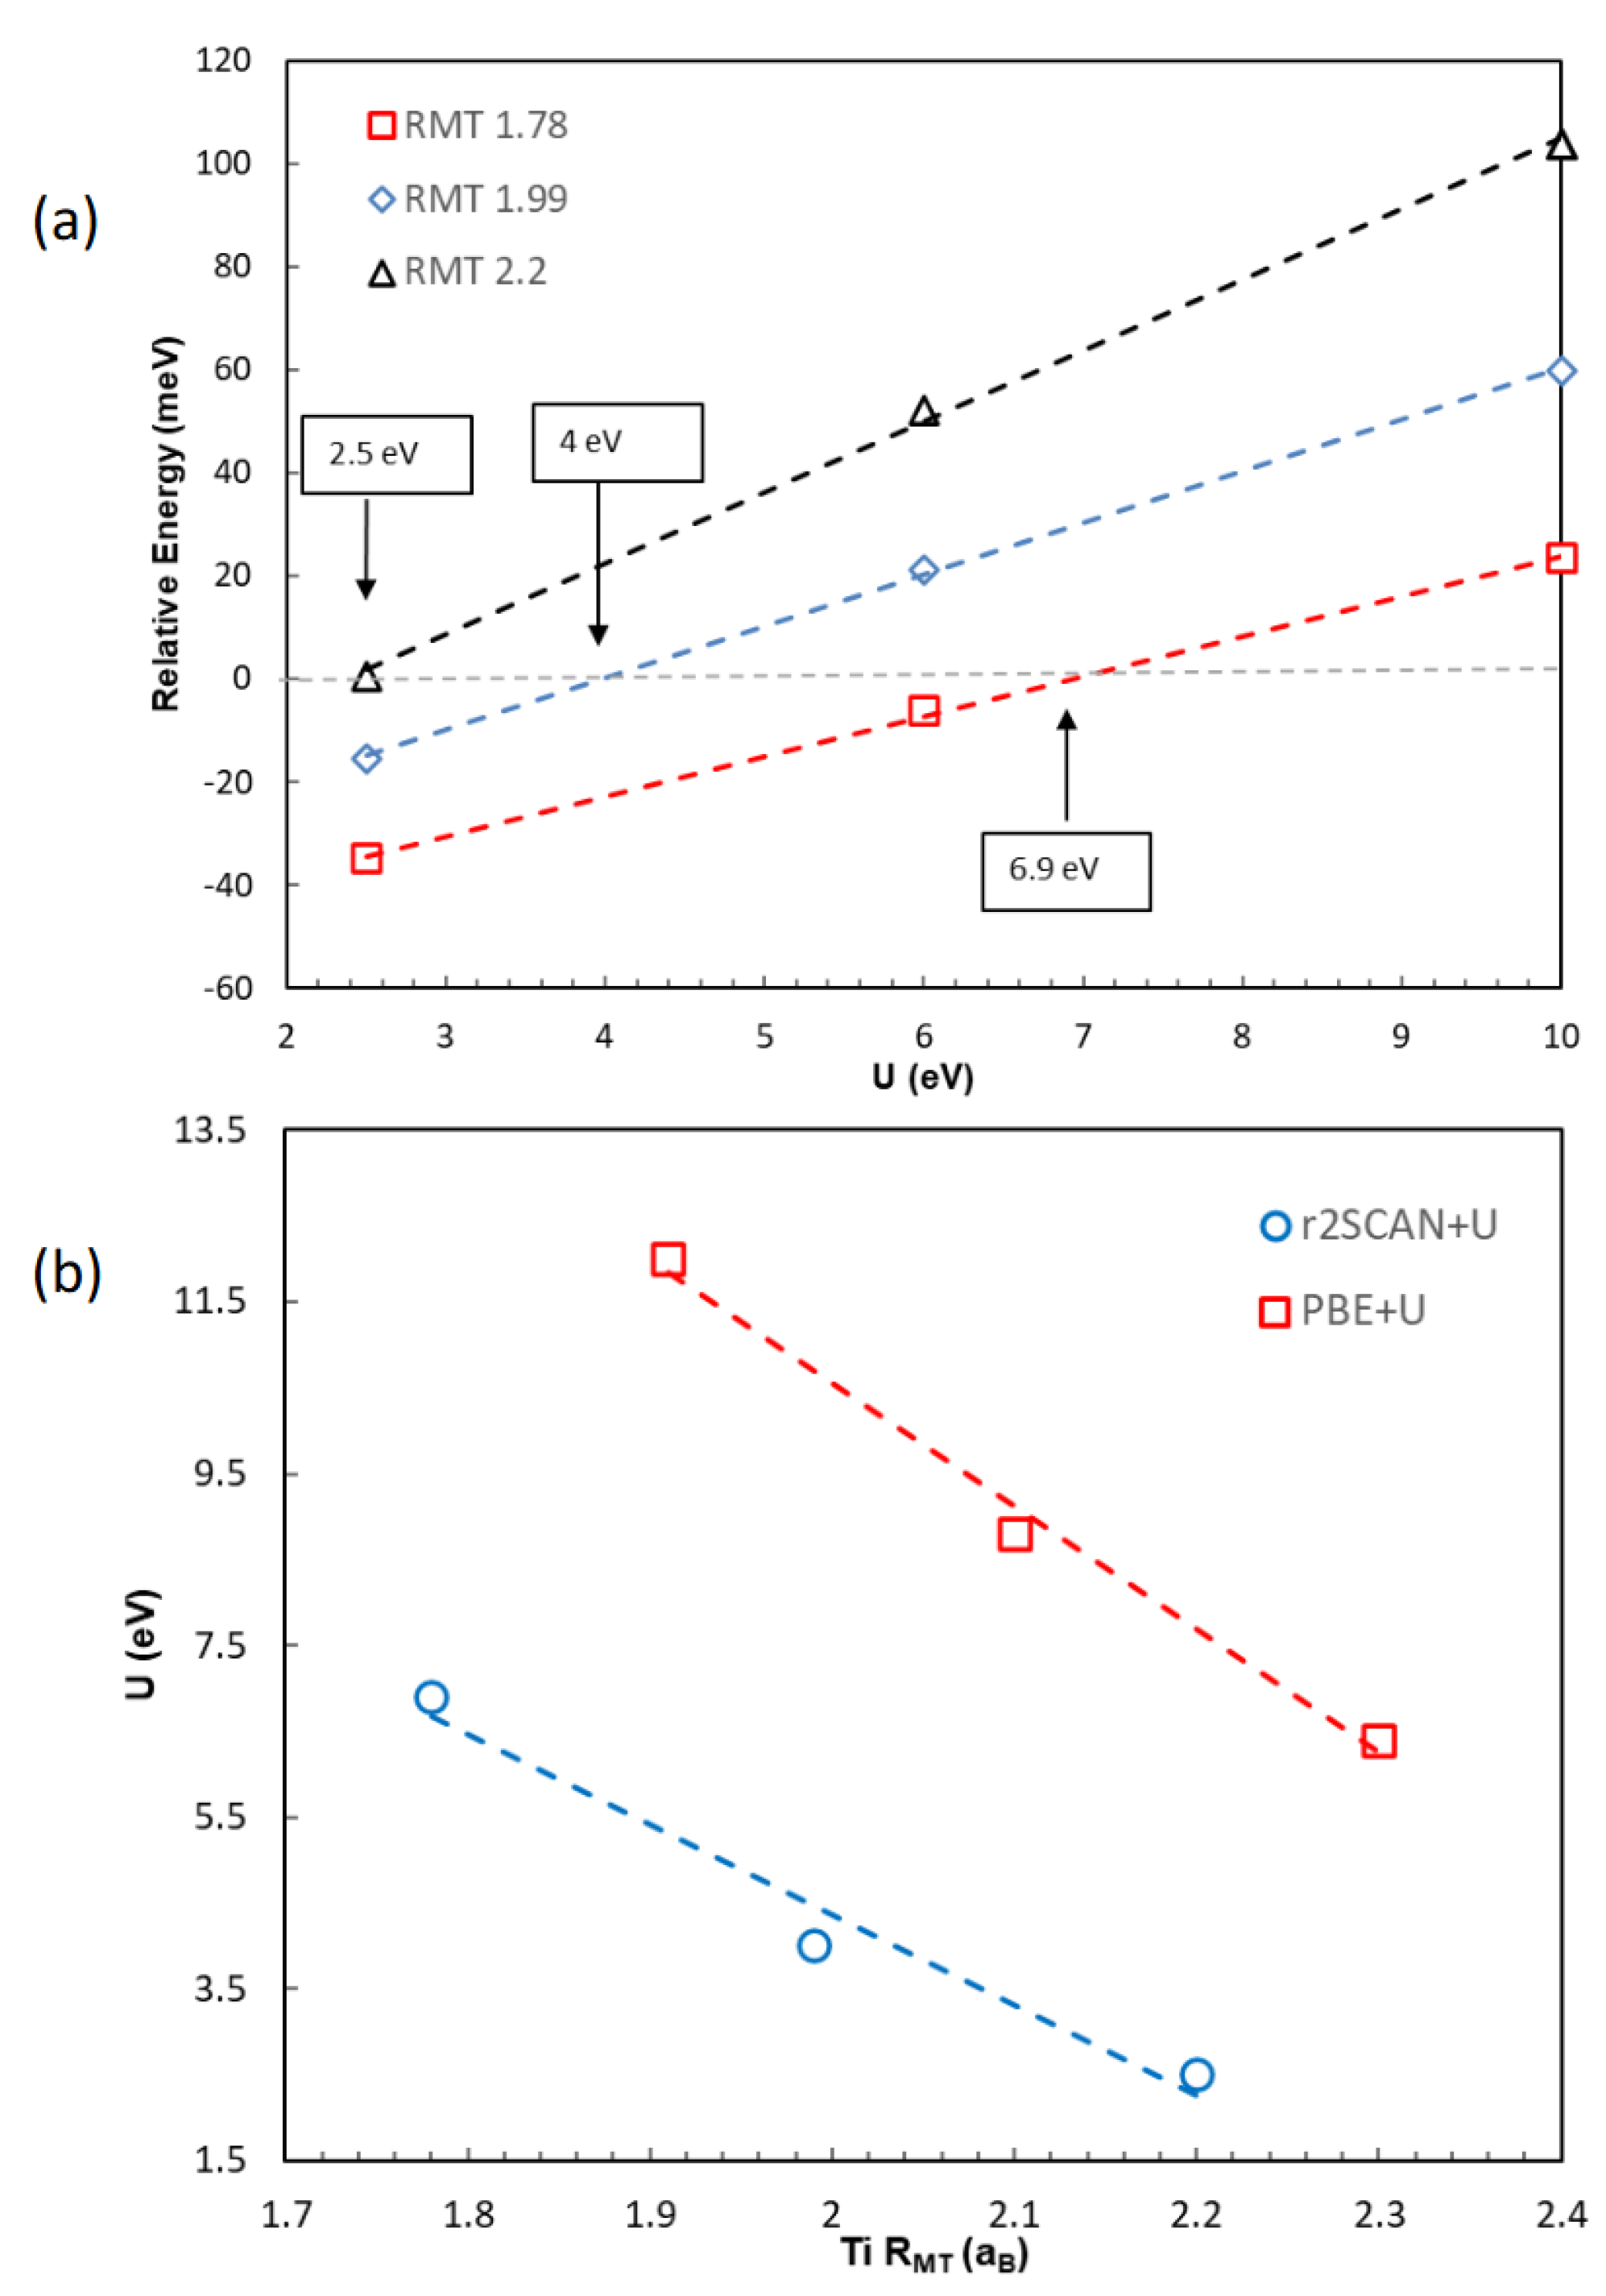
In order to investigate the effect of the local projection size on the relative stability calculated using the SCAN+U approach, the total energies of rutile and anatase were compared using different muffin-tin radii for Ti as well as different U values. Figure 6 shows the total energy of anatase relative to that of rutile as U was increased in three different sets of R m t (Ti) values: 1.78, 1.99, and 2.2 aB. With the smallest value of R m t (Ti) = 1.78 aB, it was estimated that anatase would become less stable than rutile after U was increased to 6.9 eV (Figure 6a red). As the R m t (Ti) value was increased to 1.99 aB, anatase became less stable at a substantially smaller U value of about 4 eV (Figure 6a, blue). With the largest R m t (Ti) of 2.2 aB tested in this study, the energy of anatase was raised above that of rutile at U = 2.5 eV or higher (Figure 6a, black). The U value calculated with the large projection space was comparable to the value reported of U = 2 eV [53]. The results unambiguously establish the dependence of the relative energetics on the size of the Hubbard projection space, calculated using r2SCAN+U just as was previously shown using PBE+U [41].
While the Hubbard-corrected SCAN calculations similarly suffered from a dependence on the size of the projection space, there was a clear distinction between the present results and the previous ones calculated using PBE+U. Using the same size of the projection space ( R m t (Ti) = 1.78 aB), the PBE+U calculations predicted that anatase would remain more stable with respect to rutile even after U was increased to 10 eV. The minimum U value that would reverse the relative stability between rutile and anatase was estimated to be well beyond 10 eV, much larger than the 6.9 eV predicted using r2SCAN (Figure 6a). In order to compare the minimum U values between the r2SCAN+U and PBE+U calculations necessary to produce the correct relative stability, the R m t (Ti) values of 1.91, 2.1, and 2.3 aB were chosen for the PBE+U calculations (Figure 6b). With R m t (Ti) = 1.91 aB, the minimum U value was estimated at 12 eV. As the R m t (Ti) was further increased to =2.1 and 2.3 aB, the minimum U value for the correct ordering of energetics between rutile and anatase decreased to 8.8 and 6.4 eV, accordingly. These values were consistently larger than what the r2SCAN+U calculations predicted, by about 5 to 7 eV, at comparable sizes for the local projection space. To understand why a relatively small value of U was sufficient for the r2SCAN+U calculations, the Bader charges were first examined and compared between the calculations using the r2SCAN and the PBE functionals [68,69].
Table 2 shows that the Bader charges for Ti and O were +2.28e and −1.14e for rutile and +2.26e and −1.13e for anatase, respectively, when calculated using the PBE functional. A bond critical point (BCP) (3, −1) [68] was found approximately midway from Ti to apical O along the Ti-O(1) bond as well as from Ti to equatorial O along the Ti-O(2) bond. With r2SCAN, the Bader charges for Ti and O were predicted to be significantly larger in magnitude, e.g., +2.38e and −1.19e for rutile and +2.37e and −1.19e for anatase, respectively. The BCP values along the Ti-O bond directions were still found near the midpoints but were slightly smaller, reflecting the shortened bond lengths. Larger Bader charges from the r2SCAN calculations indicated a significantly greater charge transfer from Ti to O, leaving much fewer residual electrons at the cation. Fewer electrons remaining at Ti were further confirmed by the local projection of partial charges within the muffin-tin sphere. The charge analysis showed that the d occupancies of all TiO2 phases calculated using the r2SCAN functional were indeed smaller than those calculated using the PBE functional (Supplementary Materials, Table S2). Thus, the r2SCAN functional yielded more ionic characteristics for both the rutile and anatase phases of TiO2 compared to the PBE functional, even without the Hubbard correction applied.
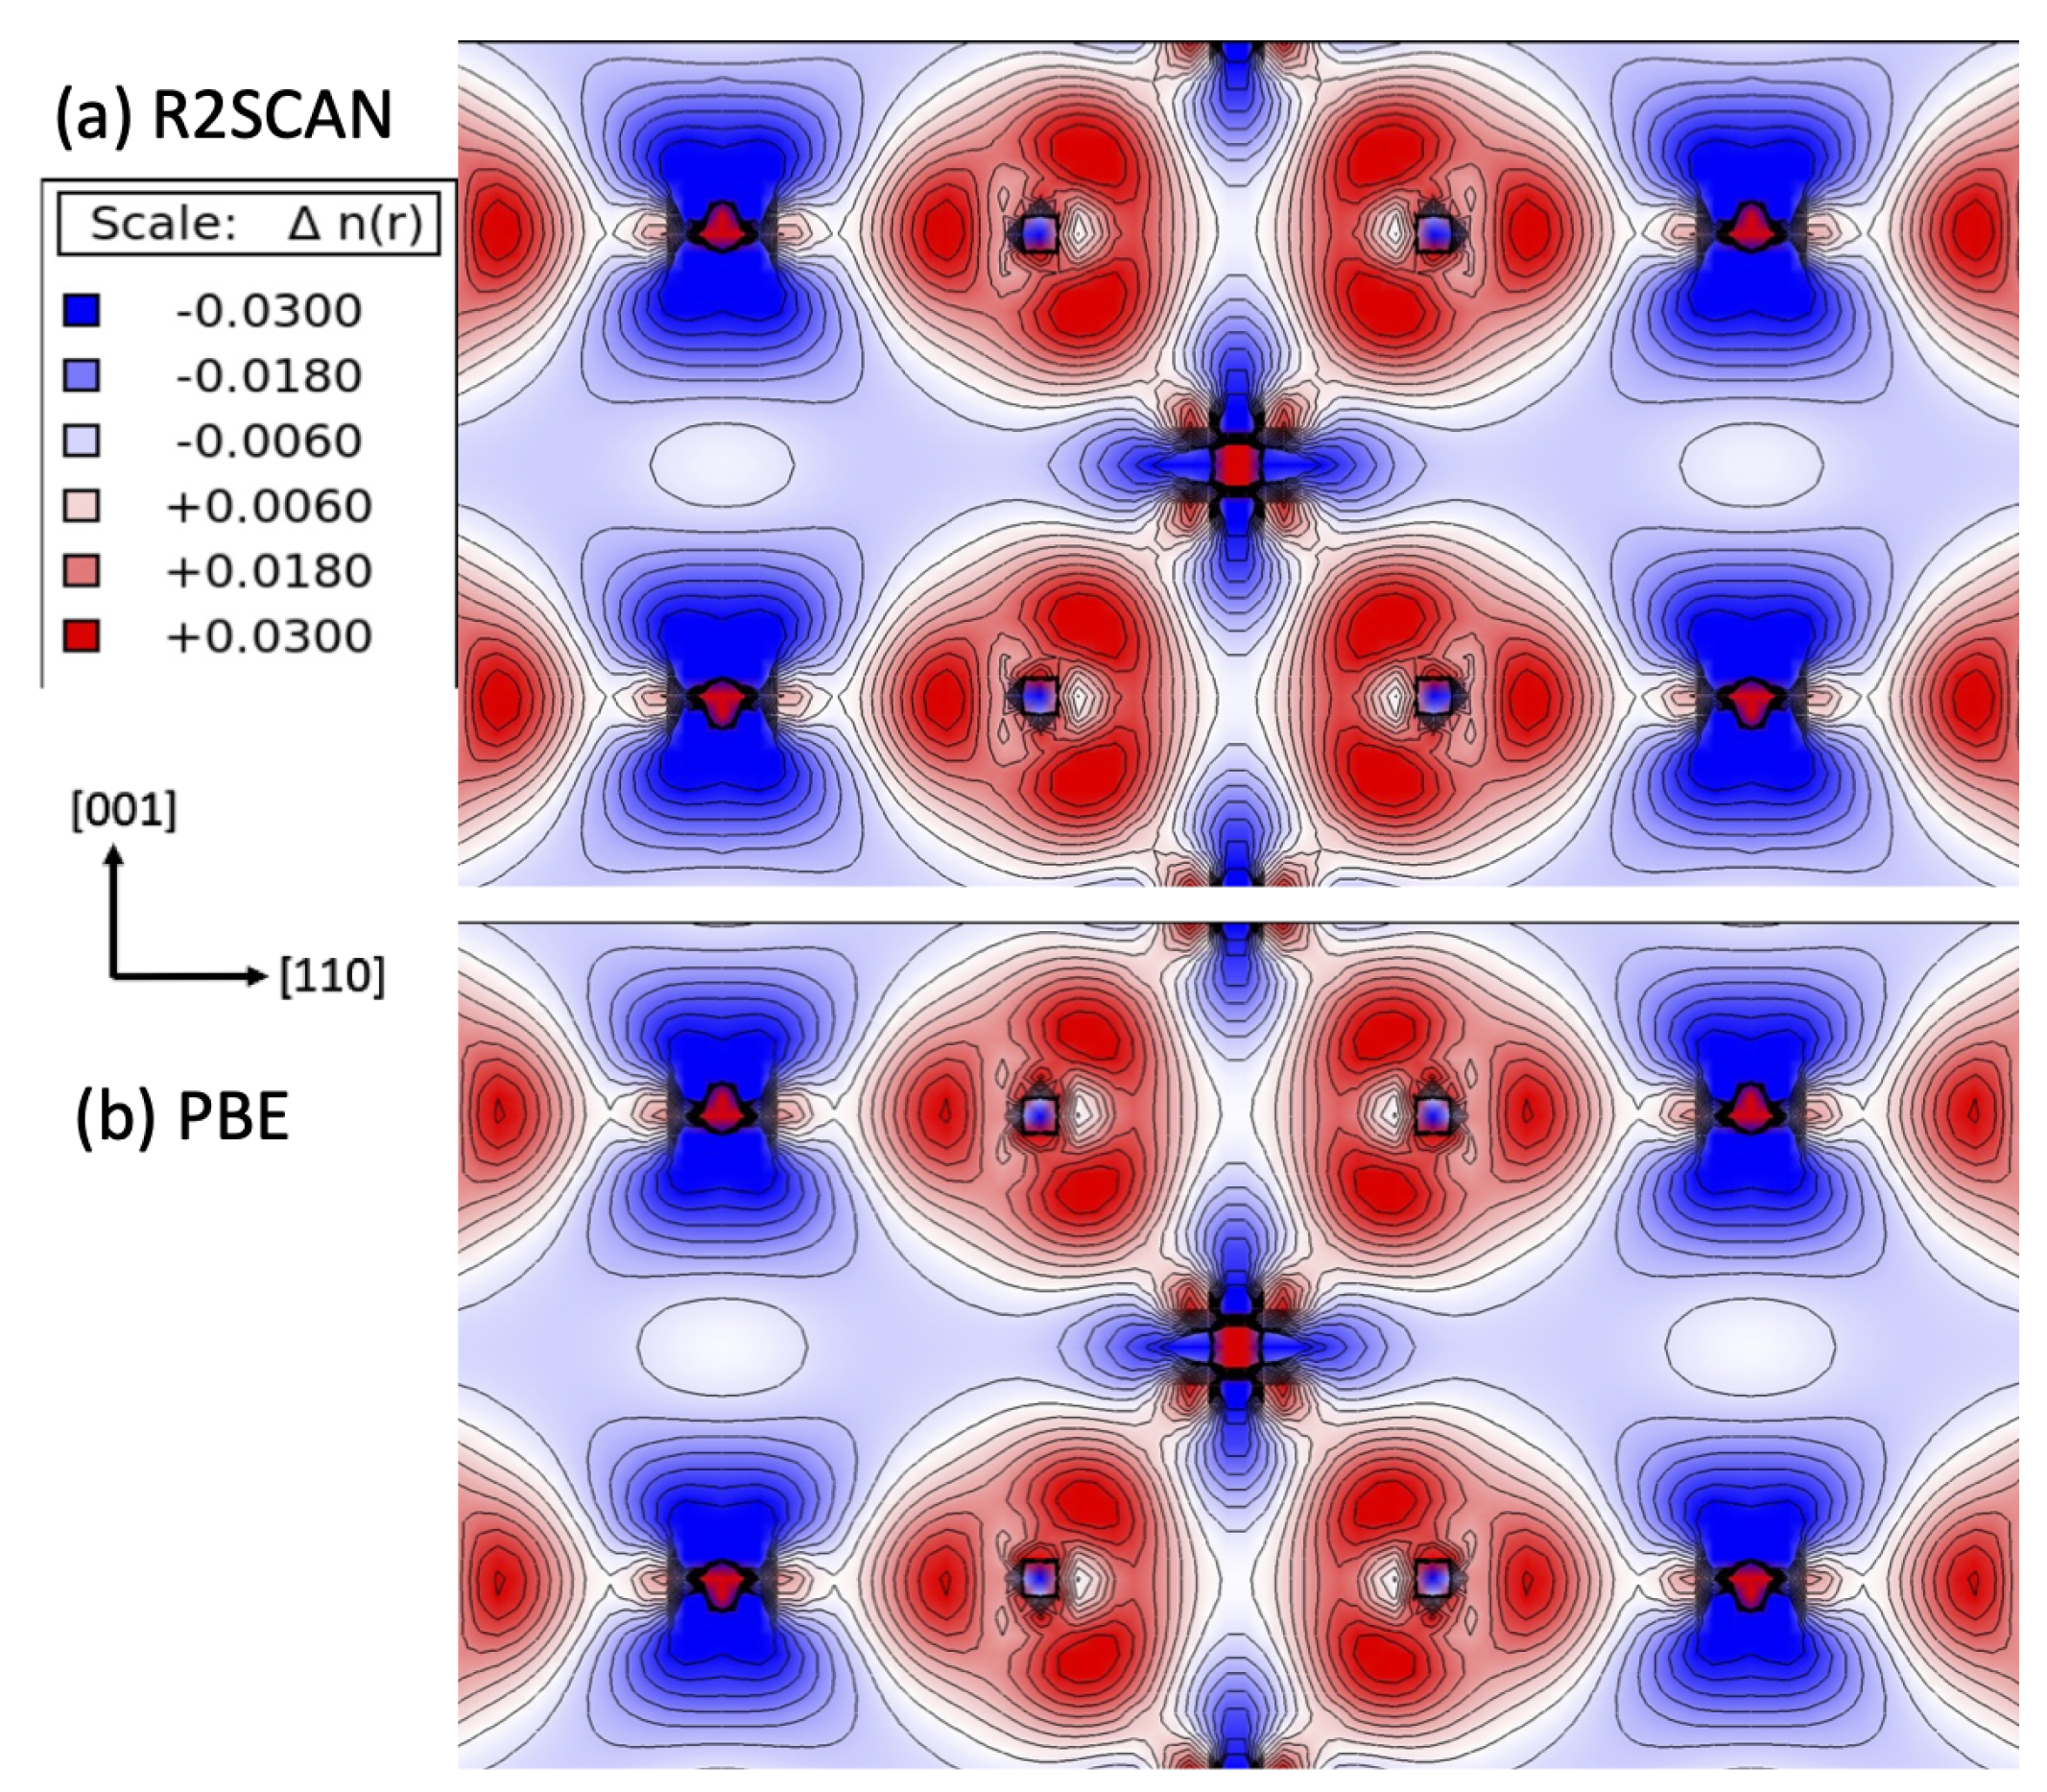
The stronger ionic nature predicted from the r2SCAN calculations can be also appreciated by studying the difference electron density plot, which displays the difference in the electron density between the crystal and the superposed atoms. In Figure 7, the difference electron density plots for rutile are compared using (a) the r2SCAN and (b) the PBE functionals. With the r2SCAN functional, the s p 2 -type bonding regions centered at O in the planar O-Ti3 cluster were clearly enlarged, indicating a greater electron excess around O. Correspondingly, the charge-deficient regions (blue) at Ti, reflecting the t 2 g -type orbital symmetry ( d x y , d y z , d z x ), were likewise enhanced. In addition, the excess charge densities were diminished along the Ti-O bond directions: Ti-O(1) (apical O) and Ti-O(2) (equatorial O). The analysis of the Ti partial charges, calculated by integrating the projected density of states (PDOS), indeed revealed that the occupation numbers in the eg-type orbital symmetry ( d z 2 , d x 2 y 2 ), as well as in the total d population, were considerably lower than what the PBE predicted (see Table S3 and Figure S3 for rutile and Table S4 and Figure S4 for anatase in the Supplementary Materials).
The redistribution of charges around Ti and O observed in the r2SCAN calculations can be understood as a consequence of the improved exchange–correlation energy using the dimensionless kinetic energy variable α ¯ . The variable α ¯ (c.f. α in SCAN) measures the deviation in the charge distribution from that of a single orbital (Equation (2) in Section 3) [52]. Thus, it is closely related to the electron density and the electron localization function [70]. In the atomic shell regions of a high electron density, α is much less than 1, as demonstrated in closed-shell atomic systems, e.g., Ar2 [71] and Kr2 [52], as well as hydrogenic anions [72]. In the s p 2 -type bonding region centered at the anionic O2− of TiO2 (Figure 7), α is expected to be less than 1 as well, with a small density gradient, s, and a high electron density. This is the regime in which the SCAN exchange enhancement factor F x ( s , α ) is enhanced compared to the one used in the PBE with α < 1 and a small s [42]. Since the exchange energy E x [ n ] = d 3 r n ε x u n i f ( n ) F x ( s ) is made negative by a construction with ε x u n i f ( n ) = π ( 3 π 2 n ) 1 / 3 < 0 and F x ( s ) > 0 , the total energy is lowered, with a larger charge accumulation at O and hence more depletion at Ti.
Similarly, the charge reduction along the Ti-O bond directions observed in the r2SCAN calculation (Figure 7a) can be explained by the changes in the enhancement factor caused by α . The bond center between Ti and O is analogous to a region of density overlap between closed shells. With a relatively small density gradient, the von Weizsäcker kinetic energy density should be small, e.g., τ W 0 . Consequently, α becomes like τ / τ u n i f n / n 5 / 3 , which results in α 1 with n 0 [71]. In this case, the exchange enhancement factor in r2SCAN is expected to be smaller than that used in the PBE [42].
Along with the redistribution of charges, the improvement in predicting the lattice parameters over the PBE can be traced back to the modified enhancement factor for the r2SCAN exchange correlational functional as well. The typical overestimation of the bond lengths in various GGAs has been understood as a consequence of density inhomogeniety (e.g., a larger density gradient, s) favored by the gradient corrections [73,74]. The enhancement factor F x in r2SCAN does not increase monotonically, unlike in GGA [42]. Rather it remains at the much smaller conjectured value of 1.174 for all values of α , in contrast to the general Lieb–Oxford bound of 1.804 used in the PBE [75]. These changes in the enhancement factor, along with the flexibility afforded by α , enable the SCAN calculations to alleviate the systematic overestimation of the lattice constants observed in the PBE.
Table 3 compares various bond lengths calculated using the r2SCAN and the PBE functionals for rutile and anatase. The bond lengths of 1.986 Å and 1.987 Å between Ti and apical oxygen O(1) for rutile and anatase, respectively, were significantly shorter than 2.005 Å and 2.004 Å. Likewise, the bond lengths of 1.947 Å and 1.934 Å between Ti and equatorial oxygen O(2) for rutile and anatase, respectively, were also closer to the experimental values. Furthermore, it should be noted that the distances between planar oxygen anions were decreased, for example, in rutile from 2.560 Å calculated using the PBE to 2.535 Å calculated using r2SCAN, very close to the experimental value of 2.537 Å. The shortened oxygen anion distance is consistent with the capability of SCAN to describe properly non-covalent bonds between two closed shells, for example, van der Waals interactions among highly polarizable oxygen anions [71].
The Hubbard-corrected DFT approach based upon r2SCAN also reaps the benefits of the improvement that the exchange–correlation functional brings. A more ionic nature for TiO2 calculated using the r2SCAN functional allows for a much smaller Hubbard U value in order to achieve a comparable effect to that observed in the PBE+U method. The Hubbard correction raises the d orbital energies according to their occupancies (Equation (6) in Section 3). For a band less than half-filled, such as in TiO2, the correction empties the localized band, subsequently increasing the ionicity. With a very modest value of U = 2.5 eV, the Bader charges for Ti and O increased to +2.46e and −1.23e, respectively, for rutile and similarly to +2.44e and −1.22e, respectively, for anatase in the r2SCAN+U calculations (Table 2). Similar increases in the Bader charge and depletion in the d occupancies were observed for other high-pressure phases of TiO2 upon the application of the Hubbard correction (Table S2 in the Supplementary Materials). The Bader charges from the the r2SCAN+U calculations were identical to those obtained using the much larger value of U = 6 eV in the PBE+U calculations. In our previous study using the PBE+U method [41], we noted that the increased ionicity with the Hubbard correction is directly related to the relative stability of rutile and anatase. The enhanced ionic character of TiO2 due to the on-site U term increased the magnitude of the Madelung energy for both, as expected. However, the Madelung energy for rutile increased more rapidly, lowering the total energy further below that of anatase, therefore reversing the relative energetics between rutile and anatase.
A ramification of the small U used in the r2SCAN+U calculations was the smaller expansion of the bond distances for rutile and anatase due to the Hubbard correction. Several bond distances for rutile and anatase are compared between the r2SCAN+U and the PBE+U calculations using R m t (Ti) = 1.78 aB in Table 3. Both r2SCAN+U(2.5 eV) and the PBE+U(6 eV) calculation showed that the bond distance Ti-O(1) between Ti and apical O remained nearly identical to the values without the Hubbard U interaction term. However, the bond distance Ti-O(2) between Ti and equatorial O extended more pronouncedly with an increasing U. In our previous study [41], the increased Ti-O(2) bond length with a larger U value was attributed to the increased ionicity resulting from the additional charge transfer caused by the application of the U term. The elongated bond length especially contributed to the larger lattice constant c for rutile and larger lattice constants a and b for anatase. In the r2SCAN+U calculations, the lattice constants similarly increased with an increasing U value (Table S5 in the Supplementary Materials). However, because a smaller U value, e.g., 2.5 eV, was sufficient, the Ti-O(2) bond only increased by 0.005 to 0.006 Å for rutile and anatase, respectively, in the r2SCAN+U calculation. On the contrary, the PBE+U calculation with U = 6 eV increased the same bond length by about 0.013 to 0.014 Å.
Interestingly, the O-O bond distance along [ 1 1 ¯ 0 ] in rutile remained nearly identical, increasing from 2.535 to 2.536 Å upon applying the Hubbard correction U = 2.5 eV in the r2SCAN+U calculation, just as it only increased by 0.003 Å in the PBE+U calculation. Little or no changes in the O-O and Ti-O(1) bond distances were consistent with the observation that the lattice constant a of rutile is relatively insensitive to the increase in U. However, the O-O bond distance of 2.560 Å obtained from the PBE+U calculation was significantly larger than the 2.536 Å obtained from the r2SCAN+U calculation, as well as the experimental value of 2.537 Å. For anatase, the O-O bond distance in the approximate equatorial plane increased modestly from 2.797 to 2.805 Å upon the application of U = 2.5 eV in the r2SCAN+U calculation. Using PBE+U with U = 6 eV, the O-O bond distance increased much more significantly from 2.822 to 2.839 Å. Consequently, the elongated O-O and Ti-O(2) bond lengths generated a markedly poor agreement in the lattice constants a and b of anatase with the corresponding experimental values, as the larger U value was used in the PBE+U calculation.
The overestimation of the bond lengths especially became worse when a larger projection space and a larger U value were employed together. For R m t (Ti) = 2.2 aB, the r2SCAN+U calculations for rutile and anatase still correctly predicted the higher stability of rutile over anatase with the small U = 2.5 eV. The Ti-O(1) and Ti-O(2) bond lengths for the corresponding rutile structure were slightly overestimated by 0.011 and 0.022 Å, respectively, in comparison with experimental values (Table 3). For anatase, the bond lengths were similarly greater by only 0.022 and 0.014 Å. Accordingly, the lattice constants increased rather moderately (Table S5 in the Supplementary Materials). On the other hand, for PBE+U, rutile became more stable than anatase with U = 7.7 eV. With the large U value, the PBE+U calculations overestimated the Ti-O(1) and Ti-O(2) bond lengths of the corresponding rutile by as much as 0.045 and 0.042 Å, respectively (Table 3). For anatase, the bond lengths were likewise substantially greater by 0.014 and 0.037 Å. The deviation of the structural parameters from the experimental values was exacerbated not only by the relatively large U value necessary for the PBE+U calculations but also by the larger R m t (Ti) value used.
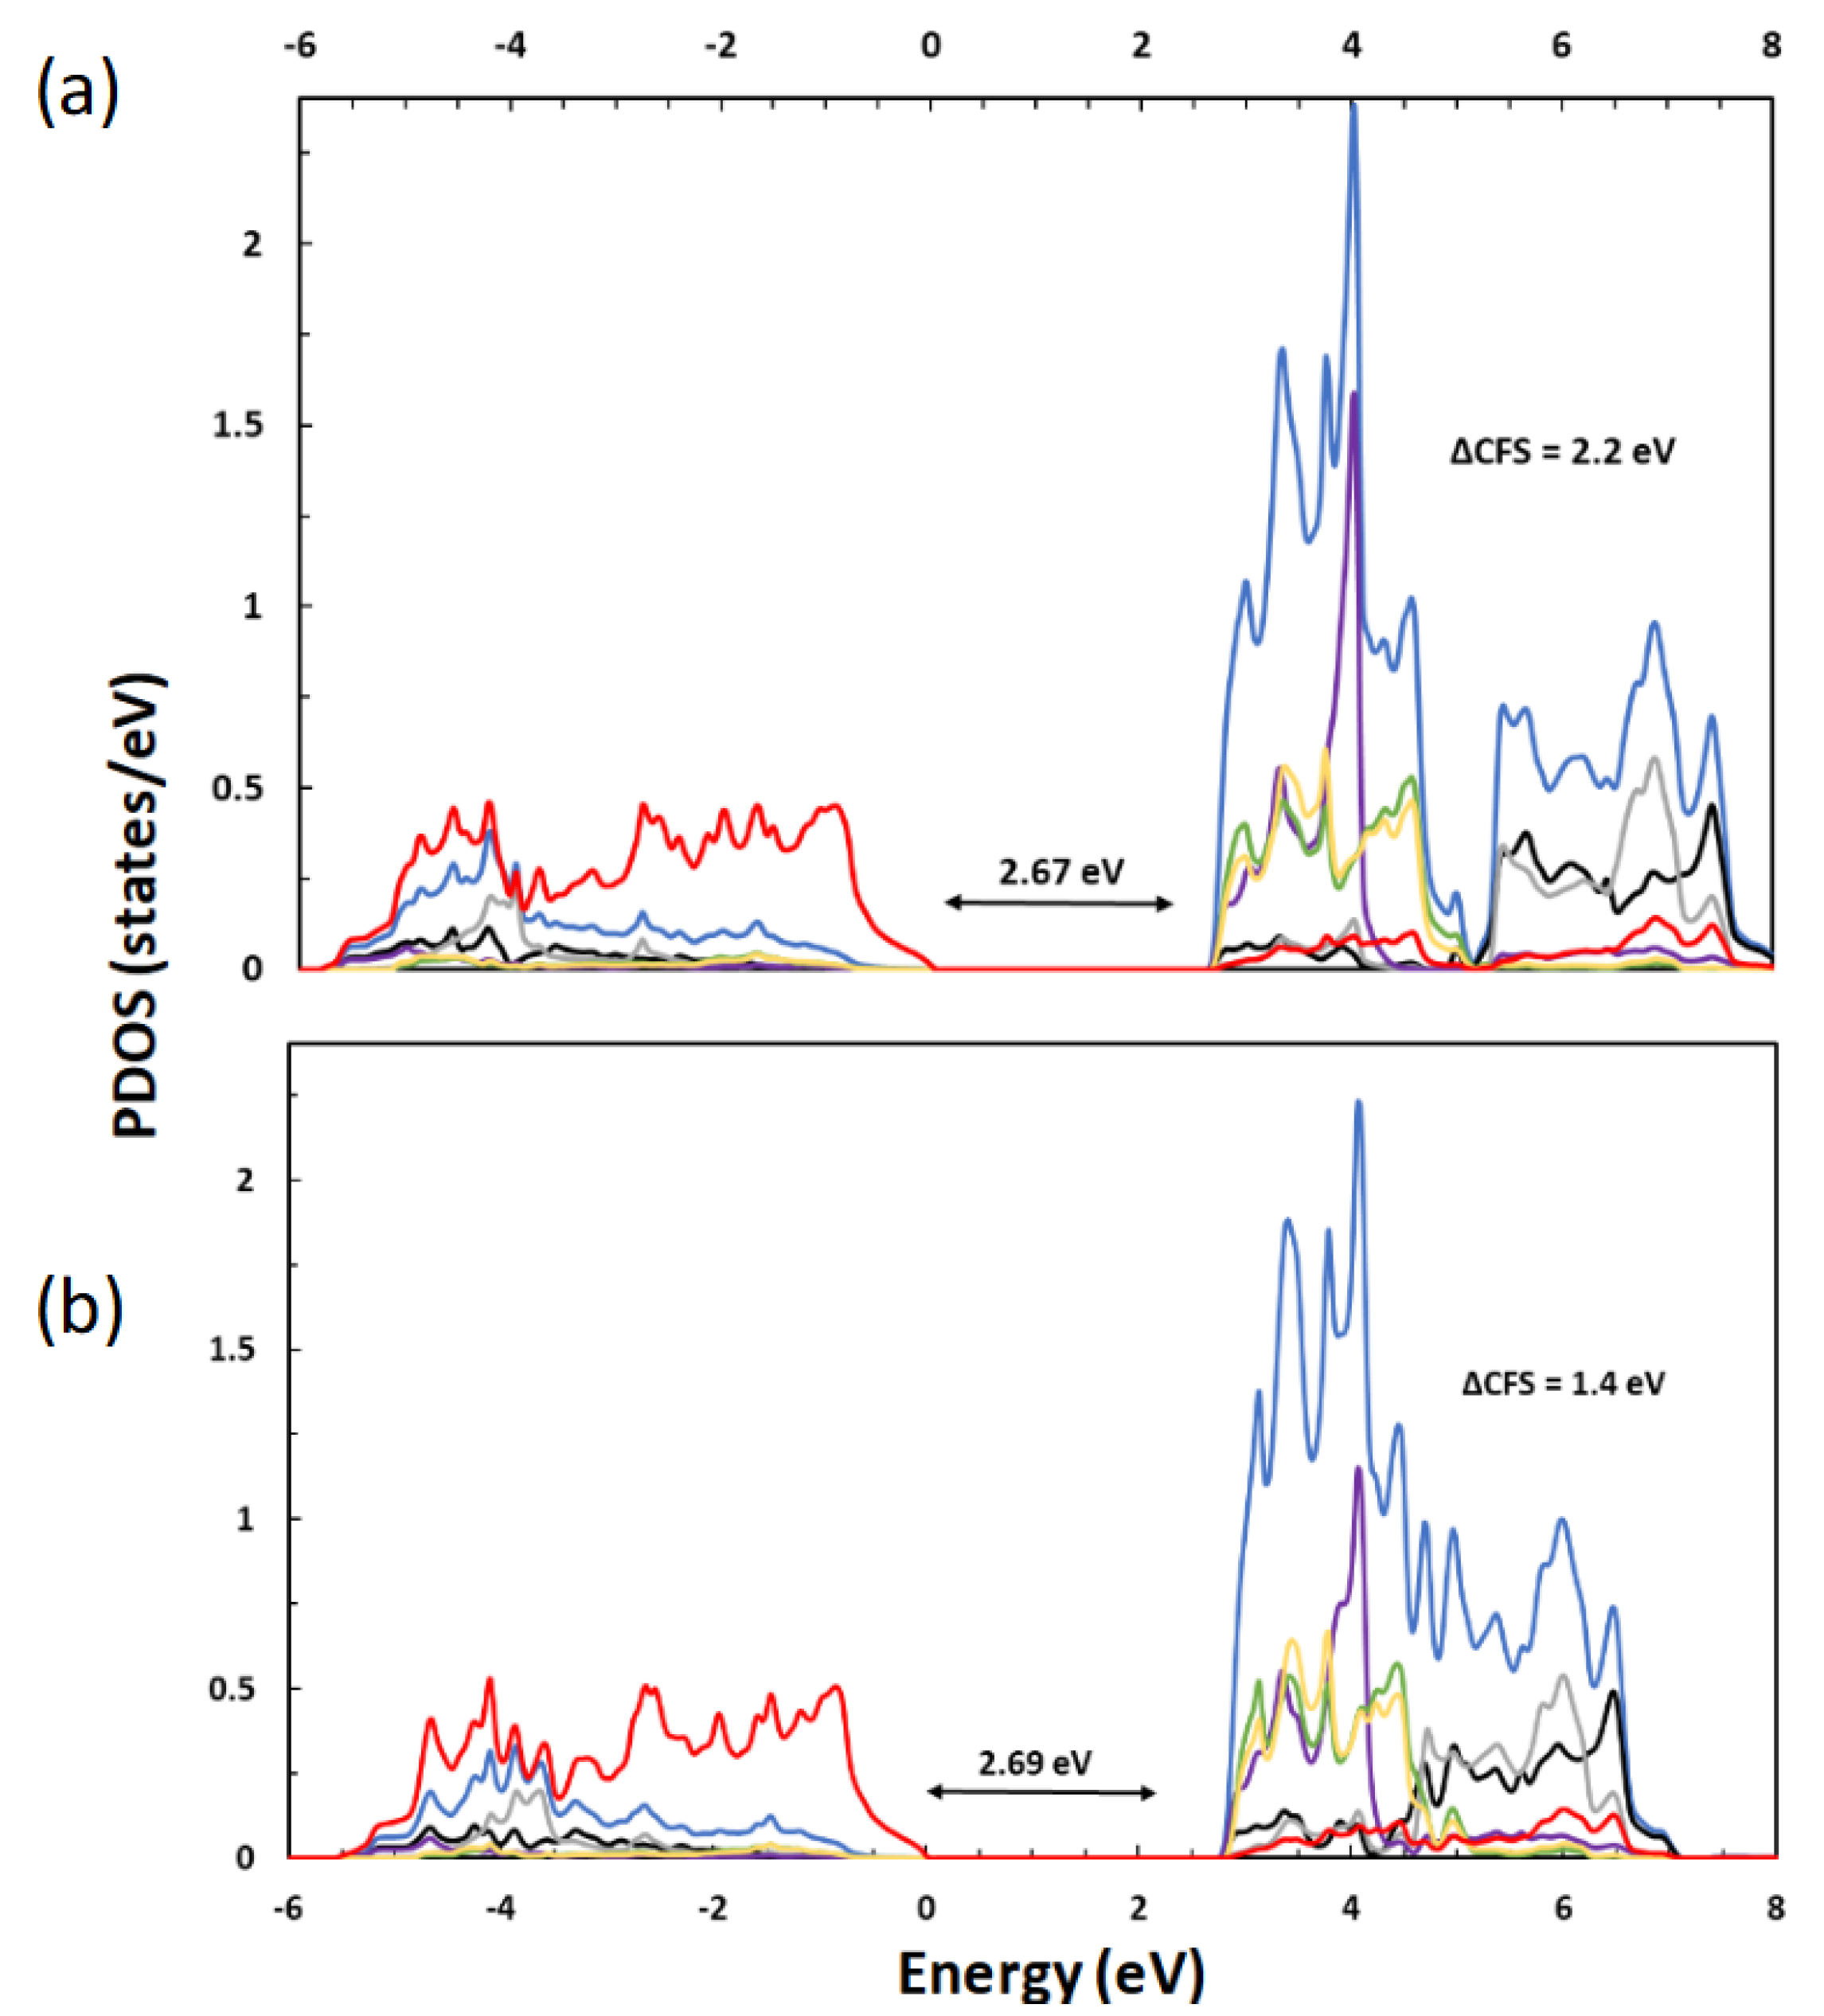
Finally, the smaller U value used in the r2SCAN+U calculations provided a better account of the crystal field splitting (CFS) between the t 2 g and eg bands in the electronic structure, compared to the larger U in the PBE+U calculation. Figure 8 exhibits the projected density of states, calculated using (a) the r2SCAN functional with U = 2.5 eV and (b) the PBE functional with U = 7.7 eV. The particular U values were chosen to have the correct stabilities of rutile and anatase shown in Figure 6b with the large projection space ( R m t (Ti) = 2.2 aB). Both the r2SCAN+U and PBE+U methods produced almost identical band gaps of 2.67 and 2.69 eV, respectively, between the O 2p-dominated valence bands and mainly Ti 3d-derived conduction bands. However, the CFS between the t 2 g and eg bands showed a more pronounced contrast: 2.2 eV from the r2SCAN+U calculation vs. 1.4 eV from the PBE+U calculation. The difference results from the asymmetrical potential energy shifts between the t 2 g and eg bands upon the application of the Hubbard interaction [41]. The largely empty t 2 g bands shift by a much greater extent than the eg bands, which are substantially occupied as they participate in bonding with O. The uneven shift is proportional to the U value (Equation (6) in Section 3), so the PBE+U method, which requires a relatively large U value, produces a significantly larger deviation from the experimental value of 2.6 eV [76].

3. Methods

The calculations were carried out using the all-electron augmented plane wave (APW) and local orbital program, implemented in Wien2k [77,78]. In the APW scheme, the unit cell was divided into non-overlapping muffin-tin (MT) spheres and interstitial regions. Inside the MT spheres, which were centered at atoms, a linear combination of radial functions multiplied by spherical harmonics was used for basis functions. In the interstitial regions, a plane wave expansion was employed. The core states were fully localized within the MT sphere and distinguished from valence states with an energy separation of −6.0 Ry or larger. The value of the energy cutoff resulted in Ti 3s and 3p being semicore states and Ti 3d and 4s as well as O 2s and 2p being valence states. The core electrons were treated fully relativistically using the Dirac–Fock method. The valence electrons were treated with a scalar relativistic approach.
For the exchange–correlation effect, the PBE functional was used at the GGA level, serving as a reference. For the meta-GGA level, a regularized–restored strongly constrained appropriately normed (r2SCAN) functional [52] was utilized and compared to the PBE. r2SCAN makes use of the dimensionless variable α ¯ :
α ¯ = τ ( r ) τ W ( r ) τ U E G ( r ) + η τ W ( r ) ,
where τ ( r ) = 1 2 i | ψ i | 2 is the positive definite kinetic energy density with the Kohn–Sham orbitals ψ i ( r ) . τ W ( r ) = | n | 2 / 8 n is the von Weizsäcker kinetic energy density [42,44]. τ U E G ( r ) = 3 ( 3 π 2 ) 2 / 3 n 5 / 3 / 10 is the kinetic energy density of a uniform electron gas. α ¯ is modified from α = τ τ W / τ U E G in SCAN by η = 10 3 , which is a simple regularization parameter. The correct uniform and non-uniform scaling properties are obtained using the α ¯ -driven interpolation function as α ¯ 1, 0, or for the metallic (uniform density), single covalent, or weak bond limits, respectively [42]. For the present study, the r2SCAN calculations were performed self-consistently. In the self-consistent implementation in Wien2k [79], the exchange–correlation potential was derived by taking the functional derivative with respect to the Kohn–Sham orbital, using the optimized effective potential method within the generalized Kohn–Sham (gKS) framework.
The muffin-tin radii ( R M T ) for Ti and O were initially chosen to be 1.78 and 1.61 bohrs (aB), respectively. For the investigation of the structures compressed to high pressures, they were reduced by about 5%. The accuracy of the calculation was controlled by a dimensionless cutoff parameter, R M T K m a x , which determined the size of the basis from the product of the smallest R M T value and the largest K vector in the plane wave expansion. Because the energy difference between the TiO2 polymorphs can be small, the convergence of the calculated energy with respect to various parameters was carefully checked. The value of R M T K m a x was increased up to 9 and the Brillouin Zone was sampled from 700 to 2000 points for convergence. For the PBE, a Fourier cutoff value of G m a x = 16 was sufficient, whereas for r2SCAN, a larger value, up to G m a x = 28 , was tested to ensure the total energy convergence [79].
The electron correlation effect of d electrons was taken into account using the orbital-dependent potential formulated in the Hubbard on-site interaction term [80]. The interaction is based on a rotationally or unitary transformation-invariant formulation [81].
E H u b { n m m } = 1 2 { m } , σ { m , m | V e e | m , m n m m σ n m m σ + ( m , m | V e e | m , m m , m | V e e | m , m ) n m m σ n m m σ } ,
where n m m σ is the density matrix for correlated electrons with the magnetic quantum number of the orbital angular momentum l and spin index σ , and V e e are the screened Coulomb interactions. Because the standard density functional approximations already include the part of the interaction energy which the Hubbard model aims to better describe, it must be subtracted via the double-counting term E d c . The most widely employed method of eliminating double counting for a strongly correlated insulating system was chosen [80]:
E d c { n m m } = U 2 n ( n 1 ) J 2 n ( n 1 ) n ( n 1 ) ,
where n σ = T r ( n m m σ ) and n = n + n are the total occupation numbers of localized orbitals.
The interaction energy can be further simplified by keeping only the lowest order Slater integral F0 [67,82] when evaluating the interaction matrix elements m , m | V e e | m , m . Under this isotropic scheme of the DFT+U, the Hubbard correction with the double-counting term included is written as
E H u b = σ U e f f 2 T r n σ ( 1 n σ )
with U e f f regarded as an effective parameter including the exchange J, such that U e f f = U J . Consequently, through differentiation with respect to each orbital occupancy, one obtains the additional orbital-dependent potential energy:
V m σ = U e f f 1 2 n m σ
In this study, the orbital-dependent correction obtained using Equation (6) was applied to the localized orbitals described by the basis function within the augmentation sphere defined by R M T . Throughout the paper, U e f f is referred to simply as U.
For PBE and PBE+U calculations, the lattice parameters and the ionic positions were fully relaxed. The internal coordinates were optimized by minimizing the forces (1 mRy/au) acting on the atoms. For r2SCAN, the calculation of forces was not possible due to the fact that the core and valence electrons were treated using inconsistent potentials as implemented in Wien2k [79]. For the core electrons, a GGA exchange–correlation potential was used to obtain the Hamiltonian matrix elements. However, the valence electrons were treated in a fully self-consistent manner using the meta-GGA potential in the gKS scheme. Hence, only the lattice parameters were optimized for r2SCAN and r2SCAN+U calculations, using the internal coordinates derived from PBE and PBE+U calculations.

4. Conclusions

In summary, we have investigated various phases of TiO2 across different pressure ranges using the r2SCAN functional and performed the Hubbard-corrected r2SCAN+U calculations to study the relative stability between rutile and anatase in particular. The equilibrium lattice parameters calculated by the r2SCAN functional were generally in excellent agreement with the experimental values for the TiO2 phases. The total energy calculations produced an order of stability of anatase < rutile < columbite < baddeleyite < orthorhombic I < cotunnite, as in the calculations using the PBE functional. However, the inclusion of the Hubbard correction term with a much smaller value of U, compared to the PBE+U calculations, yielded the correct ordering of rutile and anatase. Although the r2SCAN+U method also showed a dependence on the size of the local projection space used in the Hubbard correction, the dependence was much less sensitive compared to the PBE+U method. The relatively weak sensitivity to the projection space size is attributed to the improvement in the r2SCAN functional, permitting a smaller U value to be used. The better description of the structural parameters, electronic structures, and charge distributions afforded by a relatively modest value of U suggests that the r2SCAN functional can be a promising choice in the Hubbard-corrected DFT approach.

Supplementary Materials

The following supporting information can be downloaded at https://www.mdpi.com/article/10.3390/molecules30030560/s1.

Author Contributions

Conceptualization, J.P. and K.P.; methodology, J.P. and L.B.; software, J.P., M.R., L.B. and K.P.; validation, L.B. and M.R.; formal analysis, J.P. and L.B.; investigation, J.P. and M.R.; resources, K.P.; data curation, J.P. and K.P.; writing—original draft preparation, J.P. and K.P.; writing—review and editing, K.P.; visualization, J.P. and M.R.; supervision, K.P.; project administration, K.P. All authors have read and agreed to the published version of the manuscript.

Funding

This research received no external funding.

Institutional Review Board Statement

Not applicable.

Informed Consent Statement

Not applicable.

Data Availability Statement

The original contributions presented in this study are included in the article/Supplementary Material. Further inquiries can be directed to the corresponding author.

Acknowledgments

J.P. and M.R. are thankful for the travel support from the Department of Physics and the School of Graduate Studies of Baylor University. L.B. is grateful for the support from the Summer Undergraduate Research in Physics. The authors thank C. Bell at the High Performance Computing Center of Baylor University for providing technical support.

Conflicts of Interest

The authors declare no conflicts of interest.

References

  1. Fujishima, A.; Honda, K. Electrochemical photolysis of water at a semiconductor electrode. Nature 1972, 238, 37–38. [Google Scholar] [CrossRef]
  2. Grätzel, M. Dye-sensitized solar cells. J. Photochem. Photobiol. C Photochem. Rev. 2003, 4, 145–153. [Google Scholar] [CrossRef]
  3. Chen, X.; Liu, L.; Yu, P.Y.; Mao, S.S. Increasing solar absorption for photocatalysis with black hydrogenated titanium dioxide nanocrystals. Science 2011, 331, 746–750. [Google Scholar] [CrossRef] [PubMed]
  4. Matsubu, J.C.; Zhang, S.; DeRita, L.; Marinkovic, N.S.; Chen, J.G.; Graham, G.W.; Pan, X.; Christopher, P. Adsorbate-mediated strong metal–support interactions in oxide-supported Rh catalysts. Nat. Chem. 2017, 9, 120–127. [Google Scholar] [CrossRef] [PubMed]
  5. Chong, M.N.; Jin, B.; Chow, C.W.; Saint, C. Recent developments in photocatalytic water treatment technology: A review. Water Res. 2010, 44, 2997–3027. [Google Scholar] [CrossRef]
  6. Guo, Q.; Zhou, C.; Ma, Z.; Yang, X. Fundamentals of TiO2 photocatalysis: Concepts, mechanisms, and challenges. Adv. Mater. 2019, 31, 1901997. [Google Scholar] [CrossRef] [PubMed]
  7. Lang, R.; Du, X.; Huang, Y.; Jiang, X.; Zhang, Q.; Guo, Y.; Liu, K.; Qiao, B.; Wang, A.; Zhang, T. Single-atom catalysts based on the metal–oxide interaction. Chem. Rev. 2020, 120, 11986–12043. [Google Scholar] [CrossRef] [PubMed]
  8. O’regan, B.; Grätzel, M. A low-cost, high-efficiency solar cell based on dye-sensitized colloidal TiO2 films. Nature 1991, 353, 737–740. [Google Scholar] [CrossRef]
  9. Lee, K.; Mazare, A.; Schmuki, P. One-dimensional titanium dioxide nanomaterials: Nanotubes. Chem. Rev. 2014, 114, 9385–9454. [Google Scholar] [CrossRef]
  10. Wen, J.; Li, X.; Liu, W.; Fang, Y.; Xie, J.; Xu, Y. Photocatalysis fundamentals and surface modification of TiO2 nanomaterials. Chin. J. Catal. 2015, 36, 2049–2070. [Google Scholar] [CrossRef]
  11. Matsubu, J.C.; Yang, V.N.; Christopher, P. Isolated metal active site concentration and stability control catalytic CO2 reduction selectivity. J. Am. Chem. Soc. 2015, 137, 3076–3084. [Google Scholar] [CrossRef] [PubMed]
  12. Xu, J.; Sun, L.; Qi, X.; Wang, Z.; Fu, Q.; Pan, C. A novel strategy to enhance the multiple interface effect using amorphous carbon packaged hydrogenated TiO2 for stable and effective microwave absorption. J. Mater. Chem. C 2019, 7, 6152–6160. [Google Scholar] [CrossRef]
  13. Burdett, J.K.; Hughbanks, T.; Miller, G.J.; Richardson, J.W., Jr.; Smith, J.V. Structural-electronic relationships in inorganic solids: Powder neutron diffraction studies of the rutile and anatase polymorphs of titanium dioxide at 15 and 295 K. J. Am. Chem. Soc. 1987, 109, 3639–3646. [Google Scholar] [CrossRef]
  14. Howard, C.; Sabine, T.; Dickson, F. Structural and thermal parameters for rutile and anatase. Acta Crystallogr. Sect. B Struct. Sci. 1991, 47, 462–468. [Google Scholar] [CrossRef]
  15. Abrahams, S.; Bernstein, J. Rutile: Normal probability plot analysis and accurate measurement of crystal structure. J. Chem. Phys. 1971, 55, 3206–3211. [Google Scholar] [CrossRef]
  16. Cromer, D.T.; Herrington, K. The structures of anatase and rutile. J. Am. Chem. Soc. 1955, 77, 4708–4709. [Google Scholar] [CrossRef]
  17. Arlt, T.; Bermejo, M.; Blanco, M.; Gerward, L.; Jiang, J.; Olsen, J.S.; Recio, J. High-pressure polymorphs of anatase TiO2. Phys. Rev. B 2000, 61, 14414. [Google Scholar] [CrossRef]
  18. Dubrovinskaia, N.A.; Dubrovinsky, L.S.; Ahuja, R.; Prokopenko, V.B.; Dmitriev, V.; Weber, H.P.; Osorio-Guillen, J.; Johansson, B. Experimental and theoretical identification of a new high-pressure TiO2 polymorph. Phys. Rev. Lett. 2001, 87, 275501. [Google Scholar] [CrossRef]
  19. Dubrovinsky, L.S.; Dubrovinskaia, N.A.; Swamy, V.; Muscat, J.; Harrison, N.M.; Ahuja, R.; Holm, B.; Johansson, B. The hardest known oxide. Nature 2001, 410, 653–654. [Google Scholar] [CrossRef] [PubMed]
  20. Gerward, L.; Staun Olsen, J. Post-rutile high-pressure phases in TiO2. J. Appl. Crystallogr. 1997, 30, 259–264. [Google Scholar] [CrossRef]
  21. Valiev, R.Z.; Estrin, Y.; Horita, Z.; Langdon, T.G.; Zechetbauer, M.J.; Zhu, Y.T. Producing bulk ultrafine-grained materials by severe plastic deformation. JOM 2006, 58, 33–39. [Google Scholar] [CrossRef]
  22. Edalati, K.; Daio, T.; Ikoma, Y.; Arita, M.; Horita, Z. Graphite to diamond-like carbon phase transformation by high-pressure torsion. Appl. Phys. Lett. 2013, 103, 034108. [Google Scholar] [CrossRef]
  23. Edalati, K.; Daio, T.; Arita, M.; Lee, S.; Horita, Z.; Togo, A.; Tanaka, I. High-pressure torsion of titanium at cryogenic and room temperatures: Grain size effect on allotropic phase transformations. Acta Mater. 2014, 68, 207–213. [Google Scholar] [CrossRef]
  24. Edalati, K.; Arimura, M.; Ikoma, Y.; Daio, T.; Miyata, M.; Smith, D.J.; Horita, Z. Plastic deformation of BaTiO3 ceramics by high-pressure torsion and changes in phase transformations, optical and dielectric properties. Mater. Res. Lett. 2015, 3, 216–221. [Google Scholar] [CrossRef]
  25. Razavi-Khosroshahi, H.; Edalati, K.; Hirayama, M.; Emami, H.; Arita, M.; Yamauchi, M.; Hagiwara, H.; Ida, S.; Ishihara, T.; Akiba, E.; et al. Visible-light-driven photocatalytic hydrogen generation on nanosized TiO2-II stabilized by high-pressure torsion. ACS Catal. 2016, 6, 5103–5107. [Google Scholar] [CrossRef]
  26. Momma, K.; Izumi, F. VESTA 3 for three-dimensional visualization of crystal, volumetric and morphology data. J. Appl. Crystallogr. 2011, 44, 1272–1276. [Google Scholar] [CrossRef]
  27. Muscat, J.; Swamy, V.; Harrison, N.M. First-principles calculations of the phase stability of TiO2. Phys. Rev. B 2002, 65, 224112. [Google Scholar] [CrossRef]
  28. Al-Khatatbeh, Y.; Lee, K.K.; Kiefer, B. High-pressure behavior of TiO2 as determined by experiment and theory. Phys. Rev. B 2009, 79, 134114. [Google Scholar] [CrossRef]
  29. Ma, X.; Liang, P.; Miao, L.; Bie, S.; Zhang, C.; Xu, L.; Jiang, J. Pressure-induced phase transition and elastic properties of TiO2 polymorphs. Phys. Status Solidi (b) 2009, 246, 2132–2139. [Google Scholar] [CrossRef]
  30. Wu, X.; Holbig, E.; Steinle-Neumann, G. Structural stability of TiO2 at high pressure in density-functional theory based calculations. J. Phys. Condens. Matter 2010, 22, 295501. [Google Scholar] [CrossRef]
  31. Dekura, H.; Tsuchiya, T.; Kuwayama, Y.; Tsuchiya, J. Theoretical and experimental evidence for a new post-cotunnite phase of titanium dioxide with significant optical absorption. Phys. Rev. Lett. 2011, 107, 045701. [Google Scholar] [CrossRef] [PubMed]
  32. Fu, Z.; Liang, Y.; Wang, S.; Zhong, Z. Structural phase transition and mechanical properties of TiO2 under high pressure. Phys. Status Solidi (b) 2013, 250, 2206–2214. [Google Scholar] [CrossRef]
  33. Swamy, V.; Wilson, N.C. First-principles calculations of the pressure stability and elasticity of dense TiO2 phases using the B3LYP hybrid functional. J. Phys. Chem. C 2014, 118, 8617–8625. [Google Scholar] [CrossRef]
  34. Liu, Q.J.; Ran, Z.; Liu, F.S.; Liu, Z.T. Phase transitions and mechanical stability of TiO2 polymorphs under high pressure. J. Alloys Compd. 2015, 631, 192–201. [Google Scholar] [CrossRef]
  35. Dong, H.K.; Li, M.B.; Qi, G.Q.; Xiu, X.M.; Shi, L.B. The structural phase transition and phase stability of TiO2 (P42/nmc) under high pressure from first-principles calculations. Phys. Scr. 2015, 91, 015701. [Google Scholar] [CrossRef]
  36. Basavaraj, K.; Nyayban, A.; Panda, S. Structural phase transitions and elastic properties of TiO2 polymorphs: Ab-initio study. IOP Conf. Ser. Mater. Sci. Eng. 2022, 1248, 012064. [Google Scholar] [CrossRef]
  37. Arroyo-de Dompablo, M.; Morales-García, A.; Taravillo, M. DFT+U calculations of crystal lattice, electronic structure, and phase stability under pressure of TiO2 polymorphs. J. Chem. Phys. 2011, 135, 054503. [Google Scholar] [CrossRef] [PubMed]
  38. Perdew, J.P.; Burke, K.; Ernzerhof, M. Generalized gradient approximation made simple. Phys. Rev. Lett. 1996, 77, 3865. [Google Scholar] [CrossRef] [PubMed]
  39. Perdew, J.P.; Burke, K.; Ernzerhof, M. Perdew, burke, and ernzerhof reply. Phys. Rev. Lett. 1998, 80, 891. [Google Scholar] [CrossRef]
  40. Curnan, M.T.; Kitchin, J.R. Investigating the energetic ordering of stable and metastable TiO2 polymorphs using DFT+U and hybrid functionals. J. Phys. Chem. C 2015, 119, 21060–21071. [Google Scholar] [CrossRef]
  41. Park, K.; Raman, M.; Olatunbosun, A.J.; Pohlmann, J. Revisiting DFT+U calculations of TiO2 and the effect of the local-projection size. AIP Adv. 2024, 14, 065114. [Google Scholar] [CrossRef]
  42. Sun, J.; Ruzsinszky, A.; Perdew, J.P. Strongly constrained and appropriately normed semilocal density functional. Phys. Rev. Lett. 2015, 115, 036402. [Google Scholar] [CrossRef] [PubMed]
  43. Sun, J.; Perdew, J.P.; Ruzsinszky, A. Semilocal density functional obeying a strongly tightened bound for exchange. Proc. Natl. Acad. Sci. USA 2015, 112, 685–689. [Google Scholar] [CrossRef] [PubMed]
  44. Sun, J.; Remsing, R.C.; Zhang, Y.; Sun, Z.; Ruzsinszky, A.; Peng, H.; Yang, Z.; Paul, A.; Waghmare, U.; Wu, X.; et al. Accurate first-principles structures and energies of diversely bonded systems from an efficient density functional. Nat. Chem. 2016, 8, 831–836. [Google Scholar] [CrossRef] [PubMed]
  45. Yang, J.H.; Kitchaev, D.A.; Ceder, G. Rationalizing accurate structure prediction in the meta-GGA SCAN functional. Phys. Rev. B 2019, 100, 035132. [Google Scholar] [CrossRef]
  46. Hinuma, Y.; Hayashi, H.; Kumagai, Y.; Tanaka, I.; Oba, F. Comparison of approximations in density functional theory calculations: Energetics and structure of binary oxides. Phys. Rev. B 2017, 96, 094102. [Google Scholar] [CrossRef]
  47. Zhang, Y.; Kitchaev, D.A.; Yang, J.; Chen, T.; Dacek, S.T.; Sarmiento-Pérez, R.A.; Marques, M.A.; Peng, H.; Ceder, G.; Perdew, J.P.; et al. Efficient first-principles prediction of solid stability: Towards chemical accuracy. NPJ Comput. Mater. 2018, 4, 1–6. [Google Scholar] [CrossRef]
  48. Shahi, C.; Sun, J.; Perdew, J.P. Accurate critical pressures for structural phase transitions of group IV, III-V, and II-VI compounds from the SCAN density functional. Phys. Rev. B 2018, 97, 094111. [Google Scholar] [CrossRef]
  49. Mazumder, J.T.; Mayengbam, R.; Tripathy, S. Theoretical investigation on structural, electronic, optical and elastic properties of TiO2, SnO2, ZrO2 and HfO2 using SCAN meta-GGA functional: A DFT study. Mater. Chem. Phys. 2020, 254, 123474. [Google Scholar] [CrossRef]
  50. Cohen, A.J.; Mori-Sánchez, P.; Yang, W. Insights into current limitations of density functional theory. Science 2008, 321, 792–794. [Google Scholar] [CrossRef] [PubMed]
  51. Mori-Sánchez, P.; Cohen, A.J.; Yang, W. Many-electron self-interaction error in approximate density functionals. J. Chem. Phys. 2006, 125, 201102. [Google Scholar] [CrossRef]
  52. Furness, J.W.; Kaplan, A.D.; Ning, J.; Perdew, J.P.; Sun, J. Accurate and numerically efficient r2SCAN meta-generalized gradient approximation. J. Phys. Chem. Lett. 2020, 11, 8208–8215. [Google Scholar] [CrossRef] [PubMed]
  53. Zhang, Y.; Furness, J.W.; Xiao, B.; Sun, J. Subtlety of TiO2 phase stability: Reliability of the density functional theory predictions and persistence of the self-interaction error. J. Chem. Phys. 2019, 150, 014105. [Google Scholar] [CrossRef] [PubMed]
  54. Niu, M.; Cheng, D.; Cao, D. Fluorite TiO2 (111) surface phase for enhanced visible-light solar energy conversion. J. Phys. Chem. C 2014, 118, 20107–20111. [Google Scholar] [CrossRef]
  55. Jovanovic, D.; Zagorac, D.; Matovic, B.; Zarubica, A.; Zagorac, J. Anion substitution and influence of sulfur on the crystal structures, phase transitions, and electronic properties of mixed TiO2/TiS2 compounds. Acta Crystallogr. Sect. B Struct. Sci. Cryst. Eng. Mater. 2021, 77, 833–847. [Google Scholar] [CrossRef]
  56. Simons, P.Y.; Dachille, F. The structure of TiO2 II, a high-pressure phase of TiO2. Acta Crystallogr. 1967, 23, 334–336. [Google Scholar] [CrossRef]
  57. Olsen, J.S.; Gerward, L.; Jiang, J. On the rutile/α-PbO2-type phase boundary of TiO2. J. Phys. Chem. Solids 1999, 60, 229–233. [Google Scholar] [CrossRef]
  58. Nishio-Hamane, D.; Shimizu, A.; Nakahira, R.; Niwa, K.; Sano-Furukawa, A.; Okada, T.; Yagi, T.; Kikegawa, T. The stability and equation of state for the cotunnite phase of TiO2 up to 70 GPa. Phys. Chem. Miner. 2010, 37, 129–136. [Google Scholar] [CrossRef]
  59. Sorantin, P.I.; Schwarz, K. Chemical bonding in rutile-type compounds. Inorg. Chem. 1992, 31, 567–576. [Google Scholar] [CrossRef]
  60. Cronemeyer, D.C. Electrical and optical properties of rutile single crystals. Phys. Rev. 1952, 87, 876. [Google Scholar] [CrossRef]
  61. Tang, H.; Berger, H.; Schmid, P.; Levy, F.; Burri, G. Photoluminescence in TiO2 anatase single crystals. Solid State Commun. 1993, 87, 847–850. [Google Scholar] [CrossRef]
  62. Zhu, T.; Gao, S.P. The stability, electronic structure, and optical property of TiO2 polymorphs. J. Phys. Chem. C 2014, 118, 11385–11396. [Google Scholar] [CrossRef]
  63. Mei, Z.G.; Wang, Y.; Shang, S.; Liu, Z.K. First-principles study of the mechanical properties and phase stability of TiO2. Comput. Mater. Sci. 2014, 83, 114–119. [Google Scholar] [CrossRef]
  64. Birch, F. Finite elastic strain of cubic crystals. Phys. Rev. 1947, 71, 809. [Google Scholar] [CrossRef]
  65. Murnaghan, F.D. Finite deformations of an elastic solid. Am. J. Math. 1937, 59, 235–260. [Google Scholar] [CrossRef]
  66. Dachille, F.; Simons, P.; Roy, R. Pressure-temperature studies of anatase, brookite, rutile and TiO2-II. Am. Mineral. J. Earth Planet. Mater. 1968, 53, 1929–1939. [Google Scholar]
  67. Himmetoglu, B.; Floris, A.; De Gironcoli, S.; Cococcioni, M. Hubbard-corrected DFT energy functionals: The LDA+U description of correlated systems. Int. J. Quantum Chem. 2014, 114, 14–49. [Google Scholar] [CrossRef]
  68. Bader, R.F. Atoms in molecules. Accounts Chem. Res. 1985, 18, 9–15. [Google Scholar] [CrossRef]
  69. Sofo, J.; Garcia, G. Implementation of Bader Theory in WIEN Package. Available online: http://www.wien2k.at/lapw/ (accessed on 15 December 2023).
  70. Becke, A.D.; Edgecombe, K.E. A simple measure of electron localization in atomic and molecular systems. J. Chem. Phys. 1990, 92, 5397–5403. [Google Scholar] [CrossRef]
  71. Sun, J.; Xiao, B.; Fang, Y.; Haunschild, R.; Hao, P.; Ruzsinszky, A.; Csonka, G.I.; Scuseria, G.E.; Perdew, J.P. Density functionals that recognize covalent, metallic, and weak bonds. Phys. Rev. Lett. 2013, 111, 106401. [Google Scholar] [CrossRef]
  72. Sun, J.; Xiao, B.; Ruzsinszky, A. Communication: Effect of the orbital-overlap dependence in the meta generalized gradient approximation. J. Chem. Phys. 2012, 137, 051101. [Google Scholar] [CrossRef] [PubMed]
  73. Zupan, A.; Burke, K.; Ernzerhof, M.; Perdew, J.P. Distributions and averages of electron density parameters: Explaining the effects of gradient corrections. J. Chem. Phys. 1997, 106, 10184–10193. [Google Scholar] [CrossRef]
  74. Zupan, A.; Perdew, J.P.; Burke, K.; Causà, M. Density-gradient analysis for density functional theory: Application to atoms. Int. J. Quantum Chem. 1997, 61, 835–845. [Google Scholar] [CrossRef]
  75. Perdew, J.P.; Ruzsinszky, A.; Sun, J.; Burke, K. Gedanken densities and exact constraints in density functional theory. J. Chem. Phys. 2014, 140, 18A533. [Google Scholar] [CrossRef]
  76. De Groot, F.; Grioni, M.; Fuggle, J.C.; Ghijsen, J.; Sawatzky, G.A.; Petersen, H. Oxygen 1s x-ray-absorption edges of transition-metal oxides. Phys. Rev. B 1989, 40, 5715. [Google Scholar] [CrossRef]
  77. Blaha, P.; Schwarz, K.; Tran, F.; Laskowski, R.; Madsen, G.K.; Marks, L.D. WIEN2k: An APW+ lo program for calculating the properties of solids. J. Chem. Phys. 2020, 152, 074101. [Google Scholar] [CrossRef] [PubMed]
  78. Blaha, P.; Schwarz, K.; Madsen, G.K.; Kvasnicka, D.; Luitz, J. WIEN2k; Vienna University Technology: Vienna, Austria, 2001. [Google Scholar]
  79. Doumont, J.; Tran, F.; Blaha, P. Implementation of self-consistent MGGA functionals in augmented plane wave based methods. Phys. Rev. B 2022, 105, 195138. [Google Scholar] [CrossRef]
  80. Anisimov, V.I.; Solovyev, I.; Korotin, M.; Czyżyk, M.; Sawatzky, G. Density-functional theory and NiO photoemission spectra. Phys. Rev. B 1993, 48, 16929. [Google Scholar] [CrossRef]
  81. Liechtenstein, A.; Anisimov, V.I.; Zaanen, J. Density-functional theory and strong interactions: Orbital ordering in Mott-Hubbard insulators. Phys. Rev. B 1995, 52, R5467. [Google Scholar] [CrossRef] [PubMed]
  82. Dudarev, S.L.; Botton, G.A.; Savrasov, S.Y.; Humphreys, C.; Sutton, A.P. Electron-energy-loss spectra and the structural stability of nickel oxide: An LSDA+U study. Phys. Rev. B 1998, 57, 1505. [Google Scholar] [CrossRef]
Figure 1. Structures of TiO2 phases with Ti (blue) and O (red) are shown using VESTA [26]: (a) rutile, (b) anatase, (c) columbite, (d) baddeleyite, (e) orthorhombic I, and (f) cotunnite.
Molecules 30 00560 g001
Figure 2. Electronic density of states calculated with R M T (Ti) = 1.78 aB using (a) the PBE, (b) r2SCAN, and (c) r2SCAN+U (2.5 eV) functionals for rutile, anatase, columbite, baddeleyite, OI, and cotunnite. The Ti d and O p states are shown with blue and red curves, respectively, as well as the inequivalent oxygen (if applicable) with yellow. Also, the Kohn–Sham band gap energies are indicated.
Molecules 30 00560 g002
Figure 3. Total energy of TiO2 as a function of the volume for various phases calculated using the r2SCAN functional. Each symbol represents a full structural optimization: rutile (dark blue diamond), anatase (red square), columbite (green triangle), baddeleyite (purple cross), OI (blue cross), and cotunnite (orange circle). The solid line is fitted with the Birch-Murnaghan equation of state.
Molecules 30 00560 g003
Figure 4. Enthalpy, H, of TiO2 phases as a function of the pressure calculated from the total energy and volume data using the Birch–Murnaghan equation of state: rutile (dark blue), anatase (red), columbite (green), baddeleyite (purple), OI (blue), and cotunnite (orange). The pressures for the phase transitions are noted in the boxes.
Molecules 30 00560 g004
Figure 5. (a) The energy of TiO2 phases relative to that of rutile (meV per formula unit) calculated with the PBE, r2SCAN exchange–correlation functionals, and r2SCAN+U (2.5 eV). (b) The energy of anatase relative to that of rutile with increasing U values: 2.5, 6, and 10 eV in r2SCAN+U.
Molecules 30 00560 g005
Figure 6. (a) The energy of anatase relative to rutile (meV per formula unit) calculated using the r2SCAN+U method with different R m t (Ti) values: 1.78 (red square), 1.99 (blue diamond), and 2.2 aB (black triangle). The estimated minimum U values resulting in a greater stability for rutile are indicated. (b) The minimum U values for the correct relative energetics between rutile and anatase were compared using the r2SCAN+U (blue circle) and the PBE+U (red square) methods. The dashed lines are only there to guide the eyes.
Molecules 30 00560 g006
Figure 7. The difference electron density plots for rutile in the (110) plane using (a) r2SCAN and (b) the PBE functional. Blue indicates an electronic charge deficiency and red indicates a surplus.
Molecules 30 00560 g007
Figure 8. The projected density of states (PDOS) for rutile calculated using (a) r2SCAN+U (2.5 eV) and (b) the PBE+U (7.7 eV) functional with R M T (Ti) = 2.2 aB: Ti d (blue), d z 2 (black), d x 2 y 2 (gray), d x y (purple), d y z (yellow), d z x (green), and O p (red).
Molecules 30 00560 g008
Table 1. The lattice parameters of six TiO2 phases, calculated at T = 0 K and p = 0 GPa unless stated otherwise. The lattice constants are in Å, and the angle β of the monoclinic phase is in .
Lattice Constants
Phaseab (β)c B 0 (GPa)Reference
rutile4.600 2.956 244this work (r2SCAN)
4.646 2.966 214this work (PBE)
4.591 2.957 other (SCAN) [53]
4.655 2.970 210other (PBE) [32]
4.593 a 2.959 a235 b, 211 c, 210 dexpt.
anatase3.779 9.601 212this work (r2SCAN)
3.805 9.716 188this work (PBE)
3.777 9.587 other (SCAN) [53]
3.806 9.737 170other (PBE) [32]
3.785 a 9.514 a179 c, 190 cexpt.
columbite4.549 5.521 4.897 254this work (r2SCAN)
4.580 5.576 4.927 206this work (PBE)
4.537 5.504 4.905 other (SCAN) [53]
4.588 5.590 4.933 214other (PBE) [32]
4.541 c5.493 c4.906 c258 c,d, 253 b, 206 eexpt.
baddeleyite4.836 4.857 5.059 273this work (r2SCAN)
(100.3)
4.8614.9065.111171this work (PBE)
(100.3)
4.800 4.867 5.026 other (SCAN) [53]
(99.82)
4.866 4.920 5.108 149other (PBE) [32]
(99.9)
4.662 c4.969 c4.911 c304 f, 298 b, 290 d, 175 eexpt.
(99.4 c)
OI9.358 4.950 4.801 280this work (r2SCAN)
9.426 4.986 4.842 221this work (PBE)
9.428 4.985 4.837 247other (PBE) [32]
9.046 g,h4.834 g,h4.621 g,h318 g, 314 b, 222 eexpt.
9.037 h4.832 h4.629 h283this work (r2SCAN)
9.071 h4.864 h4.654 h229this work (PBE)
9.138 h4.853 h4.671 h252other (B3LYP) [33]
cotunnite5.169 3.167 6.290 297this work (r2SCAN)
5.217 3.185 6.329 184this work (PBE)
5.231 3.151 6.261 270other (PBE) [32]
5.240 3.163 6.297 other (PBE) [54]
5.18 3.191 6.328 213other (PW91) [29]
5.125 i2.914 i5.931 i255other (B3LYP) [33]
5.163 f,j2.989 f,j5.966 f,j431 f, 312 b, 294 eexpt.
a Ref. [14]; b Ref. [28]; c Ref. [17]; d Ref. [57]; e Ref. [58]; f Ref. [19]; g Ref. [18]; h at 28 GPa; i at 60 GPa; j at 61 GPa.
Table 2. Bader charges and bond critical points calculated using the PBE and r2SCAN XC functional with and without U corrections ( R M T (Ti) = 1.78 aB). For each BCP along Ti-O(1) (apical O) and Ti-O(2) (equatorial O), as defined in [41], the two distances from Ti and O are listed.
Rutile Bader Charge (e)BCP (3, −1) (in Å)
XC FunctionalU ( eV )TiOTi; O(1)Ti; O(2)
PBE0+2.28 −1.14 1.002; 1.0040.982; 0.977
PBE+U6+2.46 −1.23 1.003; 1.0150.983; 0.985
r2SCAN0+2.38 −1.19 0.995; 0.9960.976; 0.968
r2SCAN+U2.5 +2.46 −1.23 0.993; 1.0000.976; 0.974
Anatase Bader Charge (e)BCP ( 3 , 1 ) (in Å)
XC FunctionalU (eV)TiOTi; O(1)Ti; O(2)
PBE0+2.26 −1.13 0.997; 0.9980.975; 0.974
PBE+U6+2.44 −1.22 1.001; 1.0030.971; 0.978
r2SCAN0+2.37 −1.19 0.993; 0.9940.965; 0.969
r2SCAN+U2.5 +2.44 −1.22 0.991; 0.9970.969; 0.971
Table 3. The two inequivalent Ti-O bond lengths and O-O bond distances for rutile and anatase are listed (in Å) with and without the Hubbard U correction, calculated using the r2SCAN and PBE functionals. For the calculations with RMT (Ti) = 1.78 aB, U values of 2.5 and 6 eV were used, respectively, resulting in approximately the same Bader charges. For RMT (Ti) = 2.2 aB, U values of 2.5 and 7.7 eV resulted in the correct ordering of the relative stability of rutile and anatase.
Rutile Anatase
Ti RMT: 1.78 aBTi-O(1)Ti-O(2)O-O aTi-O(1)Ti-O(2)O-O b
r2SCAN1.9861.9472.5351.9871.9342.797
PBE2.0051.9592.5602.0041.9492.822
r2SCAN+U (2.5 eV)1.9861.9522.5361.9881.9402.805
PBE+U (6 eV)2.0071.9732.5632.0051.9622.839
Ti RMT: 2.2 aB
r2SCAN1.9821.9442.5311.9871.9392.803
PBE2.0061.9562.5562.0071.9492.822
r2SCAN+U (2.5 eV)1.9911.9712.5411.9911.9502.820
PBE+U (7.7 eV)2.0251.9912.5722.0221.9832.869
Expt [14]1.9801.9492.5371.9691.9362.799
a [110]; b in equatorial plane.
Disclaimer/Publisher’s Note: The statements, opinions and data contained in all publications are solely those of the individual author(s) and contributor(s) and not of MDPI and/or the editor(s). MDPI and/or the editor(s) disclaim responsibility for any injury to people or property resulting from any ideas, methods, instructions or products referred to in the content.