Article

Solvent-Responsive Luminescence of an 8-Hydroxyquinoline-Modified 1H-Imidazo[4,5-f][1,10]phenanthroline Ligand and Its Cu(I) Complexes: Excited-State Mechanisms and Structural Effects

School of Chemistry and Materials Science, Jiangsu Normal University, Xuzhou 221116, China
*
Author to whom correspondence should be addressed.
These authors contributed equally to this work.
Molecules 2025, 30(19), 3973; https://doi.org/10.3390/molecules30193973
Submission received: 29 August 2025 / Revised: 23 September 2025 / Accepted: 30 September 2025 / Published: 3 October 2025
(This article belongs to the Special Issue Influence of Solvent Molecules in Coordination Chemistry)

Abstract

Understanding how solvents influence the luminescence behavior of Cu(I) complexes is crucial for designing advanced optical sensors. This study reports the synthesis, structures and photophysical investigation of an 8-hydroxyquinoline-functionalized 1H-imidazo[4,5-f][1,10]phenanthroline ligand, ipqH2, and its four Cu(I) complexes with diphosphine co-ligands. Photoluminescence studies demonstrated distinct solvent-dependent excited-state mechanisms. In DMSO/alcohol mixtures, free ipqH2 exhibited excited-state proton transfer (ESPT) and enol-keto tautomerization, producing dual emission at about 447 and 560 nm, while the complexes resisted ESPT due to hydrogen bond blocking by PF6 anions and Cu(I) coordination. In DMSO/H2O, aggregation-caused quenching (ACQ) and high-energy O–H vibrational quenching dominated, but complexes 1 and 2 showed a significant red-shifted emission (569–574 nm) with high water content due to solvent-stabilized intra-ligand charge transfer and metal-to-ligand charge transfer ((IL+ML)CT) states. In DMSO/DMF, hydrogen bond competition and solvation-shell reorganization led to distinct responses: complexes 1 and 3, with flexible bis[(2-diphenylphosphino)phenyl]ether (POP) ligands, displayed peak splitting and (IL + ML)CT redshift emission (501 ⟶ 530 nm), whereas complexes 2 and 4, with rigid 9,9-dimethyl-4,5-bis(diphenylphosphino)-9H-xanthene (xantphos), showed weaker responses. The flexibility of the diphosphine ligand dictated DMF sensitivity, while the coordination, the hydrogen bonds between PF6 anions and ipqH2, and water solubility governed the alcohol/water responses. This work elucidates the multifaceted solvent-responsive mechanisms in Cu(I) complexes, facilitating the design of solvent-discriminative luminescent sensors.

1. Introduction

The 21st century has witnessed remarkable advancements in optical functional materials, expanding their applications from basic lighting to intelligent sensing, bioimaging, and phototherapy [1,2,3]. Among these, luminescent transition metal complexes have attracted significant attention due to their large Stokes shifts and long-lived phosphorescence. Although noble metal Au(I) [4,5], Pt(II) [6,7], and Ir(III) complexes exhibit enhanced phosphorescence through strong spin–orbit coupling, their high cost limits their widespread application [2,8,9]. In contrast, cuprous complexes have emerged as promising alternatives, offering cost-effectiveness, environmental friendliness, and tunable photophysical properties [10], particularly those based on imidazo[1,10]phenanthroline (Imphens) and diphosphine ligands [11,12,13,14,15,16,17].
On the other hand, solvent-responsive luminescent materials dynamically modulated their emissions in response to solvent microenvironments, governed by multifaceted mechanisms such as solvent polarity [18,19], excited-state proton transfer (ESPT) [19,20,21,22,23], charge transfer (CT) [23], solvent coordination [24], etc. In 2023, Pan’s group presented a novel design for synthesizing pure organic photoluminescent molecules with dual excited-state intramolecular proton transfer (ESIPT) sites, enabling full-color emission and white light in various solvents [22]. In addition, many carbon dots (CDs) also exhibited significant solvent effects [23]. In 2021, CDs prepared from ninhydrin and o-phenylenediamine displayed solvent-dependent green-to-red fluorescence changes caused by hydrogen bonding between surface hydroxyl/amino/carbonyl groups and solvents, and these CDs were successfully applied in white-light LEDs and solvent water-content detection [25].
From the above studies, it is evident that the current research for solvent-responsive luminescence is primarily focused on organic molecules and nanoparticles, with limited exploration of luminescent complexes. Solvent-responsive luminescence in Cu(I) complexes remains underexplored. Developing and investigating such complexes can not only elucidate their excited-state regulation principles but also provide theoretical support for designing bioprobes with large Stokes shift and chemical sensors with high sensitivity, which holds significant scientific value for advancing intelligent sensing materials. Herein, 2-(1H-imidazo[4,5-f][1,10]phenanthrolin-2-yl)quinolin-8-ol (ipqH2) and its four Cu(I) complexes were synthesized, and their solvent-responsive luminescent mechanisms were elucidated.

2. Results and Discussion

2.1. Syntheses

The synthesis process of the ligand ipqH2 has been slightly modified according to the literature [26]. No triethyl orthoformate was added during the synthesis process, and the product precipitate was obtained by adding n-hexane instead of water to concentrated ethanol solution in the post-treatment phase. The synthesis strategy of the Cu(I) complexes follows the methods in classical studies [11,12,13,14,15,16]. At room temperature, ipqH2 and [Cu(CH3CN)4]PF6 was reacted with diphosphine ligand bis[(2-diphenylphosphino)phenyl]ether (POP) or 9,9-dimethyl-4,5-bis(diphenylphosphino)-9H-xanthene (xantphos) in CH2Cl2 solutions at molar ratios of 1:1:1 and 1:2:2, respectively (see Scheme 1), and the crystals were then cultured in a mixed solvent of CH2Cl2/n-hexane.

2.2. X-Ray Structure Analysis

The crystallographic data and selected refinement parameters for complexes 1·CH2Cl2, 3 and 4 are listed in Table S1 (see Supplementary Materials), while the important bond lengths and bond angles are provided in Table 1. The perspective views of their corresponding cationic structures are shown in Figure 1, Figure 2 and Figure 3.
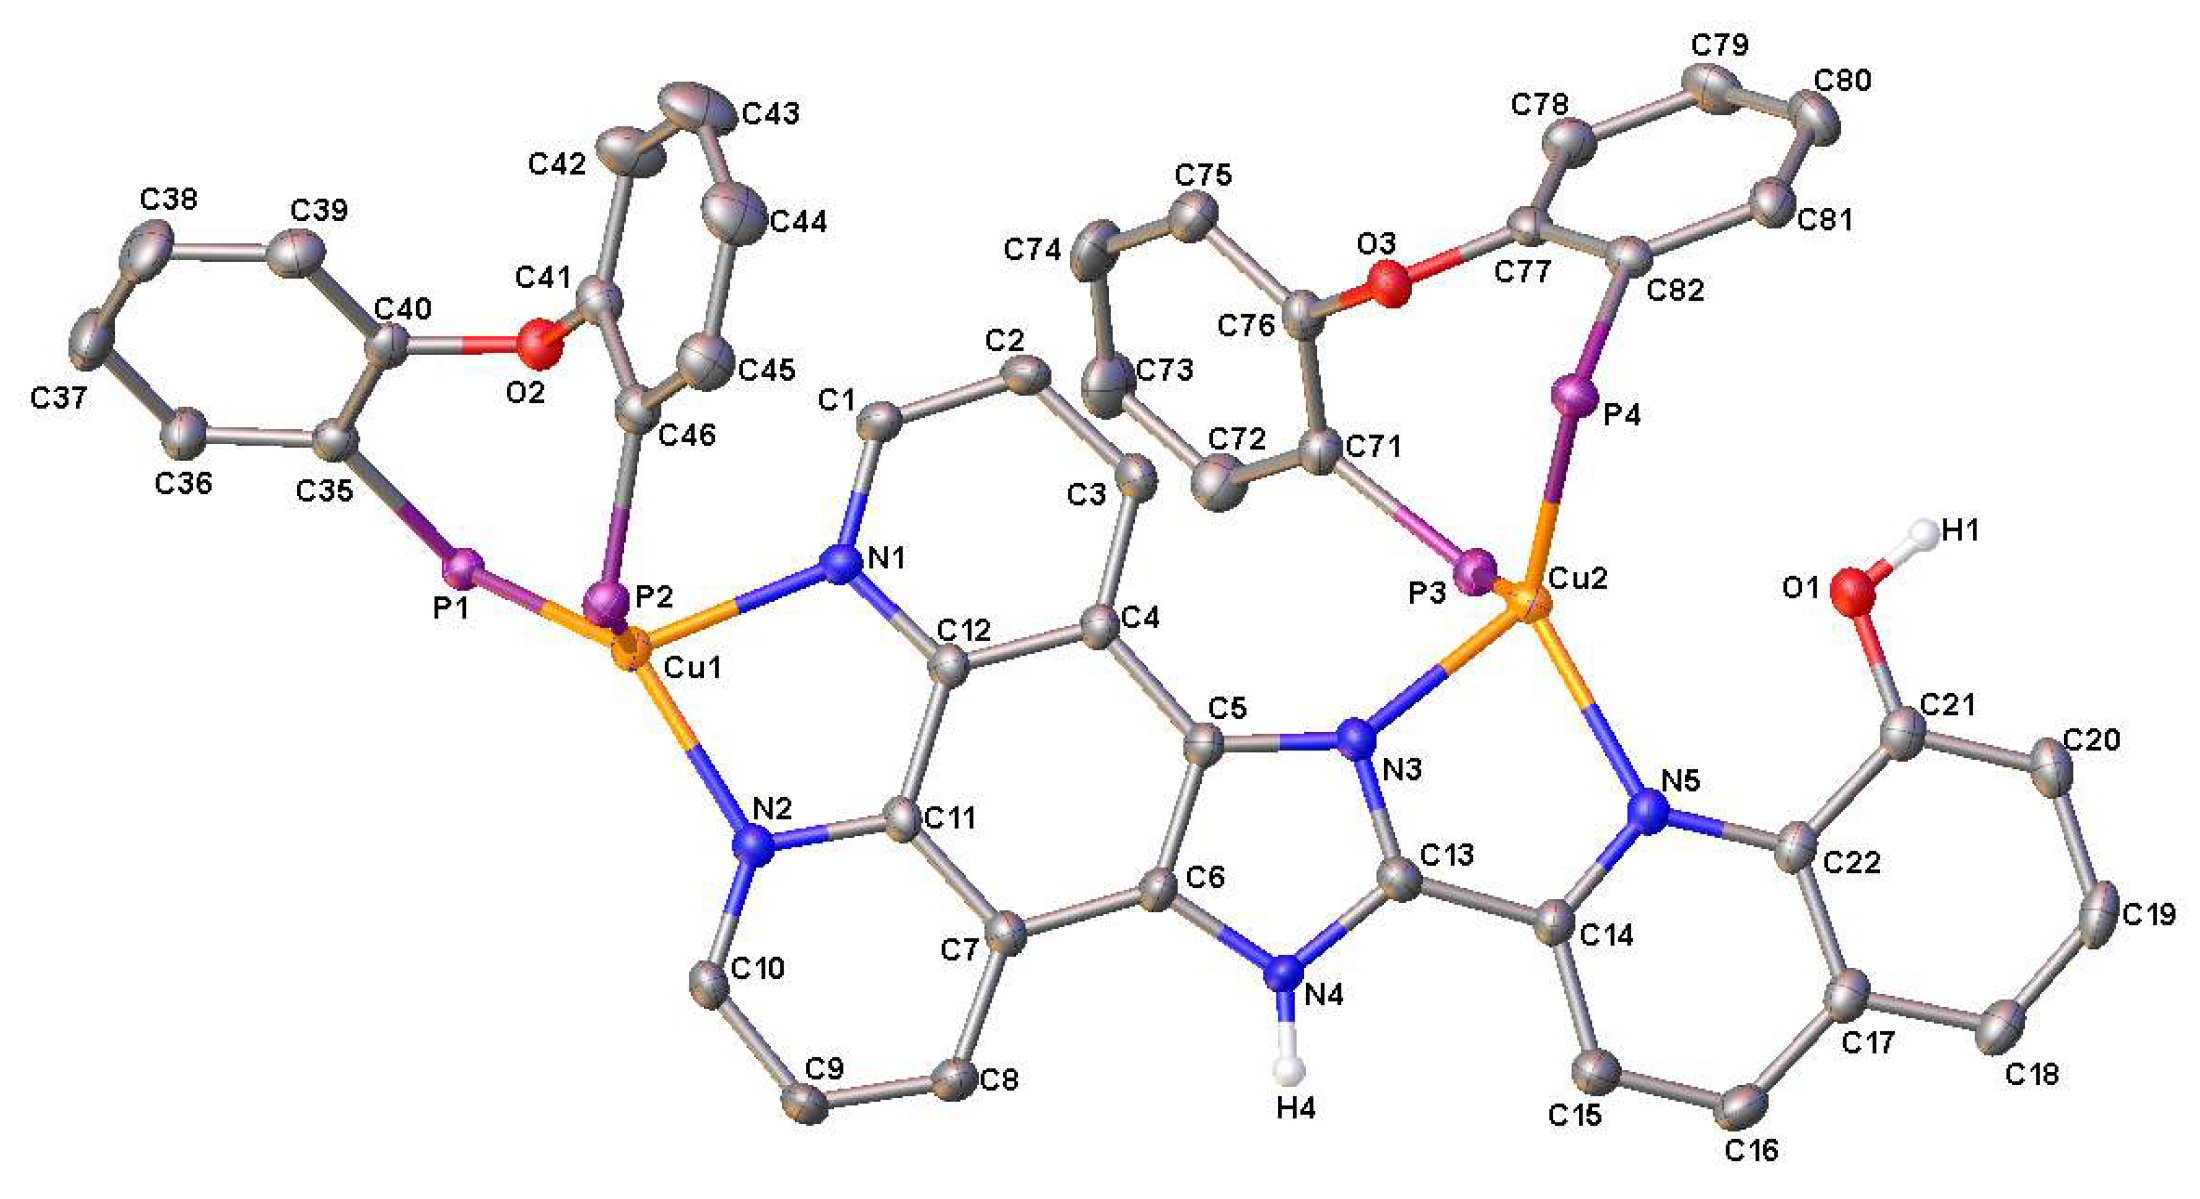
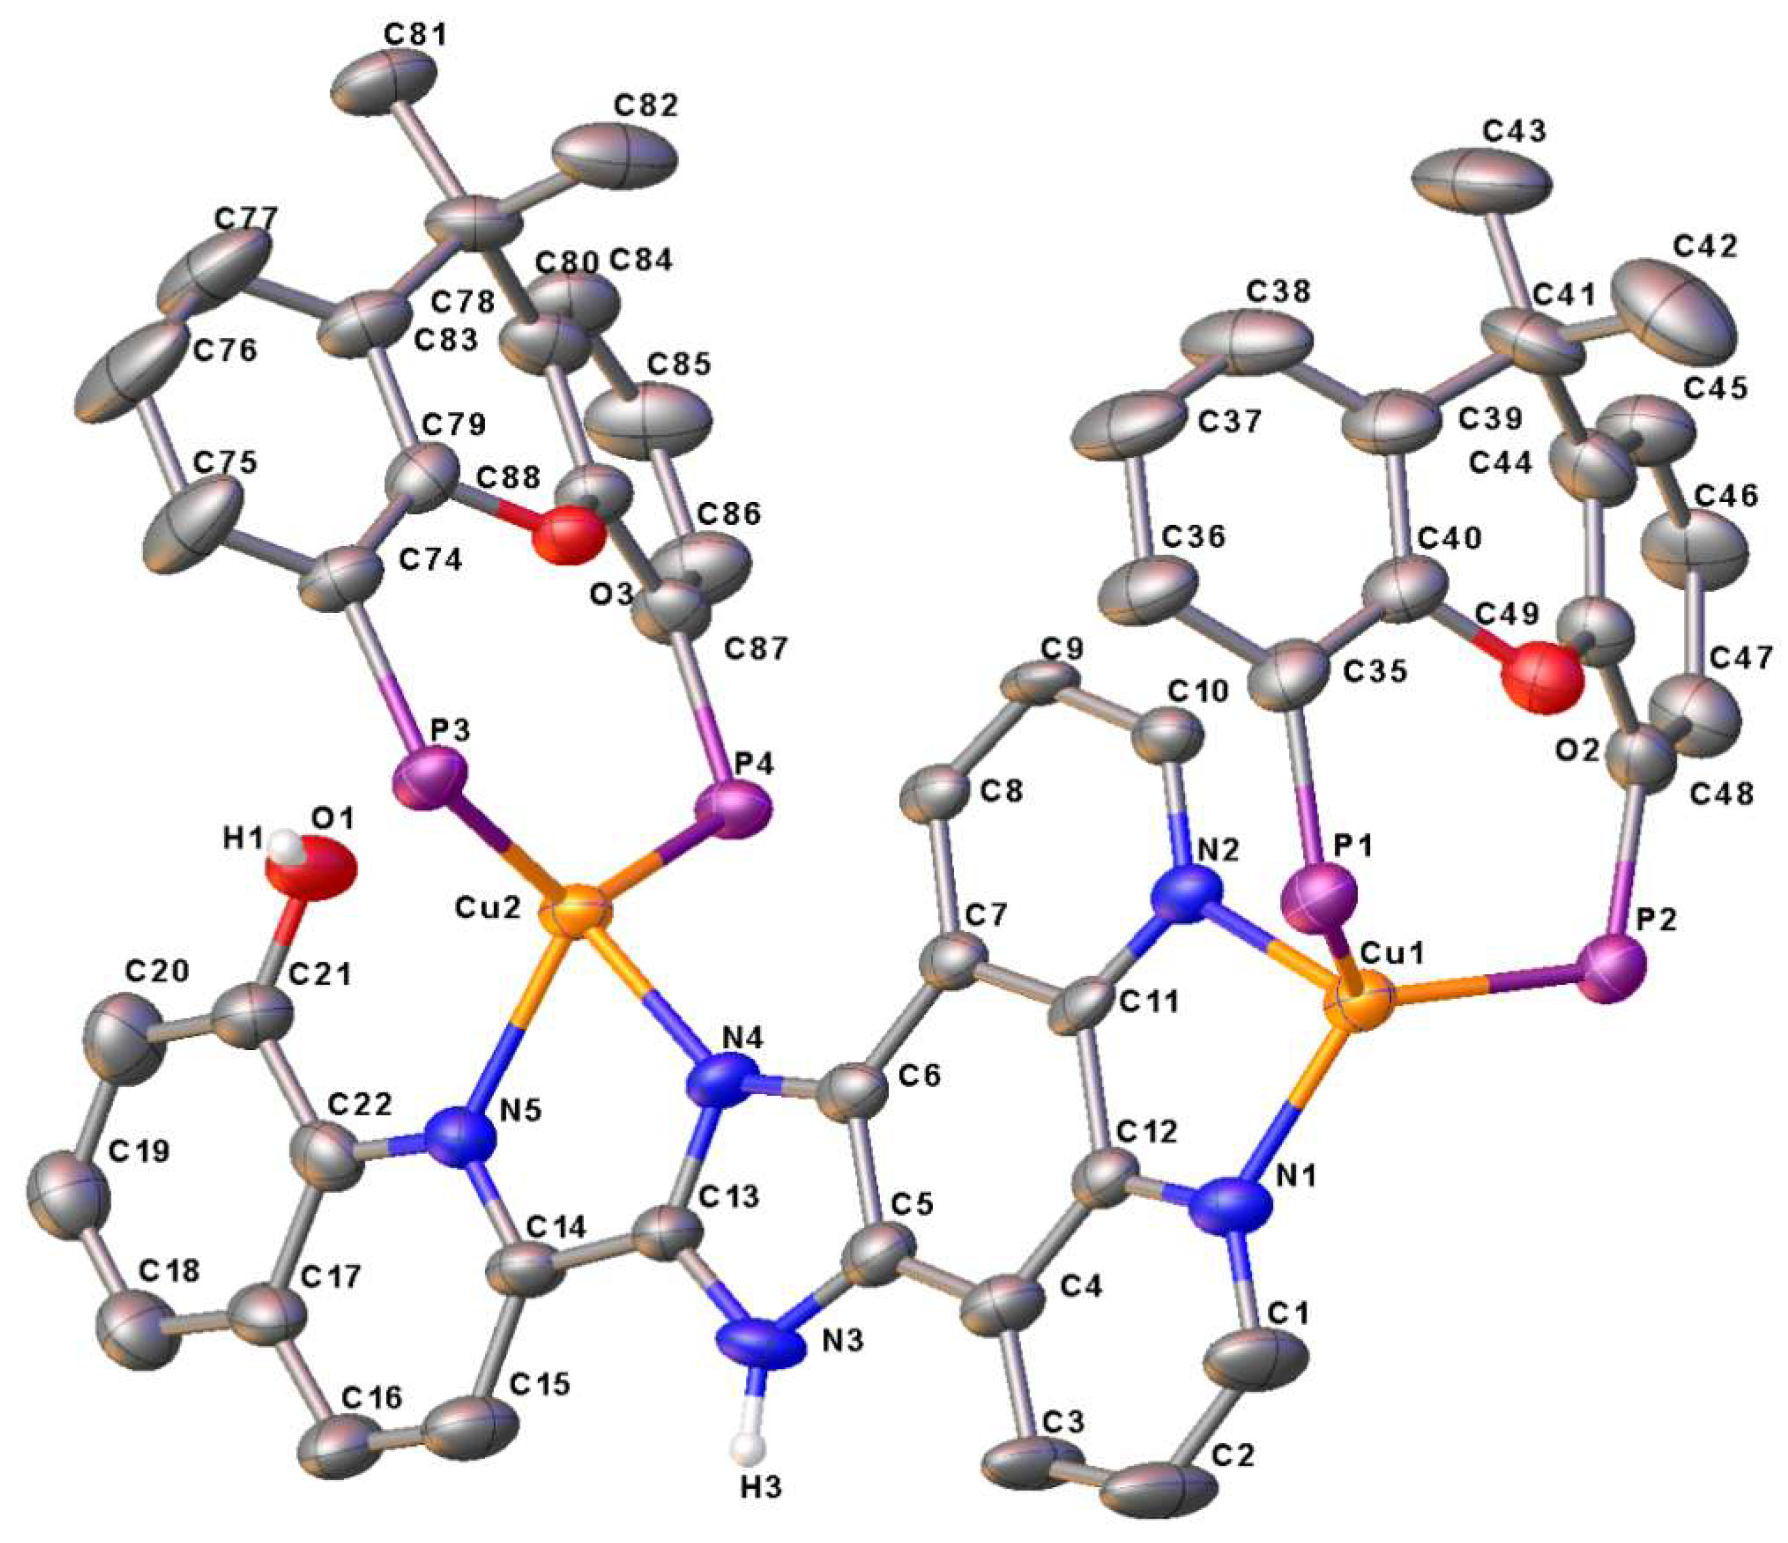
As shown in Figure 1, complex 1 has a mononuclear structure with two molecules in an asymmetric unit of its crystal structure. The distorted tetrahedral Cu(I) centers are completed by the two nitrogen atoms of the phen unit of ipqH2 and two phosphorus atoms from POP. Complexes 3 and 4 both have binuclear core structures, as shown in Figure 2 and Figure 3, with two typical distorted tetrahedral Cu(I) centers completed by the two nitrogen atoms from the phen unit or from imidazole and quinolone rings of the ipqH2 ligand and two phosphorus atoms from the diphosphine ligands POP or xantphos. Such structures are similar to reported Cu(I) complexes of 1H-imidazo[4,5-f][1,10]phenanthroline [13]. The bond lengths of Cu–P are in the range of 2.2281(7)–2.3142(7) Å. The Cu–N distances involving the phen unit in the range of 2.047(5)–2.098(2) Å are shorter than those involving nitrogen atoms of imidazole and quinolone rings in the range of 2.098(2)–2.204(2) Å. The N–Cu–N, N–Cu–P and P–Cu–P bond angles are within the ranges of 79.2(2)–80.78(19)°, 98.62(6)–130.13(6)°, and 112.99(6)–129.85(7)°, respectively, which are comparable to the values reported in the literature [11,12,13,14,15,16,17].
As shown in Figure 1, strong C–H⋯π interactions between two [Cu(ipqH2)(POP)]+ cations for complex 1 can be observed, where dH…Cg = 2.531 Å and 2.793 Å, dCg…Cg = 3.440 Å and 3.706 Å, ∠C–H⋯Cg = 160° and 162°, respectively. Here, Cg represents the center point of the corresponding benzene ring [27]. Intramolecular O–H⋯N hydrogen bonds were observed between –OH and the nitrogen atoms of the quinioline ring (d(O1–H1⋯N5) = 2.704(8) Å, ∠ O1–H1⋯N5 = 113.9°; d(O3–H3B⋯N10) = 2.710(6) Å, ∠ O3–H3⋯N8 = 114.1°) [11,14]. Additionally, as shown in Figure 4, two [Cu(ipqH2)(POP)]+ cations also form a cationic dimer through eightfold offset π⋯π interactions between the ipqH2 ligands (see Table S2) [16], and such a cation dimer further strengthens the connection by the N–H⋯F and O–H⋯F hydrogen bonds with the same hexafluorophosphate ion (see Figure 4 and Table S3) [28,29]. These dimers also further assemble into a zigzag chain via the C–H⋯π interactions mentioned above (see Figure S1). A π⋯π interaction between the ipqH2 ligands in the crystal structures of complexes 3 and 4 was not observed. Both N–H⋯F (PF6) and O–H⋯F (PF6) hydrogen bonds were observed in complex 3, and only the N–H⋯F (PF6) hydrogen bond was observed in complex 4 (see Figures S2 and S3 and Table S3).
The dihedral angles of the quinoline ring and imidazo[1,10]phenanthroline plane are 3.90° and 4.83° in complex 1 and 5.41° and 4.21° in complexes 3 and 4, respectively. These small dihedral angles indicate that the ligand ipqH2 maintains good coplanarity and conjugation in these complexes [11,14,27]. Meanwhile, the similarity of these dihedral angles also indicates that although two N atoms from the quinoline and imidazole rings form a second chelating coordination center with Cu(I) ions, the rigidity of the ligand may be enhanced [13], but its coplanarity has not changed significantly.

2.3. FTIR Spectra

FTIR spectra of the free ligand ipqH2 and complexes 14 are shown in Figures S4–S8. According to studies [11,13,14], the absorption of the free ligand at 3061 cm−1 is attributed to the C–H stretching vibration of the aromatic ring. The broad, medium-intensity absorption bands observed in the range of 3098–3329 cm−1 with discernible peaks are tentatively assigned to N–H (3098, 3142 and 3173 cm−1) and O–H (3329 cm−1) stretching vibrations resulting from possible intramolecular/intermolecular hydrogen bonds such as N–H⋯N, N–H⋯O, O–H⋯N, and O–H⋯O.
In complexes 14, weak broad absorption bands are still observed above 3000 cm−1, but no extensive broad bands similar to those of the free ligand are present. The absorptions at 3052–3055 cm−1 are assigned to C–H stretching vibrations. N–H stretching vibrations are observed at 3072 cm−1 for complex 1, 3139 and 3077 cm−1 for complex 2, and 3330 cm−1 for complex 3, respectively. For complex 4, the N–H vibration overlaps with the C–H vibration and is not distinct. The O–H stretching vibrations in complexes 14 are located at 3362, 3367, 3456, and 3325 cm−1, respectively. Additionally, strong absorption peaks observed in the range of 842–843 cm−1 correspond to the stretching vibration of the PF6 ion, confirming the presence of the counterion PF6 in these complexes [14].

2.4. 1H and 31P{1H} NMR Spectra

The 1H spectra of the ligand ipqH2 and Cu(I) complexes 14 are shown in Figures S9–S13. The ligand ipqH2 and complexes 14 show single peaks characteristic of the –NH group of imidazole rings at 13.99–14.32 ppm [11,13,14,30,31], and phenolic hydroxyl –OH at 9.82–9.85 ppm [26,30,31]. Other signals also match their structures well. The corresponding 31P{1H} NMR results of complexes 14 are shown in Figures S14–S17. The mononuclear complexes 1 and 2 exhibit single peaks at −11.59 and −12.83 ppm, respectively. The binuclear complexes 3 and 4 show a set of signals at −11.58 and −12.86 ppm which are similar to those of complexes 1 and 2, and also close to what has been reported in studies [11,13,14]. The other single peaks at −19.29 and −18.43 ppm for complexes 3 and 4 are assigned to the P atoms of the diphosphine ligands coordinated to Cu2 centers [13]. For complex 4, weak minor peaks at −14.96 and −20.82 ppm were also observed, likely due to the asymmetry of ipqH2 and conformational variations in xantphos [32,33]. All complexes (14) display characteristic septet signals around −144.20 ppm, corresponding to the hexafluorophosphate anion (PF6) [14].

2.5. Photophysical Properties

2.5.1. Electron Absorption and Emission Spectra in DMSO

Although the synthesis of ipqH2 has been reported in the literature [26], its photophysical properties such as absorption and emission spectra remain unexplored. Here, the UV-vis electron absorption spectra and emission spectra of all compounds in the solid state and in DMSO (2.5 × 10⁻⁵ mol·L−1) solutions at 298 K are shown in Figure 5. The excitation spectra of all compounds in the solid state and in DMSO (2.5 × 10⁻⁵ mol·L−1) solutions at 298 K are depicted in Figure S18. The corresponding data are listed in Table 2. To align with the excitation wavelength of the UV lamp used during photography, the excitation wavelength for obtaining the emission spectra was consistently set at 365 nm, with a filter at 395 nm or 430 nm.
The UV-vis spectrum of the free ligand ipqH2 exhibits two main absorption regions. According to the magnitude of the extinction coefficients (ε) and the characteristics of the spectral band, the intense higher-energy bands below 330 nm with absorption peaks at 283 and 315 nm (ε ≈ 104) are tentatively attributed to ligand-centered (LC) π → π* transitions of the aromatic and heteroatomic components. The push-pull structure of ipqH2 is also similar to that of the 2,5-bis(1H-imidazo[4,5-f][1,10]phenanthrolin-2-yl)benzene-1,4-diol with donor-acceptor units reported by Singh’s group [34], so the broad low-energy bands with moderate intensity at 364 and 381 nm (ε ≈ 104) are probably caused by an intra-ligand charge transfer (ILCT) transition, resulting from the push-pull architecture between the electron-donating 8-hydroxyquinoline unit and the electron-accepting 1H-imidazo[4,5-f][1,10]phenanthroline unit. The weaker tail absorption between 400~500 nm is attributed to n → π* transitions.
For complexes 14, the absorption profiles are highly similar (ignoring minor shifts and ε variations) and largely independent of the diphosphine ligands, indicating comparable frontier orbitals and electronic transitions. The TD-DFT theoretical calculations for the complex [Cu(nimpH)(POP)]PF6 (where nimpH = 2-(2-naphthyl)-1H-imidazo[4,5-f][1,10]phenanthroline) reveal that its HOMO is primarily contributed by the Cu(I) ion and the POP ligand, with an additional portion originating from the naphthyl ring. In contrast, the LUMO is mainly localized on the 1H-imidazo[4,5-f][1,10]phenanthroline unit [17]. The electronic transitions in the absorption spectrum thus involve ILCT, metal-to-ligand charge transfer (MLCT), and ligand-to-ligand charge transfer (LLCT) processes. Given the structural similarity between nimpH and ipqH2, and considering that the donor-acceptor (D-A) architecture of ipqH2 should exhibit enhanced push-pull electronic characteristics upon coordination to the Cu(I) ion, it is reasonable to anticipate the presence of an ILCT transition between the donor and acceptor units in complexes 14 as well. To further elucidate the nature of the electronic transitions, we compared the experimental absorption spectra of complexes 14 with those of the free ligands and known Cu(I) complexes [11,13,14,16]. The high-energy bands (λ ≤ 315 nm) are tentatively assigned to LC π → π* transitions involving ipqH2 and diphosphine ligands. The shoulder absorption near 360 nm and a tail extending to around 500 nm primarily originate from the ILCT of ipqH2, possibly accompanied by LLCT between the imine and diphosphine ligands, as well as MLCT from the d(Cu) orbital to the 1H-imidazo[4,5-f][1,10]phenanthroline unit. Certainly, further theoretical studies are necessary to precisely assign the molecular orbitals involved in the electronic absorption spectra in the future.
In the solid state, the ligand and all complexes exhibited similar emission peaks in the range of 472–477 nm. With reference to the literature [17,34], these emission peaks are tentatively assigned to LC π* → π fluorescence, while emissions in the range of 543–551 nm are preliminarily attributed to intra-ligand charge transfer- and metal-to-ligand charge transfer ((IL+ML)CT)-dominated phosphorescence for complexes 1, 2 and 4. The emission peaks observed at about 593 nm for ipqH2 are tentatively attributed to ILCT emission. The luminescence at 609 nm for complex 3 results most likely from 3LLCT luminescence, since it is the lowest-lying excited state in general [35]. Meanwhile, such 3LLCT luminescence may be mixed with some 3(IL + ML)CT transition luminescence. Such mixed excited states have also been previously reported in other heteroleptic Cu(I) complexes, based on mixed phosphine/thiocarbamoyl-pyrazoline/halide ligands [36]. In DMSO solution, the luminescence of ligand ipqH2 at around 463 nm is also primarily attributed to LC π* → π emission. The emission spectra of the four complexes are similar, with maximum emission wavelengths ranging from 484 to 501 nm, exhibiting a redshift of 21–38 nm compared to the ligand ipqH2. Among them, complex 1 shows the largest luminescence redshift. Compared to the absorption spectra and considering their large Stokes shifts, as well as referencing the literature [11,13,14,16], the luminescence of the complexes in DMSO is preliminarily assigned to the mixture of LC emissions and 3(IL + ML)CT emissions, and probably also mixed with some contributions from 3LLCT, especially for complex 1 [17]. The emission spectrum of complex 1 in DMSO is relatively broad, with a full width at half maximum of approximately 143 nm, suggesting the possible coupling of dual peaks and the potential existence of more than one excited state.

2.5.2. Solvent Effects on Photoluminescence

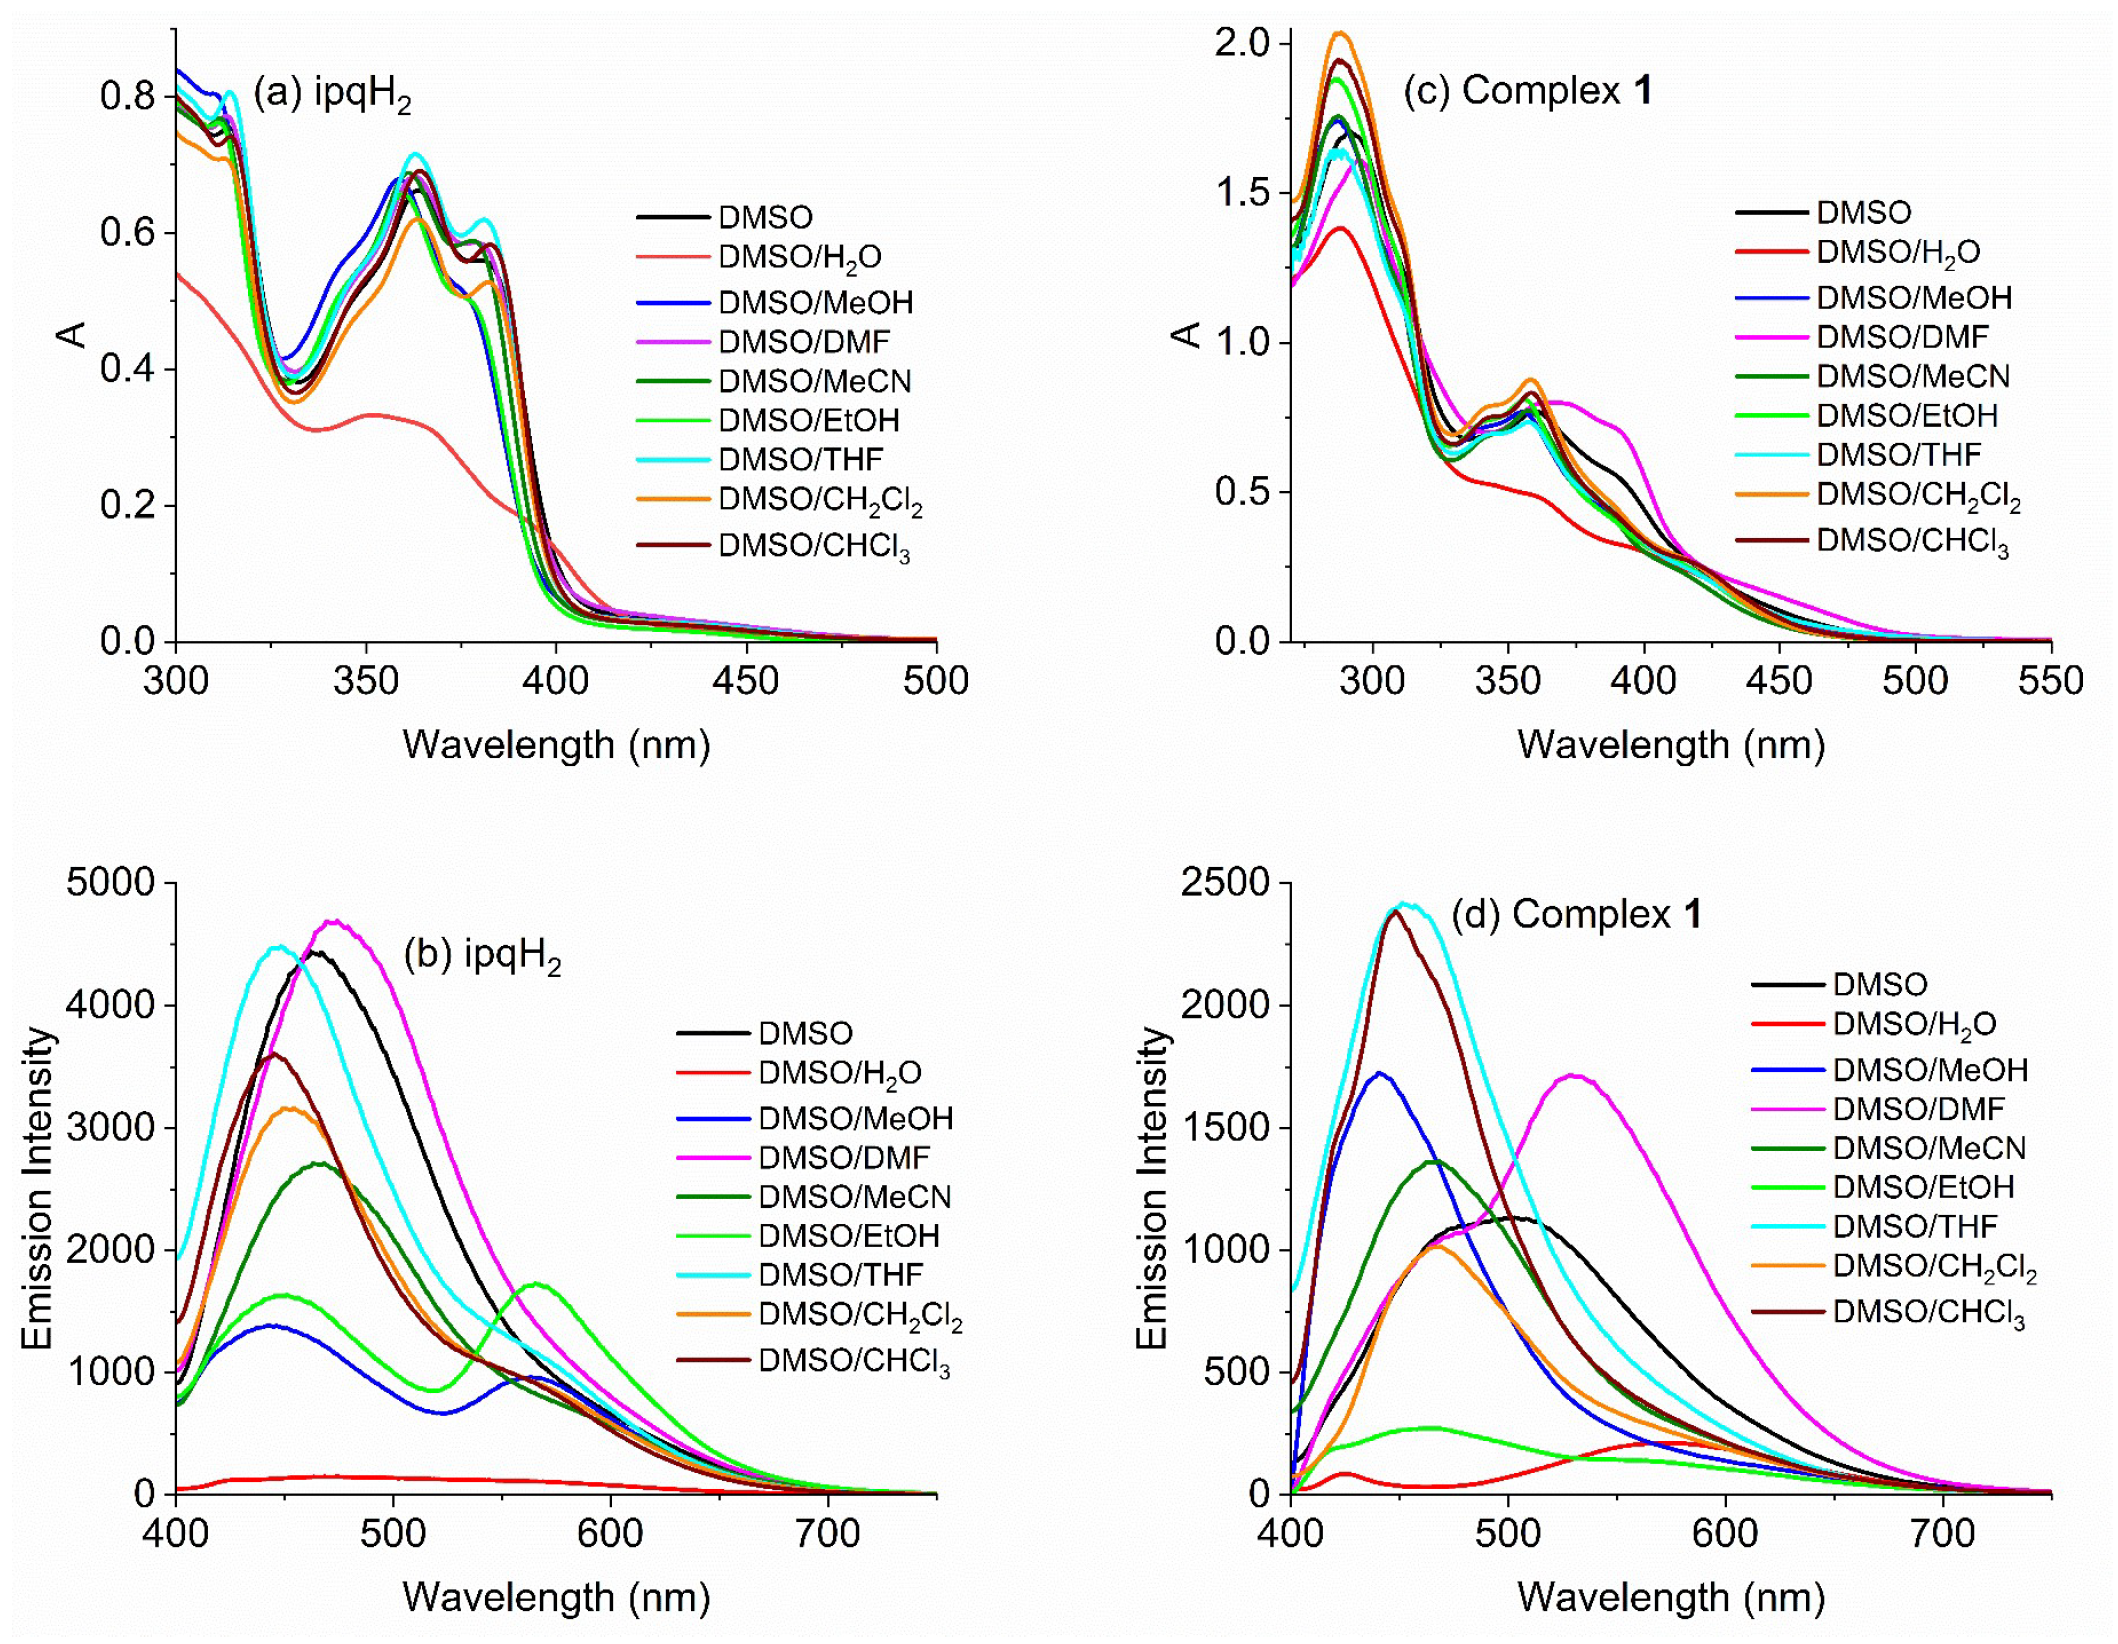
To investigate the sensing properties of ligand ipqH2 and complexes 14 toward different solvents, we measured their UV-vis absorption and emission spectra in various solvents of different polarities (including protic and aprotic solvents) (see Figure 6 and Figure S19) and captured luminescence photos under 365 nm UV lamp excitation (with a 395 nm filter) (see Figure 7). During testing and imaging, the concentration of all samples was maintained at 2.5 × 10⁻⁵ mol·L−1. Due to the low solubility of these compounds in common solvents, a DMSO-assisted dissolution method was employed (VDMSO:Vother solvent = 1:9). The other solvents, listed in order of decreasing polarity, included H2O, MeOH, DMF, CH3CN, EtOH, THF, CH2Cl2, and CHCl3.
The results showed that, except for the DMSO/H2O system, the absorption spectra of ipqH2 and complexes 14 exhibited no significant changes in most solvents compared with those in DMSO. However, ipqH2 displayed specific luminescence responses to water, methanol, and ethanol, while complexes 14 showed significant luminescence responses to water and DMF. Apart from these specific responses, in general, after adding various other solvents to DMSO, the luminescence of ipqH2 and the complexes mostly blue-shifted as the polarity of the mixed solvent decreased, indicating that the polarity of their excited states also decreased with reduced solvent polarity [18,19]. Therefore, taking ligand ipqH2 and complexes 1 and 2 as examples, we further explored the luminescence mechanisms by investigating the effects of mixed solvents with varying volume fractions of ethanol, water, or DMF on their absorption and emission spectra.
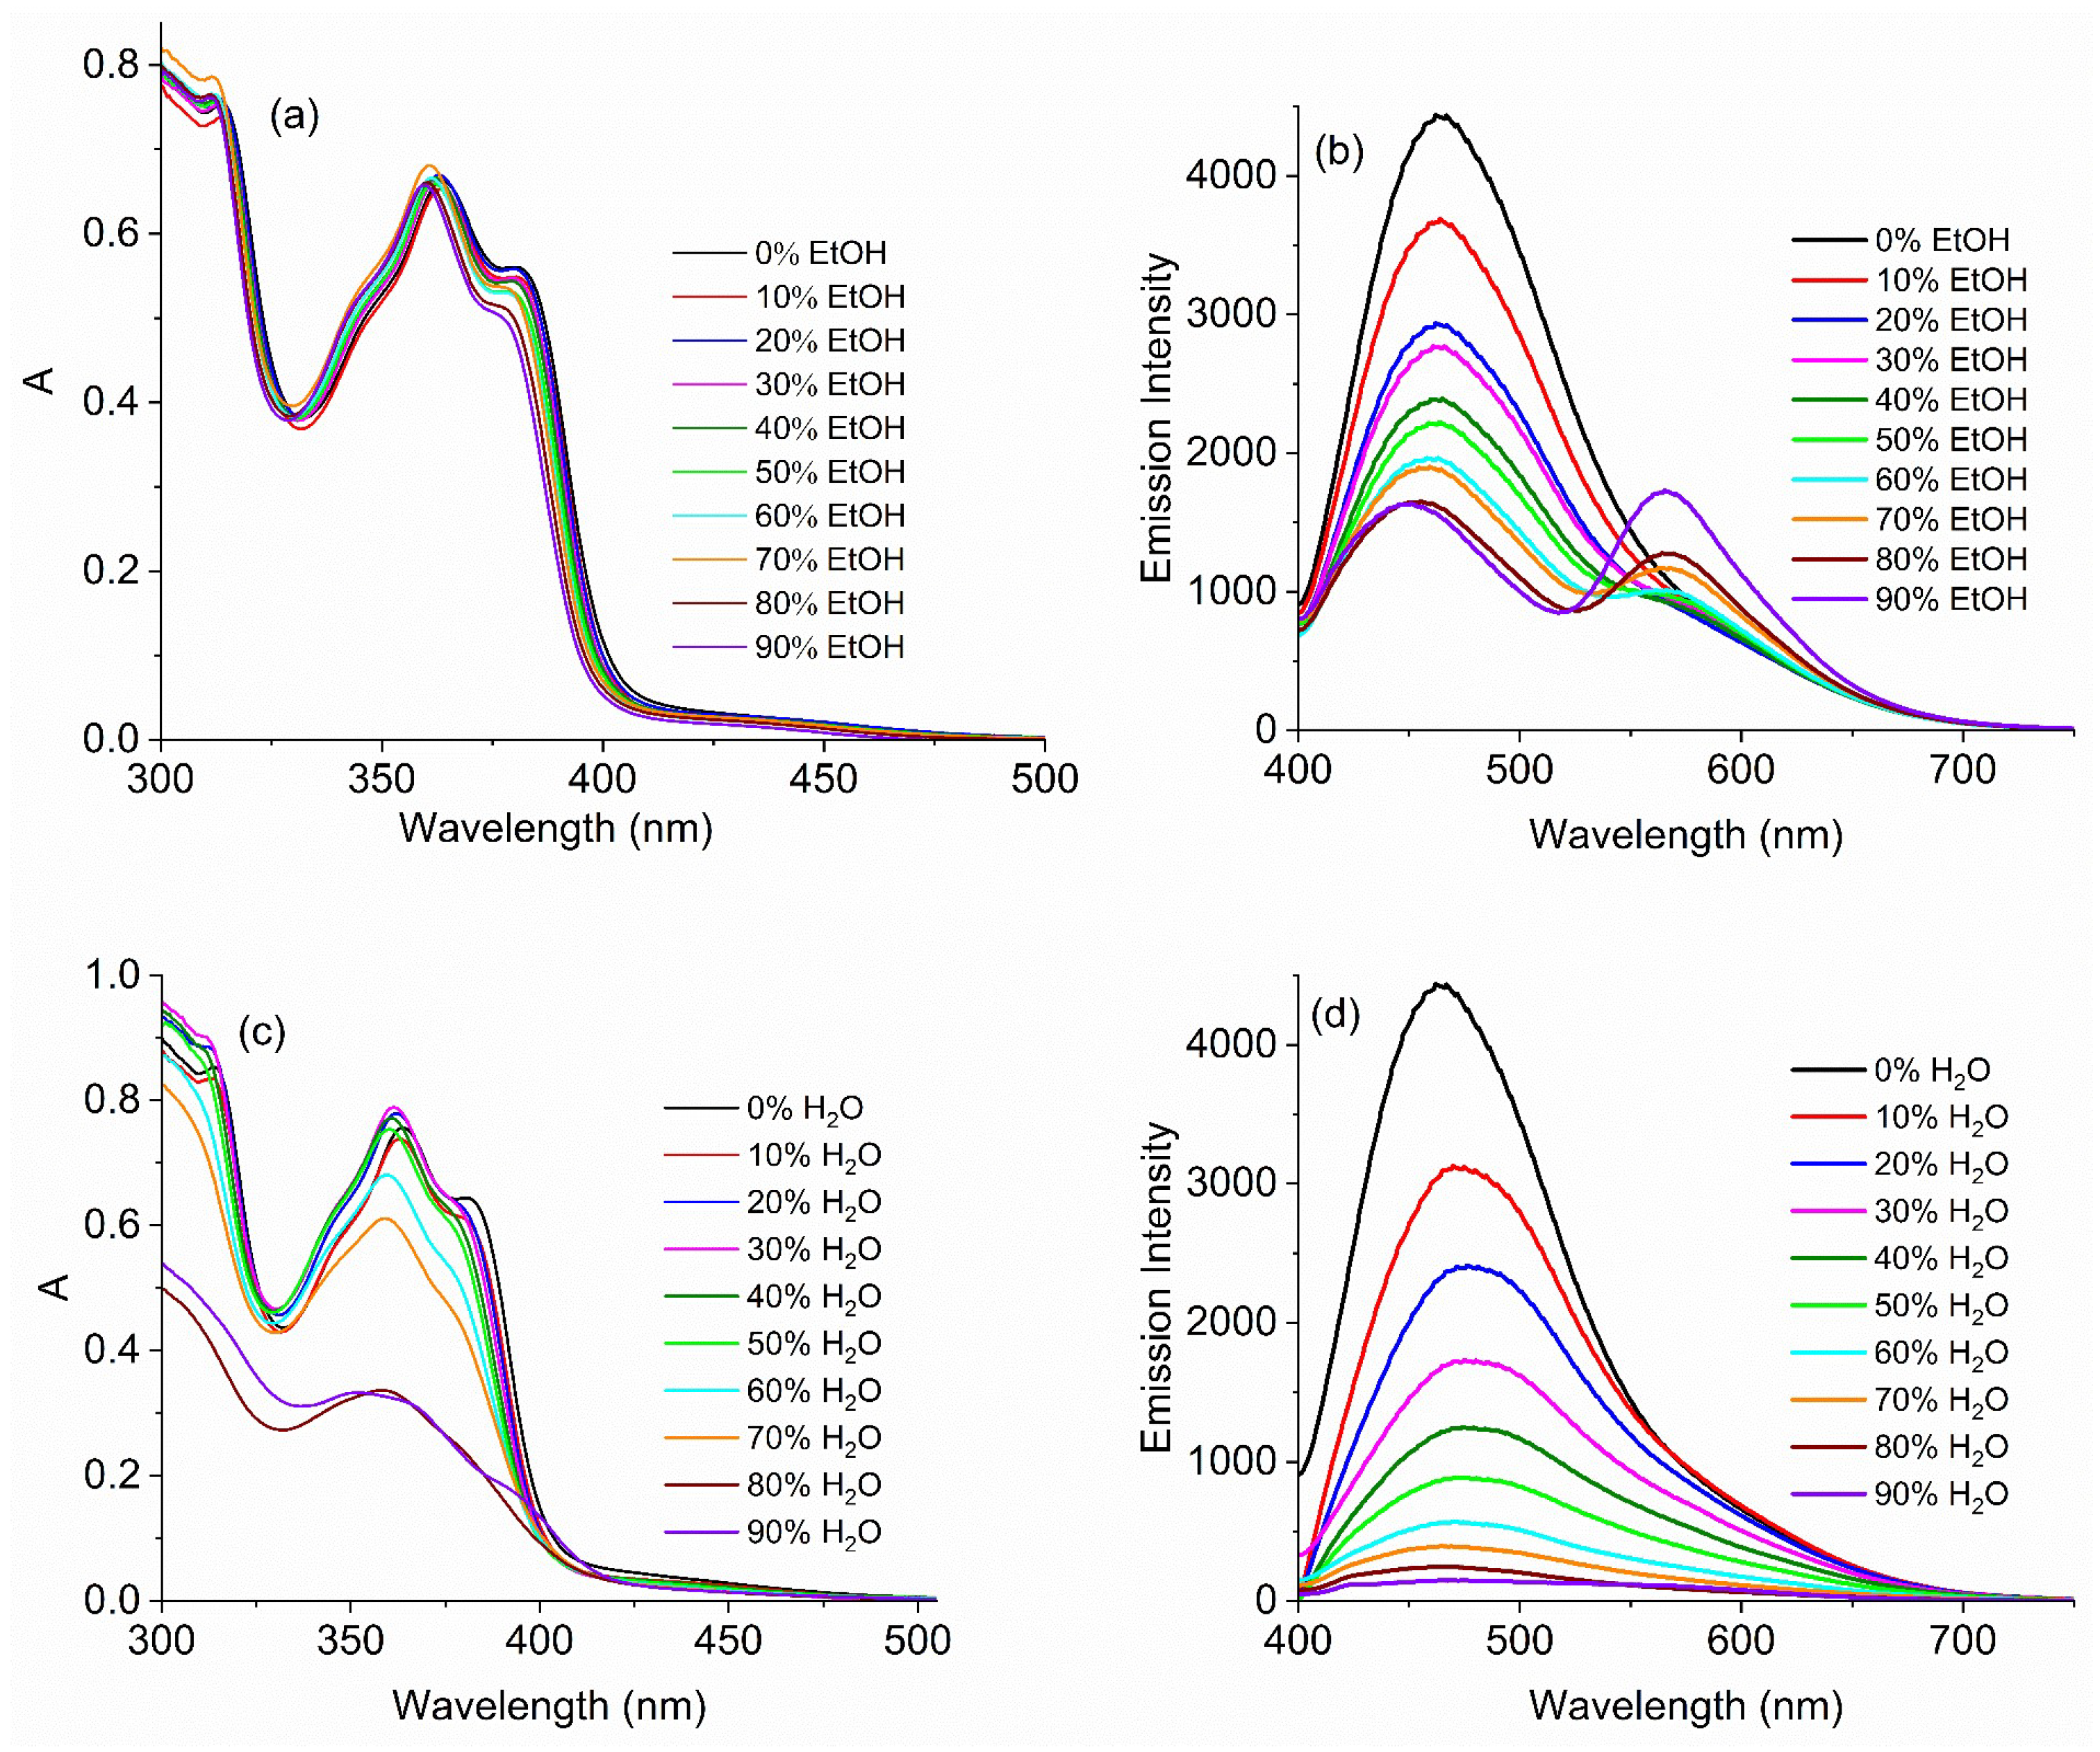
Alcohol (MeOH/EtOH) solvent effect. As shown in Figure 8a, as the volume fraction of ethanol (fEtOH) gradually increased from 0% to 90%, the addition of EtOH only caused a slight decrease in the UV-vis absorption spectra of the ligand ipqH2, indicating that no obvious aggregation of ipqH2 occurs upon ethanol addition. The spectra also remained relatively stable, without significant red or blue shifts. Although the absorption spectra of ipqH2 showed no significant changes, under 365 nm excitation (with a 395 nm filter), as illustrated in Figure 8b, the luminescence of ipqH2 gradually decreased and developed a dual-emission feature upon EtOH addition. When fEtOH ≥ 60%, this dual-peak characteristic (447 and 561 nm) became increasingly apparent, with a new emission peak emerging near 561 nm that intensified with increasing fEtOH. A similar trend was observed in DMSO/MeOH mixtures, where dual emissions appeared at 441 and 560 nm (see Figure S20).
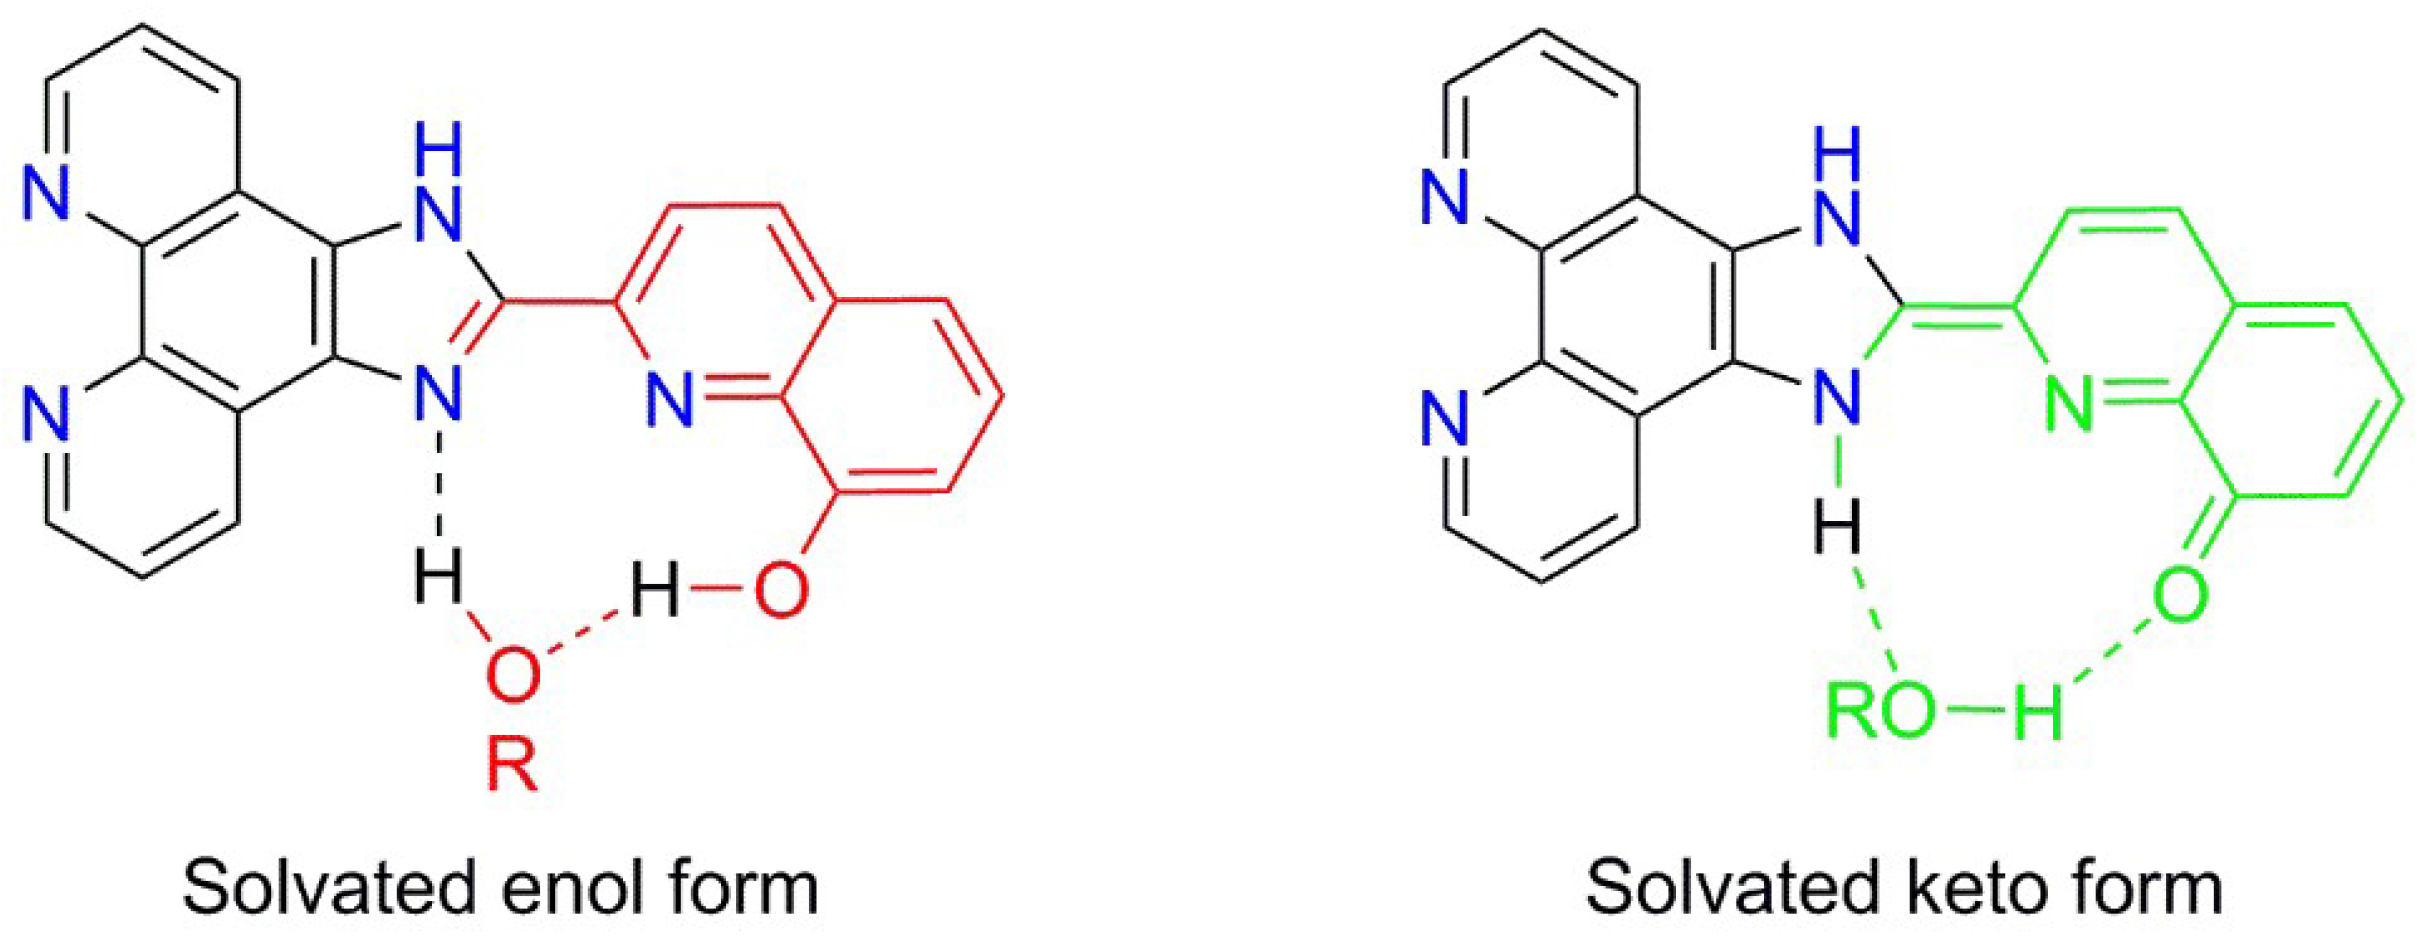
Since this phenomenon was observed only in polar protic alcohol-containing solvents, it suggests that the presence of a large amount of MeOH or EtOH disrupted the solvation of ipqH2 by DMSO. Meanwhile, these protic alcohol solvents induced an excited-state long-distance proton transfer and isomerization in ipqH2, as illustrated in Figure 9, leading to the formation of enol and keto excited-state isomers. Similar solvent-assisted ESPT mechanisms have also been suggested for o-hydroxynaphthyl phenanthroimidazole and o-hydroxyphenyl phenanthroimidazole [37], 6-32amino-2-(2′-hydroxyphenyl)benzoxazole [38], and 7-hydroxyquinoline [39,40,41]. This resulted in dual emission peaks, shifting the luminescence color of ipqH2 from blue to yellow. By comparison with the emissions from the DMSO solution of ipqH2 and those in the literature [19,20,21,22,23,39,40,41], the high-energy emission bands at 441 and 447 nm are attributed to the enol-form LC and ILCT excited-state emission, while the low-energy emission bands at 560 and 561 nm are assigned to the keto-form LC and ILCT excited-state emission.
Complexes 1 and 2 showed no significant luminescence response upon the addition of methanol or ethanol. This may be attributed to the potential formation of strong hydrogen bonds between the hexafluorophosphate ions (PF6) and the N–H/O–H bonds, as discussed in the crystal structure analysis of complex 1, which effectively blocked the alcohol-induced excited-state long-range proton transfer and isomerization of the ligand.
In contrast, for the binuclear complexes 3 and 4, the N atoms on the imidazole C = N double bond and the quinoline N atom were already coordinated to the Cu(I) center, eliminating the possibility of ESPT and isomerization. Thus, they also exhibited no significant luminescence response to methanol or ethanol.
Water effect. As shown in Figure 10, the absorption spectra of ipqH2, complexes 1 and 2 remained largely unchanged when the water volume fraction (fw) was in the range of 0–50%. However, when fw ≥ 60%, the absorption below 400 nm decreased significantly, indicating that the high dielectric constant of water substantially reduced the solubility of ipqH2 and the complexes, leading to aggregation, precipitation, or solvation layer disruption, even though the solution remained visibly clear to the naked eye. Additionally, water might protonate the quinoline N or imidazole N, altering the π-conjugation system and affecting the ground-state electronic structure and electronic transitions.
On the other hand, as illustrated in Figure 8, Figure 10 and Figure S21 (excited at 365 nm, with a 395 nm filter), the luminescence intensity of ipqH2 and complexes 1 and 2 gradually weakened as fw increased from 0% to 90%. For ipqH2, the emission maximum wavelength first red-shifted from 463 nm to 476 nm and then blue-shifted back to 465 nm. The luminescence quenching may have been caused by the following possible mechanisms. The high-energy O–H vibrational modes in water enhanced non-radiative decay (non-radiative energy dissipation), reducing luminescence efficiency [14]. At high water fractions (fw ≥ 60%), low water solubility triggers molecular aggregation. This may result in aggregation-caused quenching (ACQ), prompted by the similar π···π interactions observed in complex 1 [42]. As a protic solvent, water might induce long-range excited-state proton transfer (similar to that in DMSO/MeOH and DMSO/EtOH), but its dominant effects here are aggregation and solubility changes.
Complexes 1 and 2 show obvious red-shifted emissions with high water content (fw ≥ 60%). At fw = 90%, the emission maxima of complexes 1 and 2 red-shifted significantly to 569 nm and 574 nm, respectively. This red shift likely arises from competitive hydrogen bonding: water competes with PF6 ions for H-bonding sites, forming N(O)–H⋯OH2 interactions. This lengthens the O–H bond, stabilizing a highly polar solvent-stabilized (IL + ML)CT state, lowering the excited-state energy level. When excited at 365 nm, the emission colors of ligand ipqH2 and complexes 14 in DMSO/H2O (v/v, 1:9) appeared as yellow, orange, orange, red, and reddish-brown, respectively, as shown in Figure 7.
DMF effect. As discussed earlier, the broad emission peak of complex 1 in DMSO suggests the existence of more than one excited state. As the volume fraction of DMF (fDMF) gradually increases in the DMSO/DMF mixed solvent (see Figure 10), the emission spectrum of complex 1 progressively splits into more distinct shoulder peaks. The peak around 470 nm slightly weakens, while the peak near 501 nm gradually red-shifts to approximately 530 nm and intensifies, accompanied by a noticeable change in the solution’s luminescence color from blue to bright yellow.
In contrast to complex 1, the luminescent response of complex 2 to DMF addition during the testing period was the opposite (see Figure S21). Instead of further peak splitting and red shift, its emission peak blue-shifted from 484 nm in DMSO to 468 nm (a 16 nm blue shift), with an approximately 56% increase in emission intensity. However, in pure DMF, the emission peak of complex 2 split, with the first peak (maximum at 468 nm) remaining largely unchanged, while the second peak red-shifted to 518 nm (see Figure 11). Some reports attributed such luminescent responses to the coordination of DMF with the metal center [43]. We conducted mass spectrometry tests on complexes 1 and 2 in DMSO/DMF (v:v, 1:9), but found no signal peaks indicating DMF participation in coordination, preliminarily ruling out the possibility of DMF coordinating with the Cu(I) ions. Therefore, we speculate that the response of the complexes to DMF is closely related to PF6 and the diphosphine ligands.
In complex 1, the PF6 ion forms N−H⋯F and O−H⋯F hydrogen bonds with the ipqH2 ligand, enhancing the rigidity of ipqH2. In the presence of a large amount of DMSO, DMSO may displace the PF6 ion and form intermolecular hydrogen bonds with the ligand ipqH2. Upon the addition of DMF, which also acts as a stronger hydrogen bond acceptor, DMF competes to form hydrogen bonds with ipqH2, weakening the interactions among PF6 ion, DMSO, and the ipqH2 ligand. This exposes the excited state of complex 1 to a highly polar solvent environment while accelerating hydrogen bond reorganization kinetics, resulting in a red shift of the (IL + ML)CT emission spectrum.
The differences in luminescent behavior between complexes 2 and 1 in DMSO/DMF may arise from structural variations in the bidentate diphosphine ligands, xantphos and POP, leading to differing solvent effects of DMF on the complexes. The lower steric hindrance and flexible ether linkage of the POP ligand allow significant distortion and multiple conformations in the excited state of complex 1. DMF stabilizes these distorted configurations through hydrogen bonding, causing the splitting of dual peaks and the redshift of the (IL + ML)CT peak. In contrast, the rigid framework and high steric hindrance of the xantphos ligand largely shield the metal center from short-term interference by DMF in the DMSO/DMF solvent and protect the original hydrogen bonds, maintaining the relative stability of the excited state, unless disturbed by high concentrations of DMF (e.g., pure DMF).
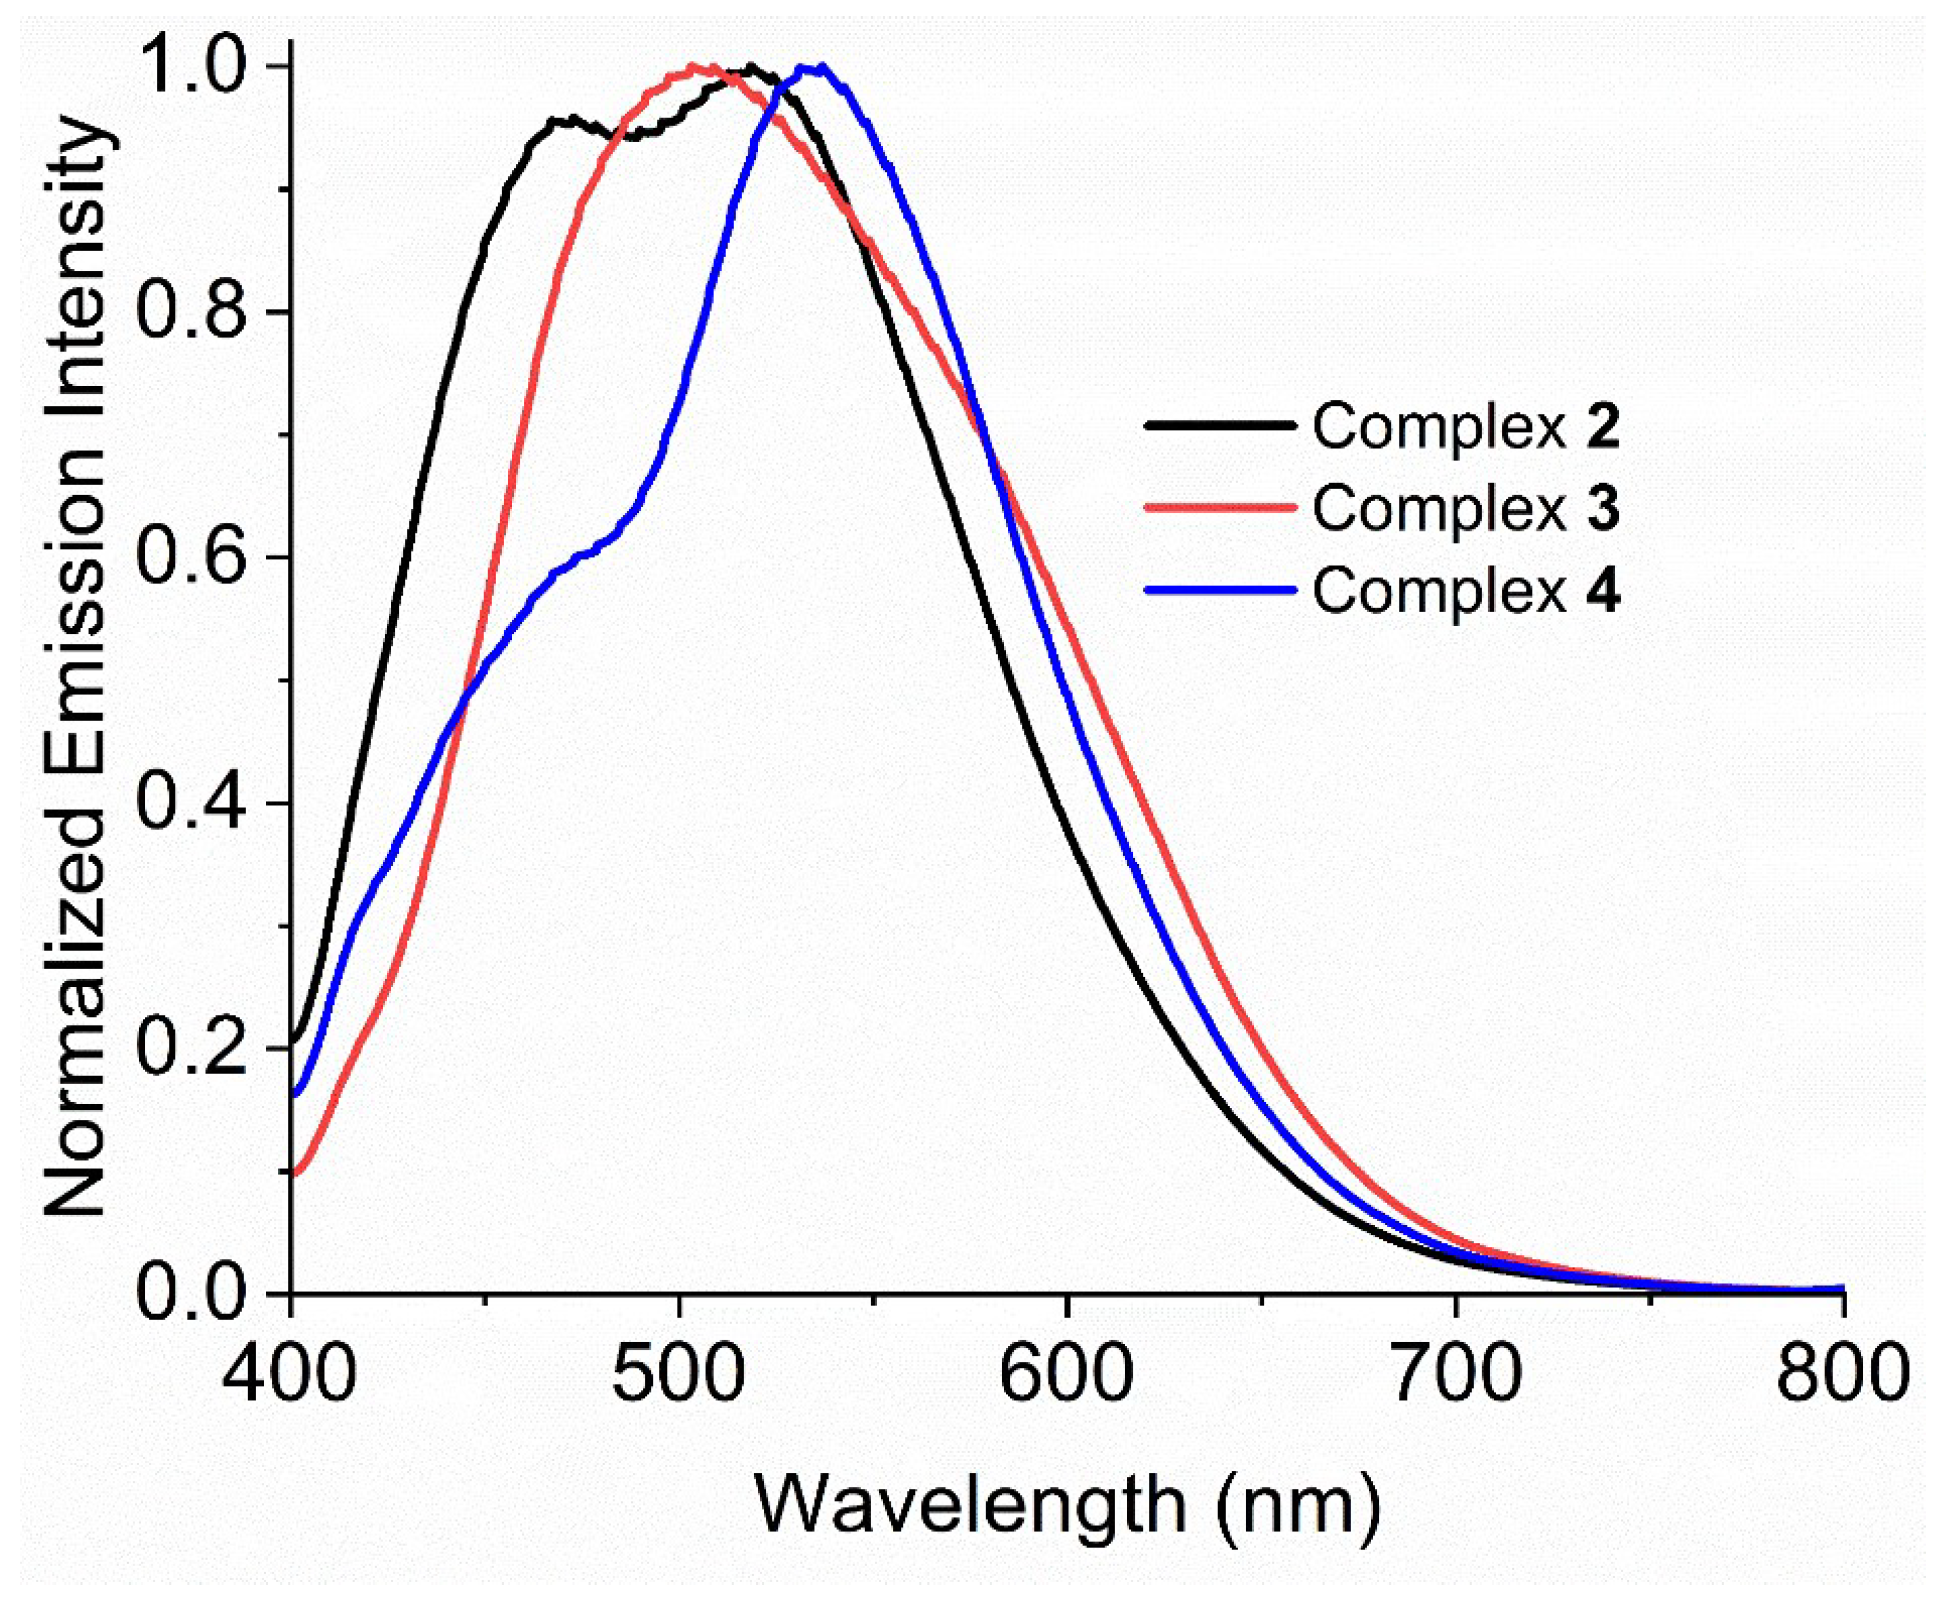
Both the DMSO solution and the DMSO/DMF (v:v = 1:9) solution of complex 3 exhibit broad emission spectra, with the maximum emission peak appearing at 494 nm. However, the emission spectrum in DMSO/DMF (v:v = 1:9) is broader. In pure DMF, the emission peak of complex 3 further broadens (see Figure 11), and the maximum red-shifts to 503 nm. For complex 4, the emission spectrum in DMSO/DMF (v:v = 1:9) becomes significantly broader compared to that in DMSO (maximum emission at 490 nm), with a flattened peak top appearing around 494–499 nm. In pure DMF (see Figure 11), the emission spectrum of complex 4 further broadens and splits into two peaks, with maxima at 470 nm and 537 nm, exhibiting behavior similar to that of complex 1 in DMSO/DMF. The response of complexes 3 and 4 to DMF in mixed solvents is also attributed to DMF modulating the luminescence of the Cu(I) complexes through hydrogen-bond competition and solvation shell reorganization.
The high-energy emission peaks of complexes 14 in DMSO/DMF and DMF closely match the emission position of the ipqH2 ligand, and are therefore assigned to LC transitions of the ligand perturbed by the metal center. Meanwhile, their low-energy emission peaks in the range of 503–537 nm are primarily attributed to 3(IL + ML)CT transitions.

3. Materials and Methods

3.1. Chemicals and Instrumentation

The 5,6-Diamino-1,10-phenanthroline (dap) was purchased from Alpha Chemical Co., Ltd., Zhengzhou, China. The 8-Hydroxyquinoline-2-carbaldehyde was obtained from Beijing Innochem Science & Technology Co., Ltd., Beijing, China. Xantphos and POP were both sourced from Shanghai J&K Chemical Technology Co., Ltd., Shanghai, China. The copper salt [Cu(CH3CN)4]PF6 was acquired from Shanghai Bide Pharmatech Ltd., Shanghia, China. All of the above chemicals were of analytical grade and used as received without further purification.
The solvents used in the experiments, including anhydrous ethanol (EtOH), n-hexane, methanol (CH3OH), dichloromethane (CH2Cl2), dimethyl sulfoxide (DMSO), acetonitrile (CH3CN), chloroform (CHCl3), N,N-dimethylformamide (DMF), and tetrahydrofuran (THF), were all purchased from Xilong Scientific Co., Ltd., Guangzhou, China and were of analytical grade.
Nuclear magnetic resonance (NMR) spectroscopy was conducted on a Bruker-400 MHz NMR spectrometer. The 1H NMR spectra were measured using DMSO-d6 as the solvent and Me4Si as the internal standard. The 31P {1H} NMR measurement procedure was as follows. First, the sample was dissolved in DMSO-d6, and the deuterium signal was used to activate the lock function to dynamically stabilize the magnetic field strength. After optimizing magnetic field homogeneity through shimming, the instrument configured the 31P channel parameters (spectral width, pulse width, etc.) and indirectly calibrated the chemical shift based on a preset reference frequency associated with the deuterium lock (e.g., the 31P chemical shift of H3PO4 was set as 0 ppm). Following the acquisition of the free induction decay (FID) signal, Fourier transformation and data processing directly yielded the calibrated 31P NMR spectrum without the need for additional internal or external standards. High-resolution mass spectrometry (HRMS) was performed on an AB SCIEX 4600 Triple TOF MS instrument in positive ion mode, with CH2Cl2/CH3OH as the mobile phase (see Figures S22–S26). Infrared (IR) spectroscopy was carried out using the KBr pellet method on a Bruker Optics TENSOR 27 FT-IR spectrometer. Ultraviolet–visible (UV–vis) absorption and fluorescence emission spectra were measured on a UV–vis spectrophotometer (UV-1800PC) and a Hitachi fluorescence spectrometer (F-4600), respectively.
The X-ray single-crystal diffraction (SCD) test was performed on an X-ray single-crystal diffractometer (Bruker Smart APEX II). All crystals were grown in test tubes containing a mixed solvent of CH2Cl2/n-hexane. To prevent crystal desiccation, the testing process was conducted at 150 K under a stream of liquid nitrogen. High-quality crystals were selected, immediately coated with colorless nail polish, and then transferred to an X-ray single-crystal diffractometer for measurement.
Data integration and intensity correction were performed using the Bruker SAINT program, while absorption correction was carried out with the SADABS program reported in 2009 [44]. The crystal structures were solved by direct methods using Olex2 and subsequently refined anisotropically for all non-hydrogen atoms using the SHELXT and SHELXL program reported in 2015 [45,46]. All the hydrogen atoms, including those from N–H and O–H groups, were generated theoretically according to the idealized geometric parameters and refined isotropically by riding on their corresponding parent atoms. Some severely disordered solvent molecules were not resolved. The contribution of some unresolved solvent molecules and some resolved but disordered solvent molecules in complexes 1 (one dichloromethane and 0.75 water molecules), 3 (one dichloromethane molecule and two water molecules) and 4 (five dichloromethane molecules and some unresolved solvent molecules) to the structure factors was removed using the SQUEEZE routine in the program PLATON reported in 2015. The final cycles of refinement were performed on the squeezed.hkl data [47].

3.2. Synthesis

3.2.1. IpqH2

The ligand ipqH2 was synthesized following a procedure similar to that reported in the literature [26], with slight modifications in the workup process. A mixture of 8-hydroxyquinoline-2-carbaldehyde (173.2 mg, 1.0 mmol) and dap (210.2 mg, 1.0 mmol) in 100 mL of ethanol was refluxed at 82 °C for 25 h, yielding a clear red solution. After cooling to room temperature, the solution was concentrated by evaporation to approximately 5 mL, followed by the addition of 150 mL of n-hexane and sonication, which rapidly produced a yellowish-brown precipitate. The precipitate was collected by filtration, washed three times with n-hexane, and dried to afford the target product as a yellowish-brown solid. Yield: 86.9% (631.4 mg). 1H NMR (400 MHz, DMSO-d6, δ, ppm): 13.99 (s, 1H, NH), 9.83 (s, 1H, OH), 9.10 (dd, J = 13.6 Hz, J′ = 2.8 Hz, 2H), 8.99 (d, J = 8.0 Hz, 1H), 8.89 (d, J = 8.0 Hz, 1H), 8.58 (d, J = 8.8 Hz, 1H), 8.50 (d, J = 8.8 Hz, 1H), 7.95 (dd, J = 8.0 Hz, J′ = 4.4 Hz, 1H), 7.88 (dd, J = 7.6 Hz, J′ = 4.4 Hz, 1H), 7.58–7.52 (m, 2H), 7.26 (d, J = 6.8 Hz, 1H). HRMS (m/z): 364.1176 [M + H+] (calcd. 364.1193). Characteristic IR spectra (KBr, cm−1): 3329 m (O–H), 3173 m (N–H), 3142 m (N–H), 3097 m (N–H).

3.2.2. [Cu(ipqH2)(POP)]PF6 (1)

Under a dry argon stream at room temperature in a Schlenk flask, [Cu(CH3CN)4]PF6 (37.3 mg, 0.1 mmol), ipqH2 (36.3 mg, 0.1 mmol), and POP (53.9 mg, 0.1 mmol) were added to 30 mL of CH2Cl2. The mixture was stirred at room temperature for 5 h, followed by vacuum filtration to remove trace precipitates. The resulting clear filtrate was transferred to a test tube, and n-hexane was slowly layered along the tube wall for crystal growth via solvent diffusion. The sealed system was stored in the dark for one week, yielding yellow prismatic crystals. The crystals were prone to efflorescence; therefore, the samples were typically dried under an infrared lamp prior to yield calculation. Yield: 64.7% (71.8 mg). 1H NMR (400 MHz, DMSO-d6, δ, ppm): 14.30 (s, 1H, NH), 9.83 (s, 1H, OH), 9.12 (d, J = 8.0 Hz, 1H), 9.03 (d, J = 8.4 Hz, 1H), 8.89 (s, br, 2H), 8.59 (d, J = 8.4 Hz, 1H), 8.52 (d, J = 8.8 Hz, 1H), 8.02–7.92 (m, 2H), 7.59–7.53 (m, 2H), 7.46 (t, J = 8.0 Hz, 2H), 7.33–7.19 (m, 15H), 7.12 (t, J = 7.6 Hz, 2H), 7.01–7.00 (m, 8H), 6.69 (s, br, 2H). 31P {1H} NMR (162 MHz, DMSO-d6, δ, ppm): −11.59 (s), −144.20 (septet, PF6). HRMS (m/z): 964.2038 [Cu(ipqH2)(POP)]+ (calcd. 964.2032). Characteristic IR spectra (KBr, cm−1): 3362 m (O–H), 3072 m (N–H), 843 vs (PF6).

3.2.3. [Cu(ipqH2)(xantphos)]PF6 (2)

The synthesis and drying of complex 2 followed a procedure similar to that of complex 1, with the only difference being the replacement of the diphosphine ligand with xantphos (57.9 mg, 0.1 mmol). After allowing the mixture to stand for two weeks, orange-yellow polyhedral crystals were obtained. Yield: 39.8% (45.8 mg). 1H NMR (400 MHz, DMSO-d6, δ, ppm): 14.29 (s, 1H, NH), 9.82 (s, 1H, OH), 9.07 (s, br, 2H), 8.61–8.50 (m, 4H), 7.97 (s, br, 2H), 7.90 (d, J = 7.6 Hz, 2H), 7.60–7.54 (m, 2H), 7.32–7.23 (m, 7H), 7.12 (t, J = 7.6 Hz, 8H), 6.95–6.94 (m, 8H), 6.61–6.60 (m, 2H), 1.77 (s, 6H). 31P {1H} NMR (162 MHz, DMSO-d6, δ, ppm): −12.83 (s), −144.19 (septet, PF6). HRMS (m/z): 1004.2374 [Cu(ipqH2)(xantphos)]+ (calcd. 1004.2344). Characteristic IR spectra (KBr, cm−1): 3367 w (O–H), 3139 w (N–H), 3077 w (N–H), 843 vs (PF6).

3.2.4. [Cu2(ipqH2)(POP)2](PF6)2 (3)

Under a dry argon atmosphere at room temperature in a Schlenk flask, [Cu(CH3CN)4]PF6 (37.3 mg, 0.1 mmol), ipqH2 (18.2 mg, 0.05 mmol), and POP (53.9 mg, 0.1 mmol) were dissolved in 30 mL of CH2Cl2. The mixture was stirred at room temperature for 4 h, followed by vacuum filtration to remove trace precipitates. The resulting clear filtrate was transferred to a test tube, and n-hexane was slowly layered along the tube wall for crystal growth via solvent diffusion. After sealing the system and storing it in the dark for approximately six days, brown-yellow block-shaped crystals were obtained. The samples were also dried under an infrared lamp prior to yield calculation due to the efflorescent nature of the crystals. Yield: 67.3% (62.5 mg). 1H NMR (400 MHz, DMSO-d6, δ, ppm): 14.31 (s, 1H, NH), 9.84 (s, 1H, OH), 9.12–9.03 (m, 2H), 8.89 (s, br, 2H), 8.61 (d, J = 8.0 Hz, 1H), 8.52 (d, J = 7.6 Hz, 1H), 8.03–7.94 (m, 2H), 7.60–7.00 (m, 55H), 6.68 (s, br, 4H). 31P {1H} NMR (162 MHz, DMSO-d6, δ, ppm): −11.58 (s), −19.29 (s), −144.20 (septet, PF6). HRMS (m/z): 1566.2853 {[Cu2(ipqH2)(POP)2]2+ − H+}+ (calcd. 1566.2878). Characteristic IR spectra (KBr, cm−1): 3456 w (O–H), 3330 m (N–H), 842 vs (PF6).

3.2.5. [Cu2(ipqH2)(xantphos)2](PF6)2 (4)

The synthesis and drying of complex 4 followed a procedure analogous to that of complex 3, with the sole modification being the substitution of the diphosphine ligand with xantphos (57.9 mg, 0.1 mmol). Through solvent diffusion over eight days, brown-yellow prismatic crystals were obtained. Yield: 49.1% (47.6 mg). 1H NMR (400 MHz, DMSO-d6, δ, ppm): 14.32 (s, 1H, NH), 9.85 (s, 1H, OH), 9.12 (d, J = 6.8 Hz, 1H), 9.04 (d, J = 7.8 Hz, 1H), 8.63–8.51 (m, 4H), 8.02–7.99 (m, 1H), 7.94–7.89 (m, 3H), 7.76 (d, J = 7.6 Hz, 2H), 7.61–7.55 (m, 2H), 7.43–7.23 (m, 29H), 7.12 (t, J = 7.2 Hz, 8H), 6.94 (s, br, 8H), 6.64–6.60 (m, 4H), 1.77 (s, 6H), 1.61 (s, 6H). 31P {1H} NMR (162 MHz, DMSO-d6, δ, ppm): −12.86 (s), −14.96 (s), −18.43 (s), −20.82 (s), −144.20 (septet, PF6). HRMS (m/z): 1646.3608 {[Cu2(ipqH2)(xantphos)2]2+ − H+}+ (calcd. 1646.3507). Characteristic IR spectra (KBr, cm−1): 3325 w (O–H), 842 vs (PF6).

4. Conclusions

This study successfully synthesized and characterized two mono- and two binuclear Cu(I) complexes using an 8-hydroxyquinoline-modified 1H-imidazo[4,5-f][1,10]phenanthroline ligand. Key findings revealed distinct solvent-mediated excited-state behaviors. In alcoholic solvents, free ipqH2 undergoes ESPT-driven enol-keto tautomerism, producing dual emission, but this process is suppressed upon Cu(I) coordination or by hydrogen bonds between ipqH2 and PF6 anions. Water induces aggregation-caused quenching and vibrational quenching, while also causing an unusual red-shifted emission (~570 nm) in complexes 1 and 2 due to hydrogen bonding stabilization of low-energy (IL + ML)CT states. In DMF, flexible POP-based complexes 1 and 3 exhibit peak splitting and red shift (~30 nm) as the solvent disrupts hydrogen bond networks, whereas rigid xantphos-based complexes 2 and 4 show resistance to short-term solvation effects. The diphosphine ligand’s steric flexibility and PF6 anions critically modulate solvent responses. These results establish structure–property relationships for solvent-responsive luminescence in Cu(I) systems, enabling the design of ESPT-based bioprobes, water/DMF-sensitive chemical sensors, and ratiometric solvent polarity indicators. This work advances the understanding of solvent-responsive Cu(I) photophysics and provides key principles for developing optoelectronic materials.

Supplementary Materials

The following supporting information can be downloaded at https://www.mdpi.com/article/10.3390/molecules30193973/s1, and CCDC 2483205–2483207 contain the supplementary crystallographic data for 4, 3 and 1·CH2Cl2, respectively. These data can be obtained free of charge from the Cambridge Crystallographic Data Centre, 12 Union Road, Cambridge CB2 1EZ, UK; fax: (+44) 1223-336-033; or e-mail: deposit@ccdc.cam.ac.uk. Molecular structures refinement data and X-Ray crystallographic files in CIF format for determination of the three structures are given in the supporting information. Tables and Figures giving additional crystallographic data, select refinement details and photophysical results are provided in Tables S1–S3 and Figures S1–S26.

Author Contributions

Validation, formal analysis, investigation, data curation, writing—original draft preparation, Z.Z.; validation, investigation, writing—review and editing, S.L.; investigation, S.C., Y.Z. and Z.J.; conceptualization, methodology, supervision, project administration, validation, formal analysis, data curation, writing—review and editing. X.L. All authors have read and agreed to the published version of the manuscript.

Funding

This research is supported financially by the National Natural Science Foundation of China (21271091).

Institutional Review Board Statement

Not applicable.

Informed Consent Statement

Not applicable.

Data Availability Statement

Data are supported within the article and Supplementary Materials.

Acknowledgments

During the preparation of this manuscript/study, the authors used deepseek for the purposes of some translation. The authors have reviewed and edited the output and take full responsibility for the content of this publication.

Conflicts of Interest

The authors declare no conflicts of interest. The funders had no role in the writing of the manuscript or in the decision to publish the results.

References

  1. Alexander, C.; Guo, Z.; Glover, P.B.; Faulkner, S.; Pikramenou, Z. Luminescent Lanthanides in Biorelated Applications: From Molecules to Nanoparticles and Diagnostic Probes to Therapeutics. Chem. Rev. 2025, 125, 2269–2370. [Google Scholar] [CrossRef]
  2. Lee, L.C.; Lo, K.K. Shining New Light on Biological Systems: Luminescent Transition Metal Complexes for Bioimaging and Biosensing Applications. Chem. Rev. 2024, 124, 8825–9014. [Google Scholar] [CrossRef]
  3. Chang, C.J. Introduction: Fluorescent Probes in Biology. Chem. Rev. 2024, 124, 11639–11640. [Google Scholar] [CrossRef]
  4. Yang, J.; Feng, X.; Xie, G.; Li, N.; Li, J.; Song, X.; Li, M.; Zhang, J.; Chang, X.; Li, K. A Modular Approach to Efficient Thermally Activated Delayed Fluorescence from Metal-Perturbed Intraligand Charge-Transfer Excited State of Au(I) Complexes. Sci. China Chem. 2024, 67, 4149–4157. [Google Scholar] [CrossRef]
  5. Tzeng, B.C.; Chen, Y.T.; Chang, J.H.; Sun, B.J.; Chang, A.H.H.; Chien, S.Y. Supramolecular Assembly, Solvent-Induced, and Mechanochromic Luminescence of Au(I) Quinoline-8-thiolates. Inorg. Chem. 2024, 63, 24532–24541. [Google Scholar] [CrossRef] [PubMed]
  6. Ni, J.; Zhang, Y.; Liu, S.; Zhang, J. Synthesis, Structure and Tri-stimuli-responsive Luminescent Switching Properties of a Bis(σ-acetylide) Platinum(II) Complex. J. Organomet. Chem. 2024, 1004, 122948. [Google Scholar] [CrossRef]
  7. Ni, J.; Guo, Z.; Zhu, Q.; Liu, S.; Zhang, J. The Two-stepwise Luminescent Switching Properties of Triple-stimuli-responsive Platinum(II) Complexes Bearing 4,4′-Bis (2-phenylethynyl)-2,2′-bipyridine Ligand. Dyes Pigments 2023, 217, 111406. [Google Scholar] [CrossRef]
  8. Joshi, B.; Shivashankar, M. Recent Advancement in the Synthesis of Ir-Based Complexes. ACS Omega 2023, 8, 43408–43432. [Google Scholar] [CrossRef]
  9. Gautam, A.; Sasmal, P.K. Eradication of Antibiotic-Resistant Gram-Positive Bacteria and Biofilms by Rationally Designed AIE-Active Iridium(III) Complexes Derived from Cyclometalating 2-Phenylquinoline and Ancillary Bipyridyl Ligands. Inorg. Chem. 2025, 64, 2905–2918. [Google Scholar] [CrossRef]
  10. Beaudelot, J.; Oger, S.; Perusko, s.; Phan, T.; Teunens, T.; Moucheron, C.; Evano, G. Photoactive Copper Complexes: Properties and Applications. Chem. Rev. 2022, 122, 16365–16609. [Google Scholar] [CrossRef]
  11. Cui, S.; Zhao, Z.; Wu, Z.; Chen, J.; Liu, S.; Hu, Z.; Zhou, T.; Li, X.L. A 1H-imidazo[4,5-f][1,10]phenanthroline Based Ligand and its Binuclear Cu(I) Complexes: Syntheses, Structures and Luminescence Sensing for Cr2O72− and MnO4. Polyhedron 2024, 263, 117210. [Google Scholar] [CrossRef]
  12. Liu, X.; Li, R.; Ma, L.; Feng, X.; Ding, Y. Influences of the Protonic State of an Imidazole-phenanthroline Ligand on the Luminescence Properties of Copper(I) Complexes: Experimental and Theoretical Research. New J. Chem. 2016, 40, 619–625. [Google Scholar] [CrossRef]
  13. Wu, Z.; Cui, S.; Zhao, Z.; He, B.; Li, X.L. Photophysical Properties of Homobimetallic Cu(I)–Cu(I) and Heterobimetallic Cu(I)–Ag(I) complexes of 2-(6-Bromo-2-pyridyl)-1H-imidazo[4,5-f][1,10]phenanthroline. New J. Chem. 2022, 46, 8881–8891. [Google Scholar] [CrossRef]
  14. Shi, Y.; Liu, X.; Shan, Y.; Zhang, X.; Kong, W.; Lu, Y.; Tan, Z.; Li, X.L. Naked-eye Repeatable Off–on–off and On–off–on Switching Luminescence of Copper(I)-1H-imidazo[4,5-f][1,10]phenanthroline Complexes with Reversible Acid–base Responses. Dalton Trans. 2019, 48, 2430–2441. [Google Scholar] [CrossRef]
  15. Li, G.F.; Zhang, X.Y.; Li, R.F.; Liu, X.F. Synthesis and Properties of Two New Cu(I) Complexes Based on 5,6-Substituted Imidazole-2,9-dimethyl-1,10-phenanthroline and Triphenylphosphine. Russ. J. Gen. Chem. 2016, 86, 387–390. [Google Scholar] [CrossRef]
  16. Rozhkov, A.V.; Eliseeva, S.N.; Baykov, S.V.; Zelenkov, L.E.; Goriachiy, D.O.; Taydakov, I.V. Copper(I) Ionic Complexes Based on Imidazo[4,5-f][1,10]phenanthrolin Diimine Chelating Ligands: Crystal Structures, and Photo- and Electroluminescence Properties. New J. Chem. 2020, 44, 110–120. [Google Scholar] [CrossRef]
  17. Xu, S.; Wang, J.; Zhao, F.; Xia, H.; Wang, Y. Copper(I) Complexes of Phenanthrolineimidazole Ligands: Structures, Photophysical Properties, and Quantum Chemical Studies. Transit. Met. Chem. 2015, 40, 723–732. [Google Scholar] [CrossRef]
  18. Hori, A.; Matsumoto, A.; Ikenouchi, J.; Konishi, G. D−π−A Fluorophores with Strong Solvatochromism for Single-Molecule Ratiometric Thermometers. J. Am. Chem. Soc. 2025, 147, 9953–9961. [Google Scholar] [CrossRef] [PubMed]
  19. Wang, Y.; Mu, H.; Sun, Y.; Gao, J.; Zhu, X.; Li, H. Modulating the ESIPT Mechanism and Luminescence Characteristics of Two Reversible Fluorescent Probes by Solvent Polarity: A Novel Perspective. Molecules 2024, 29, 1629. [Google Scholar] [CrossRef]
  20. Pylova, E.K.; Sukhikh, T.S.; Prieto, A.; Jaroschik, F.; Konchenko, S.N. Chemistry of 2-(2′-Aminophenyl)benzothiazole Derivatives: Syntheses, Photophysical Properties and Applications. Molecules 2024, 30, 1659. [Google Scholar] [CrossRef]
  21. Nakashima, K.; Georgiev, A.; Yordanov, D.; Matsushima, Y.; Hirashima, S.; Miura, T.; Antonov, L. Solvent-Triggered Long-Range Proton Transport in 7-Hydroxyquinoline Using a Sulfonamide Transporter Group. J. Org. Chem. 2022, 87, 6794–6806. [Google Scholar] [CrossRef]
  22. Yi, S.; Li, B.; Fu, P.; Pan, M.; Su, C.Y. Interplay of Dual-Proton Transfer Relay to Achieve Full-Color Panel Luminescence in Excited-State Intramolecular Proton Transfer (ESIPT) Fluorophores. ACS Appl. Mater. Interfaces 2023, 15, 3172–3181. [Google Scholar] [CrossRef]
  23. Das, M.; Brahma, M.; Krishnamoorthy, G. Light-Driven Switching Between Intramolecular Proton-Transfer and Charge-Transfer States. J. Phys. Chem. B 2021, 125, 2339–2350. [Google Scholar] [CrossRef] [PubMed]
  24. Yang, K.; Li, S.; Zhang, F.Q.; Zhang, X.M. Simultaneous Luminescent Thermochromism, Vapochromism, Solvatochromism, and Mechanochromism in a C3-Symmetric Cubane [Cu4I4P4] Cluster Without Cu−Cu Interaction. Inorg. Chem. 2016, 55, 7323–7325. [Google Scholar] [CrossRef] [PubMed]
  25. Xu, X.; Hu, G.; Mo, L.; Li, Y.; Wei, H.; Lei, B.; Zhang, X.; Hu, C.; Zhuang, J.; Liu, Y. Red, Orange, Yellow and Green Luminescence by Carbon Dots: Hydrogen-Bond-Induced Solvation Effects. Nanoscale 2021, 13, 6846–6855. [Google Scholar] [CrossRef] [PubMed]
  26. Xu, X.; Wang, S.; Mi, Y.; Zhao, H.; Zheng, Z.; Zhao, X. A Hydroxyquinoline-Appended Ruthenium(II)-polypyridyl Complex That Induces and Stabilizes G-quadruplex DNA. J. Coord. Chem. 2019, 72, 201–217. [Google Scholar] [CrossRef]
  27. Sun, Z.; Zhu, N.; Pan, X.; Wang, G.; Li, Z.; Xin, X.; Han, H.; Feng, Y.; Jin, Q.; Yang, Y.; et al. A New Application of Terahertz Time-domain Absorption Spectra in Luminescent Complexes: Characterization of the C–H⋯π Weak Interactions in Cu(I) Complexes. Dalton Trans. 2021, 50, 10214–10224. [Google Scholar] [CrossRef]
  28. Carosati, E.; Sciabola, S.; Cruciani, G. Hydrogen Bonding Interactions of Covalently Bonded Fluorine Atoms: From Crystallographic Data to a New Angular Function in the GRID Force Field. J. Med. Chem. 2004, 47, 5114–5125. [Google Scholar] [CrossRef]
  29. Jin, L.; Lei, Y.; Dodd, A.; Nockemann, P.; Gunaratne, H.Q.N. A Bis-Imidazolium Receptor for the Selective Crystallization of Fluoride through Hydrogen Bonding. Cryst. Growth Des. 2025, 25, 1725–1730. [Google Scholar] [CrossRef]
  30. Ma, X.; Lu, J.; Yang, P.; Zhang, Z.; Huang, B.; Li, R.; Ye, R. 8-Hydroxyquinoline-Modified Ruthenium(II) Polypyridyl Complexes for JMJD Inhibition and Photodynamic Antitumor Therapy. Dalton Trans. 2022, 51, 13902–13909. [Google Scholar] [CrossRef]
  31. Wang, J.; Lin, W.; Li, W. Single Fluorescent Probe Displays a Distinct Response to Zn2+ and Cd2+. Chem. Eur. J. 2012, 18, 13629–13632. [Google Scholar] [CrossRef] [PubMed]
  32. Keller, S.; Pertegás, A.; Longo, G.; Martínez, L.; Cerdá, J.; Junquera-Hernández, J.M.; Prescimone, A.; Constable, E.C.; Housecroft, C.E.; Ortí, E.; et al. Shine Bright or Live Long: Substituent Effects in [Cu(N^N)(P^P)]+-based Light-emitting Electrochemical Cells Where N^N is a 6-Substituted 2,2′-Bipyridine. J. Mater. Chem. C 2016, 4, 3857–3871. [Google Scholar] [CrossRef]
  33. Crestani, M.G.; Manbeck, G.F.; Brennessel, W.W.; McCormick, T.M.; Eisenberg, R. Synthesis and Characterization of Neutral Luminescent Diphosphine Pyrrole- and Indole-Aldimine Copper(I) Complexes. Inorg. Chem. 2011, 50, 7172–7188. [Google Scholar] [CrossRef] [PubMed]
  34. Shee, M.; Schleisiek, J.; Maity, N.; Das, G.; Montesdeoca, N.; Ha-Thi, M.; Gore, K.R.; Karges, J.; Singh, N.D.P. Exploring Excited-State Intramolecular Proton-Coupled Electron Transfer in Dinuclear Ir(III)-Complex via Covalently Tagged Hydroquinone: Phototherapy Through Futile Redox Cycling. Small 2025, 21, 2408437. [Google Scholar] [CrossRef]
  35. Zhao, N.; Wu, Y.; Wen, H.; Zhang, X.; Chen, Z.N. Conversion from ILCT to LLCT/MLCT Excited State by Heavy Metal Ion Binding in Iridium(III) Complexes with Functionalized 2,2′-Bipyridyl Ligands. Organometallics 2009, 28, 5603–5611. [Google Scholar] [CrossRef]
  36. Favarin, L.R.V.; Rosa, P.P.; Pizzuti, L.; Machulek, A., Jr.; Caires, A.R.L.; Bezerra, L.S.; Pinto, L.M.C.; Maia, G.; Gatto, C.C.; Back, D.F.; et al. Synthesis and Structural Characterization of New Heteroleptic Copper(I) Complexes Based on Mixed Phosphine/Thiocarbamoyl-pyrazoline ligands. Polyhedron 2017, 121, 185–190. [Google Scholar] [CrossRef]
  37. Shahida, M.; Misra, A. Photoenolization via Excited State Proton Transfer and Ion Sensing Studies of Hydroxy Imidazole Derivatives. J. Photochem. Photobiol. A Chem. 2017, 335, 190–199. [Google Scholar] [CrossRef]
  38. Alarcos, N.; Gutierrez, M.; Liras, M.; Sánchez, F.; Douhal, A. An Abnormally Slow Proton Transfer Reaction in a Simple HBO Derivative Due to Ultrafast Intramolecular-Charge Transfer Events. Phys. Chem. Chem. Phys. 2015, 17, 16257–16269. [Google Scholar] [CrossRef]
  39. Kang, B.; Ko, K.C.; Park, S.-Y.; Jang, D.J.; Lee, J.Y. Solvent Effect on the Excited-State Proton Transfer of 7-Hydroxyquinoline Along a Hydrogen-Bonded Ethanol Dimer. Phys. Chem. Chem. Phys. 2011, 13, 6332–6339. [Google Scholar] [CrossRef]
  40. Kwon, O.-H.; Lee, Y.-S.; Yoo, B.K.; Jang, D.J. Excited-State Triple Proton Transfer of 7-Hydroxyquinoline Along a Hydrogen-Bonded Alcohol Chain: Vibrationally Assisted Proton Tunneling. Angew. Chem. Int. Ed. 2006, 45, 415–419. [Google Scholar] [CrossRef]
  41. Chou, P.-T.; Wei, C.-Y.; Wang, C.-R.C.; Hung, F.-T.; Chang, C.-P. Proton-Transfer Tautomerism of 7-Hydroxyquinolines Mediated by Hydrogen-Bonded Complexes. J. Phys. Chem. A 1999, 103, 1939–1949. [Google Scholar] [CrossRef]
  42. Zhang, L.; Chai, F.; Dong, H.; Bao, Y.; Yan, K.; Min, S.; Yao, Y.; Li, S.; Liu, Y.; Gao, T.; et al. Coumarin-Based ACQ-AIE Conversion Photosensitizer for Mitochondrial Imaging and Synergistic Cancer Therapy. J. Phys. Chem. Lett. 2024, 15, 10866–10872. [Google Scholar] [CrossRef]
  43. Hu, Y.; Khoo, R.S.H.; Lu, J.; Zhang, X.; Zhang, J. Robust Carbazole-Based Rare-Earth MOFs: Tunable White-Light Emission for Temperature and DMF Sensing. ACS Appl. Mater. Interfaces 2022, 14, 41178–41185. [Google Scholar] [CrossRef]
  44. Bruker. APEX2, SAINT and SADABS; Bruker AXS Inc.: Madison, WI, USA, 2009. [Google Scholar]
  45. Sheldrick, G.M. SHELXT-Integrated Space-group and Crystal-structure Determination. Acta Cryst. 2015, A71, 3–8. [Google Scholar] [CrossRef]
  46. Sheldrick, G.M. Crystal structure refinement with SHELXL. Acta Crystallogr. Sect. C Struct. Chem. 2015, 71, 3–8. [Google Scholar] [CrossRef]
  47. Spek, A.L. PLATON SQUEEZE: A Tool for the Calculation of the Disordered Solvent Contribution to the Calculated Structure Factors. Acta Crystallogr. Sect. C Struct. Commun. 2015, 71, 9–18. [Google Scholar] [CrossRef]
Scheme 1. Synthetic routes of the Cu(I) complexes.
Molecules 30 03973 sch001
Figure 1. ORTEP drawing of the cation dimer of complex 1 in the asymmetric unit with thermal ellipsoids at 50% probability. For clarity, most of the hydrogen atoms and the benzene rings in the PPh2 units of the POP ligand have been omitted.
Molecules 30 03973 g001
Figure 2. ORTEP drawing of the cation of complex 3 with thermal ellipsoids at 50% probability. For clarity, most of the hydrogen atoms and the benzene rings in the PPh2 units of the POP ligand have been omitted.
Molecules 30 03973 g002
Figure 3. ORTEP drawing of complex 4 with thermal ellipsoids at 50% probability. For clarity, the counter ions, most of the hydrogen atoms and the benzene rings from PPh2 units of xantphos are omitted.
Molecules 30 03973 g003
Figure 4. The hydrogen bonds between the cation dimer formed through π⋯π interactions and one PF6 ion for complex 1. For clarity, most of the hydrogen atoms and the benzene rings from PPh2 units of POP are omitted.
Molecules 30 03973 g004
Figure 5. Electron absorption spectra (a) and emission spectra in the solid state (b) and in DMSO solutions (c) for ipqH2 and complexes 14.
Molecules 30 03973 g005
Figure 6. The UV-vis absorption spectra and emission spectra of ligand ipqH2 (a,b) and complex 1 (c,d) in DMSO-containing mixed solvents (VDMSO/Vother solvent = 1:9).
Molecules 30 03973 g006
Figure 7. Luminescence photos of ligand ipqH2 and complexes 14 in different mixed solvents (VDMSO:Vother solvent = 1:9). The solvents shown in the figure are the second solvents other than DMSO.
Molecules 30 03973 g007
Figure 8. Variation in the UV-vis absorption and emission spectra of ligand ipqH2 as a function of EtOH and water fractions (vol%) in DMSO/EtOH (a,b) and DMSO/H2O (c,d) mixed solvents.
Molecules 30 03973 g008
Figure 9. Schematic diagram of possible MeOH- and EtOH-assisted long-range ESIPT excited-state proton transfer mechanisms of ipqH2.
Molecules 30 03973 g009
Figure 10. Variation in the UV-vis absorption and emission spectra of complex 1 as a function of H2O and DMF fractions (vol%) in DMSO/H2O (a,b) and DMSO/DMF (c,d) mixed solvents.
Molecules 30 03973 g010
Figure 11. Emission spectra of complexes 24 in DMF.
Molecules 30 03973 g011
Table 1. Selected bond lengths (Å) and angles (º) for 1·CH2Cl2, 3 and 4.
1·CH2Cl234
Cu1–N12.067 (5)Cu1–N12.063 (2)Cu1–N12.047 (5)
Cu1–N22.092 (5)Cu1–N22.098 (2)Cu1–N22.083 (5)
Cu2–N62.068 (5)Cu2–N32.098 (2)Cu2–N42.099 (5)
Cu2–N72.069 (5)Cu2–N52.204 (2)Cu2–N52.123 (5)
Cu1–P12.2990 (16)Cu1–P12.2281 (7)Cu1–P12.239 (2)
Cu1–P22.2306 (16)Cu1–P22.2740 (7)Cu1–P22.2334 (19)
Cu2–P32.2395 (16)Cu2–P32.3142 (7)Cu2–P32.2816 (19)
Cu2–P42.2948 (16)Cu2–P42.2516 (7)Cu2–P42.2765 (18)
C13–N31.351 (8)C13–N31.322 (3)C13–N31.394 (9)
C13–N41.321 (8)C13–N41.360 (3)C13–N41.330 (8)
C71–N81.323 (7)C21–O11.355 (3)C21–O11.337 (8)
C71–N91.363 (7)
C21–O11.389 (8)
C79–O31.361 (7)
N1–Cu1–N280.0 (2)N1–Cu1–N280.35 (8)N1–Cu1–N280.6 (2)
N6–Cu2–N780.78 (19)N3–Cu2–N579.36 (8)N4–Cu2–N579.2 (2)
P1–Cu1–P2114.74 (6)P1–Cu1–P2120.80 (3)P1–Cu1–P2116.75 (7)
P3–Cu2–P4112.99 (6)P3–Cu2–P4117.20 (3)P3–Cu2–P4129.85 (7)
N1–Cu1–P199.82 (12)N1–Cu1–P1115.00 (6)N1–Cu1–P1117.69 (16)
N1–Cu1–P2124.61 (15)N1–Cu1–P298.62 (6)N1–Cu1–P2117.66 (17)
N2–Cu1–P199.82 (12)N2–Cu1–P1130.13 (6)N2–Cu1–P1107.73 (15)
N2–Cu1–P2128.96 (14)N2–Cu1–P2101.31 (6)N2–Cu1–P2109.16 (15)
N6–Cu2–P3118.40 (13)N3–Cu2–P3101.51 (6)N4–Cu2–P3104.70 (16)
N6–Cu2–P4105.34 (13)N3–Cu2–P4118.24 (6)N4–Cu2–P4106.90 (16)
N7–Cu2–P3127.80 (13)N5–Cu2–P3109.26 (6)N5–Cu2–P3110.80 (16)
N7–Cu2–P4106.14 (13)N5–Cu2–P4123.61 (6)N5–Cu2–P4112.65 (16)
Table 2. Photophysical properties of ligand ipqH2 and complexes 14.
Compoundλabs/nm (ε/M−1cm−1) (DMSO)λem/nm (Solid)λem/nm (DMSO)
ipqH2283 (43,370), 315 (30,030), 364 (26,480), 381 (22,400)473463
1291 (67,880), 360 (30,830), 400~500477, 551501
2291 (80,220), 360 (31,900), 400~500475, 550484
3290 (63,530), 360 (23,550), 400~500472, 609494
4287 (68,770), 360 (21,160), 400~500472, 543490
Disclaimer/Publisher’s Note: The statements, opinions and data contained in all publications are solely those of the individual author(s) and contributor(s) and not of MDPI and/or the editor(s). MDPI and/or the editor(s) disclaim responsibility for any injury to people or property resulting from any ideas, methods, instructions or products referred to in the content.