Characterization of Bulgarian Rosehip Oil by GC-MS, UV-VIS Spectroscopy, Colorimetry, FTIR Spectroscopy, and 3D Excitation–Emission Fluorescence Spectra
Abstract
1. Introduction
2. Results and Comments
2.1. GC-MS Analysis
2.1.1. Summary of Results
2.1.2. Lipid Health Indices
2.2. Transmission Spectroscopy
2.3. Color Analysis
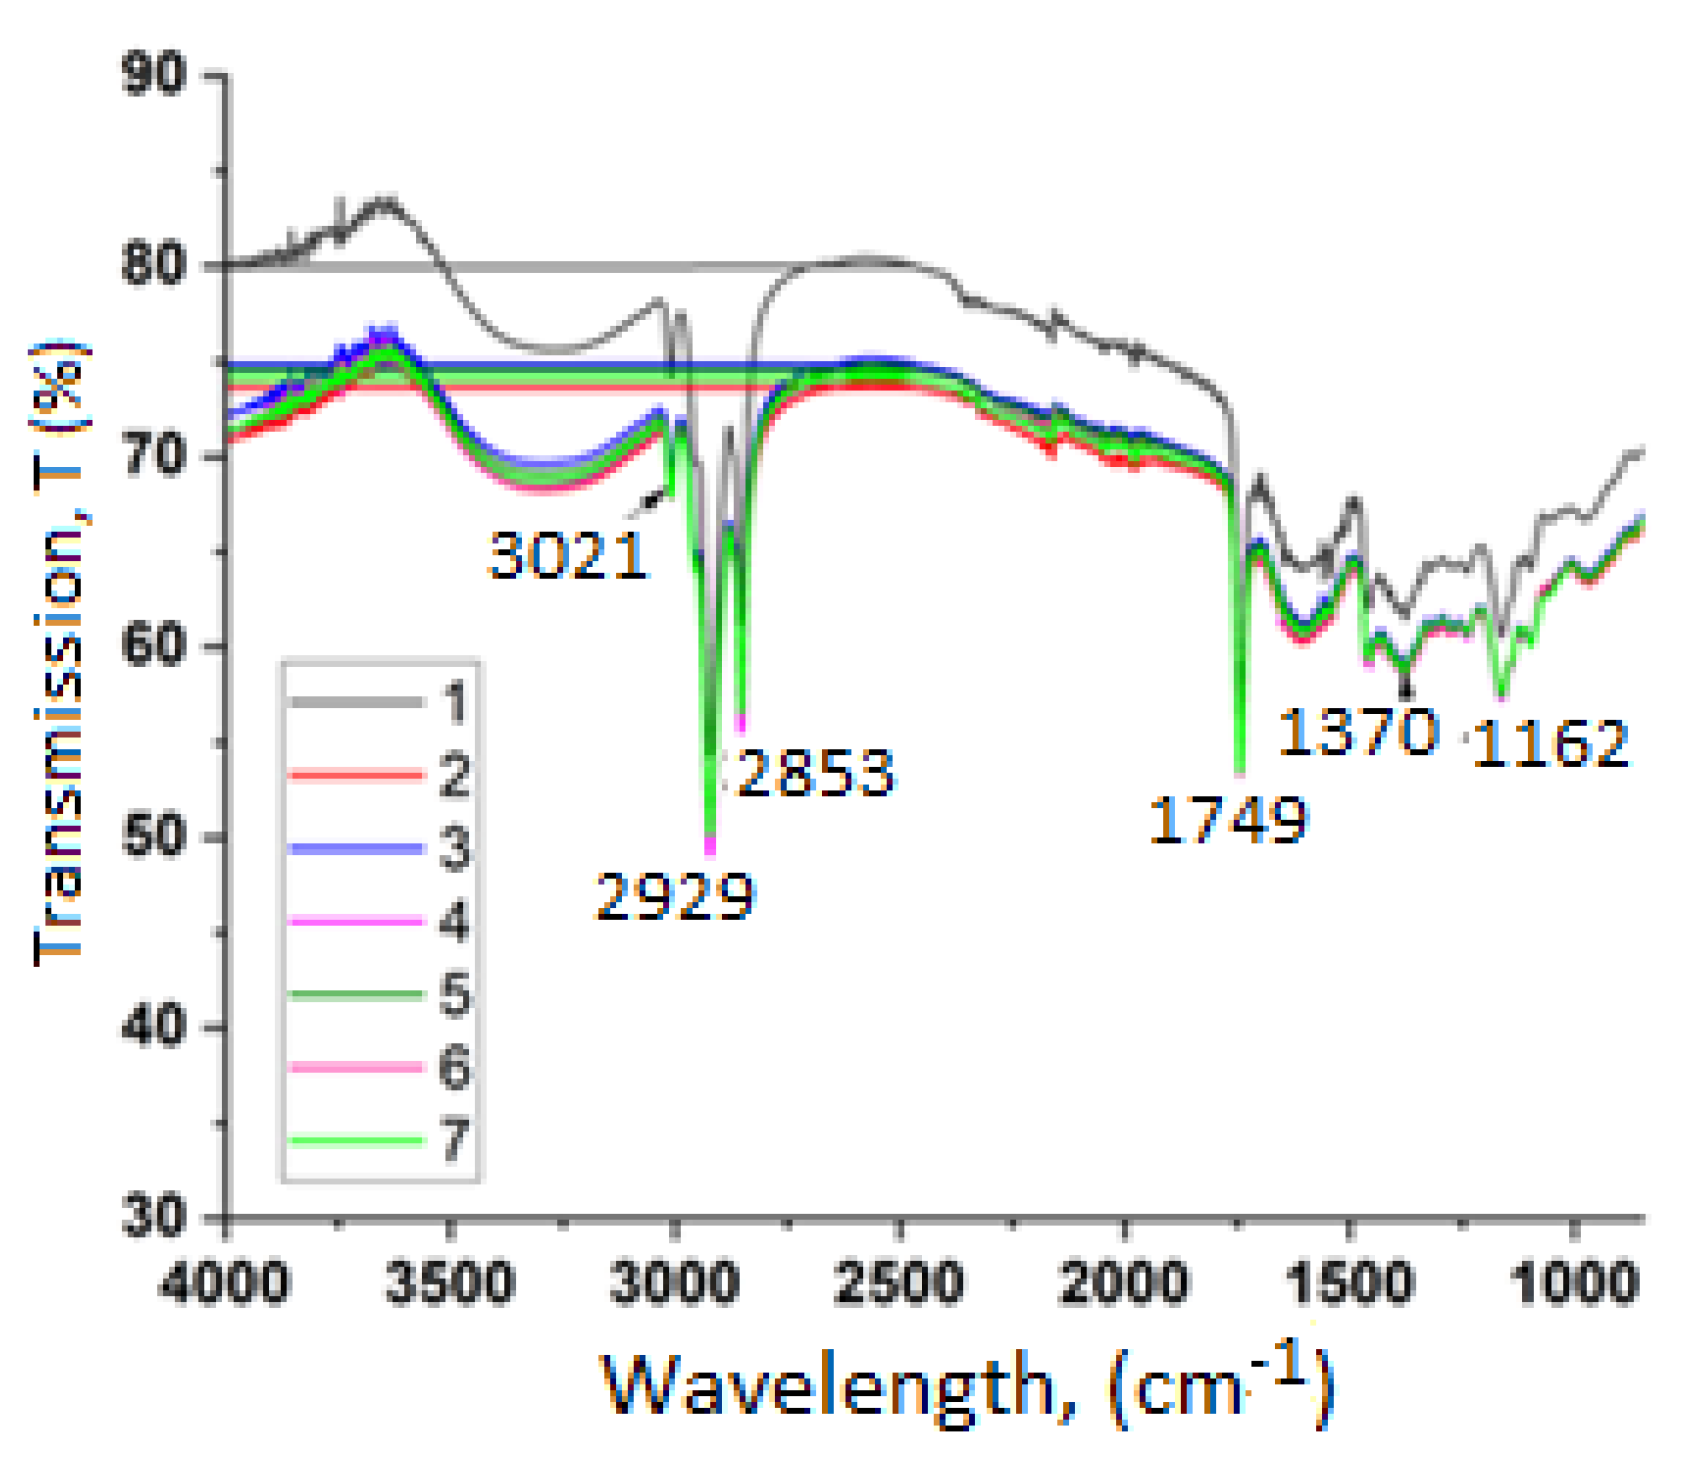
2.4. FTIR Spectroscopy Results
- Stretching vibrations of =C–H bonds around 3021 cm−1 which are indicative of the presence of unsaturated fatty acids.
- Absorption maxima at approximately 2929 cm−1 and 2853 cm−1 correspond to the asymmetric and symmetric stretching of –CH2 groups located in the aliphatic chains of fatty acids [2]. The intensity of these peaks is associated with the relative percentage of linoleic and linolenic acids.
- The peak around 1749 cm−1 is attributed to the stretching of the ester carbonyl (C=O) group in triglycerides [16]. This band is mainly linked to triglycerides and esters of polyunsaturated fatty acids.
- A peak near 1370 cm−1 is observed resulting from bending vibrations of CH2 and CH3 groups [17].
2.5. Three-Dimensional Excitation–Emission Matrix (EEM) Fluorescence Analysis
- (i)
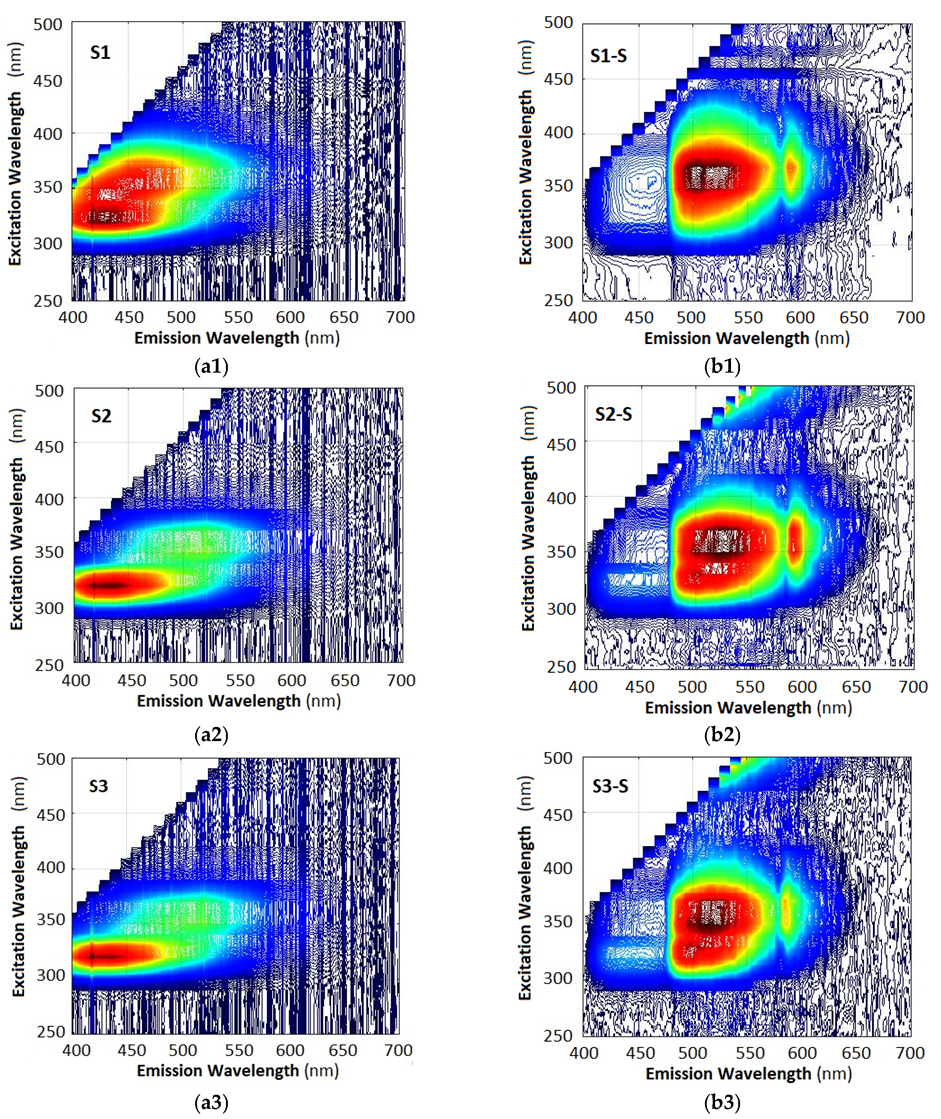
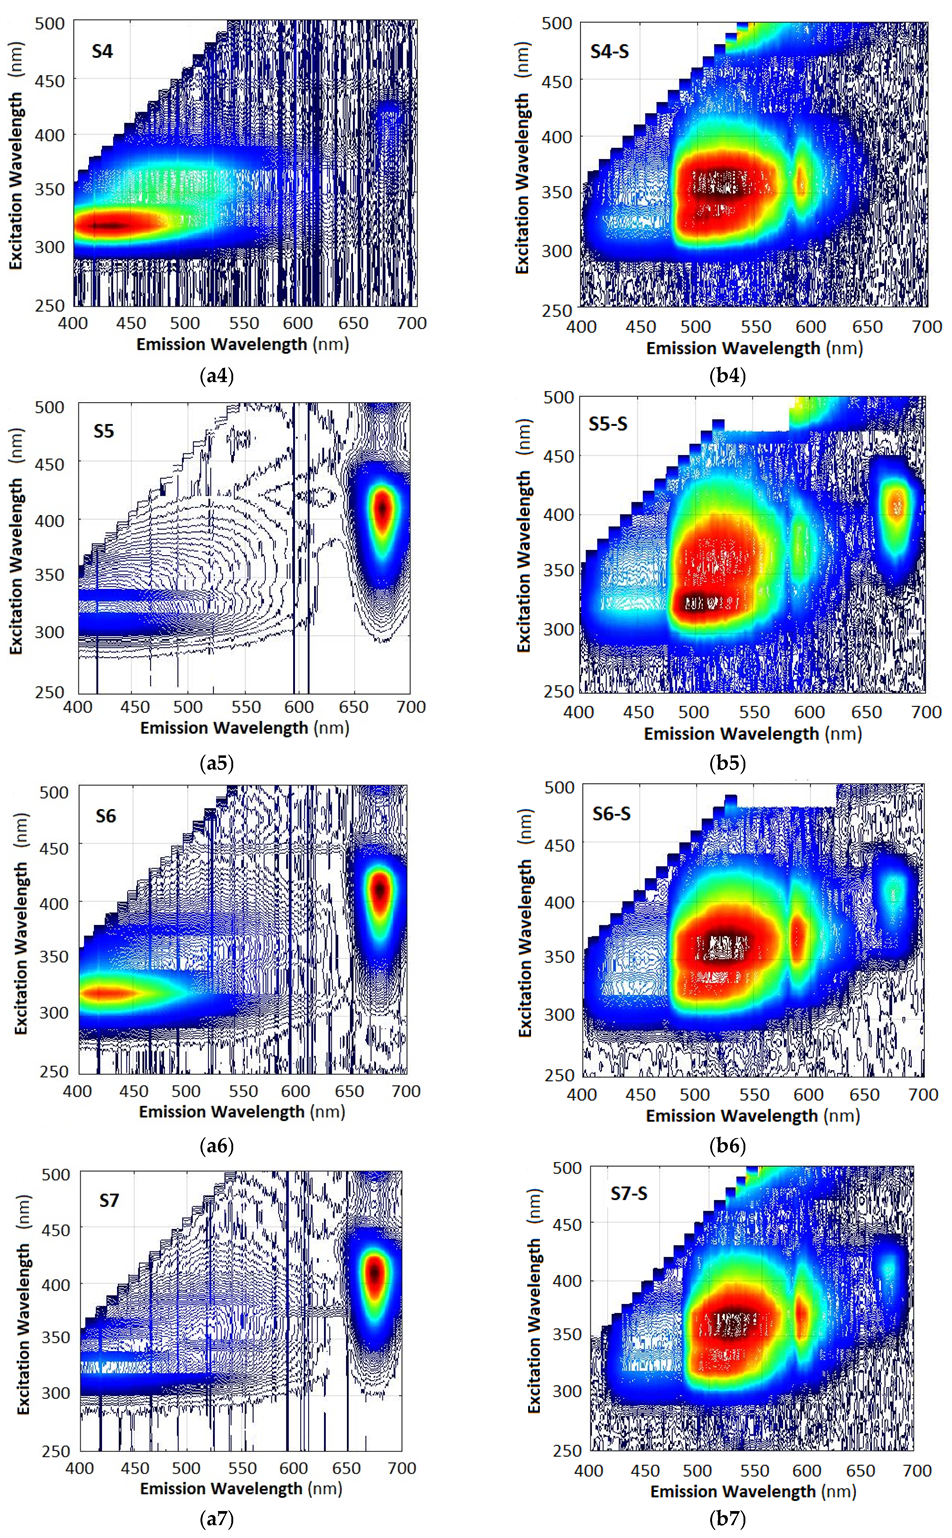
- The 3D spectra of each sample are strictly individual, whether measured with a fiber spectrometer (left column) or with a smartphone spectrometer (right column). This observation implies that fluorescence spectra can be used to identify the particular type of oil.
- (ii)
- While the spectra are individual, the particular differences are in the spectral range of 400 nm (violet-blue) to 620 nm (orange-red). However, the spectra measured with the fiber spectrometer are weaker than those measured with the smartphone spectrometer, as is evident when we compare Figure 6a8,b8.
- (iii)
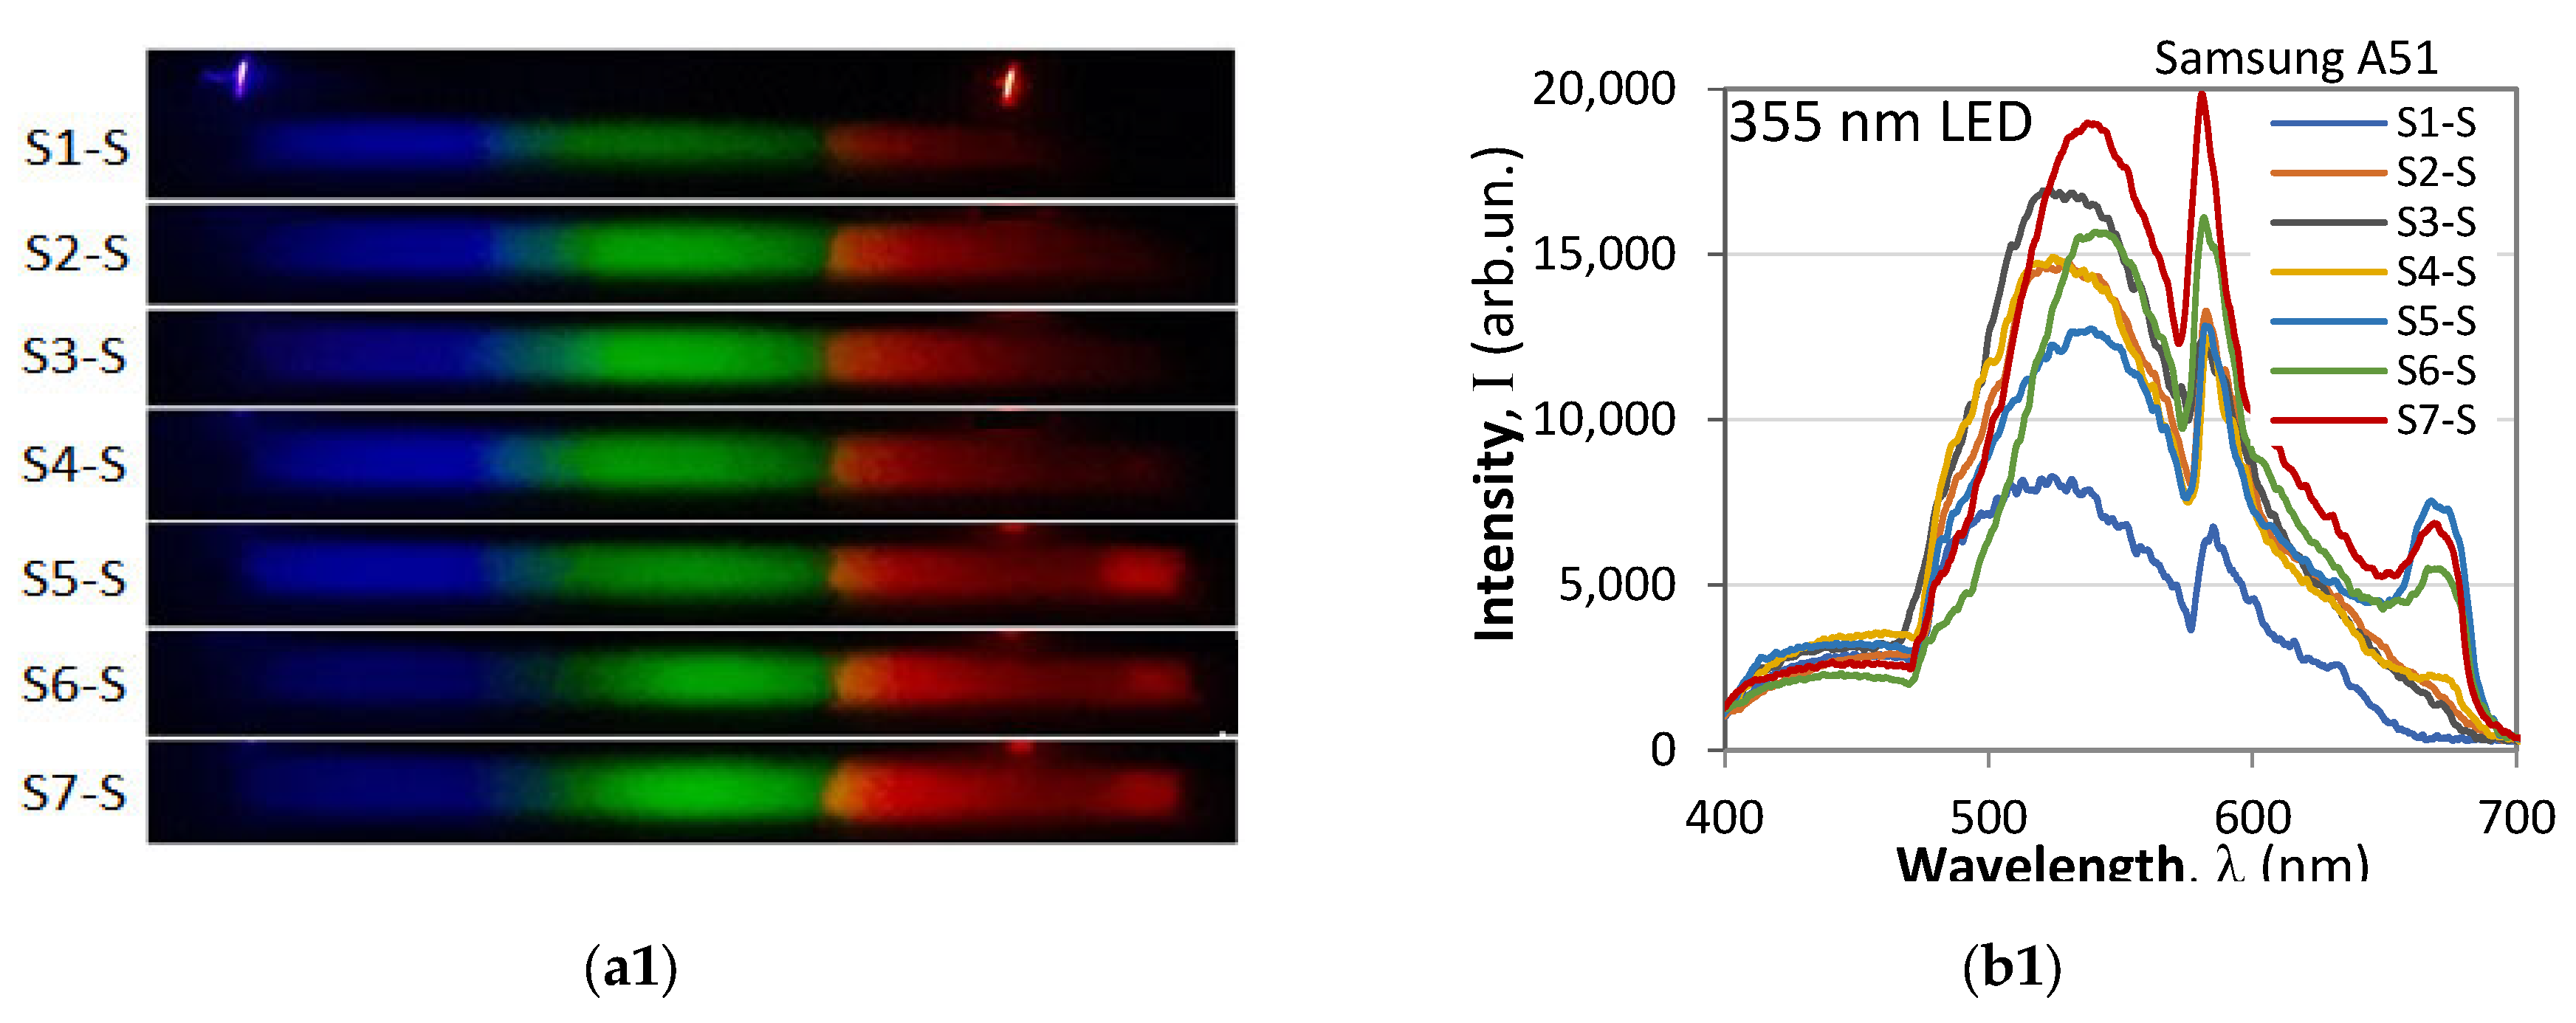
- The 3D spectra measured with a smartphone spectrometer appear drastically different from those measured with a fiber spectrometer, the most evident difference being the strong suppression of the blue (B) component at 400 nm to 475 nm, the boost in the middle green (G) component at 475 nm to 570 nm, and suppression of the red (R) component at 600 nm to 700 nm. These deformations of the spectra are in agreement with the R, G, B weight coefficients from Equation (6).
- (iv)
- The spectra taken with a smartphone usually exhibit, though to a different extent, a peak around 585 nm where the G and R filter transmissions intersect.
- (i)
- The model which best reproduces the 675 nm chlorophyll maximum is the Nothing Phone (R), while the model that exhibits the least spectral jump at 475 nm is the Xiaomi T11 Pro. The Samsung A41 is a compromise.
- (ii)
- In all of the phones the blue components from the photos of the spectra are as strong as the green components, and it is the weighting coefficients that introduce the discrepancies in the spectra in Figure 7b1–b3. In principle these deformations can be remedied by modifying the weight coefficients from Equation (6).
3. Discussion
3.1. Discussion on the CG-MS Results
3.2. Discussion on Optical Methods
3.2.1. Transmission Spectra and Colorimetry
3.2.2. FTIR Spectroscopy
3.2.3. 3D EEM Fluorescence
4. Materials, Methods, and Experimental Setups
4.1. Description of the Samples Under Study
4.2. Methods
4.2.1. Gas Chromatographic Analysis
4.2.2. Lipid Quality Indices
4.2.3. UV-VIS Spectra and Color Characteristics
4.2.4. IR Spectra
4.2.5. Fluorescence Measurement Arrangements
- (A)
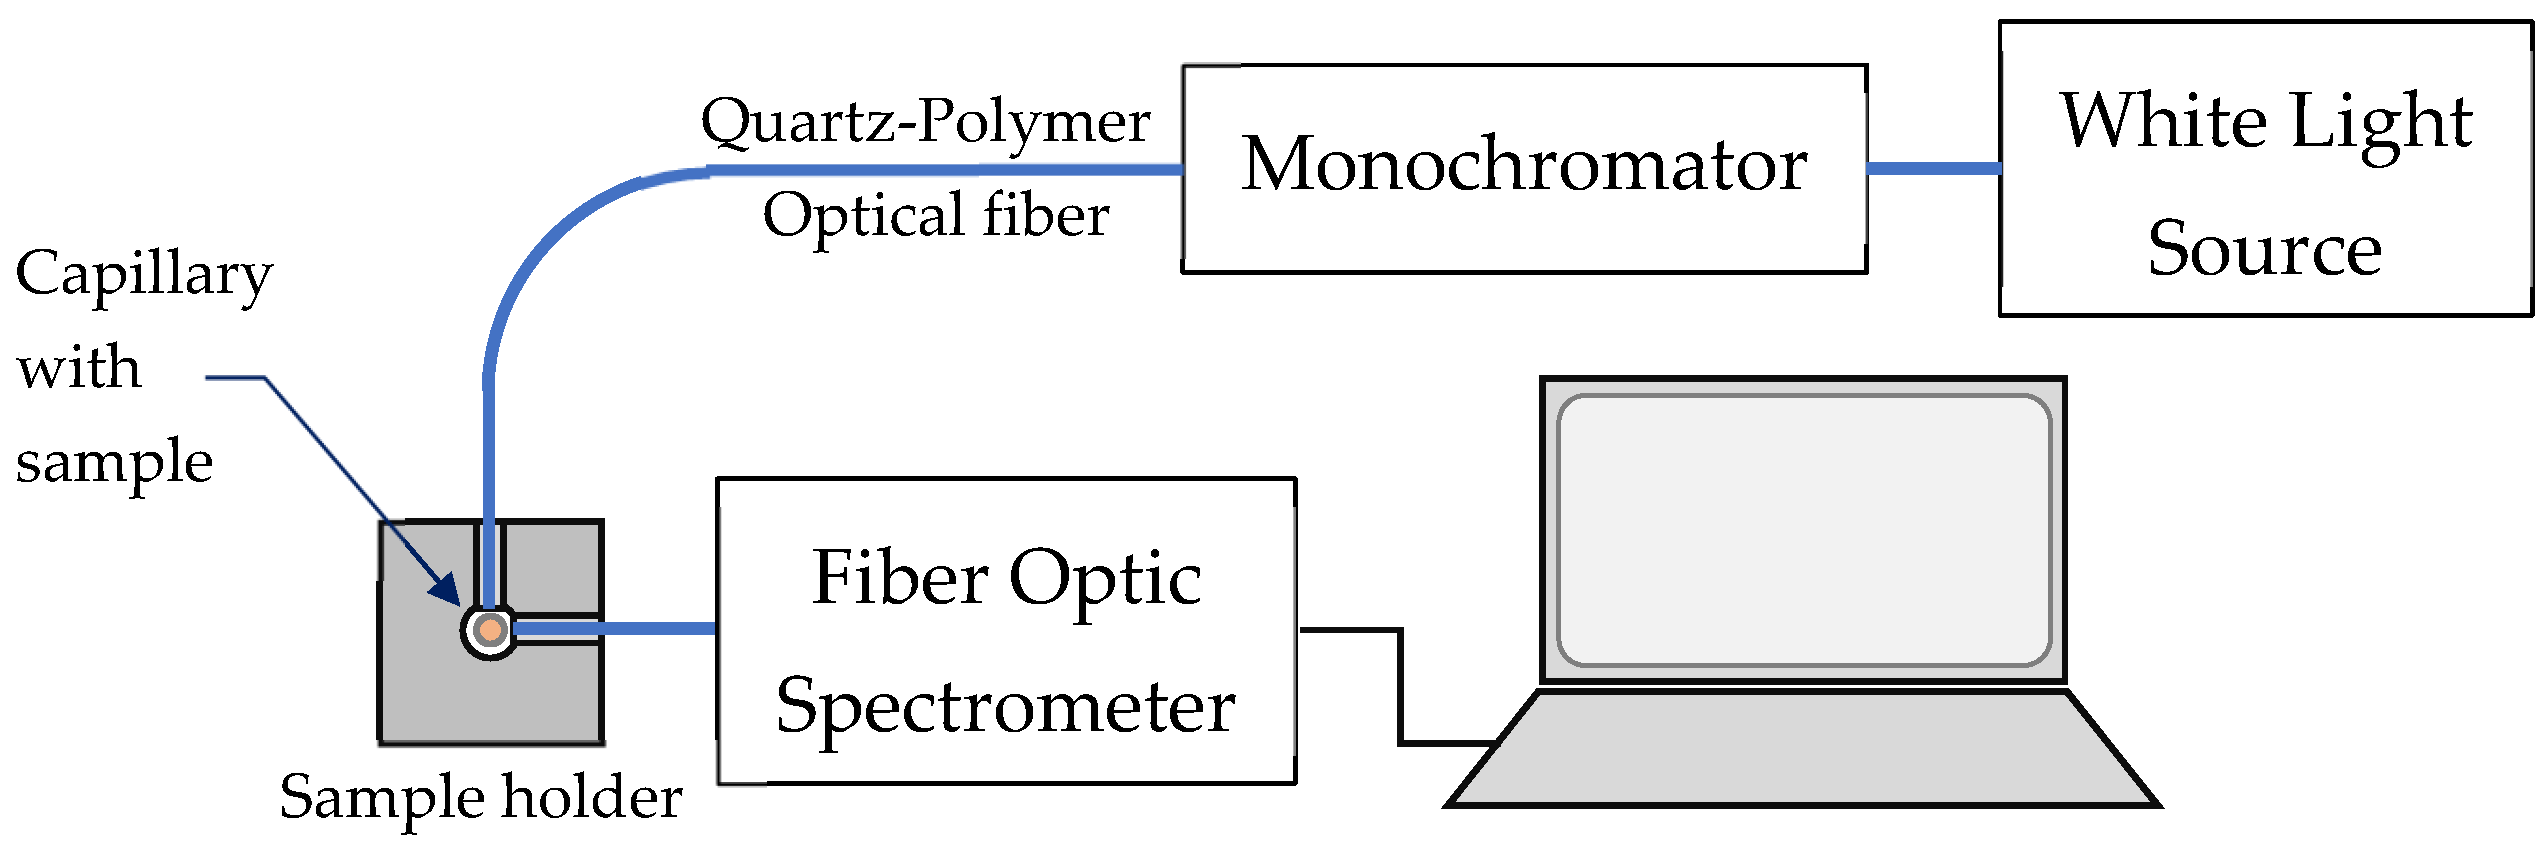
- Standard 3D fluorescence spectral measurement setup
- (B)
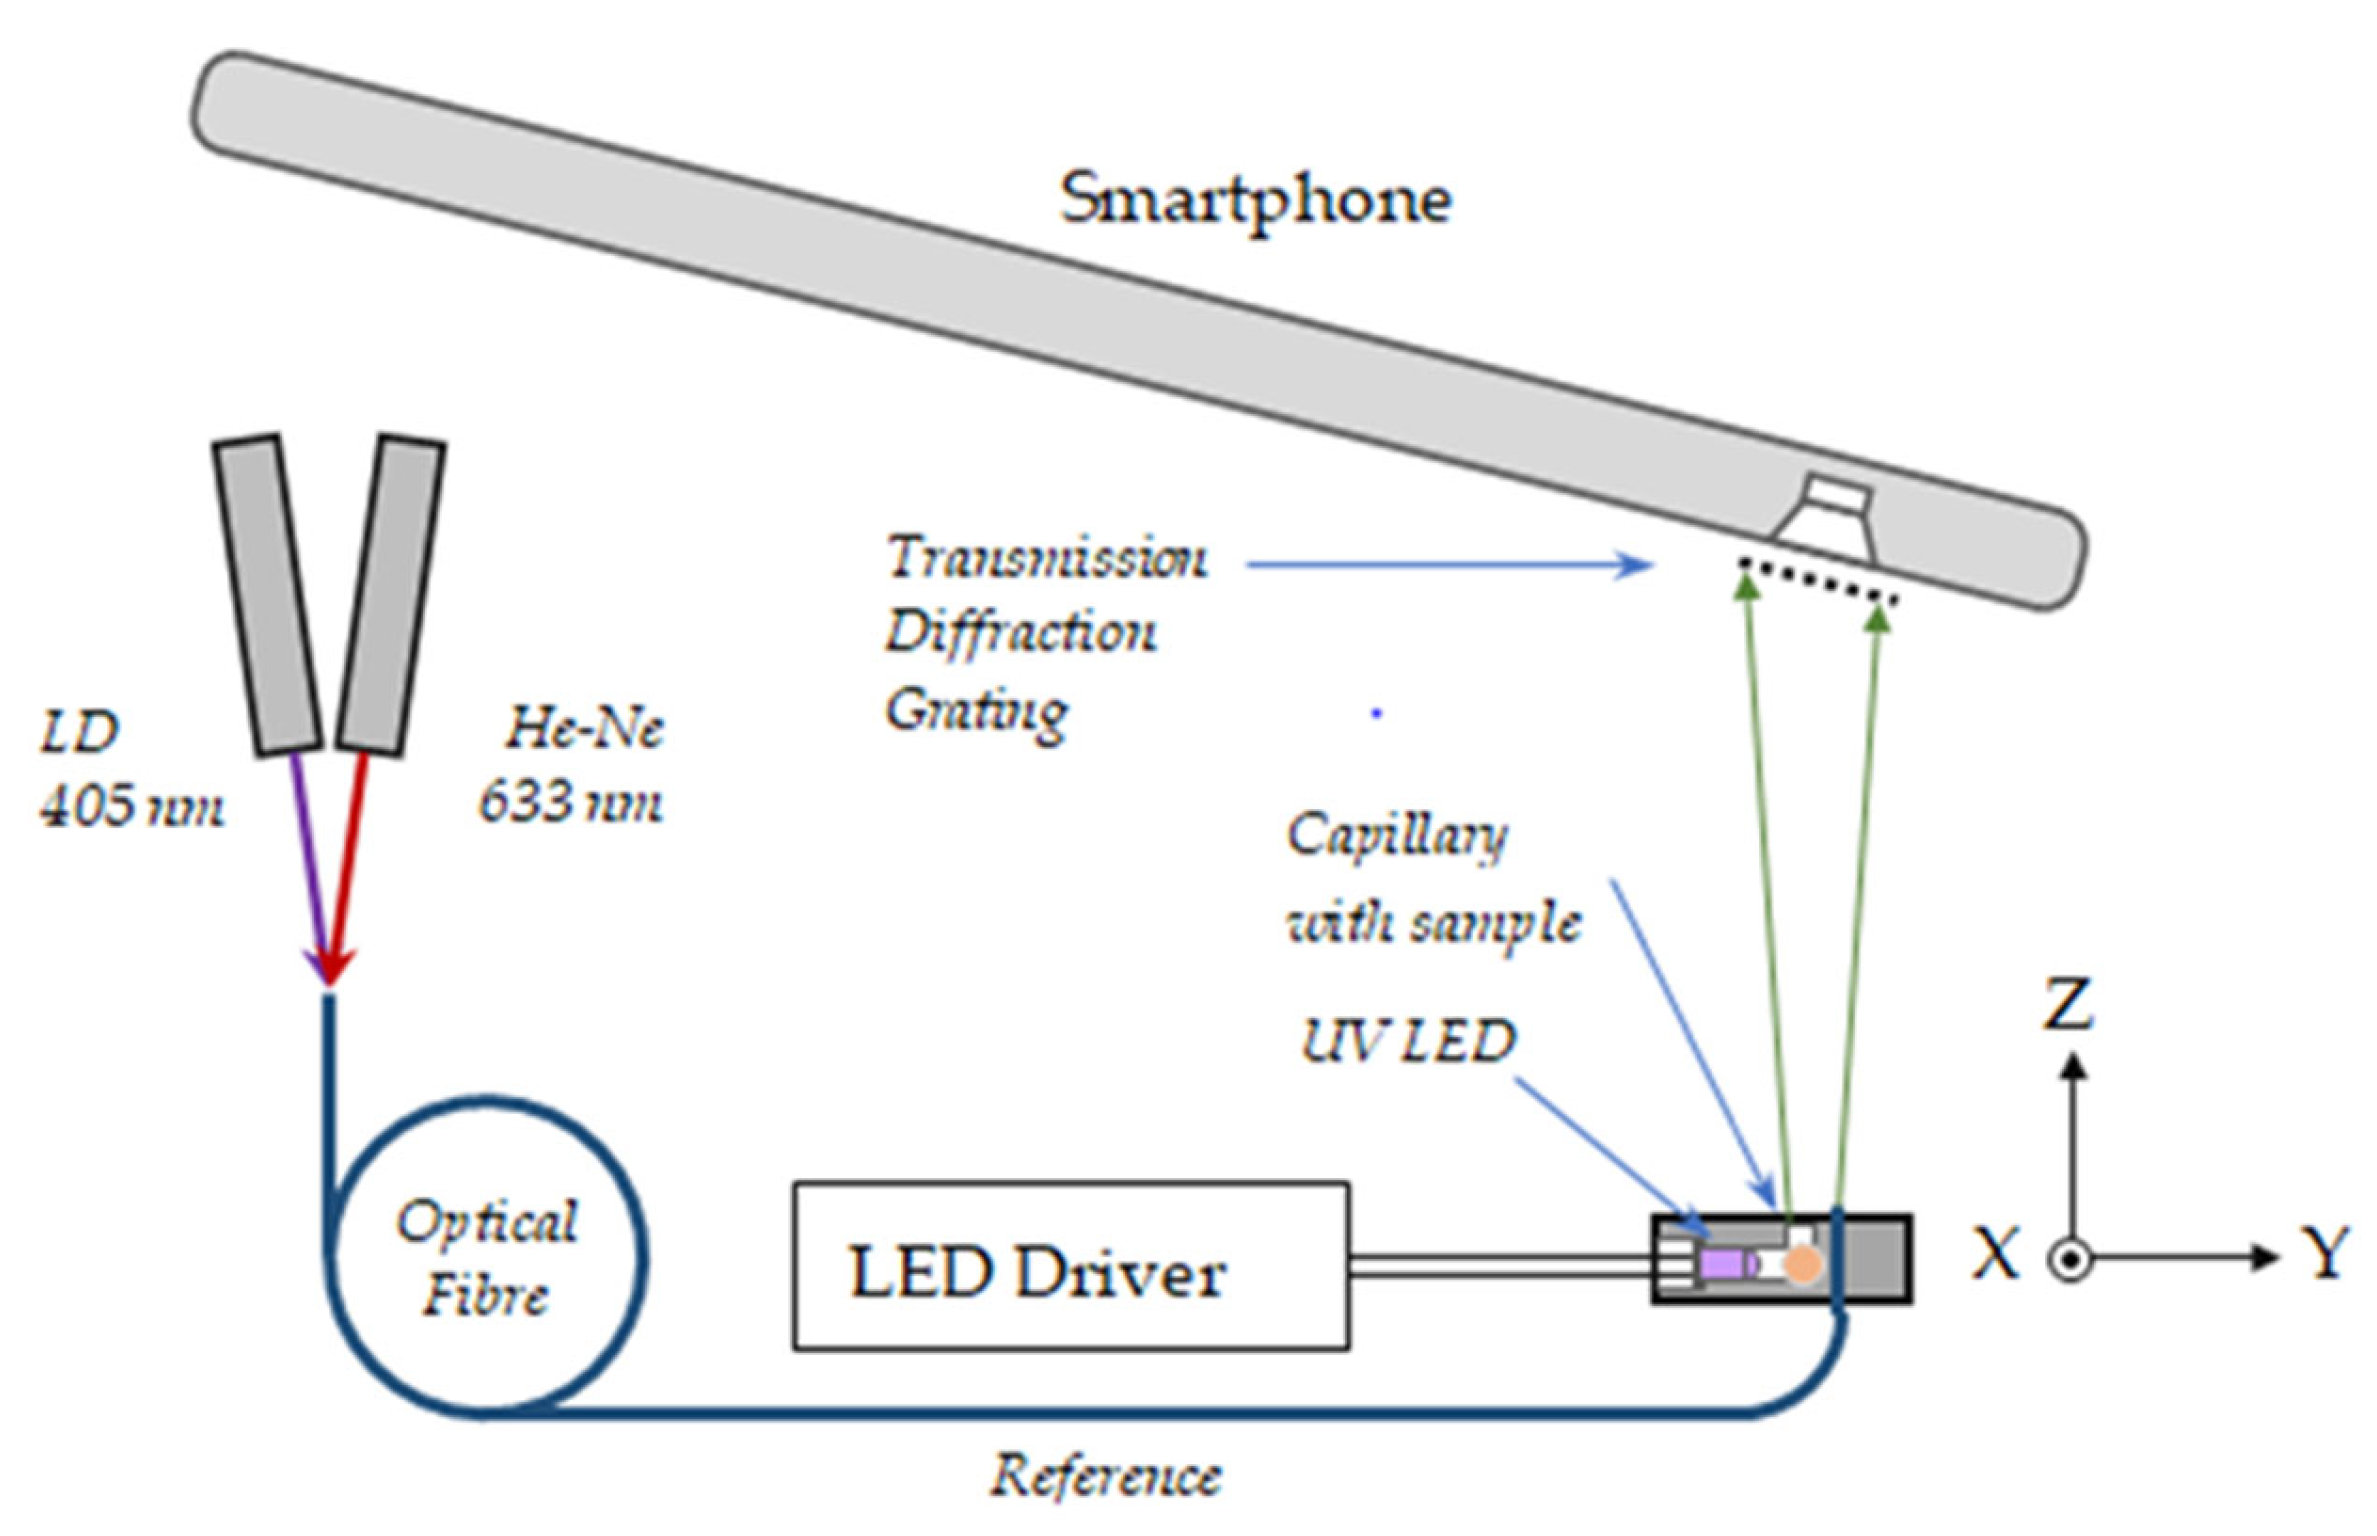
- Smartphone spectrometer measurement scheme
4.2.6. Statistical Methods
- ✓
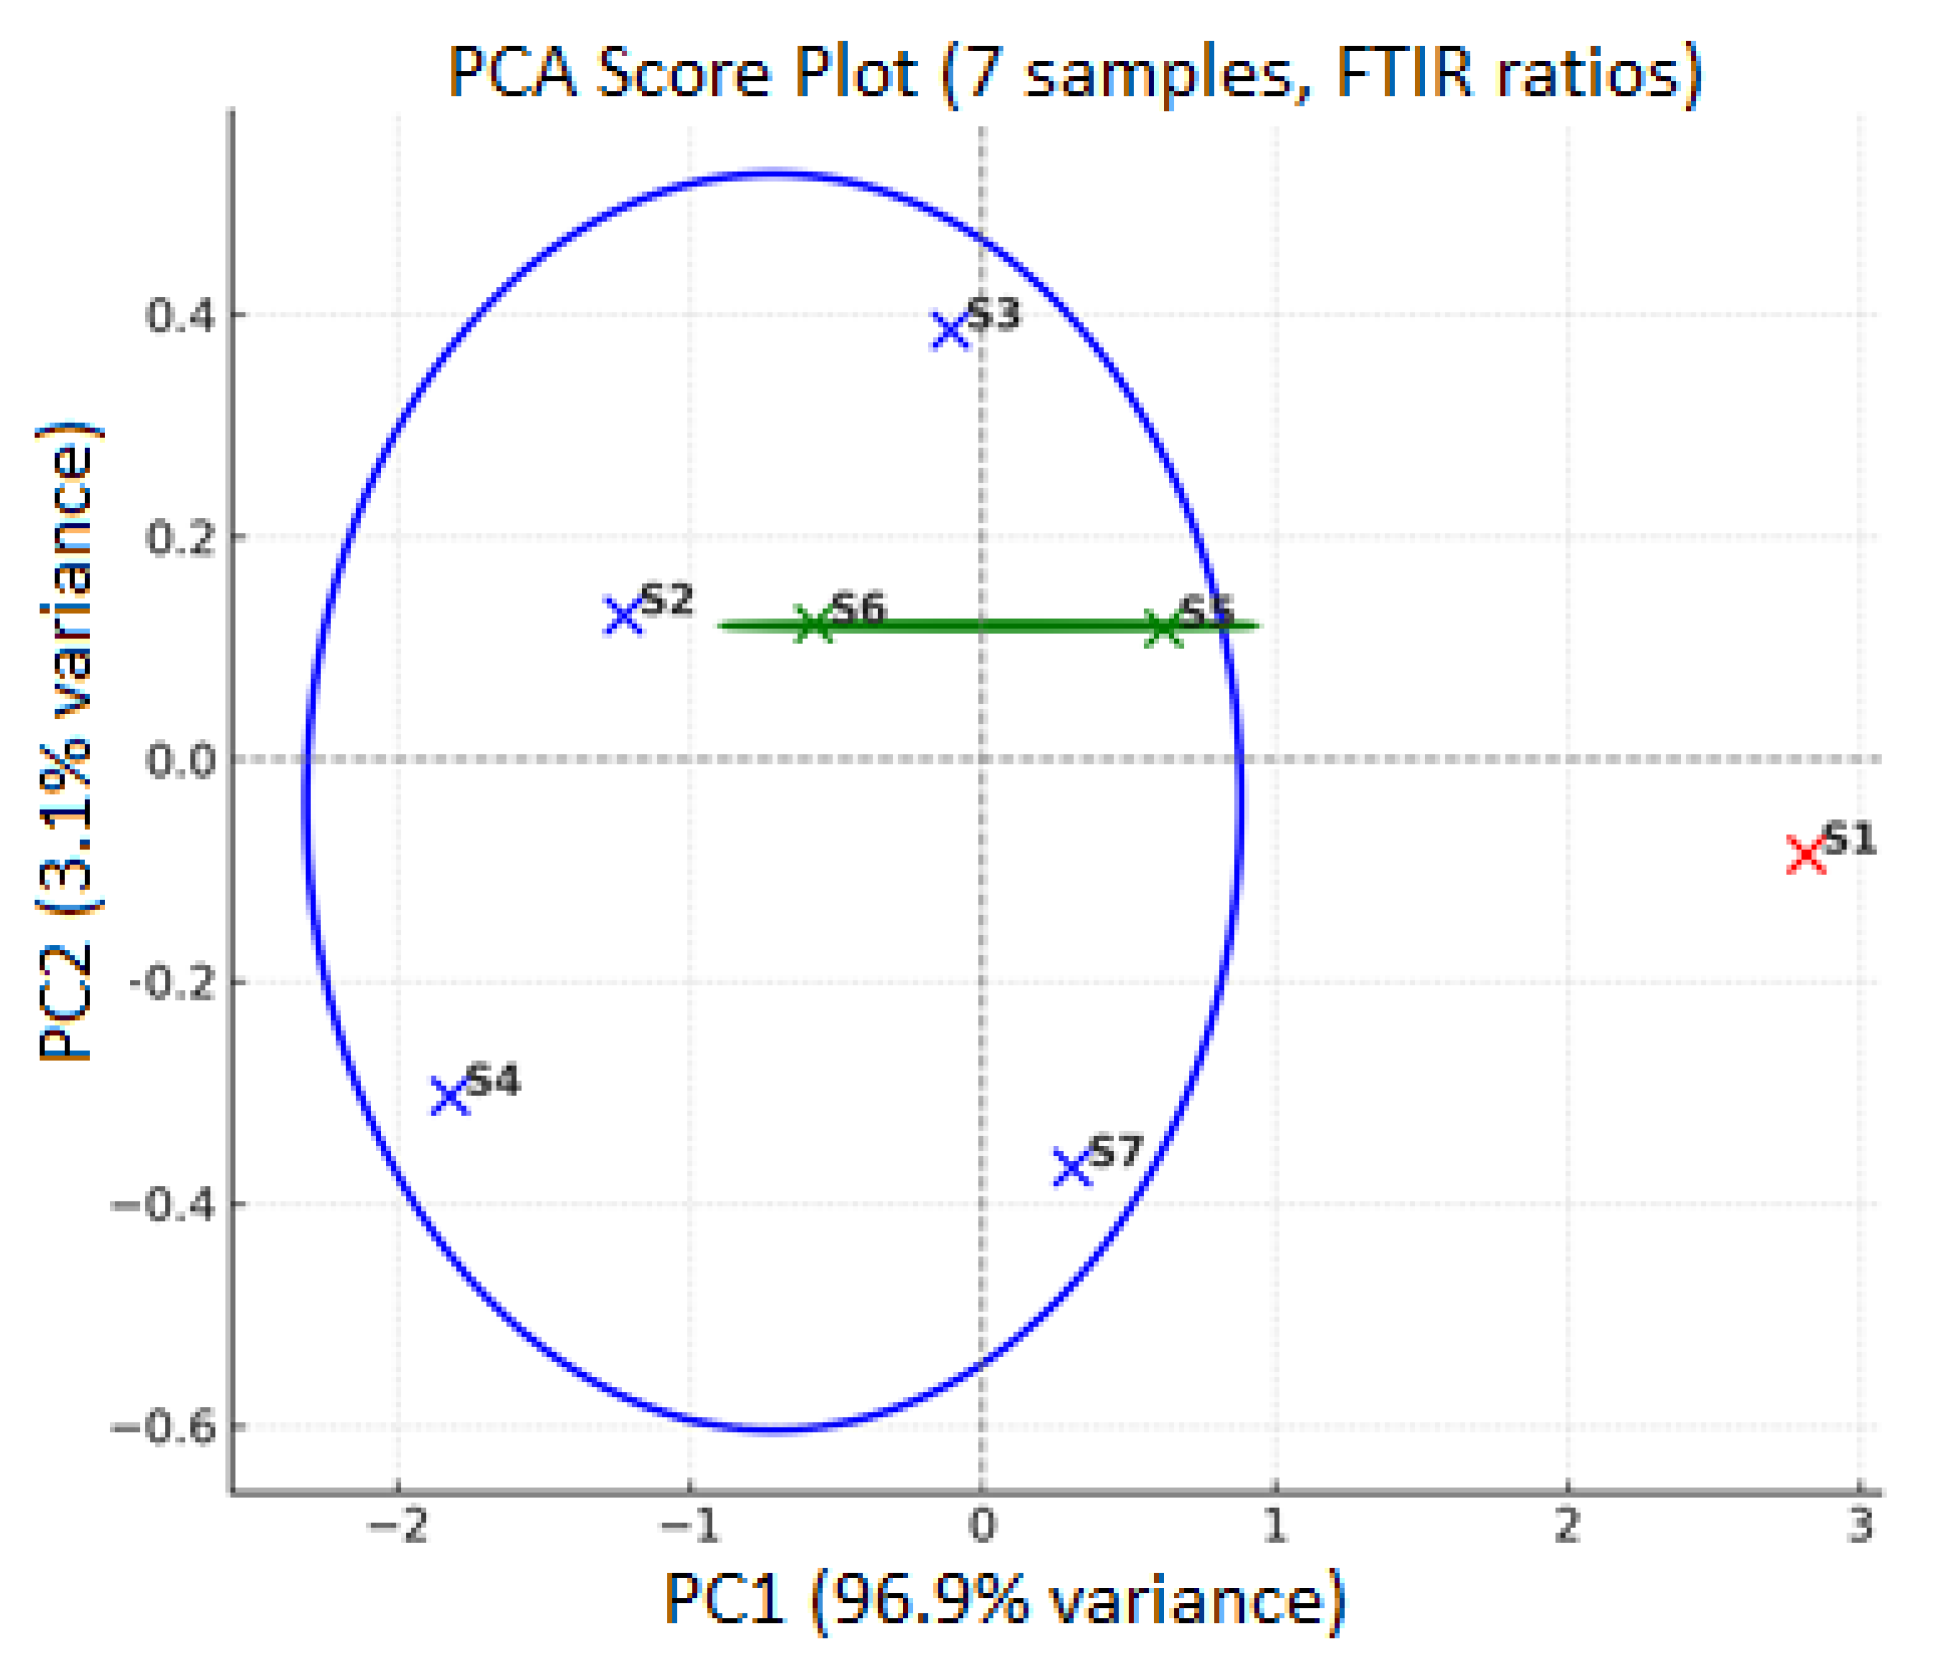
- Potential groupings.
- ✓
- Hierarchical Principal Component Analysis (PCA): used to reduce dimensionality and visualize.
- ✓
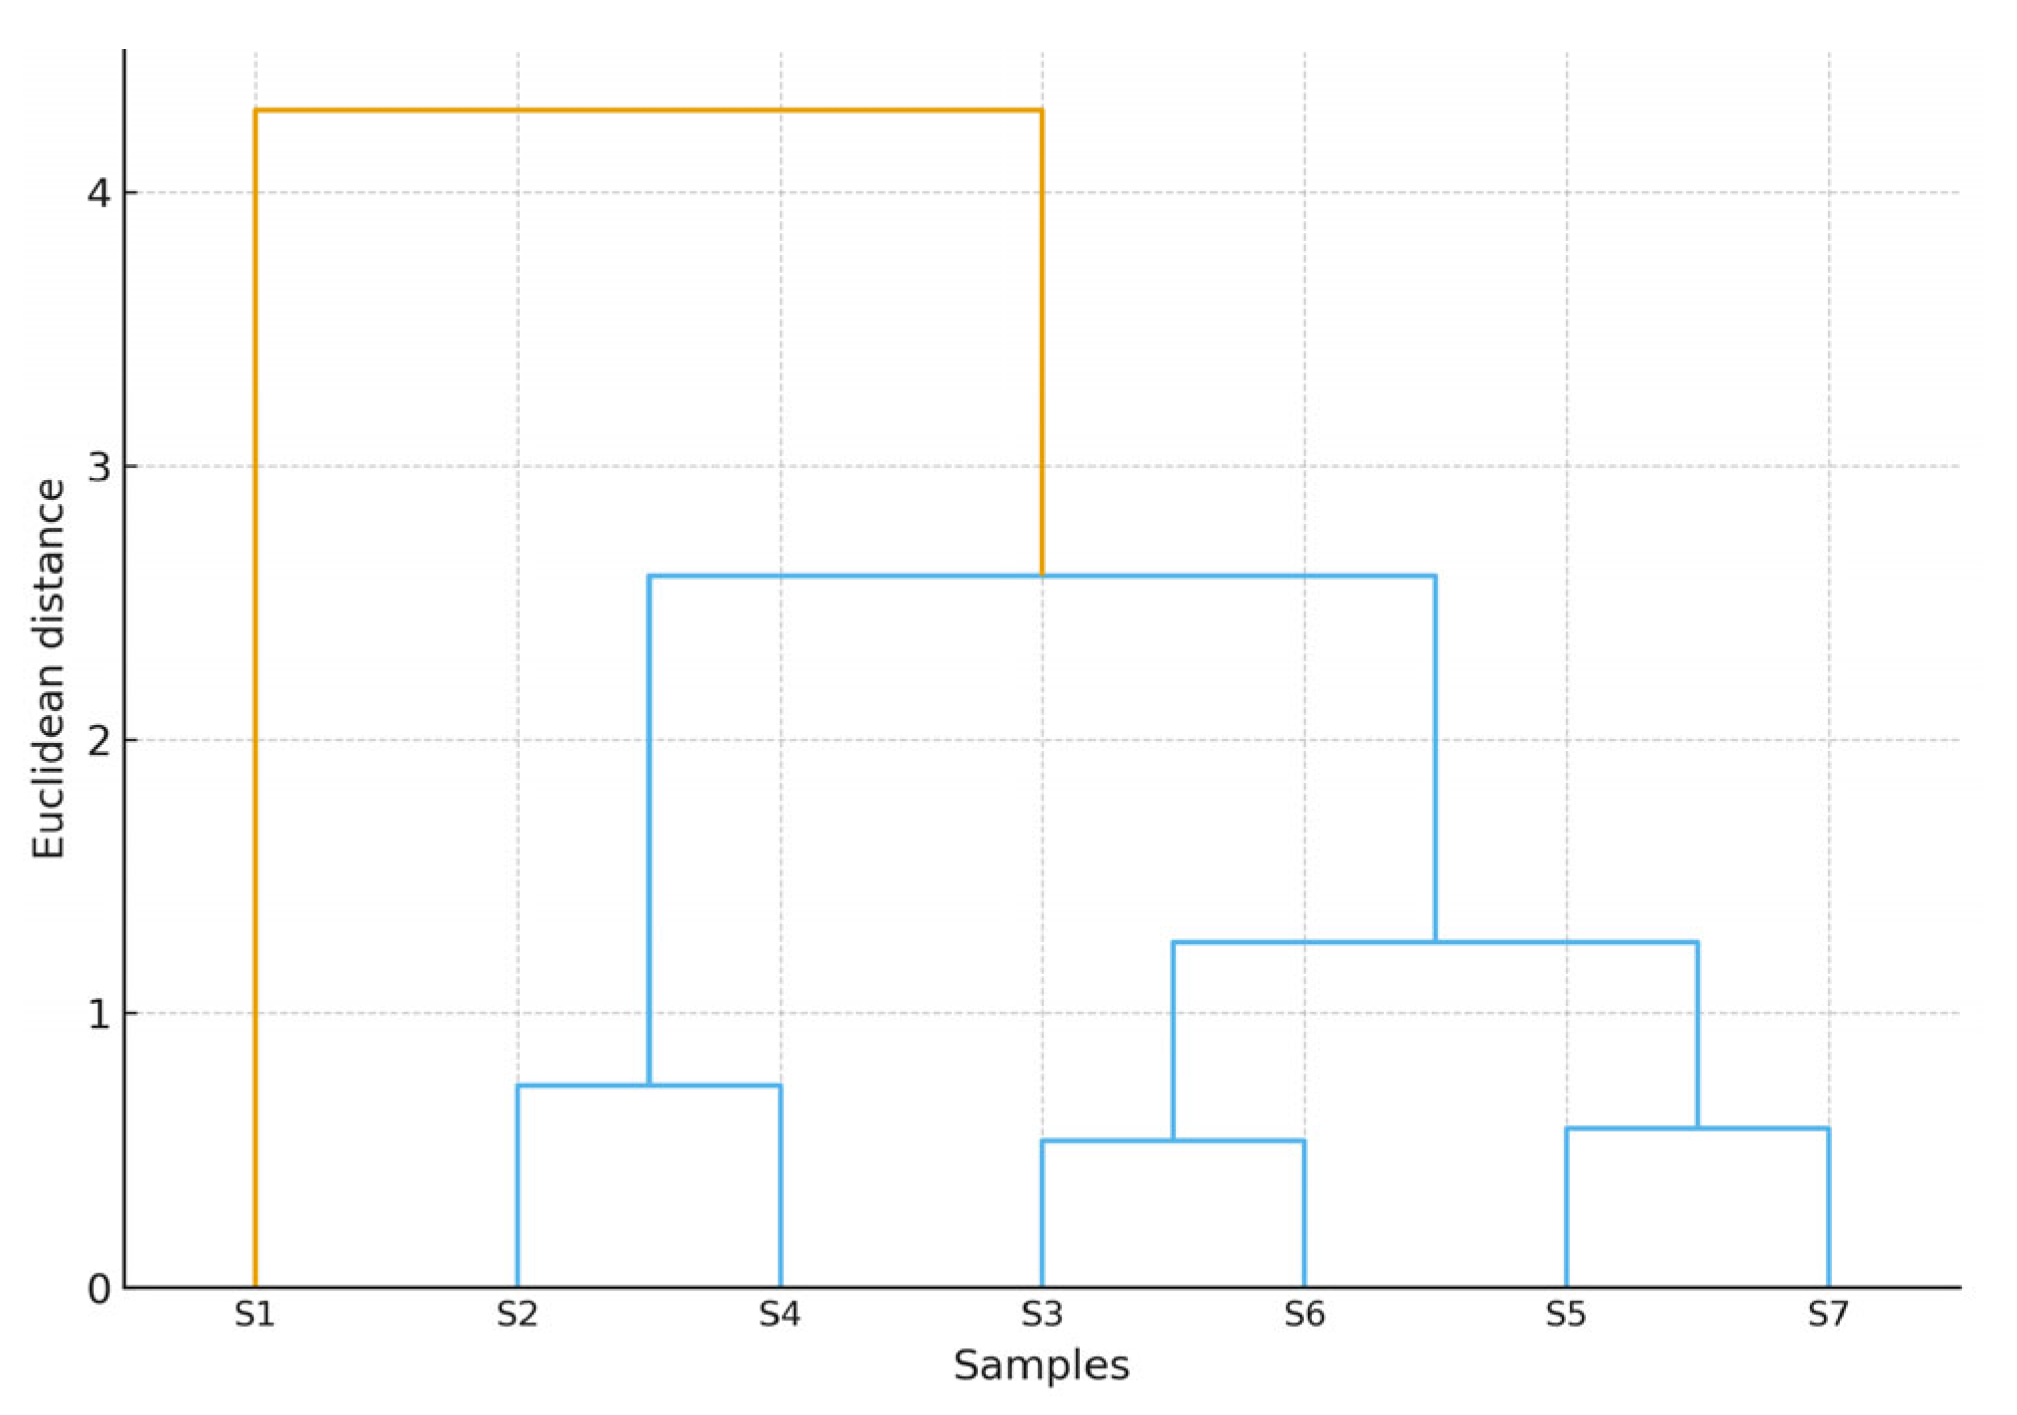
- Clustering: applied to identify sample similarity based on Euclidean distances.
- ✓
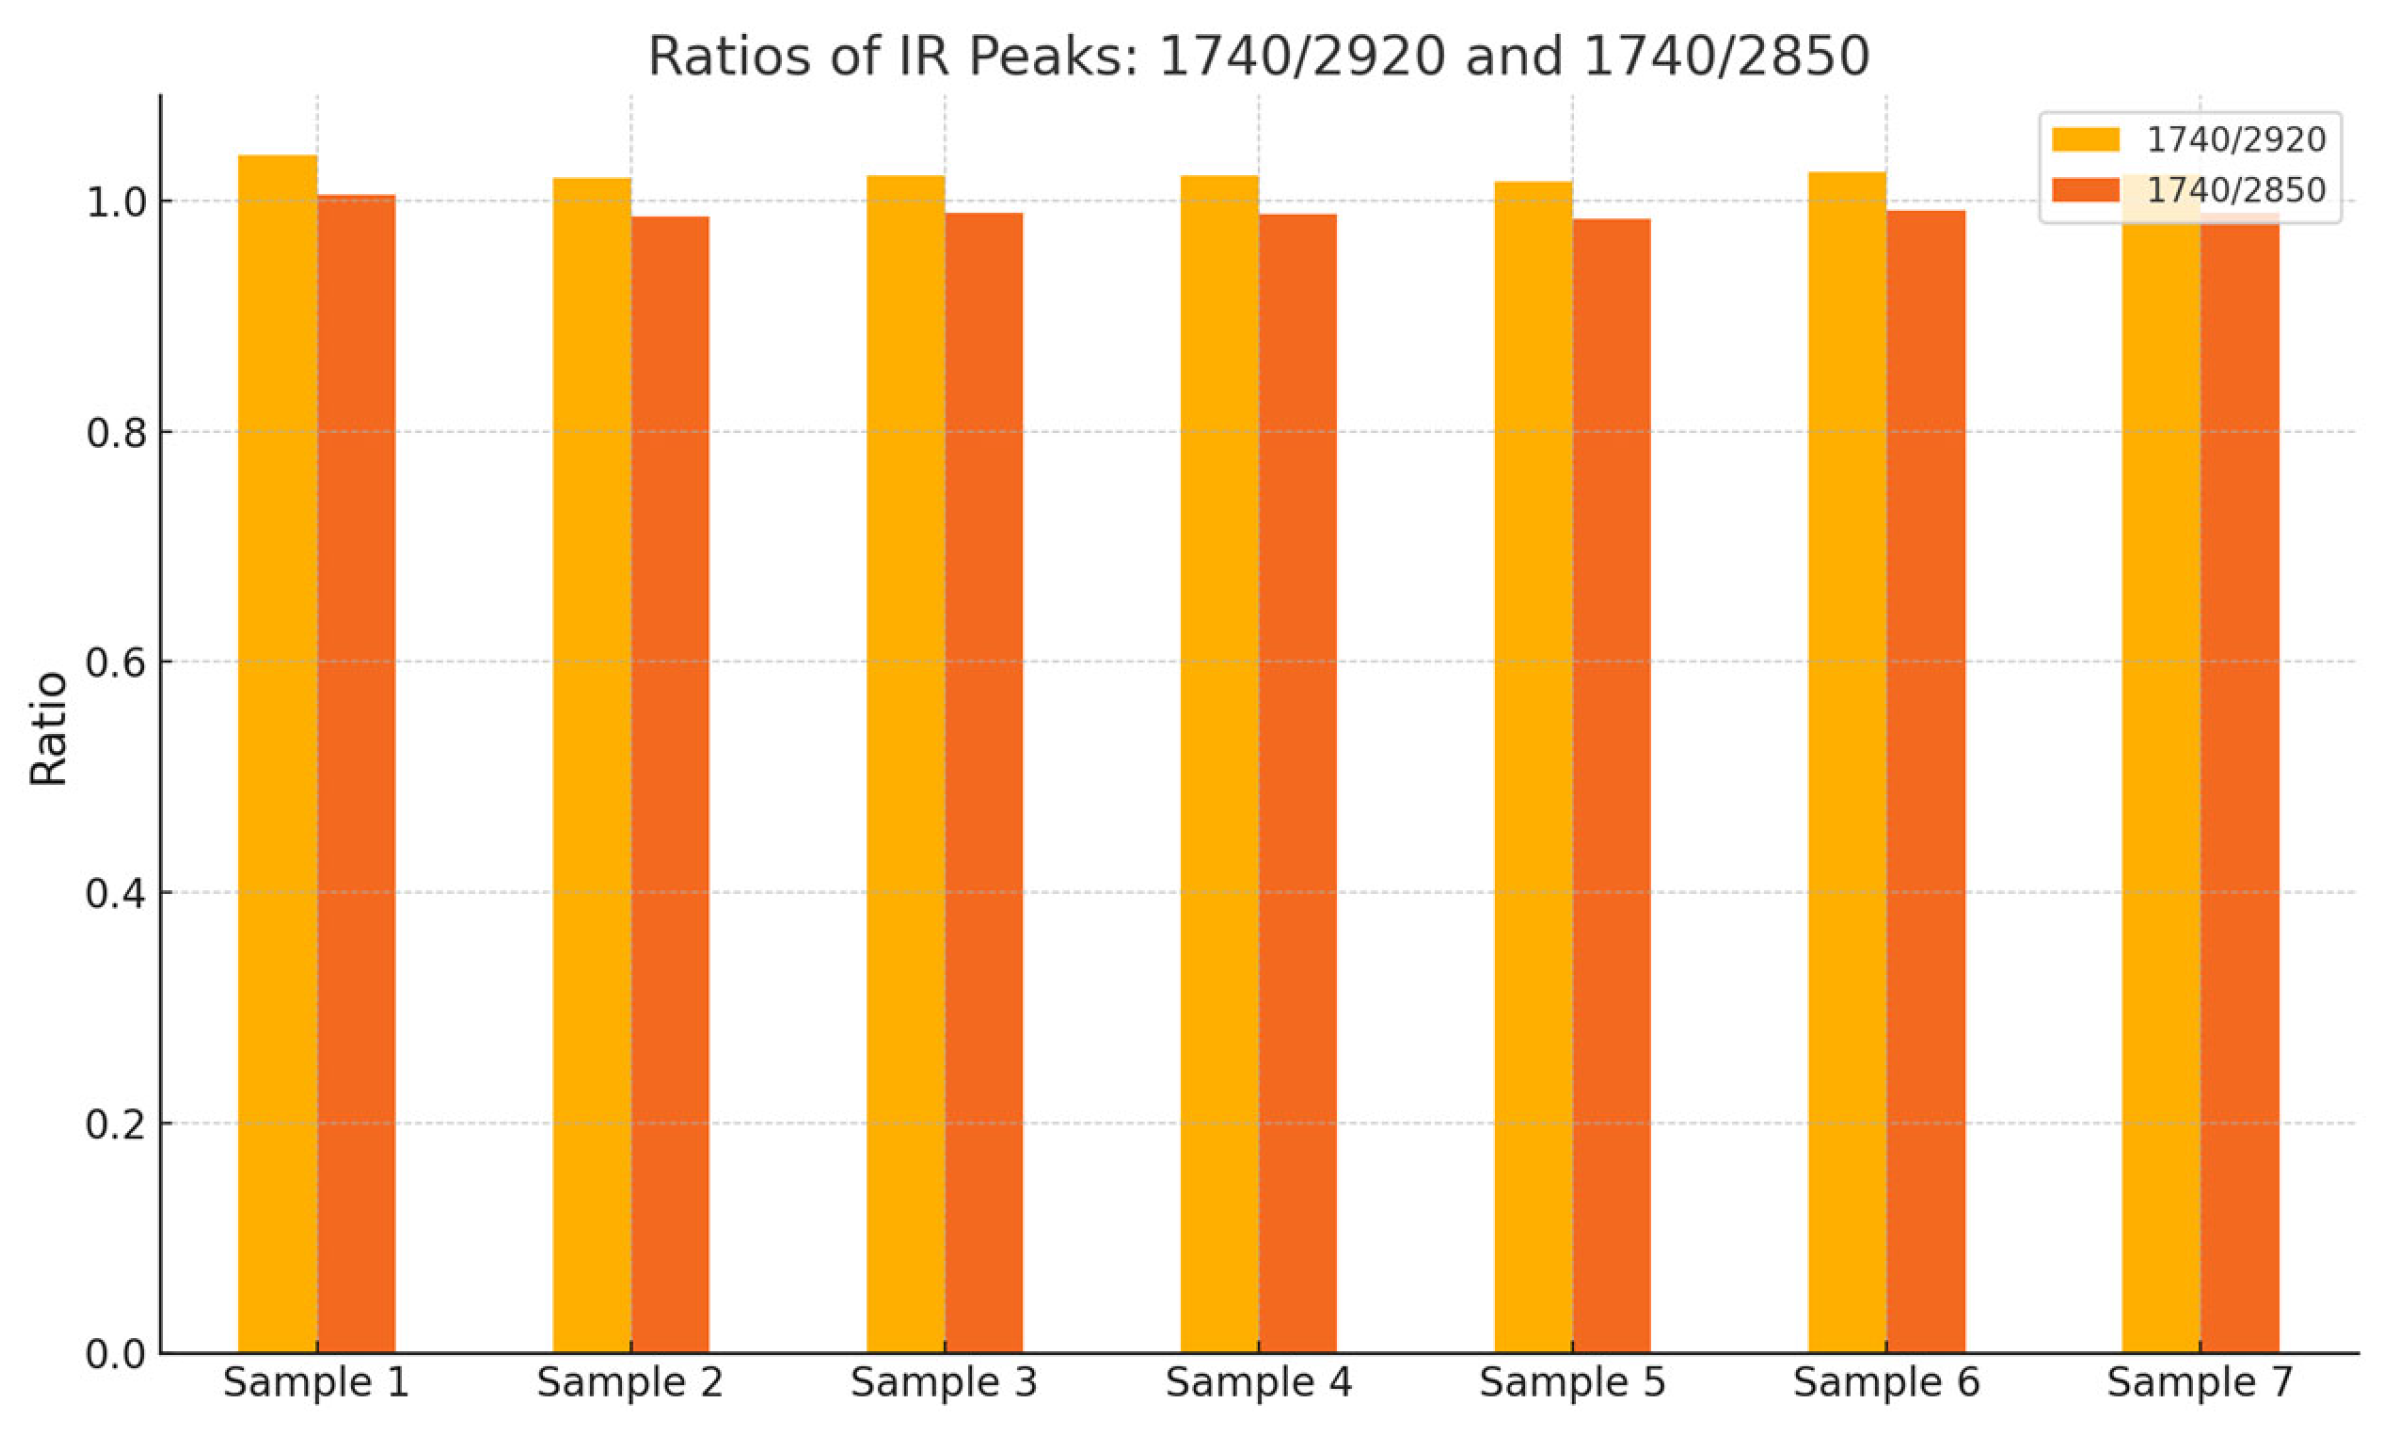
- Peak Ratio Analysis: performed to evaluate relative differences in the intensities of functional groups.
5. Conclusions
Author Contributions
Funding
Data Availability Statement
Acknowledgments
Conflicts of Interest
References
- Eren, T.; Ok, S.; Yılmaz, E. Comprehensive characterization of physicochemical, thermal, compositional, and sensory properties of cold-pressed rosehip seed oil. Grasas Aceites 2023, 74, e534. [Google Scholar] [CrossRef]
- De Santana, F.B.; Gontijo, L.C.; Mitsutake, H.; Mazivila, S.J.; De Souza, L.M.; Borges Neto, W. Non-destructive fraud detection in rosehip oil by MIR spectroscopy and chemometrics. Food Chem. 2016, 209, 228–233. [Google Scholar] [CrossRef] [PubMed]
- Silva, C.E.; Vandenabeele, P.; Edwards, H.G.M.; Oliveira, L.F. NIR-FT-Raman spectroscopic analytical characterization of the fruits, seeds and phytotherapeutic oils from rosehips. Anal. Bioanal. Chem. 2008, 392, 1489–1496. [Google Scholar] [CrossRef] [PubMed]
- González-Sarriás, A.; Larrosa, M.; García-Conesa, M.T.; Tomás-Barberán, F.A.; Espín, J.C. Nutraceuticals for older people: Facts, fictions and gaps in knowledge. Maturitas 2013, 75, 313–334. [Google Scholar] [CrossRef] [PubMed]
- De Souza, T.R.P.; Olenka, L.; Peternella, W.S. A study of degradation in vegetable oils by exposure to sunlight using Fourier transform infrared spectroscopy. Mater. Sci. Appl. 2020, 11, 678–691. [Google Scholar] [CrossRef]
- Zlatanov, M.D. Lipid composition of Bulgarian chokeberry, black currant and rose hip seed oils. J. Sci. Food Agric. 1999, 79, 1620–1624. [Google Scholar] [CrossRef]
- Malec, L.S.; Civeira, M.E.; Vigo, M.S. Semilla de Rosa rubiginosa L. (Rosa Mosqueta). Composición química del aceite crudo de extracción y de la harina residual. An. Asoc. Quím. Argent. 1993, 81, 445–450. [Google Scholar]
- Valladares, J.; Palma, M.; Sandoval, C.; Carvajal, F. Crema de aceite de semilla de mosqueta (Rosa aff. rubiginosa). An. Real Acad. Farm. 1986, 51, 597–612. [Google Scholar]
- Cserháti, T.; Forgács, E.; Deyl, Z.; Miksík, I. Chromatography in authenticity and traceability tests of vegetable oils and dairy products: A review. Biomed. Chromatogr. 2005, 19, 183–190. [Google Scholar] [CrossRef]
- Makky, M.; Soni, P. In situ quality assessment of intact oil palm fresh fruit bunches using a rapid portable non-contact and non-destructive approach. J. Food Eng. 2014, 120, 248–259. [Google Scholar] [CrossRef]
- Luna, A.S.; Silva, A.P.; Pinho, J.S.; Ferré, J.; Boqué, R. Rapid characterization of transgenic and non-transgenic soybean oils by chemometric methods using NIR spectroscopy. Spectrochim. Acta A Mol. Biomol. Spectrosc. 2013, 100, 115–119. [Google Scholar] [CrossRef]
- Rohman, A.; Riyanto, S.; Sasi, A.M.; Yusof, F.M. The use of FTIR spectroscopy in combination with chemometrics for the authentication of red fruit (Pandanus conoideus Lam) oil from sunflower and palm oils. Food Biosci. 2014, 7, 64–70. [Google Scholar] [CrossRef]
- Tankeu, S.Y.; Vermaak, I.; Kamatou, G.P.P.; Viljoen, A.M. Vibrational spectroscopy and chemometric modeling: An economical and robust quality control method for lavender oil. Ind. Crops Prod. 2014, 59, 234–240. [Google Scholar] [CrossRef]
- Zahir, E.; Saeed, R.; Hameed, M.A.; Yousuf, A. Study of physicochemical properties of edible oil and evaluation of frying oil quality by Fourier transform infrared spectroscopy. Arab. J. Chem. 2017, 10, S3870–S3876. [Google Scholar] [CrossRef]
- Silva, C.E.T.; Filardi, V.L.; Pepe, I.M.; Chaves, M.A.; Santos, C.M.S. Classification of food vegetable oils by fluorimetry and artificial neural networks. Food Control 2015, 47, 86–91. [Google Scholar] [CrossRef]
- Vlachos, N.; Skopelitis, Y.; Psaroudaki, M.; Konstantinidou, V.; Chatzilazarou, A.; Tegou, E. Applications of Fourier transform-infrared spectroscopy to edible oils. Anal. Chim. Acta 2006, 573, 459–465. [Google Scholar] [CrossRef]
- Ozulku, G.; Yildirim, R.M.; Toker, O.S.; Karasu, S.; Durak, M.Z. Rapid detection of adulteration of cold-pressed sesame oil with hazelnut, canola and sunflower oils using ATR-FTIR spectroscopy combined with chemometrics. Food Control 2017, 82, 212–216. [Google Scholar] [CrossRef]
- Szentmihályi, K.; Vinkler, P.; Lakatos, B.; Illés, V.; Then, M. Rose hip (Rosa canina L.) oil obtained from waste hip seeds by different extraction methods. Bioresour. Technol. 2002, 82, 195–201. [Google Scholar] [CrossRef]
- Vasić, D.; Trifunović, B.Š.; Pećinar, I.; Paunović, D.; Popović-Djordjević, J. Chemical characterization of Rosa canina L. rosehip seed: Application of Raman spectroscopy and gas chromatography. Biol. Life Sci. Forum 2021, 3, 50. [Google Scholar] [CrossRef]
- Javanmard, M.; Ali Asadi-Gharneh, H.; Nikneshan, P. Characterization of biochemical traits of dog rose (Rosa canina L.) ecotypes in the central part of Iran. Nat. Prod. Res. 2018, 32, 1738–1743. [Google Scholar] [CrossRef]
- Ilyasoğlu, H. Characterization of rosehip (Rosa canina L.) seed and seed oil. Int. J. Food Prop. 2014, 17, 1591–1598. [Google Scholar] [CrossRef]
- Grajzer, M.; Prescha, A.; Korzonek, K.; Wojakowska, A.; Dziadas, M.; Kulma, A.; Grajeta, H. Characteristics of rose hip (Rosa canina L.) cold-pressed oil and its oxidative stability studied by the differential scanning calorimetry method. Food Chem. 2015, 188, 459–466. [Google Scholar] [CrossRef]
- Fromm, M.; Bayha, S.; Carle, R.; Kammerer, D.R. Comparison of fatty acid profiles and contents of seed oils recovered from dessert and cider apples and further Rosaceous plants. Eur. Food Res. Technol. 2012, 234, 1033–1041. [Google Scholar] [CrossRef]
- Machmudah, S.; Kawahito, Y.; Sasaki, M.; Goto, M. Supercritical CO2 extraction of rosehip seed oil: Fatty acids composition and process optimization. J. Supercrit. Fluids 2007, 41, 421–428. [Google Scholar] [CrossRef]
- Du, H.; Zhang, X.; Zhang, R.; Zhang, L.; Yu, D.; Jiang, L. Extraction and the fatty acid profile of Rosa acicularisseed oil. J. Oleo Sci. 2017, 66, 1301–1310. [Google Scholar] [CrossRef] [PubMed]
- Concha, J.; Soto, C.; Chamy, R.; Zúñiga, M. Effect of rosehip extraction process on oil and defatted meal physicochemical properties. J. Am. Oil Chem. Soc. 2006, 83, 771–775. [Google Scholar] [CrossRef]
- Anwar, F.; Przybylski, R.; Rudzinska, M.; Gruczynska, E.; Bain, J. Fatty acid, tocopherol and sterol compositions of Canadian prairie fruit seed lipids. J. Am. Oil Chem. Soc. 2008, 85, 953–959. [Google Scholar] [CrossRef]
- Azevedo da Silva, N.; Rodrigues, E.; Mercadante, A.Z.; Vera de Rosso, V. Phenolic Compounds and Carotenoids from Four Fruits Native from the Brazilian Atlantic Forest. J. Agric. Food Chem. 2014, 62, 5072−5084. [Google Scholar] [CrossRef]
- Bayraktar, Ş.; Bayraktar, N.A. Chemical Characterization and Antioxidant Activity of Rosa canina L. from Çekerek Region of Yozgat, Türkiye. Bozok J. Sci. 2024, 2, 98–103. [Google Scholar] [CrossRef]
- Winther, K.; Hansen, A.S.V.; Campbell-Tofte, J. Bioactive ingredients of rose hips (Rosa canina L) with special reference to antioxidative and antiinflammatory properties: In vitro studies. Bot. Targets Ther. 2016, 6, 11–23. [Google Scholar] [CrossRef]
- Stryjecka, M.; Kiełtyka-Dadasiewicz, A.; Michalak, M. Physico-Chemical Characteristics of Rosa canina L. Seeds and Determining Their Potential Use. Appl. Sci. 2025, 15, 168. [Google Scholar] [CrossRef]
- Nikolova, K.; Nikolov, K.; Eftimov, T.; Panova, N.; Vitola, V. The smartphone as an affordable 2D spectrometer for parallel spectral and time-dependent measurements. In Proceedings of the 8th International Conference on Optics, Photonics and Lasers (OPAL’ 2025), Rhodes, Greece, 14–16 May 2025; pp. 143–146. [Google Scholar]
- Dincheva, I.; Badjakov, I.; Georgiev, V.; Semerdjieva, I.; Vrancheva, R.; Ivanov, I.; Pavlov, A. Comprehensive GC-MS characterization and histochemical assessment of various parts of three Colchicum species from Bulgarian flora. Plants 2025, 14, 270. [Google Scholar] [CrossRef]
- Ulbricht, T.L.V.; Southgate, D.A.T. Coronary heart disease: Seven dietary factors. Lancet 1991, 338, 985–992. [Google Scholar] [CrossRef]
- Santos-Silva, J.; Bessa, R.J.B.; Santos-Silva, F. Effect of genotype, feeding system and slaughter weight on the quality of light lambs II. Fatty acid composition of meat. Livest. Prod. Sci. 2002, 77, 187–194. [Google Scholar] [CrossRef]



| Fatty Acid, Methyl Ester | Molecular Formula | RT | RI | Content. % | ||||||
|---|---|---|---|---|---|---|---|---|---|---|
| 1 | 2 | 3 | 4 | 5 | 6 | 7 | ||||
| Mean ± SD | Mean ± SD | Mean ± SD | Mean ± SD | Mean ± SD | Mean ± SD | Mean ± SD | ||||
| Palmitic acid C16:0 | C16H32O2 | 26.95 | 1920 | 2.2 ± 0.09 c | 2.77 ± 0.12 a | 2.52 ± 0.12 b | 2.8 ± 0.12 a | 1.9 ± 0.08 d | 2.06±0.10 d | 2.00 ± 0.10 d |
| γ-linolenic acid C18:3 | C18H30O2 | 29.76 | 2055 | 0.10 ± 0.00 d | 0.15 ± 0.01 b | 0.16 ± 0.01 b | 0.1 ± 0.01 c | nd | 0.22 ± 0.01 a | nd |
| Linoleic acid Cl8:2 | C18H32O2 | 30.30 | 2081 | 50.0 ± 2.10 a | 45.00 ± 1.98 b | 30.10 ± 0.44 d | 35.05 ± 1.40 c | 49 ± 2.13 a | 51.02 ± 2.45 a | 50.54 ± 0.48 a |
| Oleic acid C18:1 | C18H34O2 | 30.34 | 2090 | 19.1 ± 0.81 a | 10.12 ± 0.45 e | 16.03 ± 0.77 b | 12.16 ± 0.49 d | 13.29 ± 0.57 c | 7.31 ± 0.35 g | 8.33 ± 0.41 f |
| α-Linolenic acid C18:3 | C18H30O2 | 30.45 | 2098 | 26.1 ± 1.10 e | 39.50 ± 1.74 b | 49.20 ± 2.36 a | 48.20 ± 1.93 a | 33.62 ± 1.45 d | 36.56 ± 1.75 c | 37.00 ± 1.83 c,b |
| Stearic acid C18:0 | C18H36O2 | 30.75 | 2123 | 1.16 ± 0.05 d | 1.7 ± 0.07 a,b | 1.07 ± 0.05 e | 1.29 ± 0.05 c | 1.11 ± 0.05 e | 1.83 ± 0.09 a | 1.00 ± 0.05 f |
| Gadoleic acid C20:1 | C20H38O2 | 33.60 | 2220 | 0.44 ± 0.02 a | 0.35 ± 0.02 b | 0.31 ± 0.01 c | 0.18 ± 0.01 e | 0.16 ± 0.01 e | 0.40 ± 0.02 a | 0.21 ± 0.01 d |
| 9-cis-Eicosenoic acid C21:1 | C21H40O2 | 33.72 | 2287 | nd | 0.25 ± 0.01 a | nd | nd | nd | 0.14 ± 0.01 b | nd |
| Arachidic acid C20:0 | C20H40O2 | 34.17 | 2333 | 0.72 ± 0.03 a | 0.16 ± 0.01 d | 0.28 ± 0.01 c | 0.10 ± 0.00 e | 0.12 ± 0.01 e | 0.29 ± 0.01 c | 0.36 ± 0.02 b |
| Behenic acid C22:0 | C23H46O2 | 37.40 | 2525 | nd | nd | 0.34 ± 0.02 a | nd | 0.13 ± 0.01 c | 0.17 ± b | 0.15 ± 0.01 c |
| AI (Atherogenic Index) | TI (Thrombogenic Index) | h/H (Hypo-/Hyper Cholesterolemic Ratio) | |
|---|---|---|---|
| S1 | 0.0235 | 0.0300 | 42.36 |
| S2 | 0.0291 | 0.0304 | 34.16 |
| S3 | 0.0263 | 0.0208 | 37.83 |
| S4 | 0.0302 | 0.0246 | 33.01 |
| S5 | 0.0197 | 0.0227 | 50.55 |
| S6 | 0.0216 | 0.0278 | 46.06 |
| S7 | 0.0207 | 0.0210 | 48.15 |
| Sample | S1 | S2 | S3 | S4 | S5 | S6 | S7 |
|---|---|---|---|---|---|---|---|
| X | 73.21 ± 1.02 e | 86.11 ± 1.74 b | 89.05 ± 2.03 a | 89.42 ± 1.81 a | 78.91 ± 1.03 d | 80.47 ± 1.23 c | 81.93 ± 1.22 c |
| Y | 56.64 ± 0.98 e | 63.86 ± 0.76 c | 66.22 ± 0.55 b | 68.53 ± 0.65 a | 58.94 ± 0.34 d | 56.30 ± 0.78 e | 57.48 ± 0.99 d |
| Z | 0.21 ± 0.05 a | 0.13 ± 0.01 b | 0.14 ± 0.02 b | 0.24 ± 0.03 a | 0.14 ± 0.03 b | 0.05 ± 0.01 c | 0.05 ± 0.00 c |
| x | 0.563 ± 0.01 c | 0.574 ± 0.002 b | 0.573 ± 0.003 b | 0.565 ± 0.002 | 0.572 ± 0.001 b | 0.588 ± 0.001 a | 0.578 ± 5 × 10⁻³ b |
| y | 0.435 ± 0.001 a | 0.425 ± 0.002 b | 0.426 ± 0.006 b | 0.433 ± 0.004 a | 0.427 ± 0.003 b | 0.412 ± 0.008 c | 0.412 ± 0.003 c |
| L | 79.98 ± 1.22 d | 83.89 ± 1.54 b | 85.11 ± 1.32 a | 86.27 ± 1.65 a | 81.26 ± 1.22 c | 79.79 ± 1.34 d | 80.45 ± 1.11 d |
| a | 21.36 ± 0.76 e | 28.66 ± 0.34 b | 28.59 ± 0.21 b | 24.22 ± 0.24 d | 26.83 ± 0.12 c | 36.11 ± 0.14 a | 35.93 ± 0.11 a |
| b | 128.56 ± 2.12 f | 138.79 ± 2.15 a,b | 140.60 ± 2.71 a | 138.27 ± 1.99 a,b | 134.04 ± 1.76 d,e | 135.52 ± 1.56 d | 136.55 ± 1.65 b,c |
| C | 130.31 ± 0.98 e | 141.72 ± 0.76 b | 143.47 ± 0.45 a | 140.37 ± 1.03 c | 136.70 ± 1.11 d | 140.24 ± 1.08 c | 141.20 ± 1.17 b |
| h | 80.56 ± 2.56 a | 78.33 ± 2.34 b | 78.51 ± 1.97 b | 80.06 ± 1.34 a | 78.68 ± 1.56 b | 75.08 ± 1.38 c | 75.26 ± 1.98 c |
| Fatty Acid, % | Country, References | ||||||||
|---|---|---|---|---|---|---|---|---|---|
| Poland | Germany | France | China | Chile | Canada | Turkey | Hungary | Bulgaria | |
| [22] | [23] | [24] | [25] | [26] | [27] | [1,21] | [18] | Our Results | |
| Palmitic acid C16:0 | 4.2–4.8 | 3.1 | 0–4.68 | 4 | 3.33–4.97 | 3.70 | - | 3.60–7.87 | 1.90–2.80 |
| Linoleic acid Cl8:2 | 44.4–51.7 | 36.7 | 47.02–50.25 | 56.5 | 42.2–47.9 | 37.10 | 51.1–54.05 | 35.94–54.75 | 35.50–51.02 |
| Oleic acid C18:1 | 14.7–16.3 | 18.8 | - | 34.2 | 12.4–14.8 | 19.70 | 19.3–19.5 | 16.25–22.11 | 7.31–19.1 |
| α-Linolenic acid C18:3 | 21.5–31.8 | 14.3 | 33.02–40.21 | 1.7 | 28.4–31.1 | 30.75 | 19.4–21.4 | 20.29–26.48 | 26.1–49.2 |
| Method of Obtainment | Region | Type | |
|---|---|---|---|
| S1 | Extracted under a nitrogen atmosphere | Kazanlak, Bulgaria | Rosa canina L. |
| S2 | Cold-pressed | Central Bulgaria | wild rosehips, petrified, of type Rosa canina L. |
| S3 | Cold-pressed | Central Bulgaria | wild rosehips, petrified, of type Rosa canina L. |
| S4 | Cold-pressed | Danubian Plain | Rosa canina L. |
| S5 | Extracted under a nitrogen atmosphere | Kazanlak, Bulgaria | Rosa canina L. |
| S6 | Cold-pressed | Southern Bulgaria | Rosa canina L. |
| S7 | Cold-pressed | Southern Bulgaria | Rosa canina L. |
Disclaimer/Publisher’s Note: The statements, opinions and data contained in all publications are solely those of the individual author(s) and contributor(s) and not of MDPI and/or the editor(s). MDPI and/or the editor(s) disclaim responsibility for any injury to people or property resulting from any ideas, methods, instructions or products referred to in the content. |
© 2025 by the authors. Licensee MDPI, Basel, Switzerland. This article is an open access article distributed under the terms and conditions of the Creative Commons Attribution (CC BY) license (https://creativecommons.org/licenses/by/4.0/).
Share and Cite
Nikolova, K.; Eftimov, T.; Panova, N.; Vladev, V.; Fouzar, S.; Nikolov, K. Characterization of Bulgarian Rosehip Oil by GC-MS, UV-VIS Spectroscopy, Colorimetry, FTIR Spectroscopy, and 3D Excitation–Emission Fluorescence Spectra. Molecules 2025, 30, 3964. https://doi.org/10.3390/molecules30193964
Nikolova K, Eftimov T, Panova N, Vladev V, Fouzar S, Nikolov K. Characterization of Bulgarian Rosehip Oil by GC-MS, UV-VIS Spectroscopy, Colorimetry, FTIR Spectroscopy, and 3D Excitation–Emission Fluorescence Spectra. Molecules. 2025; 30(19):3964. https://doi.org/10.3390/molecules30193964
Chicago/Turabian StyleNikolova, Krastena, Tinko Eftimov, Natalina Panova, Veselin Vladev, Samia Fouzar, and Kristian Nikolov. 2025. "Characterization of Bulgarian Rosehip Oil by GC-MS, UV-VIS Spectroscopy, Colorimetry, FTIR Spectroscopy, and 3D Excitation–Emission Fluorescence Spectra" Molecules 30, no. 19: 3964. https://doi.org/10.3390/molecules30193964
APA StyleNikolova, K., Eftimov, T., Panova, N., Vladev, V., Fouzar, S., & Nikolov, K. (2025). Characterization of Bulgarian Rosehip Oil by GC-MS, UV-VIS Spectroscopy, Colorimetry, FTIR Spectroscopy, and 3D Excitation–Emission Fluorescence Spectra. Molecules, 30(19), 3964. https://doi.org/10.3390/molecules30193964


