Article

Fluorimetric Determination of Eosin Y in Water Samples and Drinks Using Deep Eutectic Solvent-Based Liquid-Phase Microextraction

by
Sofia Kakalejčíková
1,*,
Yaroslav Bazeľ
1,*,
Mária Drábiková
1 and
Maksym Fizer
2
1
Department of Analytical Chemistry, Institute of Chemistry, Faculty of Science, Pavol Jozef Šafárik University in Košice, 040 01 Košice, Slovakia
2
Department of Chemistry, University of Nevada, Reno, 1664 N. Virginia Street, Reno, NV 89557-0216, USA
*
Authors to whom correspondence should be addressed.
Molecules 2025, 30(16), 3334; https://doi.org/10.3390/molecules30163334
Submission received: 22 July 2025 / Revised: 6 August 2025 / Accepted: 8 August 2025 / Published: 10 August 2025
(This article belongs to the Special Issue Advances in Food Analytical Methods)

Abstract

An environmentally friendly and highly sensitive analytical method for the determination of the dye Eosin Y (EY) was developed utilizing vortex-assisted liquid–liquid microextraction based on deep eutectic solvents (DESs), combined with fluorescence detection (LPME-FLD). The extraction efficiencies of conventional solvents and various DES systems, composed of tetrabutylammonium bromide (TBAB) and alcohols (hexanol, octanol, and decanol) in different ratios, were systematically compared. DFT calculations provided insights into the most stable forms of EY in solvents of varying polarity. Theoretical Hansen solubility parameters and the COSMO-RS solvation model were applied to assess extraction efficiency. Hansen parameters were obtained via semiempirical PM7 calculations, while BP86/def2-TZVPD DFT computations were employed within the openCOSMO-RS framework. The developed method exhibited a linear calibration range between 0.1 and 130 µg·L−1, with a high correlation coefficient (R2 = 0.9982). The limit of detection (LOD) was established at 0.028 µg·L−1. Method precision and repeatability were confirmed over two days, with relative standard deviations (RSDs) ranging from 1.1% to 2.7% and with recoveries between 99.0% and 106.2%. The proposed analytical approach was successfully applied to the determination of EY in real water samples, demonstrating both its practical applicability and alignment with green chemistry principles.

Graphical Abstract

1. Introduction

Eosin Y (EY), 2′,4′,5′,7′-tetrabromo–3′,6′-dihydroxyspiro(isobenzofuran-1(3H),9′−(9H)xanthen)-3-one disodium salt, also known as 2,4,5,7-tetrabromofluorescein, is a fluorescent red dye soluble in water and various polar organic solvents. EY is a commonly used histological dye that selectively binds to specific cellular structures and enhances their visibility through coloration. However, beyond histology, it also finds wide application in other fields such as the pharmaceutical industry, cosmetics, textiles, plastics, paints, inks, detergents, color filters, varnishes, and photographic materials [1]. Although it is considered biodegradable, its large-scale release into water bodies can negatively impact aquatic ecosystems, and accidental ingestion may pose health risks [2]. In recent decades, synthetic dyes, including EY, have also been widely used in the food industry [3]. EY is an easily accessible and inexpensive dye, which increases the risk of its potential misuse as an adulterant in beverages and other food products. For this reason, reliable detection of trace concentrations of EY in environmental and food samples is a current and significant analytical challenge. For instance, the dye has been detected in several postage stamps printed since 1879 [1]. This anionic dye is highly effective in inactivating bacterial cells, likely due to its lipophilic nature [4,5,6]. EY is frequently used in histological examination for staining cytoplasm, red blood cells, collagen, and muscle fibers, most commonly as a counterstain to hematoxylin. Due to its extended conjugated system and multiple chromophores, EY exhibits a high molar absorption coefficient and a high photoluminescence quantum yield. One of its distinguishing features is the pronounced sensitivity of its fluorescence to environmental factors, including solvent polarity [7,8] and the presence of surfactants [6,9,10,11]. For this reason, it finds broad application in photonics research and electrochemistry [12]; spectral analysis, as an analytical probe [13,14,15]; in carbon dot fabrication [16]; and as a catalyst in photoredox reactions [17,18,19]. EY is also widely used in analytical techniques, such as UV-Vis and spectrofluorimetric detection, particularly in the extraction-based or direct analysis of heavy metals, surfactants, pharmaceuticals, proteins, and more [20]. Additionally, EY is used to trace groundwater migration pathways; however, its environmental toxicity remains a concern [17].
As of 12 June 2025, a total of 2941 records containing the keyword “Eosin Y” were found in the Web of Science database. Over the past decade (2014–2025), 2111 scientific articles have been published, most of them in the fields of Multidisciplinary Chemistry (478), Physical Chemistry (407), Organic Chemistry (351), Multidisciplinary Materials Science (257), Chemical Engineering (197), Polymer Science (123), Energy and Fuels (113), Analytical Chemistry (110), and Nanoscience and Nanotechnology (101) (Figure 1a). In recent years, a steady increase in the number of publications referencing “Eosin Y” has been observed (Figure 1b). Despite its broad relevance and diverse applications, only a limited number of analytical methods for the determination of EY have been reported in the literature.
EY belongs to the class of fluorescent dyes and can therefore be determined using UV-Vis spectrophotometric and spectrofluorimetric methods, including those based on simple direct calibration of aqueous dye solutions [6,21,22,23]. UV-Vis spectrophotometry is a fast, straightforward, and cost-effective analytical method; however, its sensitivity and selectivity are not always sufficient for current analytical requirements. As a result, only a limited number of UV-Vis-based methods for EY determination have been reported in the literature. For example, a novel and simple UV-Vis method was developed by [24] using the H-point standard addition method for the determination of EY in binary mixtures with erythrosine, which exhibits overlapping absorption spectra with EY. The method relies on the complexation of EY with Fe(III) at pH 5.5 in the presence of the micellar medium Triton X-100. Absorbance measurements of the mixture solutions were taken at two wavelengths: 540 and 550 nm. The method was successfully applied to the determination of EY in model mixtures and commercial products, such as ink and fruit drinks. However, critical validation parameters such as LOD (limit of detection) or LOQ (limit of quantification) are not reported in the article.
Spectrofluorimetry is significantly more sensitive and is likely to be the primary working technique for the determination of EY. The authors of [7,8] reported an increase in the fluorescence intensity of EY when using polar organic solvents (methanol, ethanol, acetone, and DMFA). Therefore, more sensitive fluorescence spectroscopy based on direct calibration of EY can also be performed in the polar organic environment of the fluorophore. To improve the analytical characteristics of spectroanalytical methods, they are often combined with separation techniques, especially microextraction. However, we found only a few publications in the literature describing such methods. The authors of [22,25] state that the analytical challenge of detecting trace concentrations of EY in water samples can be effectively addressed by separating the dye using capillary electrophoresis combined with laser-induced fluorescence (CE-LIF) at an excitation wavelength of 514.5 nm. The method is characterized as highly selective due to ion mobility-based separation. However, they do not report any validation characteristics of the method or examples of analytical applications in their article. In another study [26], an analytical approach for the determination of EY was developed based on high-performance liquid chromatography (HPLC) coupled with a diode array detector (DAD), fluorescence detector (FLD), and high-resolution mass spectrometry (HPLC-ESI-MS). Fluorescence detection (λex = 526 nm, λem = 550 nm) proved to be the most sensitive for the target analyte: the detection limit (ng g−1) was two orders of magnitude lower than with DAD, and one order of magnitude lower than with MS (5.7 × 101, 1.3 × 10⁻¹, and 1 for HPLC-DAD, HPLC-FLD, and HPLC-ESI-MS, respectively). The developed analytical approach enabled the unambiguous identification of EY even in a micro-sample taken from a valuable work of art (just a few grains of faded pigment from a Van Gogh painting), which demonstrates the strengths and potential of the method.
A voltammetric method was also developed for the determination of the dye EY in selected samples, based on square-wave adsorptive stripping voltammetry, differential pulse polarography, and cyclic voltammetry [21]. Among these, adsorptive stripping voltammetry provided the most sensitive approach for the quantitative electroanalytical determination of the dye. The adsorptive peak exhibited a linear response for EY in the concentration range from 5.0 × 10⁻⁶ to 5.0 × 10⁻⁷ mol L−1 (R2 = 0.99). The developed method proved to be simple, sensitive (detection limit 8.73 × 10⁻¹⁰ mol L−1), and fast. The detection limit was significantly lower compared to the UV-Vis spectrophotometric method based on direct calibration of aqueous EY solutions. In addition, the method offers other advantages such as low cost, good repeatability, and precision (RSD = 0.64%). Possible interferences with several dyes, such as food azo dyes (E110, E102), amaranth, and selected metal ions, were studied. The method was applied to the determination of EY in lacquer and seawater samples; however, the recovery test results did not demonstrate satisfactory accuracy.
The analytical method developed by us represents a significant contribution to the determination of EY. Compared to previously used techniques described above, such as ultraviolet–visible spectrophotometry, spectrofluorimetry, as well as electrochemical and voltammetric methods, our method achieves higher sensitivity with a lower detection limit, a wider linear range, and improved accuracy and reproducibility. In addition, it minimizes the impact of interfering substances, an area where some electrochemical and voltammetric techniques fall short. A key innovative aspect of the proposed methodology is the use of environmentally friendly deep eutectic solvents (DESs), which represent an attractive alternative to conventional organic solvents in terms of toxicity, biodegradability, and overall environmental sustainability. Another major advantage of this method is its simplicity and low instrumental requirements, allowing its application even in laboratories without access to advanced analytical technologies. Unlike complex HPLC-FLD or LC-MS/MS systems, which require elaborate instrumentation and high operational costs, the LPME-FLD technique provides an efficient combination of high analytical performance with both economic and environmental efficiency.
The obtained results indicate that the proposed method has strong potential for routine determination of EY in environmental samples and represents a sustainable and accessible alternative to existing analytical approaches. Our recent studies highlight the significant advantages of computational methods in understanding the solvation behavior of various molecular structures at the molecular level [27,28,29,30]. For a comprehensive overview, interested readers are referred to the review articles by Torsa Das et al. [31] and Omar Atiq et al. [32]. One of the most powerful modeling tools is COSMO-RS [33], which enables, for example, the prediction of the extraction capabilities of ionic liquids [34], the design of DESs optimized for extraction processes [35,36,37], and the prescreening of natural eutectic solvents [38]. Another widely used predictive approach is based on Hansen solubility parameters (HSPs) [39], which are also applicable to the development of new DESs [40,41], as well as the prediction of solubility [42] and extraction efficiency [43]. Given the rapid growth in the use of computational approaches for solubility prediction, several of these methods were employed in the present study to gain deeper insight into the microsolvation of different forms of EY in the selected solvents.
The aim of this study is to characterize the properties of the investigated system by combining suitable experimental and theoretical tools, and to develop a new, efficient method for the determination of EY based on the combination of fluorescence detection with LPME using DESs, which are recognized for their low toxicity, biodegradability, and alignment with green chemistry principles.

2. Results and Discussion

2.1. Protolitic and Fluorescence Properties of EY

EY belongs to acid dyes and can exist in solution in a molecular form (H2An) as well as in two anionic forms: An2− and HAn. The equilibrium between the forms of EY can be generally represented by the following equations:
H2An ↔ H+ + HAn
HAn ↔ −H+ + An2−
The predominance of a specific form of the dye in a solution is primarily influenced by the values of the dissociation constants and the pH of the solution. Several authors agree that, due to the electron-withdrawing effect of the bromine atoms, the hydroxyl group in the dye structure should dissociate more easily than the carboxyl group. Therefore, pK1 characterizes the dissociation of the hydroxyl group, and pK2 corresponds to the dissociation of the carboxyl group in the EY molecule. According to various authors, the difference between the dissociation pK values of EY is less than 1, although the exact values reported vary. Reported pK1 values range from 2.02 [44] to 3.25 [45], while pK2 values are more consistent, ranging from 3.50 [46] to 3.80 [44,45,47]. However, some studies report pK values outside these intervals [10,48,49,50], likely due to differences in the experimental methods used or varying conditions during the determination of pK.
To study the influence of pH, we used an optical probe, which offers several practical advantages [51]. It enables direct measurement in the sample without the need to transfer it to a cuvette, making it possible to monitor the measurement process in real time—ideal for the precise recording of absorbance changes during pH adjustments. Due to its ease of handling and the speed of the device, a large number of measurements can be performed in a short time, increasing experimental efficiency. The optical probe thus represents a flexible and effective tool even for the spectrophotometric analysis of the dye EY. The molecular form of the dye H2An is colorless and poorly soluble in aqueous solutions; therefore, under acidic conditions, the dye becomes colorless and may even precipitate. This form of the dye is not suitable for analytical applications. In contrast, both anionic forms (HAn and An2−) exhibit intense coloration and fluorescence, showing only minor differences in their spectrophotometric and protolytic properties. With increasing acidity, a decrease in absorbance intensity is observed in the visible spectrum, accompanied by a gradual shift in the maximum wavelength from 516 nm (pH 7.24) to 519 nm (pH 1.0) (see Figure 2a). This correlates with the results of previous studies [42,44,46]. Based on this shift, we assign the maximum wavelength of 519 nm to the An2 form, while the HAn form corresponds to a maximum wavelength of 516 nm. The observed bathochromic shift is minor (approximately 3 nm) and difficult to distinguish. Consequently, despite the large number of measurements performed (Figure 2b), we were unable to reliably determine the dissociation constants of EY. However, these results allow us to determine the dominance range of the analytically active colored form of EY in solution—the absorbance of the EY solution is maximal and nearly constant across a broad pH range from 4.5 to 11.5.
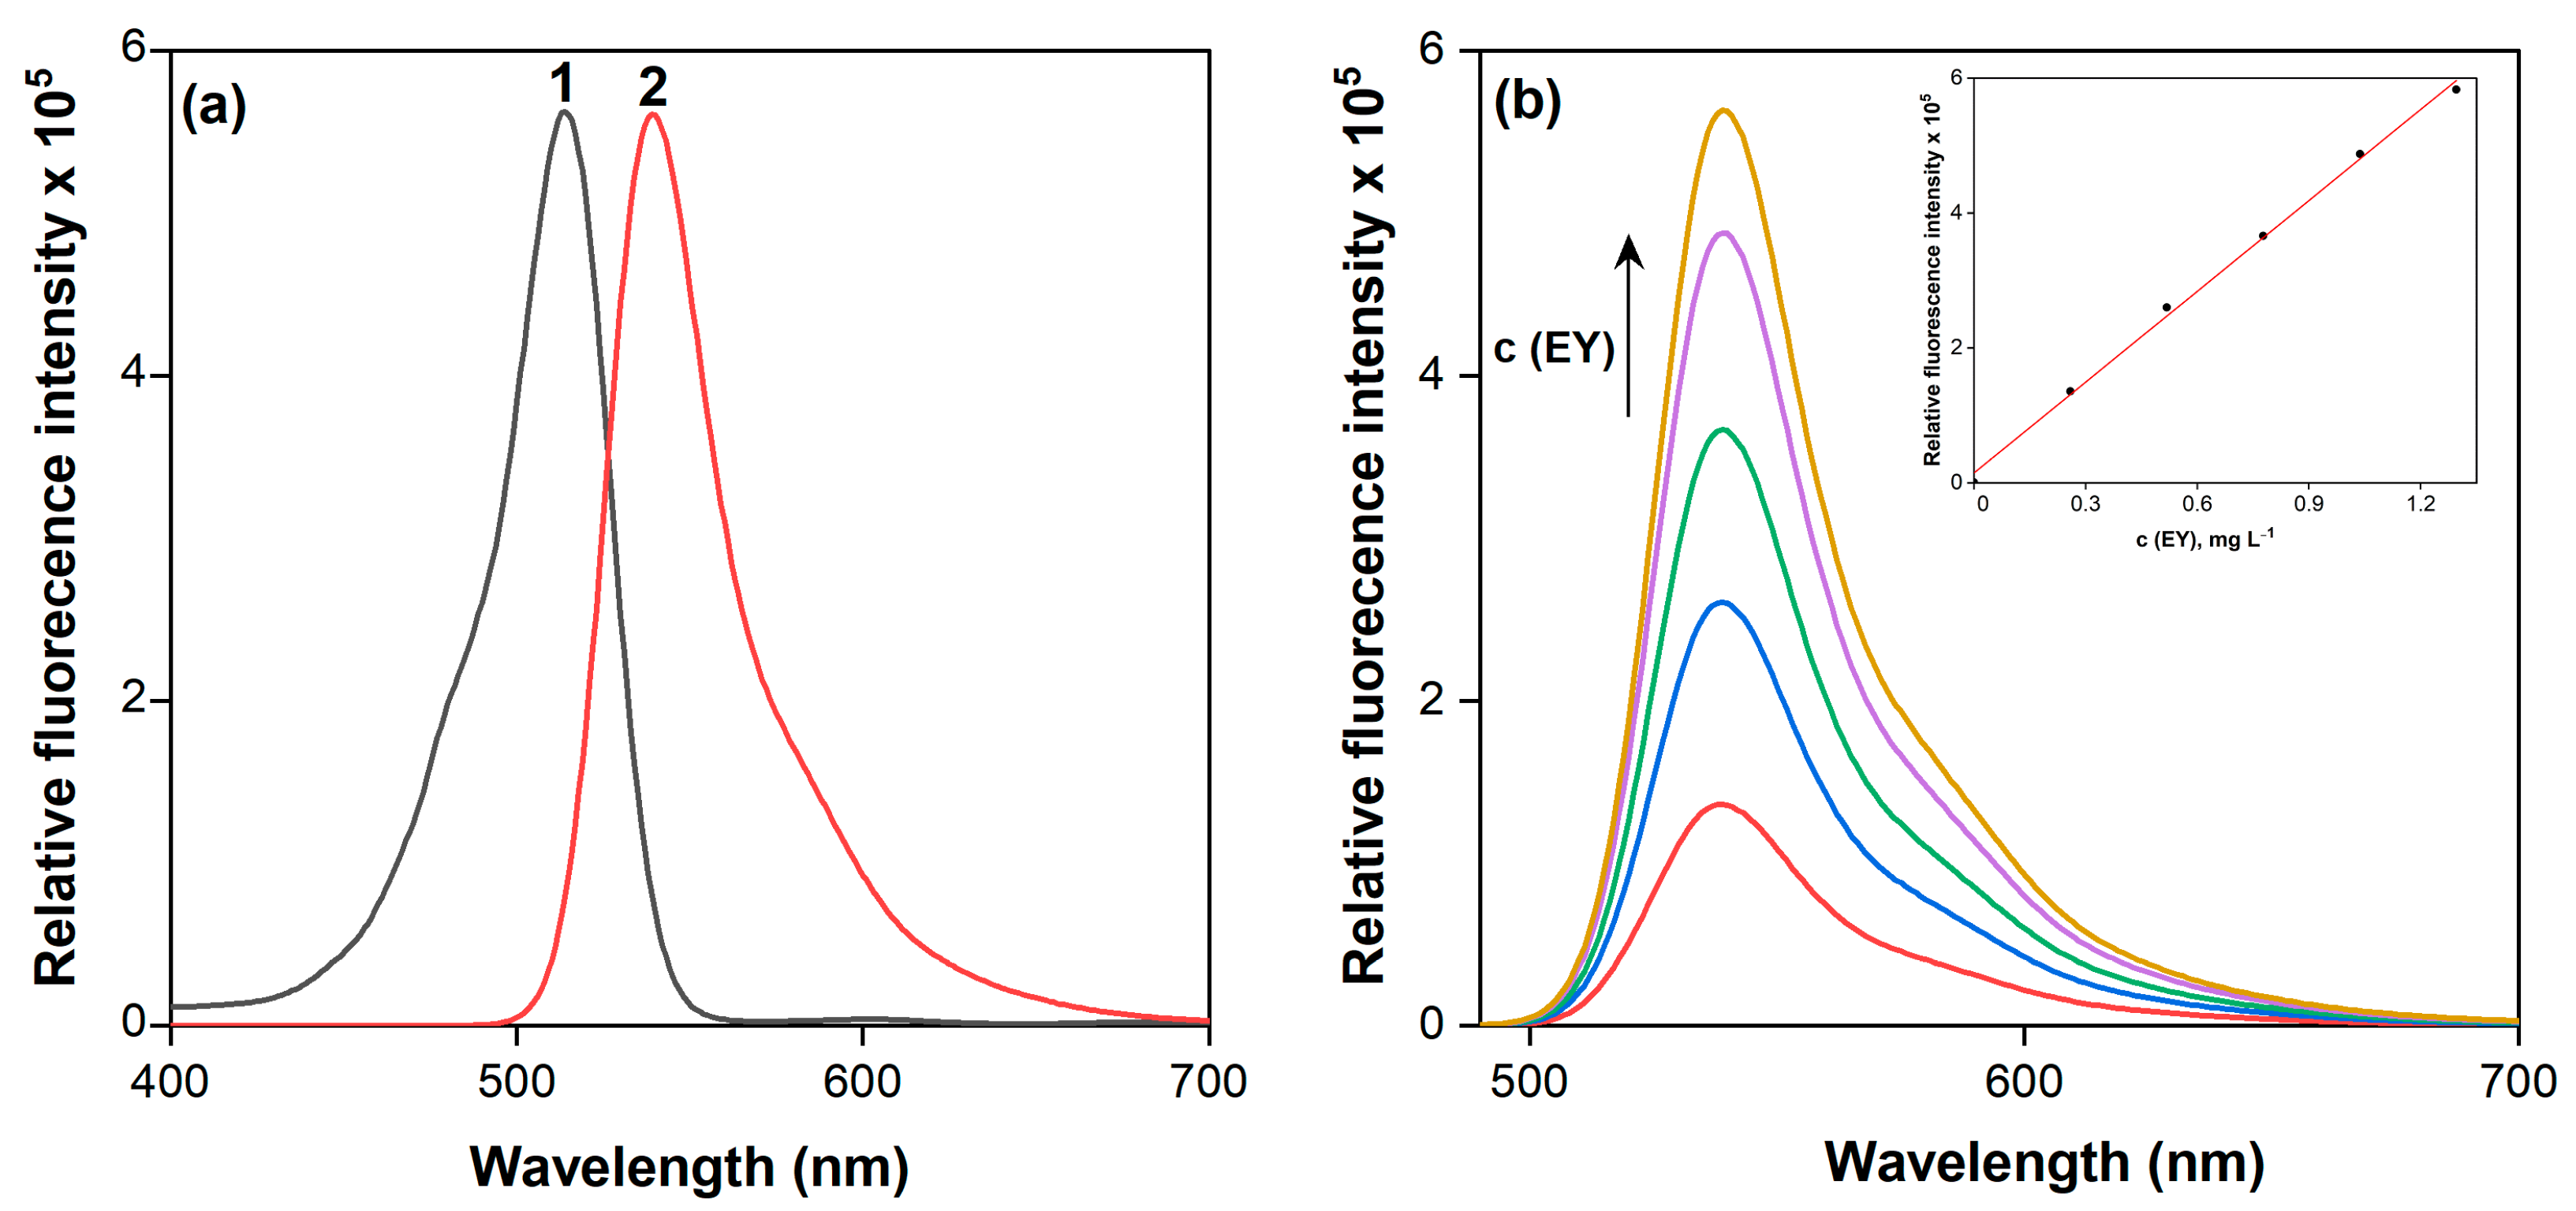
The dye EY is notable not only for its intense coloration in solution but also for its fluorescent properties. Fluorescence measurements in the range of 400–700 nm were used to record the emission and excitation spectra of EY (Figure 3a). The excitation spectrum displays a maximum at 514 nm, which is very close to the absorption maximum (λmax) in the spectra (516 nm). The emission spectrum shows a maximum signal at λmax = 546 nm, consistent with previously published data [52]. As the dye concentration increases from 0.30 to 1.30 mg·L−1, gradual enhancement of the fluorescence signal is observed (Figure 3b). A calibration curve built on this trend can be used for the direct determination of EY. However, the sensitivity of this approach is limited and does not meet the current demands of analytical chemistry.
A promising strategy for improving the analytical performance of spectroanalytical methods involves combining them with sample pretreatment techniques, particularly those that enable separation and preconcentration. Among these methods, microextraction stands out as an efficient and environmentally friendly approach suitable for various analytical applications. Liquid-phase microextraction (LPME) techniques are highly compatible with spectroscopic methods, especially UV-Vis and AAS [53,54]. Surprisingly, the integration of LPME with fluorescence detection techniques is currently rarely utilized [27,28,55].
A significant trend in modern analytical chemistry is the introduction of alternative, environmentally friendly solvents that align with the 12 principles of green chemistry, particularly in reducing hazardous substances and improving energy efficiency. These solvents not only provide effective extraction and preconcentration capabilities, but also support the development of more sustainable and safer analytical methods, thus contributing to several Sustainable Development Goals (SDGs). Such solvents primarily include ionic liquids (ILs), DESs, switchable hydrophilicity solvents (SHSs), and bio-derived solvents, among others. ILs are characterized by high thermal stability, low vapor pressure, and potential for reuse. However, their drawbacks include hygroscopicity, high viscosity, complex synthesis, and relatively high cost [56]. SHSs are solvents that can switch between hydrophilic and hydrophobic properties depending on conditions, making them versatile and qualify as so-called “smart” solvents. In analytical chemistry, SHSs have only been adopted relatively recently, since around 2015 [57,58]. One important but often overlooked issue is that amine-based SHS may not fully meet modern environmental safety standards and can degrade into more toxic substances in aqueous environments.
In contrast, DESs have emerged as more sustainable alternatives, characterized by low vapor pressure, low flammability, low toxicity, and biodegradability. They are often composed of readily available, inexpensive, and bio-based components, such as natural acids, alcohols, or polyols, and can be prepared via simple mixing without complex synthesis, aligning with green chemistry principles such as the use of safer solvents and renewable feedstocks [59,60,61]. DESs can generally be described as liquid mixtures of asymmetric ions or molecules with low melting points. DESs are commonly classified into five generations, with type III DES being the most extensively studied. These are formed by mixing quaternary ammonium salts with hydrogen bond donors such as amides, carboxylic acids, alcohols, and polyols [62,63]. For these reasons, the selection of DESs in this study not only enhances analytical performance but also represents a strategic step toward greener and more sustainable chemical analysis, consistent with global efforts to minimize environmental impact and promote eco-innovation in science and technology.

2.2. DFT-Based Theoretical Calculations

To better understand and describe the extraction process of EY, several computational protocols were employed. The EY molecule contains multiple functional groups, including three that can act as acidic centers: one carboxylic group and two phenolic hydroxyl groups. These groups enable the existence of multiple protonation states of EY in solution, depending on the pH. Therefore, the first step in modeling the molecular properties is to identify the most stable and chemically relevant structures.
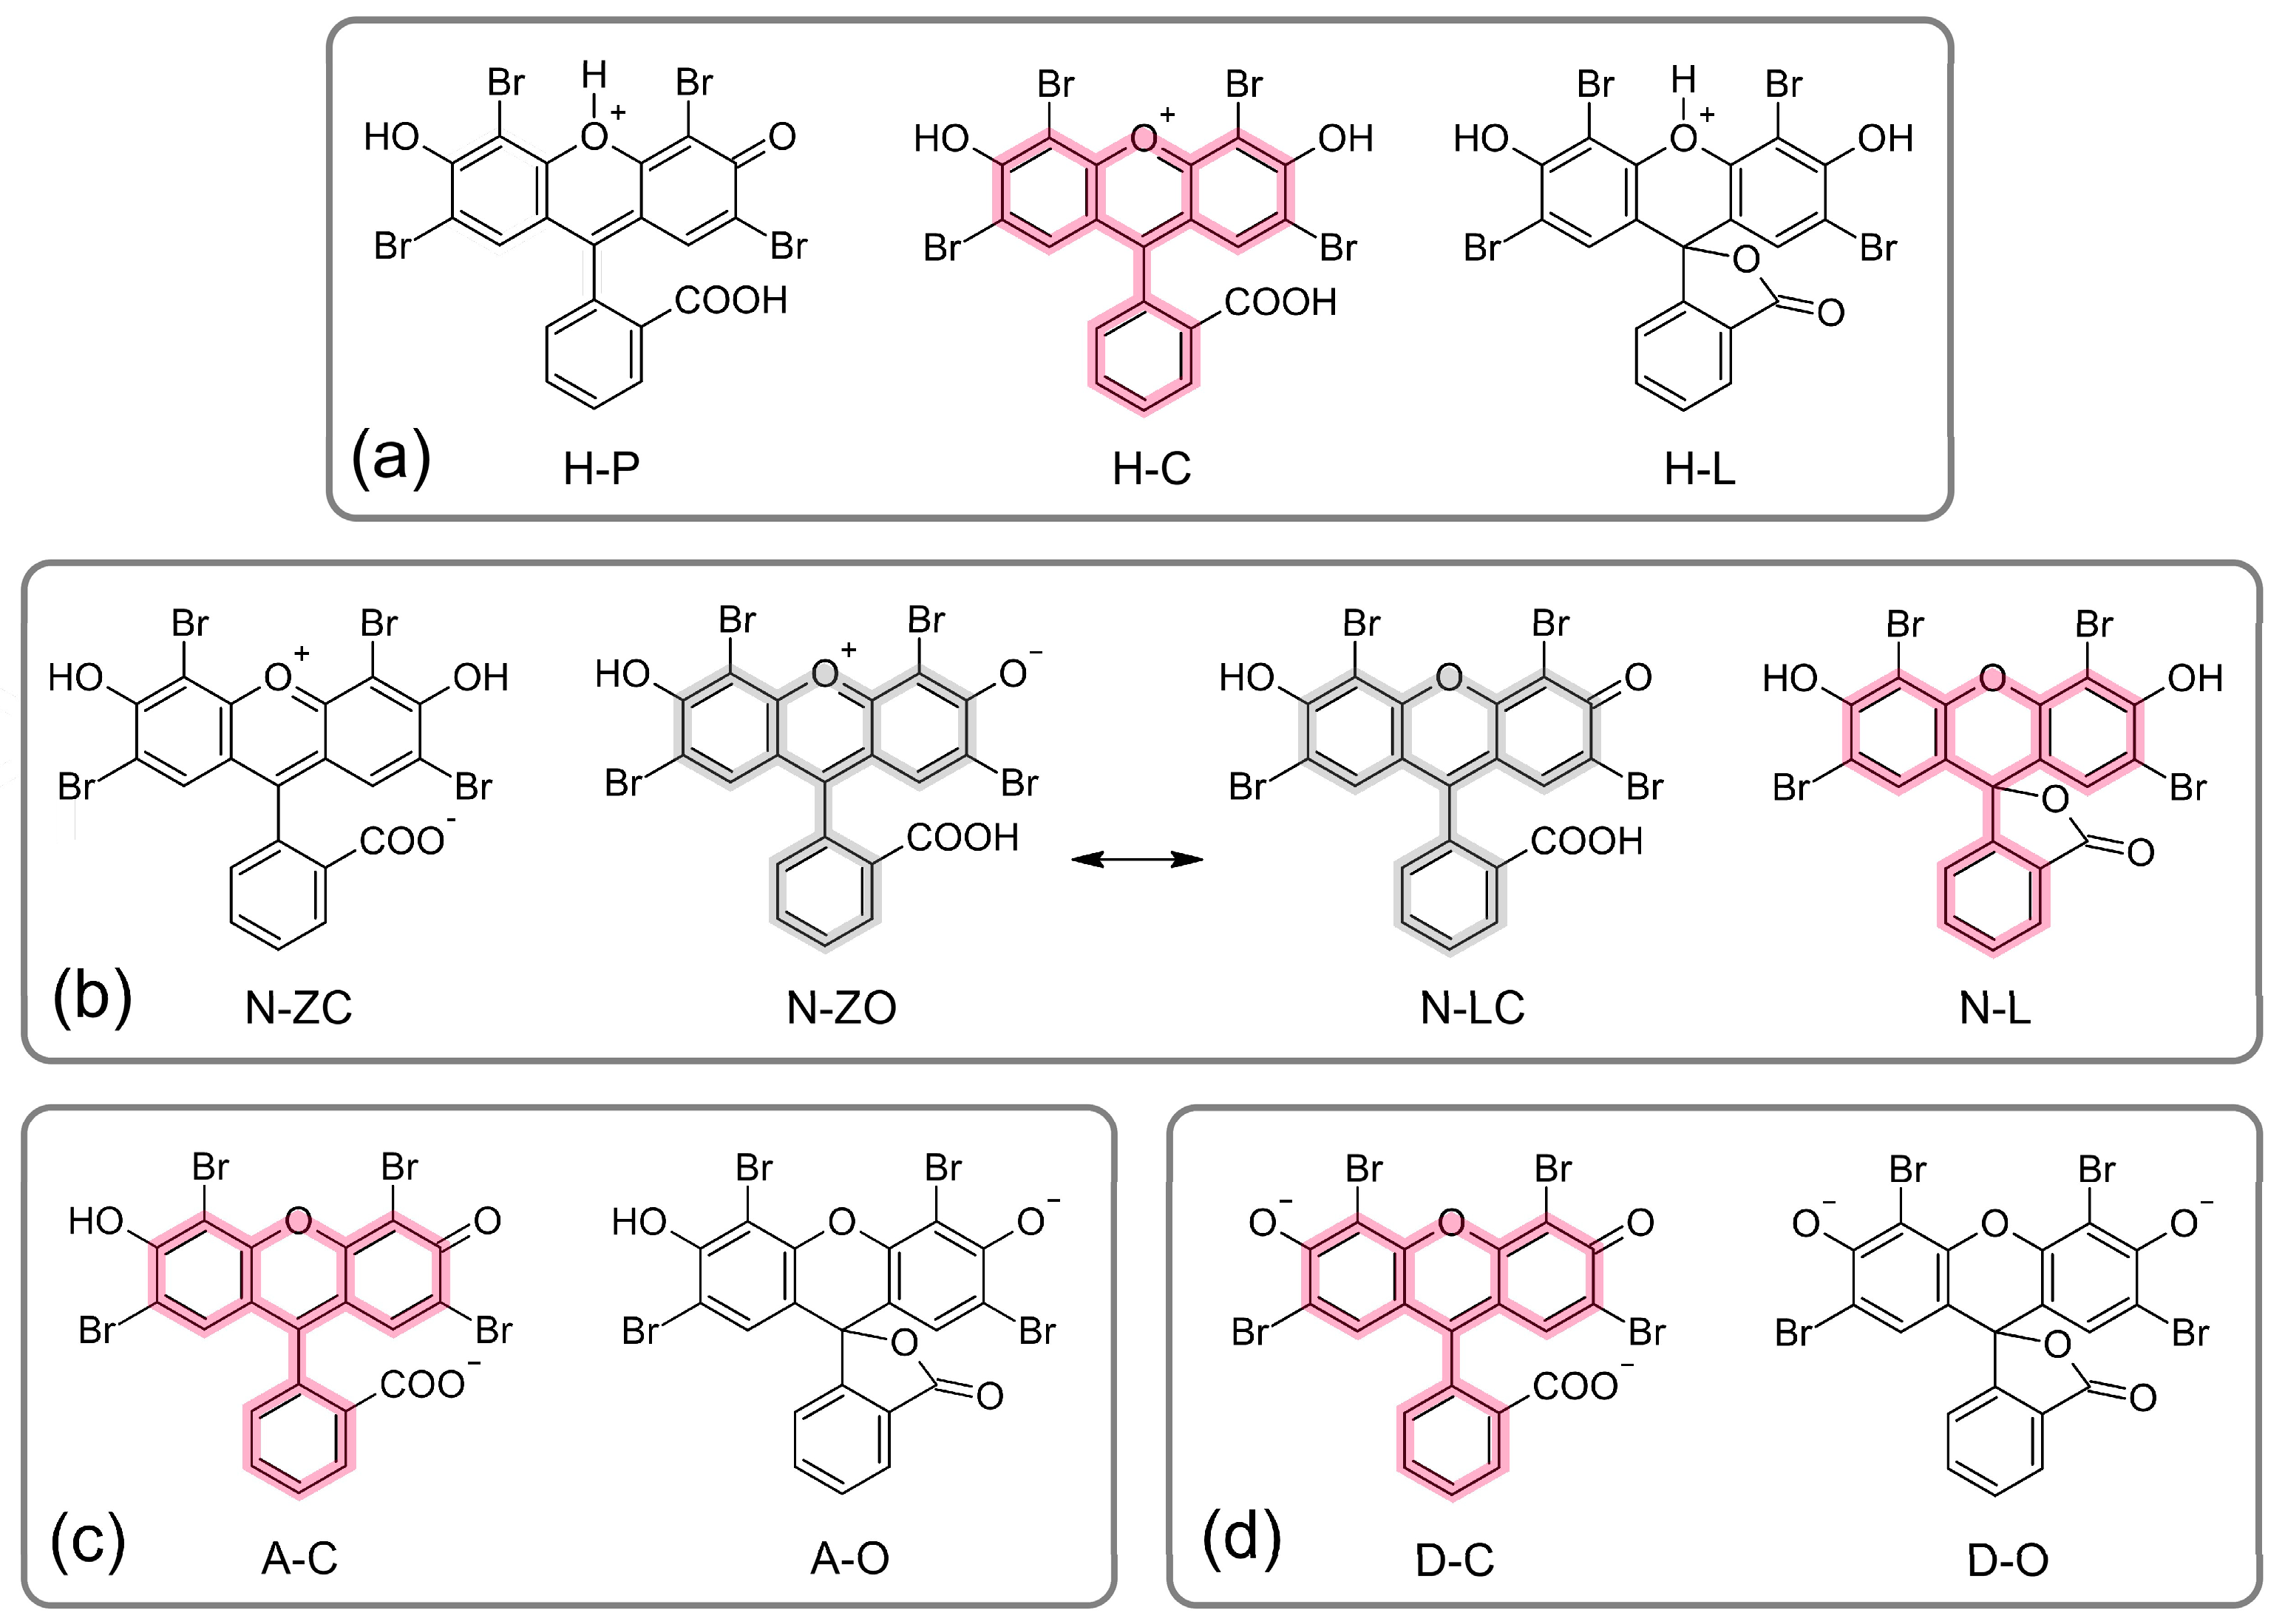
Based on previously published studies of fluorescein-related dyes, including EY [10,20,44,48], the cationic (monoprotonated), neutral, monoanionic, and dianionic forms of EY were selected as model species for computational analysis using density functional theory (DFT). The cationic forms of EY contain a dibenzopyrylium (xanthenium) moiety and differ in the location of the proton, either near the endocyclic pyran oxygen atom (forms H-P and H-L in Figure 4a) or near the endocyclic phenolic oxygen atom (form H-C in Figure 4a). Additionally, forms H-L and H-P represent the cyclic (lactone) and non-cyclic (open) structures of protonated EY, respectively. The DFT-calculated relative Gibbs free energies (ΔG) and corresponding mole fractions of the EY species are summarized in Table 1. Two solvents were considered for ΔG calculations: polar water and the significantly less polar octanol. In aqueous solution, the cationic forms H-C, H-P, and H-L exhibit ΔG values of 0.0, 50.5, and 46.3 kcal/mol, respectively, indicating that nearly 100% of the EY cation exists in the H-C form. A similar trend was observed in octanol.
A more complex picture was observed for the neutral forms of EY. Two zwitterionic structures, N-ZC and N-ZO (Figure 4b), both with a net molecular charge of zero, were considered, along with two additional neutral forms: one containing a lactone ring (N-L) and one without it (N-LC). It is important to note that, from a computational perspective, N-ZO and N-LC represent the same structure in resonance, and distinguishing the dominant form requires analysis of bond orders or partial charge distributions. In both water and octanol, the lactone structure N-L was identified as the predominant neutral form (see Table 1). However, the N-ZO/N-LC form also exists in a notable fraction—6.7% in octanol and 18.1% in water.
The monoanionic and dianionic forms of EY are expected to exist in both cyclic (A-O and D-O) and non-cyclic (A-C and D-C) structures, as shown in Figure 4c,d. Interestingly, in aqueous solution, the predominant monoanionic form is the non-cyclic structure A-C, which coexists with 5.6% of the lactone form A-O. However, in the less polar environment of octanol, the presence of A-O becomes negligible (see Table 1). The dianionic lactone form D-O is approximately 8.7 kcal/mol less stable than the non-cyclic form D-C in both water and octanol, indicating that the non-cyclic D-C structure is the predominant species in both solvents.
The calculations discussed above enabled us to identify the molecular structures corresponding to specific protonation states of EY at different pH levels. However, the available experimental data on the protonated forms of EY and their associated pKa values appear somewhat contradictory. This discrepancy can be rationalized by the DFT results, which indicate the possible coexistence of multiple structural isomers for a given protonation state. To further clarify this, we calculated the pKa values for the proposed structures using the Chemicalize software. The resulting microspecies distribution plots are provided in the Supplementary Information (see Figure S1). The computed pKa values are relatively close, ranging from 3.4 to 6.0, suggesting that the cationic, neutral, monoanionic, and dianionic forms of EY may coexist within this narrow pH window of approximately 2.6 units.
Consequently, we proceeded with the theoretical investigation using microsolvated species for all four protonation states, specifically the H-C, N-L, N-LC, A-C, and D-C forms. It is important to note that, based on Mayer bond order analysis (see Table S1), the N-LC structure appears to be more stable than the alternative resonance form N-ZO. The bond order values support the presence of a quinoid moiety, favoring the N-LC structure as the more plausible representation.
The next step in understanding the solvation of EY at the molecular level involved analyzing the species’ solvation free energies using the more advanced and accurate openCOSMO-RS-24a protocol. A major advantage of this method is its explicit treatment of solute–solvent interactions, based on the fragmentation of molecular surfaces (for both solute and solvent) according to their outer electrostatic potential. Figure 5 (structures a–e and g–k) presents van der Waals surface plots colored according to the screening charge density, σ (in e/nm2), which represents the ratio of surface charge to surface area. Bright blue areas indicate negative charge densities, with values as low as −3.0 e/nm2; bright red areas represent positive values, up to approximately +3.0 e/nm2; and most of the surface regions are green, with moderate values around ±1.0 e/nm2. However, a visual comparison of the screening charge density is less informative than the so-called σ-profile–a histogram showing the distribution density ρnorm(σ) of the screening charge. Given that the structural fragments of the DES clusters are quite similar—specifically, positively charged quaternary ammonium cations, negatively charged bromide anions, highly polar hydroxyl groups, nearly neutral butyl chains from tetrabutylammonium bromide (TBAB), and the alkyl groups of the alcohols—the σ-profiles of the DESs are expected to resemble one another closely. This expectation is confirmed in Figure 5f, where the normalized σ-profiles of five DESs—comprising TBAB with butanol (DES-C4), hexanol (DES-C6), heptanol (DES-C7), octanol (DES-C8), and decanol (DES-C10)—are overlaid and show nearly perfect alignment. In contrast, the various forms of EY also contain similar structural motifs, yet despite strong similarities in their σ-profiles within the neutral region (−1.0 to +1.0 e/nm2), notable differences emerge beyond this range (see Figure 5l). These deviations can be attributed to variations in the overall charge and its spatial distribution across the different EY forms. As illustrated in Figure 5g–k, positive screening charge densities are mainly localized on the hydrogen atoms of hydroxyl groups, while negative regions are concentrated near the carboxylate and phenolate moieties.
The openCOSMO-RS calculations yielded Gibbs free energy of solvation (Gsolv) values for the EY species of interest. The efficiency of an EY form extraction can be estimated by comparing its Gsolv in a given solvent to that in water. Figure 6 presents the Gsolv values for the EY forms in five DESs, as well as in amyl acetate (AmAc), chloroform, octanol, tetrachloromethane (TCM), toluene, and water. For the cationic form H-C, the Gsolv values in the DESs are slightly lower (i.e., more favorable) than in most of the conventional solvents, except for chloroform. However, all Gsolv values fall within a narrow range of 10 kcal/mol. In tetrachloromethane and benzene, the Gsolv values are higher than in water, indicating that these solvents are unlikely to extract the H-C form from aqueous solution effectively. In contrast, the neutral forms N-LC and N-L exhibit higher Gsolv values in organic solvents compared to water, suggesting less favorable solvation. Notably, the Gsolv values for these forms in DESs are comparable to those observed in classical organic solvents (COSs), indicating similar solvation behavior.
The most notable results are those related to the negatively charged forms of EY. Specifically, all Gsolv values for A-C are significantly negative, ranging from approximately −55 to −70 kcal/mol, while the values for D-C are even more negative, between −140 and −170 kcal/mol. In both cases, the highest absolute Gsolv values were observed in water and chloroform, indicating that chloroform is the only solvent among those considered that can moderately extract EY from water. However, this result contradicts experimental observations, suggesting that our modeling methodology is not yet fully complete.
The most significant improvement made was the inclusion of counter cations in the structures of the monoanionic and dianionic forms. First, the new forms A-C+ and D-C+, which include counter cations, were constructed. For water and conventional organic solvents, Na+ cations were used as counterions and positioned near the negatively charged carboxylate and phenoxylate groups to maximize electrostatic interactions. A more nuanced approach was required in the case of DESs. The DESs considered here consist of one-third tetrabutylammonium (TBA+) cations, one-third bromide (Br) anions, and one-third alcohol molecules. This composition suggests that DESs can undergo ion exchange reactions when interacting with sodium salts of EY, which are present in aqueous solutions at higher pH. The corresponding reactions can be represented as:
[A-C] − Na+ + TBA+ − Br − ROH → [A-C] − TBA+ + Na+ + Br + ROH
[D-C]2− − (Na+)2 + 2TBA+ − Br − ROH → [D-C]2− − (TBA+)2 + 2Na+ + 2Br + 2ROH
ROH denotes the general formula of an alcohol, where R = C4H9, C6H13, C7H15, C8H17, or C10H21. The corresponding structures of the A-C+ and D-C+ complexes with TBA+ counterions were reoptimized, and their Gsolv values in DESs were calculated using the same openCOSMO-RS methodology. The resulting Gsolv values for the A-C+ and D-C+ forms of EY, paired with Na+ (in classical organic solvents) and TBA+ (in DESs) counterions, are shown in Figure 6. The significant advantage of using DESs is evident; the Gsolv values in DESs are approximately 20 kcal/mol lower for A-C+ and 30 kcal/mol lower for D-C+ compared to those in water.
Despite the clear presence of electrostatic interactions between the anionic EY forms and the TBA+ cation in their associated structures, these polar fragments are partially shielded. Additionally, weak van der Waals forces contribute to interionic attraction, highlighting the significant nonpolar character of these associates and explaining their low Gsolv values in water. Visualization of these weak interionic interactions in the TBA+ complexes with A-C+ and D-C+ is provided in Figure S2. These calculations not only reproduce the experimental observations but also explain the high efficiency of DESs, which results from the simultaneous chemical modification of the EY substrate through its association with the TBA+ cation.

2.3. Hansen Solubility Parameters

Another powerful approach for identifying potentially good or poor solvents for a system of interest is the use of Hansen solubility spheres, which are based on Hansen solubility parameters (HSPs). These parameters are divided into three components: dispersion forces, dipolar intermolecular forces, and intermolecular hydrogen bonding interactions [39]. The well-known principle “like dissolves like” lies at the core of the Hansen solubility method [64]. It is important to note that HSPs are well-documented for classical solvents; however, for new solvent systems such as the DESs considered in this study, pre-parameterization is required [39]. Fortunately, in our recent work, we proposed a relatively simple computational procedure that enables estimation of unknown HSPs using semiempirical theoretical calculations [27]. This method is both reasonably accurate and significantly less computationally demanding than ab initio or DFT approaches, making it feasible to perform within minutes on a standard office laptop [27].
The HSP model was developed by Hansen through the decomposition of the previously proposed Hildebrand solubility parameter (δ) into three components: dispersion (δD), polarity (δP), and hydrogen bonding (δH). This refinement allows for a more accurate representation of the various types of solute-solvent interactions [39]. We found a strong correlation between the known HSPs of classical solvents and the corresponding P parameters, which can be derived from PM7 calculations. The detailed methodology for calculating these P parameters is provided in our previous work [27]; here, we recall the equations used to compute the HSPs:
δD = 173.9 × PD + 3.128
δP = 0.8688 × PP + 1.040
δH = 0.5430 × PH − 4.647
Here we need to recall that δD, δP, and δH are considered axes of tridimensional plots, and in this 3D space, the distance Ra between HSPs of solute (s) and solvent (sol) is estimated as:
Ra2 = 4[δD(s) − δD(sol)]2 + [δP(s) − δP(sol)]2 + [δH(s) − δH(sol)]2
To assess whether a solvent is compatible with a given solute in terms of solubility, the relative energy difference (RED) parameter is employed. This parameter is obtained by dividing the interaction distance Ra by a characteristic value known as the interaction radius R0, which is specific to the solute being examined. Solvents with RED values less than 1 are generally considered “good” and fall within a spherical region of radius R0, often referred to as the Hansen solubility sphere. In contrast, solvents with RED values greater than 1 typically do not dissolve the solute effectively, indicating poor compatibility. When RED equals 1, partial solubility is expected. For the forms of EY examined in this study, R0 was set to different values to provide an applicable threshold to differentiate solvent performance in dissolving the solute.
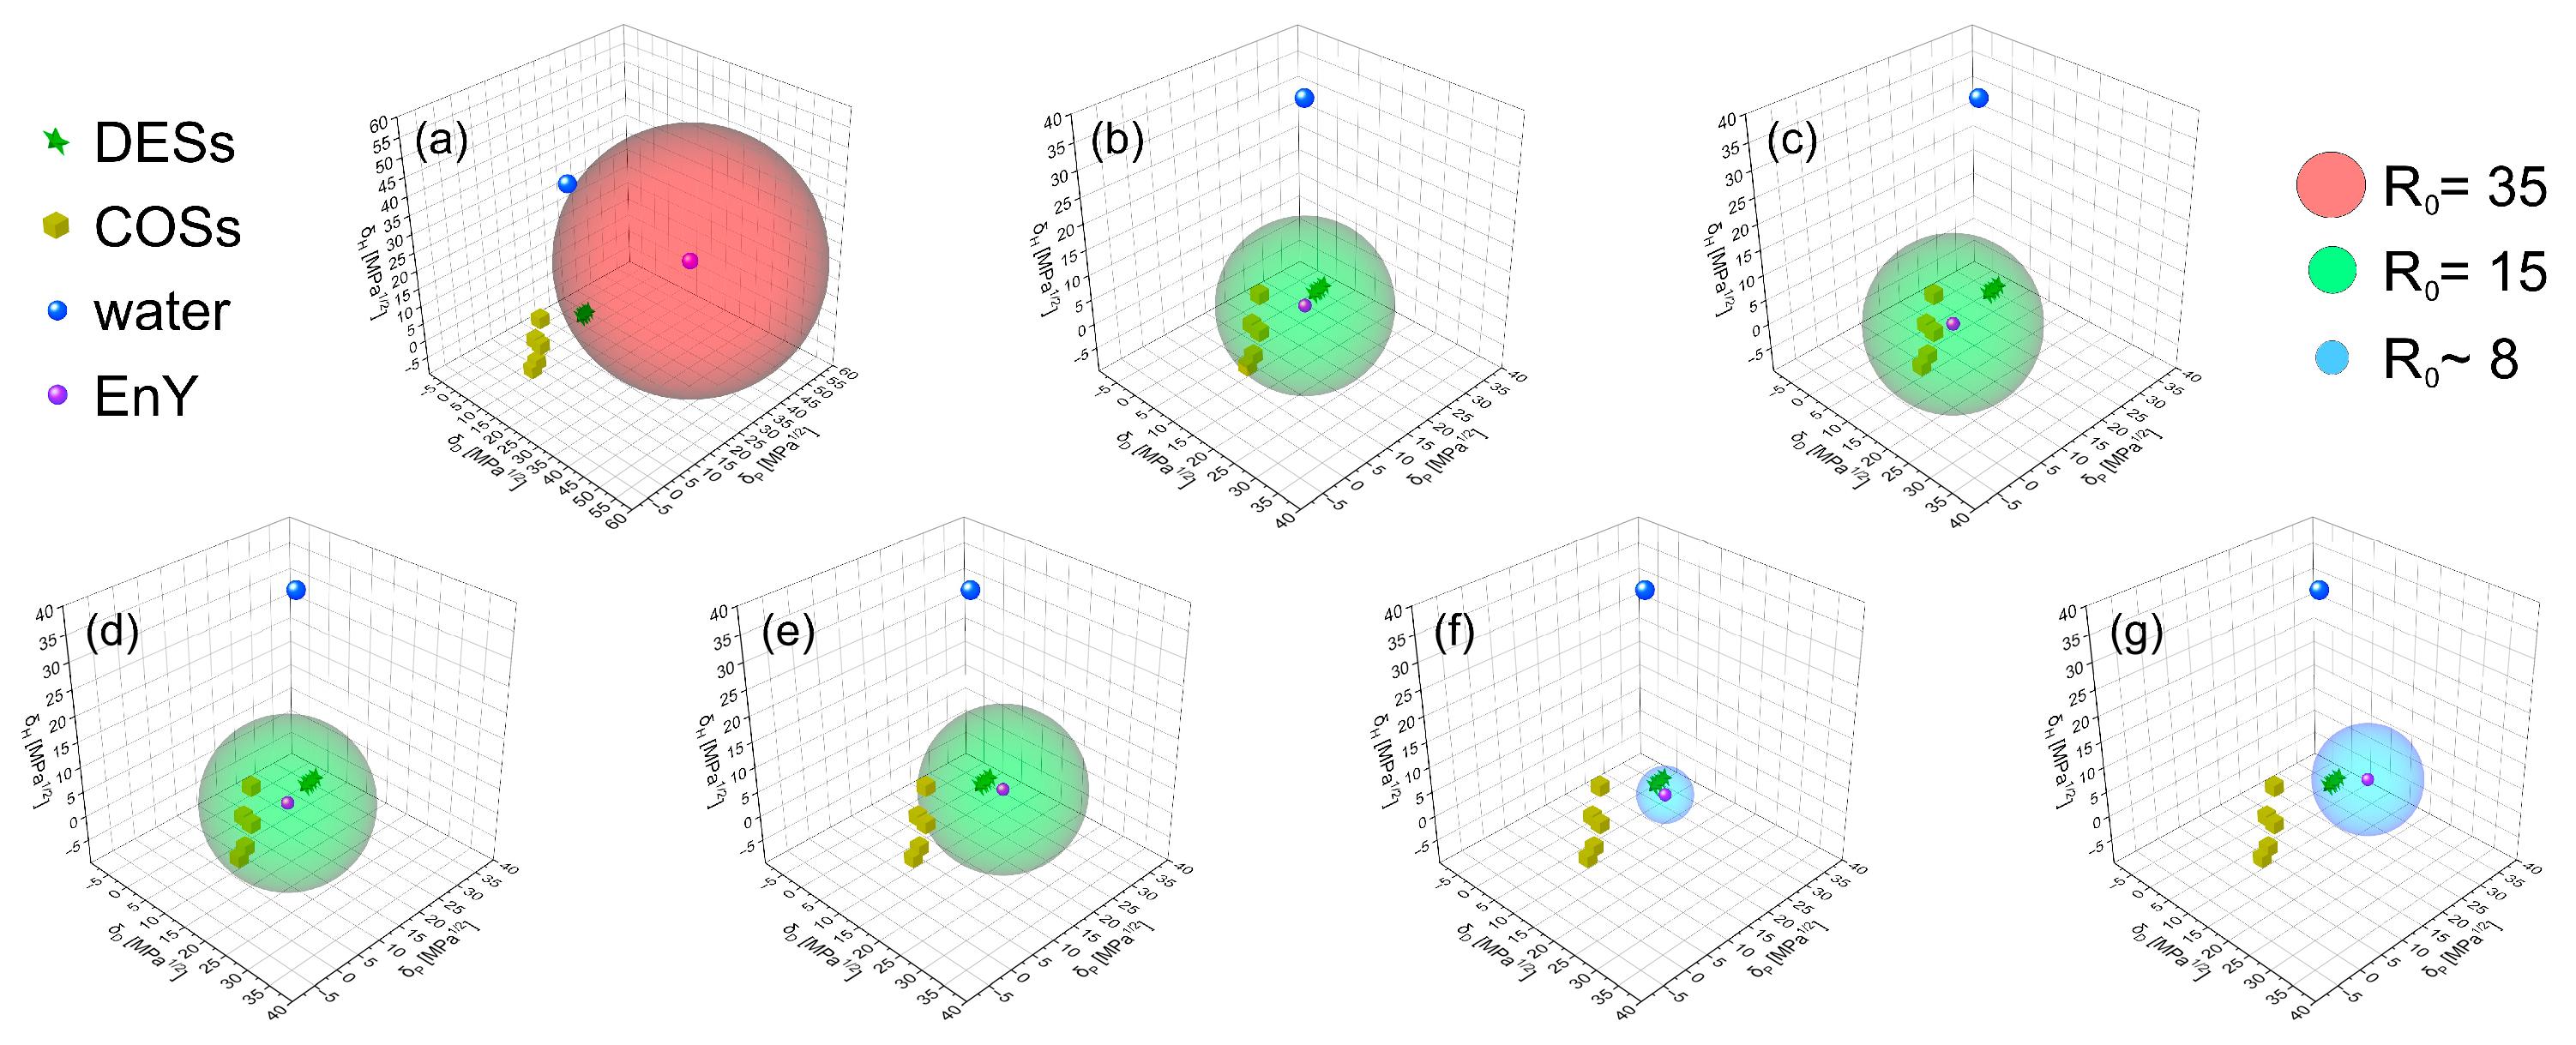
Hansen solubility spheres for the various forms of EY are presented in Figure 7. The cationic form H-C was modeled as a complex with a Br anion, since the calculations described above are applicable only to neutral species. For DESs to be considered potentially good solvents for this form, the corresponding R0 value would need to be around 35 MPa0.5—a relatively high threshold, indicating that all the considered solvents should be classified as “poor” solvents for this EY form (Figure 7a). In contrast, the neutral forms N-LC and N-L, with R0 values of 15 MPa0.5, can be considered well soluble in DESs (green stars) and classical organic solvents (COSs, gold cubes), but poorly soluble in water (blue dot), as shown in Figure 7b,c.
Next, we examined the mono- and dianionic forms A-C+ and D-C+ with sodium counterions. For completeness, DES data were also included in the analysis (Figure 7d,e). With moderate R0 values of 15 MPa0.5, the A-C+ sodium complex is soluble in both DESs and COSs, whereas the D-C+ sodium complex shows poor solubility in COSs but remains soluble in DESs. However, as noted earlier, DESs undergo ion exchange reactions with sodium salts of EY. Therefore, TBA+ complexes of the anionic forms were also considered (Figure 7f,g). Interestingly, the R0 value for the A-C+/TBA+ complex drops to just 5 MPa0.5, yet it still shows good solubility in DESs. For the D-C+/TBA+ complex, the limiting R0 value for solubility in DESs is around 10 MPa0.5. These findings are consistent with the openCOSMO-RS results discussed above and clearly indicate that the negatively charged forms of EY can be efficiently extracted by the proposed DESs. This efficiency is attributed to the formation of ionic associates between the EY anions and the TBA+ cation, a key component of the DES formulations.

2.4. Optimization of EY Microextraction Using DES

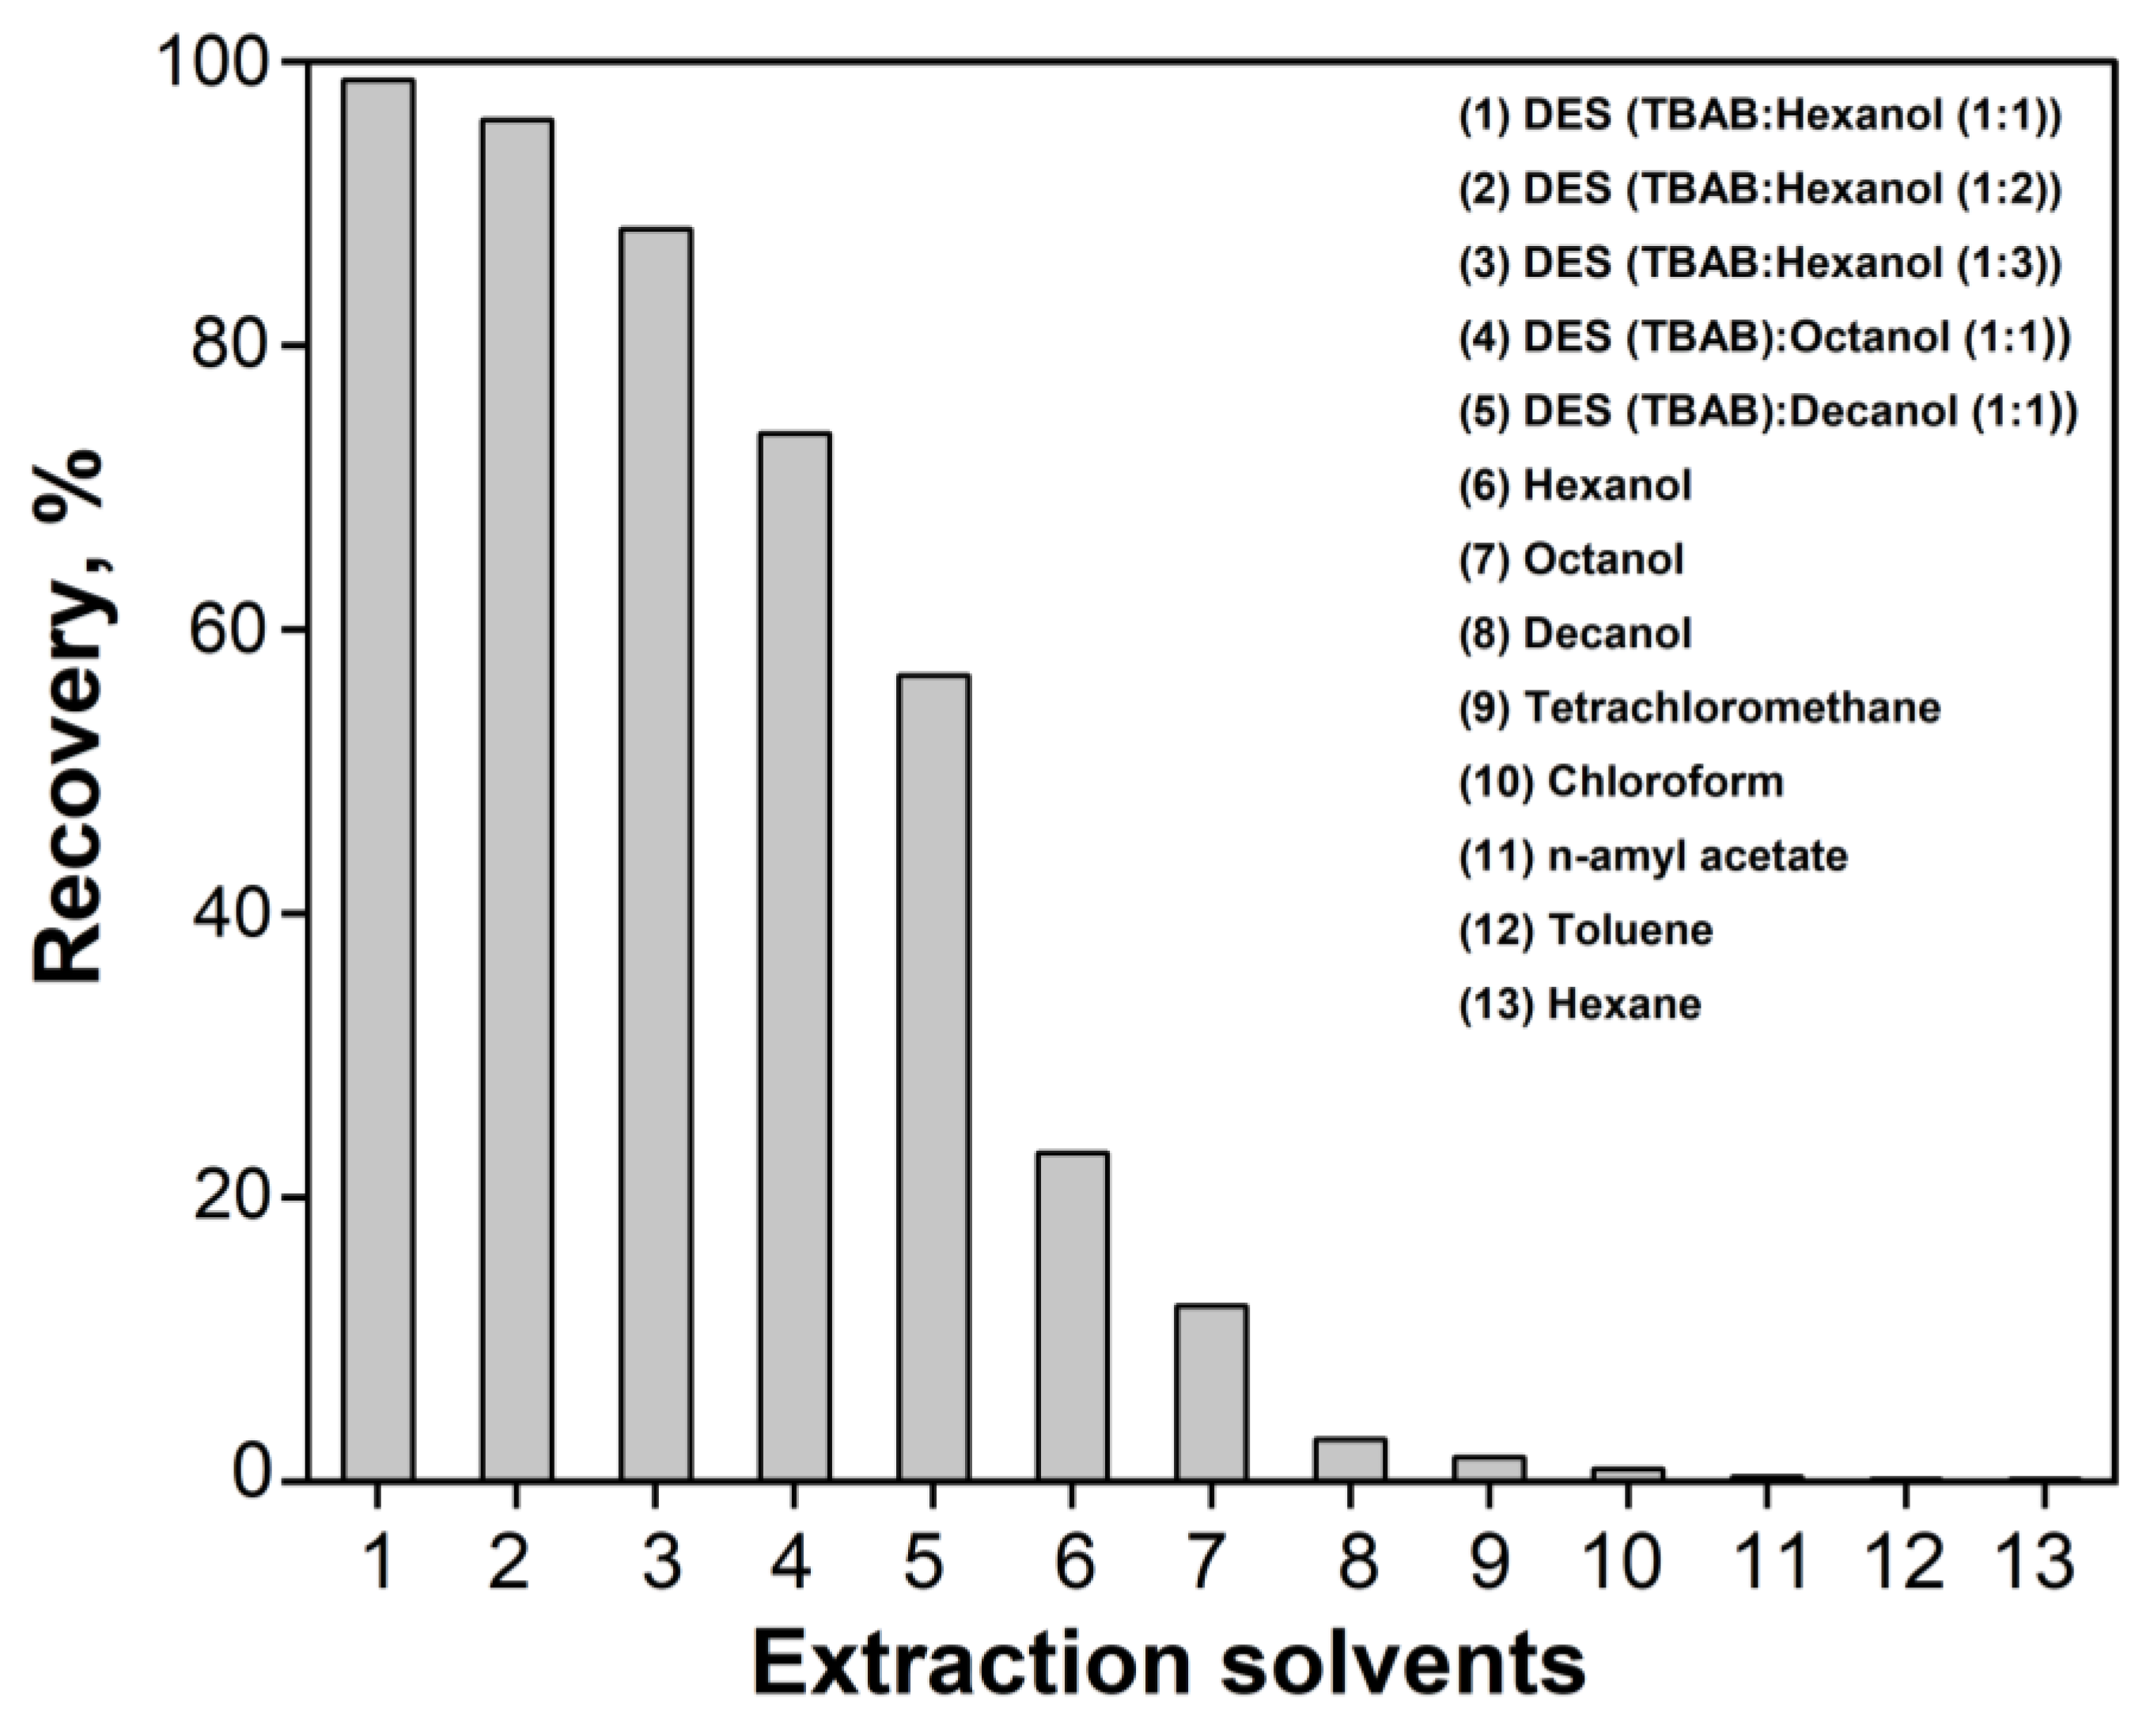
According to classical concepts, extraction is primarily influenced by the charge of the analyte. According to our findings (Figure 2), EY exists in solution in the form of dissociated anions carrying a charge of −1 and/or −2 over a wide pH range of 2–11. Therefore, the generally low extraction efficiency of most of the extractants tested for EY is understandable (Figure 8). None of the examined extractants meets the requirements for effective preconcentration and separation of EY. In such cases, it is recommended to neutralize the analyte’s charge, for example, by forming ion pairs (ionic associates, IA). The literature reports the successful extraction of EY in the form of IA with cationic agents [65]. In our case, the addition of a similar agent (tetrabutylammonium bromide, TBAB) improved the extraction of EY with hexanol, chloroform, and n-amyl acetate. TBAB is well known as a hydrogen bond acceptor and is commonly combined with donors such as carboxylic acids or higher alcohols to form DES. According to several authors [66,67,68], these DES decompose in aqueous environments—allowing the alcohol to act as the extraction solvent, while TBAB serves as a dispersive agent that facilitates mass transfer between the aqueous and organic phases. Due to these properties, TBAB-based DESs are frequently used in analytical chemistry, especially for the preconcentration and separation of various analytes, including dyes [69,70]. In our previous study [27], we focused on the detailed characterization of DES composed of TBAB and hexanol in molar ratios of 1:1, 1:2, and 1:3. FT-IR spectroscopy revealed significant differences compared to pure hexanol, particularly in the region of O–H stretching vibrations. These spectral shifts suggest the formation of strong hydrogen bonds between the hydroxyl groups of the alcohol and the bromide anion (O–H···Br), confirming the presence of specific intermolecular interactions and the structural stability of the DES.
As the TBAB concentration increased, the extraction yield of EY also increased, reaching a maximum before gradually declining. However, even at the optimal TBAB concentration, the extraction efficiency did not exceed 75%. A markedly different effect was observed during the microextraction of EY using DES prepared by pre-mixing TBAB with alcohols (hexanol, octanol, decanol) [25]. In this case, at the optimal DES component (TBAB:hexanol = 1:1), we achieved an extraction efficiency of over 97%. Moreover, the fluorescence intensity of the extracts was significantly higher than that of any individual solvent tested (Figure 8). We propose that optimizing the DES composition ensures efficient microextraction because TBAB, acting as a cationic extraction agent, neutralizes the charge of the EY anions, forming an extractable ion pair; meanwhile, hexanol serves as the solvent, facilitating the recovery of EY in the IA form. This hypothesis aligns with the results of our theoretical calculations (see Section 2.2). Based on this optimization, the most effective EY extraction was achieved using a DES with a TBAB: hexanol ratio of 1:1.

2.4.1. Effect of Acidity

The effect of pH on the fluorescence properties was analyzed over the pH range of 0.16 to 10.0. Two saturation regions were observed: the first between pH 2–4 and the second between pH 5–10 (Figure S3). This may provide additional evidence that EY, depending on the charge of its anionic form, can form 1:1 and 1:2 ion pairs with TBAB. The highest relative fluorescence intensity was observed at pH 5. Within the pH range of 5–10, the intensity remained stable, showing no significant variation. Based on these results, pH 5 was selected as the optimal value for further experiments. These observations are consistent with spectrophotometric measurements obtained using an optical probe (see Section 2.1).
Simultaneously, the volume of the added buffer solution was optimized in the range from 0 to 2.0 mL. The maximum relative fluorescence intensity was achieved at a buffer volume of 0.2 mL, while further volume increases resulted in a decrease in fluorescence intensity. Based on these findings, all subsequent experiments were carried out under conditions of pH 5 and a buffer volume of 0.2 mL.

2.4.2. Effect of Vortex Mixing and Centrifugation

The speed and duration of vortex mixing were optimized to maximize the relative fluorescence intensity. Vortexing was tested at speeds ranging from 1200 to 3000 rpm. The highest signal intensity was observed at 3000 rpm. Further optimization of vortexing time (0–60 s) revealed that maximum fluorescence intensity was reached after just 15 s, with the signal remaining stable up to 60 s. These results indicate rapid formation of the extractable complex. Based on these findings, the optimal vortexing conditions were set at 3000 rpm for 15 s.
Simultaneously, centrifugation parameters were optimized in the range of 1200–3000 rpm and 1–5 min. Effective phase separation was achieved after 3 min of centrifugation at 1200 rpm. Higher speeds or longer durations did not provide significant improvements; therefore, these conditions were selected as optimal. All subsequent microextractions were performed under these optimized conditions.

2.4.3. Stability of the Extracts over Time

The stability of the fluorescence signal of the extracts was monitored over a time interval of 0 to 60 min following the addition of all components. The experimental results showed that no significant changes in relative fluorescence intensity during this period. Therefore, it can be concluded that the fluorescence signal remains stable for at least 60 min, which is entirely sufficient for analytical purposes.

2.5. Interference Study

Under optimized conditions, the influence of potential interfering substances on the determination of EY was investigated, with a primary focus on various dyes, including both fluorescent and non-fluorescent types. Interferents causing deviations in the analytical signal of less than ±5% were considered negligible and non-impactful on the EY measurement.
The selectivity of the determination of EY in the presence of the studied dyes was relatively high. The results showed that dyes such as Rhodamine B and Methyl Orange, present in tenfold excess, had no significant impact on EY determination. Additionally, dyes like Rhodamine 6G, Astrafloxine, Fluorescein, and Methyl Red did not interfere when present at concentrations comparable to EY (1:1 ratio) (Figure S4). However, at higher interferent concentrations, their influence became more pronounced, potentially complicating analyte quantification. Interestingly, in most cases, interference was observed as a fluorescence quenching effect. Only Fluorescein and Rhodamine 6G, when present in excess beyond a 1:1 ratio, caused an increase in fluorescence intensity.

2.6. Validation Characteristics of the LPME-FLD Method

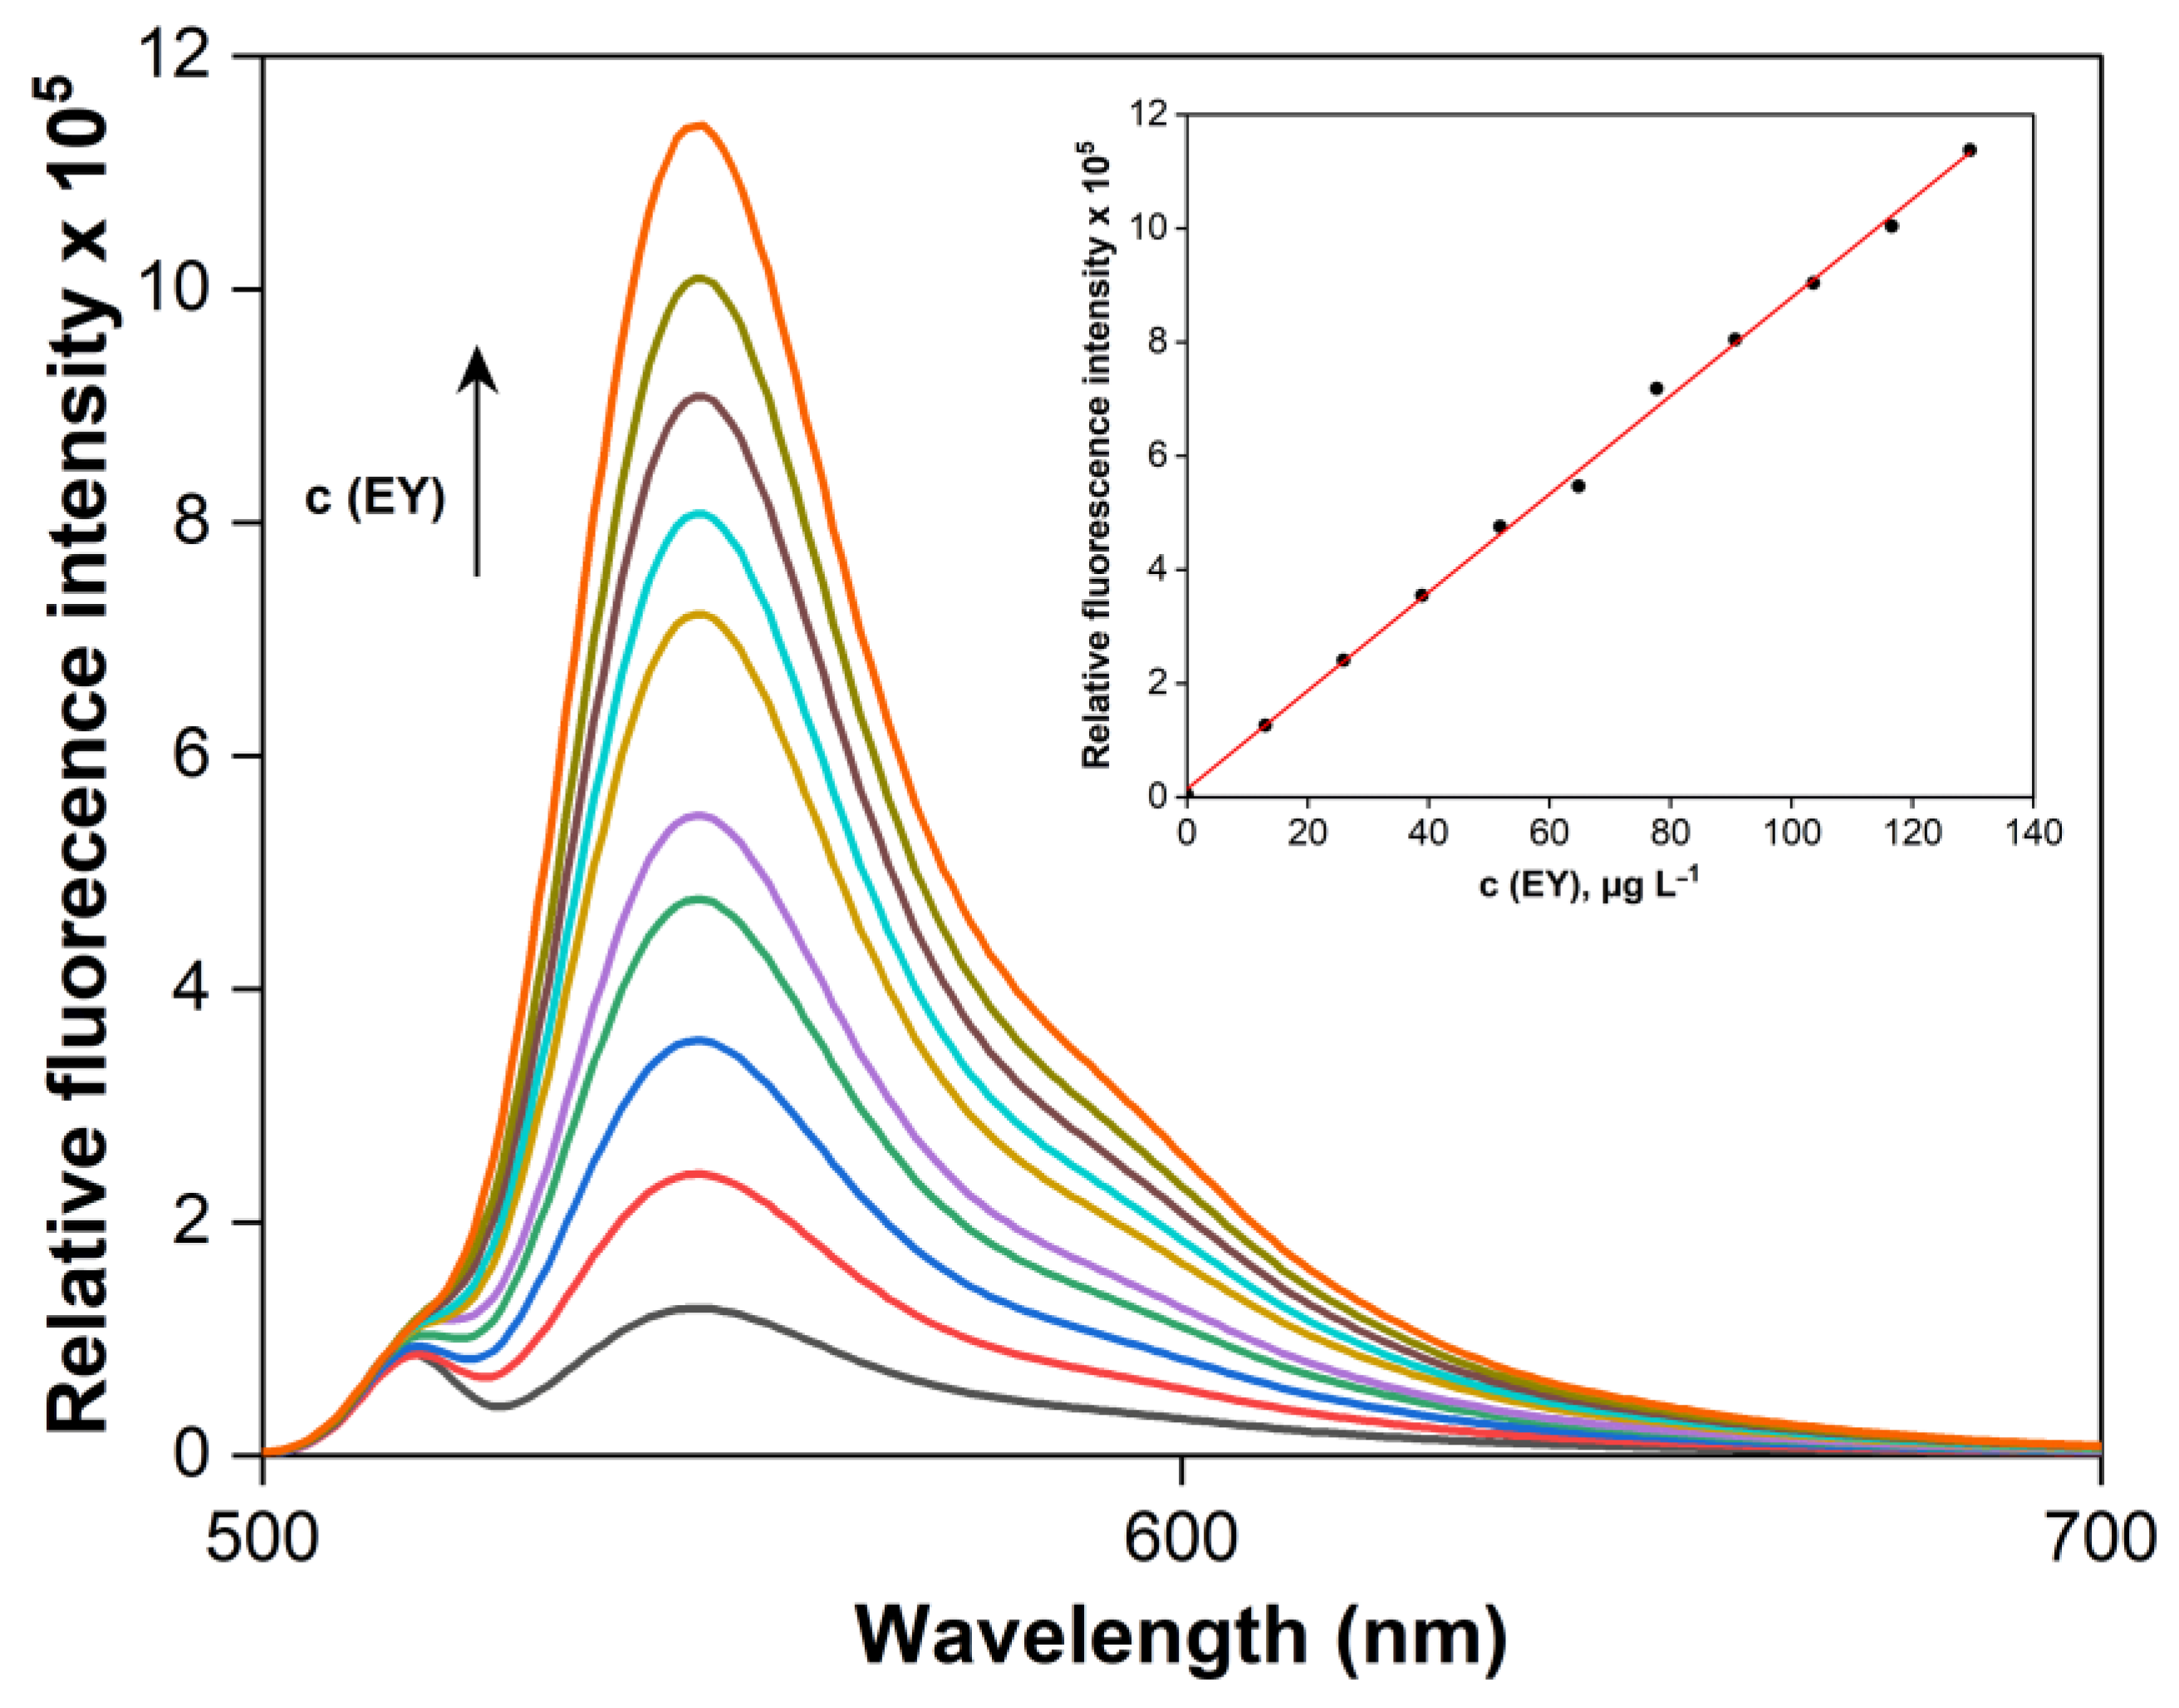
A significant increase in the fluorescence intensity of DES extracts composed of TBAB and hexanol in a 1:1 molar ratio was observed with increasing EY concentration (Figure 9). The linearity of the calibration curve was confirmed for microextraction into 500 µL of DES within the EY concentration range of 0.1 to 130 µg L−1. The regression equation for the calibration line, where y represents the relative fluorescence intensity and x the EY concentration in µg·L−1, was y = 8643x + 14,558, with a determination coefficient R2 = 0.9982, indicating excellent linearity. The enrichment factor (EF), calculated as the ratio of the slopes of the calibration curves with and without preconcentration, was 19.2. The preconcentration factor (PF), defined as the ratio of the volumes of the aqueous and organic phases, was 10.0.
The limit of detection (LOD), calculated as three times the standard deviation of the blank signal, was 0.028 µg·L−1, while the limit of quantification (LOQ), calculated as ten times the standard deviation, corresponded to 0.094 µg·L−1.
To evaluate the accuracy and precision of the proposed analytical method, microextractions of spiked samples (n = 5) were performed at two EY concentration levels (38.9 and 77.7 µg·L−1) over two consecutive days. The results are summarized in Table 2. The obtained recoveries ranged from 99.0% to 106.2%, with relative standard deviations (RSDs) between 1.1% and 2.7%. These findings confirm the good reproducibility and reliability of the proposed procedure.
Contemporary environmentally focused analytical chemistry aims to develop methodologies that minimize environmental impact and mitigate risks to human health. Key priorities include reducing reagent toxicity, minimizing waste generation, enhancing energy efficiency, and simplifying analytical procedures. To comprehensively evaluate the environmental sustainability and practical applicability of the proposed LPME-FLD method, two assessment tools were utilized: the Blue Applicability Grade Index (BAGI) and Analytical GREEnness (AGREE).
The BAGI evaluates ten critical parameters, including the type of analysis, the number of analytes quantified, sample throughput, the nature of the reagents employed, and the level of automation. The results are presented as a blue, asteroid-shaped diagram accompanied by a numerical score ranging from 0 to 100.0, with scores above 75.0 considered high and indicating excellent practical applicability of the method in routine and sustainable analytical applications. In the BAGI diagram, the blue color represents the practical applicability and sustainability of the analytical method, with different shades of blue reflecting the evaluation level of individual parameters: dark blue indicates a high rating and strong contribution, medium blue signifies a satisfactory level, and light blue denotes a low degree of compliance. This visual system allows for quick identification of the method’s strengths and weaknesses. The proposed method attained a score of 80.0, indicating a high degree of practical applicability. In contrast, the AGREE tool is based on the twelve principles of green analytical chemistry and provides an integrated score reflecting the method’s overall environmental friendliness. In the AGREE diagram, the colors represent the degree of compliance with the 12 principles of green analytical chemistry. Green indicates high environmental suitability, orange represents moderate, and red signifies low compliance. The overall score ranges from 0 to 1.0, with a value between 0.75 and 1.0 indicating high environmental suitability, i.e., a so-called “green method” [71,72]. The results from both tools are presented in Figure 10.

2.7. Application to Real Sample Analysis

To assess the method’s applicability in complex matrices, EY was determined in spiked real samples (tap water, Energy drink, and Ice Tea). Each sample was analyzed in five replicates following the established protocol. Recoveries ranged from 95.6% to 104.4%, with relative standard deviations between 0.8% and 1.5%, demonstrating good method accuracy and precision. The results are summarized in Table 3.

3. Materials and Methods

3.1. Materials

All chemicals utilized in the experiments were of analytical grade and were dissolved in distilled water. A 1 × 10⁻³ M stock solution of Eosin Y (Merck, Darmstadt, Germany) was prepared by dissolving 0.065 g of EY in water and diluting to a final volume of 100 mL. Working solutions with concentrations ranging from 1 × 10⁻⁴ to 1 × 10⁻⁶ M were prepared through serial dilution of the stock solution with distilled water. DES extraction mixtures were formulated using tetrabutylammonium bromide (Merck, Darmstadt, Germany) and various alcohols, including hexanol, octanol, and decanol (Merck, Darmstadt, Germany), in different molar ratios. Organic solvents used in the study included tetrachloromethane (Merck, Darmstadt, Germany), n-amyl acetate, hexane, and chloroform (Centralchem, Bratislava, Slovakia), as well as toluene (ITES, Vranov nad Topľou, Slovakia). The pH of the solutions was adjusted with hydrochloric acid (ITES, Vranov nad Topľou, Slovakia), sodium hydroxide (Centralchem, Bratislava, Slovakia), and a buffer solution prepared by mixing 1 M ammonium hydroxide with 1 M acetic acid (both from ITES, Vranov nad Topľou, Slovakia).

Applied Instruments

Fluorescence measurements were carried out using a Shimadzu RF-6000 luminescence spectrophotometer (Kyoto City, Japan) equipped with a High-Precision Cell fluorescence microcuvette (3 × 3 mm) from Hellma Analytics (Müllheim, Germany) and a compatible ultra-micro cell holder from Shimadzu. UV-Vis spectrophotometric measurements were performed using a Specord S600 spectrophotometer (Analytic Jena, Jena, Germany) equipped with a 1 cm quartz microcuvette. For in situ measurements, a standard optical probe from Hellma Analytics was connected to the spectrophotometer. pH measurements were conducted using a 70 Vio portable potentiometric pH meter (XS Instruments, Carpi, Italy). Sample mixing was performed with a Fisherbrand Vortex Stirrer 3000 (Fisher Scientific, Hampton, VA, USA), and phase separation of the organic and aqueous layers was achieved using an MRC BLCEN-208 centrifuge (LabGear, Washington, DC, USA). DES extraction mixtures were prepared using an AREX DIGITAL Heating Magnetic Stirrer (VELP Scientifica, Usmate Velate, Italy).

3.2. Methods

3.2.1. Preparation of DESs

DESs extraction systems were prepared using TBAB and an alcohol (hexanol, octanol, or decanol) in molar ratios of 1:1, 1:2, and 1:3. The mixtures were stirred at 90 °C and 300 rpm using an electric stirrer until clear and homogeneous solutions were obtained. After complete dissolution, the DES systems were allowed to cool to room temperature. Once cooled, the solvents were ready for use.

3.2.2. Sample Preparation

To remove CO2 bubbles, Energy drink and Ice Tea samples were sonicated in an ultrasonic water bath for 10 min. A 1 mL aliquot of each beverage was then taken for analytical determination.

3.2.3. Procedure for the Determination of EY with LPME-FLD

Aliquots of EY ranging from 0.1 to 1.0 mL were dispensed into 15 mL glass centrifuge tubes to obtain final analyte concentrations between 0.1 and 130 µg·L−1. Subsequently, 0.2 mL of a pH 5.0 buffer solution was added, and the total volume was adjusted to 5 mL with distilled water. Then, 500 µL of DES, composed of TBAB and hexanol in a 1:1 molar ratio, was introduced into each tube. The biphasic mixture was vortexed at 3000 rpm for 15 s, forming a turbid emulsion, which was then centrifuged at 1200 rpm for 3 min to achieve phase separation. The DES-enriched phase was carefully aspirated using a micropipette and transferred to a fluorescence microcuvette. Fluorescence measurements were conducted with excitation at 514 nm and emission detected at 546 nm. Quantitative analysis was performed utilizing a calibration curve.

3.2.4. Theoretical Methods and Software

Avogadro software was used to construct the initial geometries of all EY structures. The structures of the DES clusters, as well as those of the organic solvents, were based on our previous study [27]. Geometry optimization, frequency calculations, and thermochemical parameter evaluation were performed using density functional theory (DFT) with the B3LYP functional and the def2-SVP basis set for all atoms; an additional diffuse function was applied to oxygen atoms to improve accuracy [73,74]. Solvation effects, which are critical to this study, were included using the conductor-like polarizable continuum model (CPCM) [75]. Weak dispersion interactions were accounted for using the D3BJ semiempirical correction [76].
Subsequent calculations using the openCOSMO-RS 24a algorithm were carried out with the recommended BP/def2-TZVPD level of theory [77]. The selection of this method was dictated by the parameterization of the openCOS-MO-RS 24a methodology and the developers’ recommendations [77]. All DFT calculations were performed with the ORCA program package [78]. Semiempirical calculations required for Hansen solubility parameter (HSP) predictions were conducted using the MOPAC program with the PM7 method, along with the COSMO solvation model [79,80,81]. Analysis of weak non-covalent interactions was performed using the independent gradient model based on Hirshfeld partitioning (IGMH) and the reduced density gradient (RDG) approach, implemented in the Multiwfn code [82,83,84]. Visualization was carried out using the VMD 1.9.4a53 software [85]. The prediction of pKa values was performed using the Chemicalize platform [86,87].

4. Conclusions

This work successfully developed a novel, environmentally friendly, and highly sensitive analytical method for the determination of the dye Eosin Y. The method is based on vortex-assisted liquid–liquid microextraction using deep eutectic solvents, combined with fluorescence detection (LPME-FLD). The combination of experimental results with theoretical calculations confirmed the high efficiency of the selected extraction systems and provided a detailed insight into the interactions between the analyte and extraction phases. Systematic optimization and comparison of various deep eutectic solvent systems revealed that a 1:1 mixture of tetrabutylammonium bromide and hexanol achieves the highest extraction efficiency. A significant advantage of the eutectic mixture containing TBAB is that, besides its well-known dispersive properties, it also exhibits complex-forming abilities, which substantially enhance the efficiency of EY microextraction compared to any of the individual solvents tested. This synergistic effect was observed by us through both experimental and theoretical approaches, likely for the first time, and helps explain the effectiveness of the investigated systems for EY microextraction.
The most stable forms of EY in aqueous solution and octanol were identified using DFT calculations. Microsolvation of these forms in classical organic solvents and DESs based on TBAB and alcohols was analyzed using the openCOSMO-RS and Hansen solubility models. The results indicated a specific ion association interaction between the anionic forms of EY and TBA+ cations in the DESs, leading to the formation of stable ion pairs. According to both computational models, these ion pairs exhibit high solubility in DESs but negligible solubility in water. These findings account for the experimentally observed extraction efficiency of DESs, particularly under alkaline conditions. Nevertheless, the applied theoretical models do not allow for clearly discriminating the considered DESs in terms of their efficiency, which is due to the very similar electronic structure of the homolog DESs.
The proposed method demonstrated a wide linear range (0.1–130 µg·L−1), a low detection limit (0.028 µg·L−1), and high accuracy with good repeatability. Recoveries ranged from 99.0% to 106.2%, with relative standard deviations (RSD) between 1.1% and 2.7%, confirming its suitability for practical analysis. Moreover, the method adheres to the principles of green analytical chemistry due to its reduced consumption of organic solvents and straightforward sample preparation procedure.
The method was successfully applied to the analysis of real water samples, demonstrating its potential for environmental monitoring and other analytical applications. Given its advantages, the proposed approach provides an efficient and sustainable method for determining Eosin Y in various matrices.

Supplementary Materials

The following supporting information can be downloaded at: https://www.mdpi.com/article/10.3390/molecules30163334/s1, Figure S1: Predicted microspecies of EY. (a) Microspecies of lactone structures; (b) microspecies of pyrylium cation structures; (c) microspecies of quinoid structures; Table S1: Mayer bond orders of structures N-ZO/N-LC in water and octanol. The atom numbering of the structure is presented in the figure; Figure S2: Independent gradient model on Hirshfeld partition (IGMH) and reduced density gradient (RDG) for A-C+ form with TBA+ counter cation (a,b) and D-C+ form with two TBA+ counter cations (c, d). Bright blue areas correspond to strong electrostatic attraction (similar to hydrogen bonds); green areas correspond to weak van der Waals attractions; red areas correspond to electron repulsion, which is typical for centers of the cyclic systems; Figure S3: Influence of pH on extraction of EY. c (EY) = 2 × 10⁻⁷ M; DES volume = 500 µL; Figure S4: Influence of common interfering substances on the determination of EY. c (EY) = 1.2 × 10⁻⁷ M; pH 5.0; DES volume = 500 µL.

Author Contributions

S.K.: investigation, writing—original draft, and writing—review and editing. Y.B.: conceptualization, validation, resources, writing—original draft, writing—review and editing, and supervision. M.D.: investigation. M.F.: investigation, writing—original draft, and writing—review and editing. All authors have read and agreed to the published version of the manuscript.

Funding

This research was funded by VEGA grant number 1/0177/23.

Acknowledgments

Yaroslav Bazeľ and Sofia Kakalejčíková thank the Scientific Grant Agency VEGA of the Ministry of Education, Research, Development and Youth of the Slovak Republic and the Slovak Academy of Sciences for their support (Grant no. 1/0177/23).

Conflicts of Interest

The authors Sofia Kakalejčíková, Yaroslav Bazeľ, Mária Drábiková, and Maksym Fizer declare that they have no known competing financial interests or personal relationships that could have appeared to influence the work reported in this paper.

References

  1. Ferreira, S.C.R.; Oliveira, M.C.; Pais, A.A.C.C.; Seixas De Melo, J.S. Shades of red: A chemical exploration of pigments and dyes in 19th century postage stamps by a multi-analytical mehodology. Talanta 2025, 285, 127409. [Google Scholar] [CrossRef]
  2. Kar, S.; Kumar, H.; Sangamesh, N.C.; Mishra, S.; Bajoria, A.A.; Saha, M. Safe food coloring agent as an alternative to Eosin stain. Cureus 2024, 16, e69817. [Google Scholar] [CrossRef] [PubMed]
  3. Dhasarathan, R.; Kavitha, B.; Aswathaman, H.; Senthilkumar, N.; Rani, S. Electrochemical sensors of food colorant—Eosin Y dye on carbon nanomaterials modified glassy carbon electrode. Mater. Today Proc. 2022, 48, 556–560. [Google Scholar] [CrossRef]
  4. Staneva, D.; Yordanova, S.; Vasileva-Tonkova, E.; Stoyanov, S.; Grabchev, I. Photophysical and antibacterial activity of light-activated quaternary eosin Y. Open Chem. 2019, 17, 1244–1251. [Google Scholar] [CrossRef]
  5. Gao, D.; Tian, Y.; Liang, F.; Jin, D.; Chen, Y.; Zhang, H.; Yu, A. Investigation on the pH-dependent binding of Eosin Y and bovine serum albumin by spectral methods. J. Lumin. 2007, 127, 515–522. [Google Scholar] [CrossRef]
  6. Sobika, M.; Karunanithi, S.; Dash, S. Studies on anionic dye Eosin Y in mixed anionic micellar medium. Results Chem. 2024, 7, 101220. [Google Scholar] [CrossRef]
  7. Al-Behadili, W.K.H.; Jawad, Y.M.; Whaab, W.S.A. Effect of solvent on intensity of absorption and fluorescence of Eosin Y dye and spectral properties of Eosin Y dye. J. Med. Chem. Sci. 2023, 6, 322–334. [Google Scholar] [CrossRef]
  8. Abbas, F.S.; Alaboodi, A.S.; Abojassim, A.A. Studying the effect of the solvent on the spectral properties of the Eosin-y Dye that used as medical laser medium. Cardiometry 2023, 25, 1463–1467. [Google Scholar] [CrossRef]
  9. de Freitas, C.F.; Estevao, B.M.; Pellosi, D.S.; Scarminio, I.S.; Caetano, W.; Hioka, N.; Batistela, V.R. Chemical equilibria of Eosin Y and its synthetic ester derivatives in non-ionic and ionic micellar environments. J. Mol. Liq. 2020, 327, 114794. [Google Scholar] [CrossRef]
  10. Vodolazkaya, N.A.; Kleshchevnikova, Y.A.; Mchedlov-Petrossyan, N.O. Differentiating impact of the AOT-stabilized droplets of water-in-octane microemulsions as examined using halogenated fluoresceins as molecular probes. J. Mol. Liq. 2013, 187, 381–388. [Google Scholar] [CrossRef]
  11. Erdinc, N.; Goktürk, S. Spectrophotometric and conductometric studies on the interaction of anionic dye Eosin-Y with cationic micelles. Anal. Chem. Lett. 2014, 4, 146–157. [Google Scholar] [CrossRef]
  12. Wang, J.; Chen, L.; Li, Y.; Shen, W.; Manley-Harris, M. A novel determination method for Ag(I) in environmental samples based on reduction of absorbance and fluorescence quenching of Eosin Y. Microchem. J. 2024, 196, 109588. [Google Scholar] [CrossRef]
  13. Saeed, M.A.; Mostafa, N.S.; Mahmoud, A.M.; Elsayed, M.A. Application of Eosin Y as a probe for spectroscopic determination of Aripiprazole in human plasma. Luminescence 2025, 40, e70131. [Google Scholar] [CrossRef]
  14. Abdel-Lateef, M.A.; Almahri, A.; Derayea, S.M.; Samir, E. Xanthene based resonance Rayleigh scattering and spectrofluorimetric probes for the determination of cyclobenzaprine: Application to content uniformity test. Rev. Anal. Chem. 2020, 9, 222–230. [Google Scholar] [CrossRef]
  15. Salim, M.M.; Marie, A.A.; Kamal, A.H.; Hammad, S.F.; Elkhoudary, M.M. Using of eosin Y as a facile fluorescence probe in alogliptin estimation: Application to tablet dosage forms and content uniformity testing. Spectrochim. Acta A Mol. Biomol. Spectrosc. 2023, 285, 121919. [Google Scholar] [CrossRef] [PubMed]
  16. Mahnashi, M.H.; Mahmoud, A.M.; El-Wekil, M.M.; Shahin, R.Y. An innovative enzyme-free ratiometric determination of uric acid based on polyethyleneimine modified graphene quantum dots pretreated with periodate combined with eosin Y. Microchem. J. 2023, 193, 109062. [Google Scholar] [CrossRef]
  17. Nandhini, N.T.; Rajeshkumar, S.; Mythili, S. The possible mechanism of eco-friendly synthesized nanoparticles on hazardous dyes degradation. Biocatal. Agric. Biotechnol. 2019, 19, 101138. [Google Scholar] [CrossRef]
  18. Pierau, L.; Andaloussi, S.A.; Chiappone, A.; Lajnef, S.; Peyrot, F.; Malval, J.-P.; Jockusch, S.; Versace, D.-L. Eosin Y derivatives for visible light-mediated free-radical polymerization: Application in 3D-photoprinting and bacterial photodynamic inactiva-tion. Eur. Polym. J. 2024, 214, 113143. [Google Scholar] [CrossRef]
  19. Nagar, B.; Dhar, B.B. Visible light-mediated thiolation of substituted 1,4-naphthoquinones using Eosin Y as a photoredox catalyst. J. Org. Chem. 2022, 87, 3195–3201. [Google Scholar] [CrossRef]
  20. Derayea, S.M.; Nagy, D.M. Application of a xanthene dye, eosin Y, as spectroscopic probe in chemical and pharmaceutical analysis; a review. Rev. Anal. Chem. 2018, 37, 20170020. [Google Scholar] [CrossRef]
  21. Alghamdi, A.F.; Kooli, F. A sensitive procedure for the rapid electrochemical determination of Eosin-Y dye using voltammetric techniques onto a mercury electrode surface. J. Mater. Environ. Sci. 2013, 4, 762–769. [Google Scholar]
  22. Brumley, W.C.; Farley, J.W. Determining eosin as a groundwater migration tracer by capillary electrophoresis/laser-induced fluorescence using a multiwavelength laser. Electrophoresis 2003, 24, 2335–2339. [Google Scholar] [CrossRef] [PubMed]
  23. Narayanan, V.A.; Stokes, D.L.; Vo-Dinh, T. Vibrational spectral analysis of Eosin Y and Erythrosin B—Intensity studies for quantitative detection of the dyes. J. Raman Spectrosc. 1994, 25, 415–422. [Google Scholar] [CrossRef]
  24. Kaur, A.; Gupta, U. H-Point standard addition method for simultaneous determination of Eosin and Erytrosine. E-J. Chem. 2011, 8, 1979–1985. [Google Scholar] [CrossRef]
  25. Van Liedekerke, B.M.; Nelis, H.J.; Wittekind, D.H.; De Leenheer, A.P. Stability study of Azure B, Eosin Y and commercial Romanowsky Giemsa stock solutions using high performance liquid chromatography. Histochem. J. 1991, 23, 189–195. [Google Scholar] [CrossRef] [PubMed]
  26. Sabatini, F.; Degano, I.; Colombini, M.P. Development of a method based on high-performance liquid chromatography coupled with diode array, fluorescence, and mass spectrometric detectors for the analysis of eosin at trace levels. Sep. Sci. Plus 2020, 3, 207–215. [Google Scholar] [CrossRef]
  27. Kakalejčíková, S.; Bazel’, Y.; Thi, V.A.L.; Fizer, M. An innovative vortex-assisted liquid-liquid microextraction approach using deep eutectic solvent: Application for the spectrofluorometric determination of Rhodamine B in water, food and cosmetic samples. Molecules 2024, 29, 3397. [Google Scholar] [CrossRef]
  28. Kakalejčíková, S.; Harenčár, D.; Bazel’, Y.; Fizer, M. Fluorescence-based detection of Picric acid using vortex-assisted liquid–liquid microextraction: An innovative analytical approach. Processes 2025, 13, 1051. [Google Scholar] [CrossRef]
  29. Fizer, O.; Fizer, M.; Sidey, V.; Studenyak, Y. Predicting the end point potential break values: A case of potentiometric titration of lipophilic anions with cetylpyridinium chloride. Microchem. J. 2021, 160, 105758. [Google Scholar] [CrossRef]
  30. Fizer, O.; Fizer, M.; Sidey, V.; Studenyak, Y.; Mariychuk, R. Benchmark of different charges for prediction of the partitioning coefficient through the hydrophilic/lipophilic index. J. Mol. Model. 2018, 24, 141. [Google Scholar] [CrossRef]
  31. Das, T.; Mehta, C.H.; Nayak, U.Y. Multiple approaches for achieving drug solubility: An in silico perspective. Drug Discov. Today 2020, 25, 1206–1212. [Google Scholar] [CrossRef]
  32. Atiq, O.; Ricci, E.; Giacinti Baschetti, M.; Grazia De Angelis, M. Modelling solubility in semi-crystalline polymers: A critical comparative review. Fluid Phase Equilib. 2022, 556, 113412. [Google Scholar] [CrossRef]
  33. Klamt, A. The COSMO and COSMO-RS solvation models. Wiley Interdiscip. Rev. Comput. Mol. Sci. 2018, 8, e1338. [Google Scholar] [CrossRef]
  34. Khan, A.S.; Ibrahim, T.H.; Rashid, Z.; Khamis, M.I.; Nancarrow, P.; Jabbar, N.A. COSMO-RS based screening of ionic liquids for extraction of phenolic compounds from aqueous media. J. Mol. Liq. 2021, 328, 115387. [Google Scholar] [CrossRef]
  35. Wojeicchowski, J.P.; Ferreira, A.M.; Abranches, D.O.; Mafra, M.R.; Coutinho, J.A.P. Using COSMO-RS in the design of deep eutectic solvents for the extraction of antioxidants from Rosemary. ACS Sustain. Chem. Eng. 2020, 8, 12132–12141. [Google Scholar] [CrossRef]
  36. Darwish, A.S.; Lemaoui, T.; Al Yammahi, J.; Taher, H.; Benguerba, Y.; Banat, F.; Al Nashef, I.M. Molecular insights into potential hydrophobic deep eutectic solvents for furfural extraction guided by COSMO-RS and machine learning. J. Mol. Liq. 2023, 379, 121631. [Google Scholar] [CrossRef]
  37. Roslan, R.; Kurnia, K.A.; Hasanudin, N.; Hilmy, N.I.M.F.; Ruslan, M.S.H. Screen and design of deep eutectic solvents (DESs) for the extraction of delphinidin-3-sambubioside from Hibiscus sabdariffa via COSMO-RS. AIP Conf. Proc. 2024, 3041, 050003. [Google Scholar] [CrossRef]
  38. Lazović, M.; Cvijetić, I.; Jankov, M.; Milojković-Opsenica, D.; Trifković, J.; Ristivojević, P. COSMO-RS in prescreening of Natural Eutectic Solvents for phenolic extraction from Teucrium chamaedrys. J. Mol. Liq. 2023, 387, 122649. [Google Scholar] [CrossRef]
  39. Hansen, C.M. Solubility Parameters—An Introduction in Hansen Solubility Parameters. In A User’s Handbook, 2nd ed.; CRC Press: Boca Raton, FL, USA, 2007; pp. 1–26. [Google Scholar] [CrossRef]
  40. Otárola-Sepúlveda, J.; Cea-Klapp, E.; Aravena, P.; Ormazábal-Latorre, S.; Canales, R.I.; Garrido, J.M.; Valerio, O. Assessment of Hansen solubility parameters in deep eutectic solvents for solubility predictions. J. Mol. Liq. 2023, 388, 122669. [Google Scholar] [CrossRef]
  41. Fernandes, C.C.; Paiva, A.; Haghbakhsh, R.; Duarte, A.R.C. Application of Hansen solubility parameters in the eutectic mixtures: Difference between empirical and semi-empirical models. Sci. Rep. 2025, 15, 3862. [Google Scholar] [CrossRef]
  42. Fernandes, C.C.; Paiva, A.; Haghbakhsh, R.; Duarte, A.R.C. Understanding the solubility behaviour of Ibuprofen and Xylitol in natural deep eutectic systems through Hansen solubility parameters and physicochemical properties. J. Mol. Liq. 2025, 428, 127544. [Google Scholar] [CrossRef]
  43. Moreira Novaes, F.J.; de Faria, D.C.; Zamboni Ferraz, F.; de Aquino Neto, F.R. Hansen solubility parameters applied to the extraction of phytochemicals. Plants 2023, 12, 3008. [Google Scholar] [CrossRef] [PubMed]
  44. Batistela, V.R.; Pellosi, D.S.; de Souza, F.D.; da Costa, W.F.; de Oliveira Santin, S.M.; de Souza, V.R.; Caetano, W.; de Oliveira, H.P.M.; Scarminio, I.S.; Hioka, N. pKa determinations of xanthene derivates in aqueous solutions by multivariate analysis applied to UV–Vis spectrophotometric data. Spectrochim. Acta A Mol. Biomol. Spectrosc. 2011, 79, 889–897. [Google Scholar] [CrossRef] [PubMed]
  45. Levillain, P.; Fompeydie, D. Determination of equilibrium constants by derivative spectrophotometry. Application to the pKas of eosin. Anal. Chem. 1985, 57, 2561–2563. [Google Scholar] [CrossRef]
  46. Mchedlov-Petrossyan, N.O.; Kukhtik, V.I.; Egorova, S.I. Protolytic equilibria of Fluorescein halo derivatives in aqueous-organic systems. Russ. J. Gen. Chem. 2006, 76, 1607–1617. [Google Scholar] [CrossRef]
  47. Tamburello-Luca, A.A.; Hébert, P.; Antoine, R.; Brevet, P.F.; Girault, H.H. Optical surface second harmonic generation study of the two Acid/Base equilibria of Eosin B at the Air/Water interface. Langmuir 1997, 13, 4428–4434. [Google Scholar] [CrossRef]
  48. Vodolazkaya, N.A.; Gurina, Y.A.; Salamanova, N.V.; Mchedlov-Petrossyan, N.O. Spectroscopic study of acid–base ionization and tautomerism of fluorescein dyes in direct microemulsions at high bulk ionic strength. J. Mol. Liq. 2009, 145, 188–196. [Google Scholar] [CrossRef]
  49. Amat-Guerri, F.; López-González, M.M.C.; Sastre, R.; Martinez-Utrilla, R. Spectrophotometric determination of ionization and isomerization constants of Rose Bengal, eosin Y and some derivatives. Dye. Pigm. 1990, 13, 219–232. [Google Scholar] [CrossRef]
  50. Slyusareva, E.A.; Gerasimova, M.A. pH-dependence of the absorption and fluorescent properties of fluorone dyes in aqueous solutions. Russ. Phys. J. 2014, 56, 1370–1377. [Google Scholar] [CrossRef]
  51. Tóth, J.; Bazel, Y.; Balogh, I. A fully automated system with an optical immersion probe (OIP) for high-precision spectropho-tometric measurements. Talanta 2021, 226, 122185. [Google Scholar] [CrossRef]
  52. Kathiravan, V.A.; Jhonsi, M.A.; Renganathan, R. A Study on the fluorescence quenching of Eosin by certain organic dyes. Z. Phys. Chem. 2008, 222, 1013–1020. [Google Scholar] [CrossRef]
  53. Bedair, A.; Mansour, F. Homogeneous Liquid–Liquid Microextraction. In Microextraction Techniques: Fundamentals, Applications and Recent Developments; Springer: Cham, Switzerland, 2024; pp. 315–355. [Google Scholar] [CrossRef]
  54. Yamini, Y.; Rezazadeh, M.; Seidi, S. Liquid-phase microextraction—The different principles and configurations. Trends Anal. Chem. 2019, 112, 264–272. [Google Scholar] [CrossRef]
  55. Kakalejčíková, S.; Bazeľ, Y. A combination of vortex-assisted liquid–liquid microextraction with fluorescence detection: An innovative approach for a green and highly sensitive determination of sodium dodecyl sulfate in water samples and pharmaceutical. Microchem. J. 2024, 199, 110226. [Google Scholar] [CrossRef]
  56. Kunz, W.; Häckl, K. The hype with ionic liquids as solvents. Chem. Phys. Lett. 2016, 661, 6–12. [Google Scholar] [CrossRef]
  57. Bazel, Y.; Rečlo, M.; Chubirka, Y. Switchable hydrophilicity solvents in analytical chemistry. Five years of achievements. Microchem. J. 2020, 157, 105115. [Google Scholar] [CrossRef]
  58. Alshana, U.; Hassan, M.; Al-Nidawi, M.; Yilmaz, E.; Soylak, M. Switchable-hydrophilicity solvent liquid-liquid microextraction, Trends Anal. Chem. 2020, 131, 116025. [Google Scholar] [CrossRef]
  59. Andruch, V.; Kalyniukova, A.; Płotka-Wasylka, J.; Jatkowska, N.; Snigur, D.; Zaruba, S.; Płatkiewicz, J.; Zgoła-Grześkowiak, A.; Werner, J. Application of deep eutectic solvents in analytical sample pretreatment (update 2017–2022). Part A: Liquid phase microextraction. Microchem. J. 2023, 189, 108509. [Google Scholar] [CrossRef]
  60. Santana-Mayor, Á.; Rodríguez-Ramos, R.; Herrera-Herrera, A.V.; Socas-Rodríguez, B.; Rodríguez-Delgado, M.Á. Deep eutectic solvents. The new generation of green solvents in analytical chemistry. Trends Anal. Chem. 2021, 134, 116108. [Google Scholar] [CrossRef]
  61. Ramezani, A.M.; Ahmadi, R.; Yamini, Y. Homogeneous liquid-liquid microextraction based on deep eutectic solvents. Trends Anal. Chem. 2022, 149, 116566. [Google Scholar] [CrossRef]
  62. Smith, E.L.; Abbott, A.P.; Ryder, K.S. Deep eutectic solvents (DESs) and their application. Chem. Rev. 2014, 114, 11060–11082. [Google Scholar] [CrossRef]
  63. Alshana, U.; Soylak, M. Deep eutectic solvents in microextraction. In Analytical Sample Preparation with Nano- and Other High-Performance Materials; Elsevier: Amsterdam, The Netherlands, 2021; pp. 471–512. [Google Scholar] [CrossRef]
  64. De los Ríos, M.D.; Belmonte, R.M. Extending Microsoft excel and Hansen solubility parameters relationship to double Hansen’s sphere calculation. SN Appl. Sci. 2022, 4, 185. [Google Scholar] [CrossRef]
  65. Mchedlov-Petrossyan, N.O.; Kleshchevnikova, V.N. Influence of the cetyltrimethylammonium chloride micellar pseudophase on the protolytic equilibria of oxyxanthene dyes at high bulk phase ionic strength. J. Chem. Soc. Faraday Trans. 1994, 90, 629–640. [Google Scholar] [CrossRef]
  66. Vilková, M.; Płotka-Wasylka, J.; Andruch, V. The role of water in deep eutectic solvent-base extraction. J. Mol. Liq. 2020, 304, 112747. [Google Scholar] [CrossRef]
  67. Shishov, A.; Chromá, R.; Vakh, C.; Kuchár, J.; Simon, A.; Andruch, V.; Bulatov, A. In situ decomposition of deep eutectic solvent as a novel approach in liquid-liquid microextraction. Anal. Chim. Acta 2019, 1065, 49–55. [Google Scholar] [CrossRef]
  68. Shishov, A.; Makoś-Chełstowska, P.; Bulatov, A.; Andruch, V. Deep eutectic solvents or eutectic mixtures? Characterization of tetrabutylammonium bromide and nonanoic acid mixtures. J. Phys. Chem. B 2022, 126, 3889–3896. [Google Scholar] [CrossRef]
  69. Namlı, H.; Bişgin, A.T. Simultaneous deep eutectic solvent based microextraction for monitoring Brilliant blue and rhodamine B in foodstuff and industrial samples. J. Food Compos. Anal. 2024, 127, 105980. [Google Scholar] [CrossRef]
  70. Soylak, M.; Uzcan, F.; Goktas, O. Ultrasound-assisted quasi-hydrophobic deep eutectic solvent-based determination of trace Rhodamine B in water and food samples: A simple and green approach. J. Food Compos. Anal. 2023, 120, 105287. [Google Scholar] [CrossRef]
  71. Pena-Pereira, F.; Wojnowski, W.; Tobiszewski, M. AGREE—Analytical GREEnness Metric approach and software. Anal. Chem. 2020, 92, 10076–10082. [Google Scholar] [CrossRef]
  72. Manousi, N.; Wojnowski, W.; Płotka-Wasylka, J.; Samanidou, V. Blue applicability grade index (BAGI) and software: A new tool for the evaluation of method practicality. Green Chem. 2023, 25, 7598–7604. [Google Scholar] [CrossRef]
  73. Becke, A.D. Density-functional thermochemistry. III. The role of exact exchange. J. Chem. Phys. 1993, 98, 5648–5652. [Google Scholar] [CrossRef]
  74. Weigend, F.; Ahlrichs, R. Balanced basis sets of split valence, triple zeta valence and quadruple zeta valence quality for H to Rn: Design and assessment of accuracy. Phys. Chem. Chem. Phys. 2005, 7, 3297–3305. [Google Scholar] [CrossRef]
  75. Garcia-Ratés, M.; Neese, F. Efficient implementation of the analytical second derivatives of Hartree-Fock and hybrid DFT energies within the framework of the conductor-like polarizable continuum model. J. Comput. Chem. 2019, 40, 1816–1828. [Google Scholar] [CrossRef] [PubMed]
  76. Grimme, S.; Ehrlich, S.; Goerigk, L. Effect of the damping function in dispersion corrected density functional theory. J. Comput. Chem. 2011, 32, 1456–1465. [Google Scholar] [CrossRef] [PubMed]
  77. Müller, S.; Nevolianis, T.; Garcia-Ratés, M.; Riplinger, C.; Leonhard, K.; Smirnova, I. Predicting solvation free energies for neutral molecules in any solvent with openCOSMO-RS. Fluid Phase Equilib. 2025, 589, 114250. [Google Scholar] [CrossRef]
  78. Neese, F. Software update: The ORCA program system-Version 5.0. Wiley Interdiscip. Rev. Comput. Mol. Sci. 2022, 12, e1606. [Google Scholar] [CrossRef]
  79. Stewart, J.J.P. MOPAC: A semiempirical molecular orbital program. J. Comput. Aided Mol. Des. 1990, 4, 1–103. [Google Scholar] [CrossRef]
  80. Stewart, J.J.P. Optimization of parameters for semiempirical methods VI: More modifications to the NDDO approximations and re-optimization of parameters. J. Mol. Model. 2013, 19, 1–32. [Google Scholar] [CrossRef]
  81. Klamt, A.; Schüürmann, G. COSMO: A New approach to dielectric screening in solvents with explicit expressions for the screening energy and its gradient. J. Chem. Soc. Perkin Trans. 1993, 2, 799–805. [Google Scholar] [CrossRef]
  82. Lu, T.; Chen, Q. Independent gradient model based on Hirshfeld partition (IGMH): A new method for visual study of interactions in chemical systems. J. Comput. Chem. 2022, 43, 539–555. [Google Scholar] [CrossRef]
  83. Johnson, E.R.; Keinan, S.; Mori-Sanchez, P.; Contreras-Garcia, J.; Cohen, A.J.; Yang, W. Revealing noncovalent interactions. J. Am. Chem. Soc. 2010, 132, 6498–6506. [Google Scholar] [CrossRef]
  84. Lu, T. A comprehensive electron wavefunction analysis toolbox for chemists, Multiwfn. J. Chem. Phys. 2024, 161, 082503. [Google Scholar] [CrossRef]
  85. Humphrey, W.; Dalke, A.; Schulten, K. VMD—Visual molecular dynamics. J. Mol. Graph. 1996, 14, 33–38. [Google Scholar] [CrossRef]
  86. Chemaxon. Available online: https://chemaxon.com/blog/publication/predicted-pka-and-solubility-values-0 (accessed on 20 June 2025).
  87. Chemicalize. Available online: https://chemicalize.com (accessed on 20 June 2025).
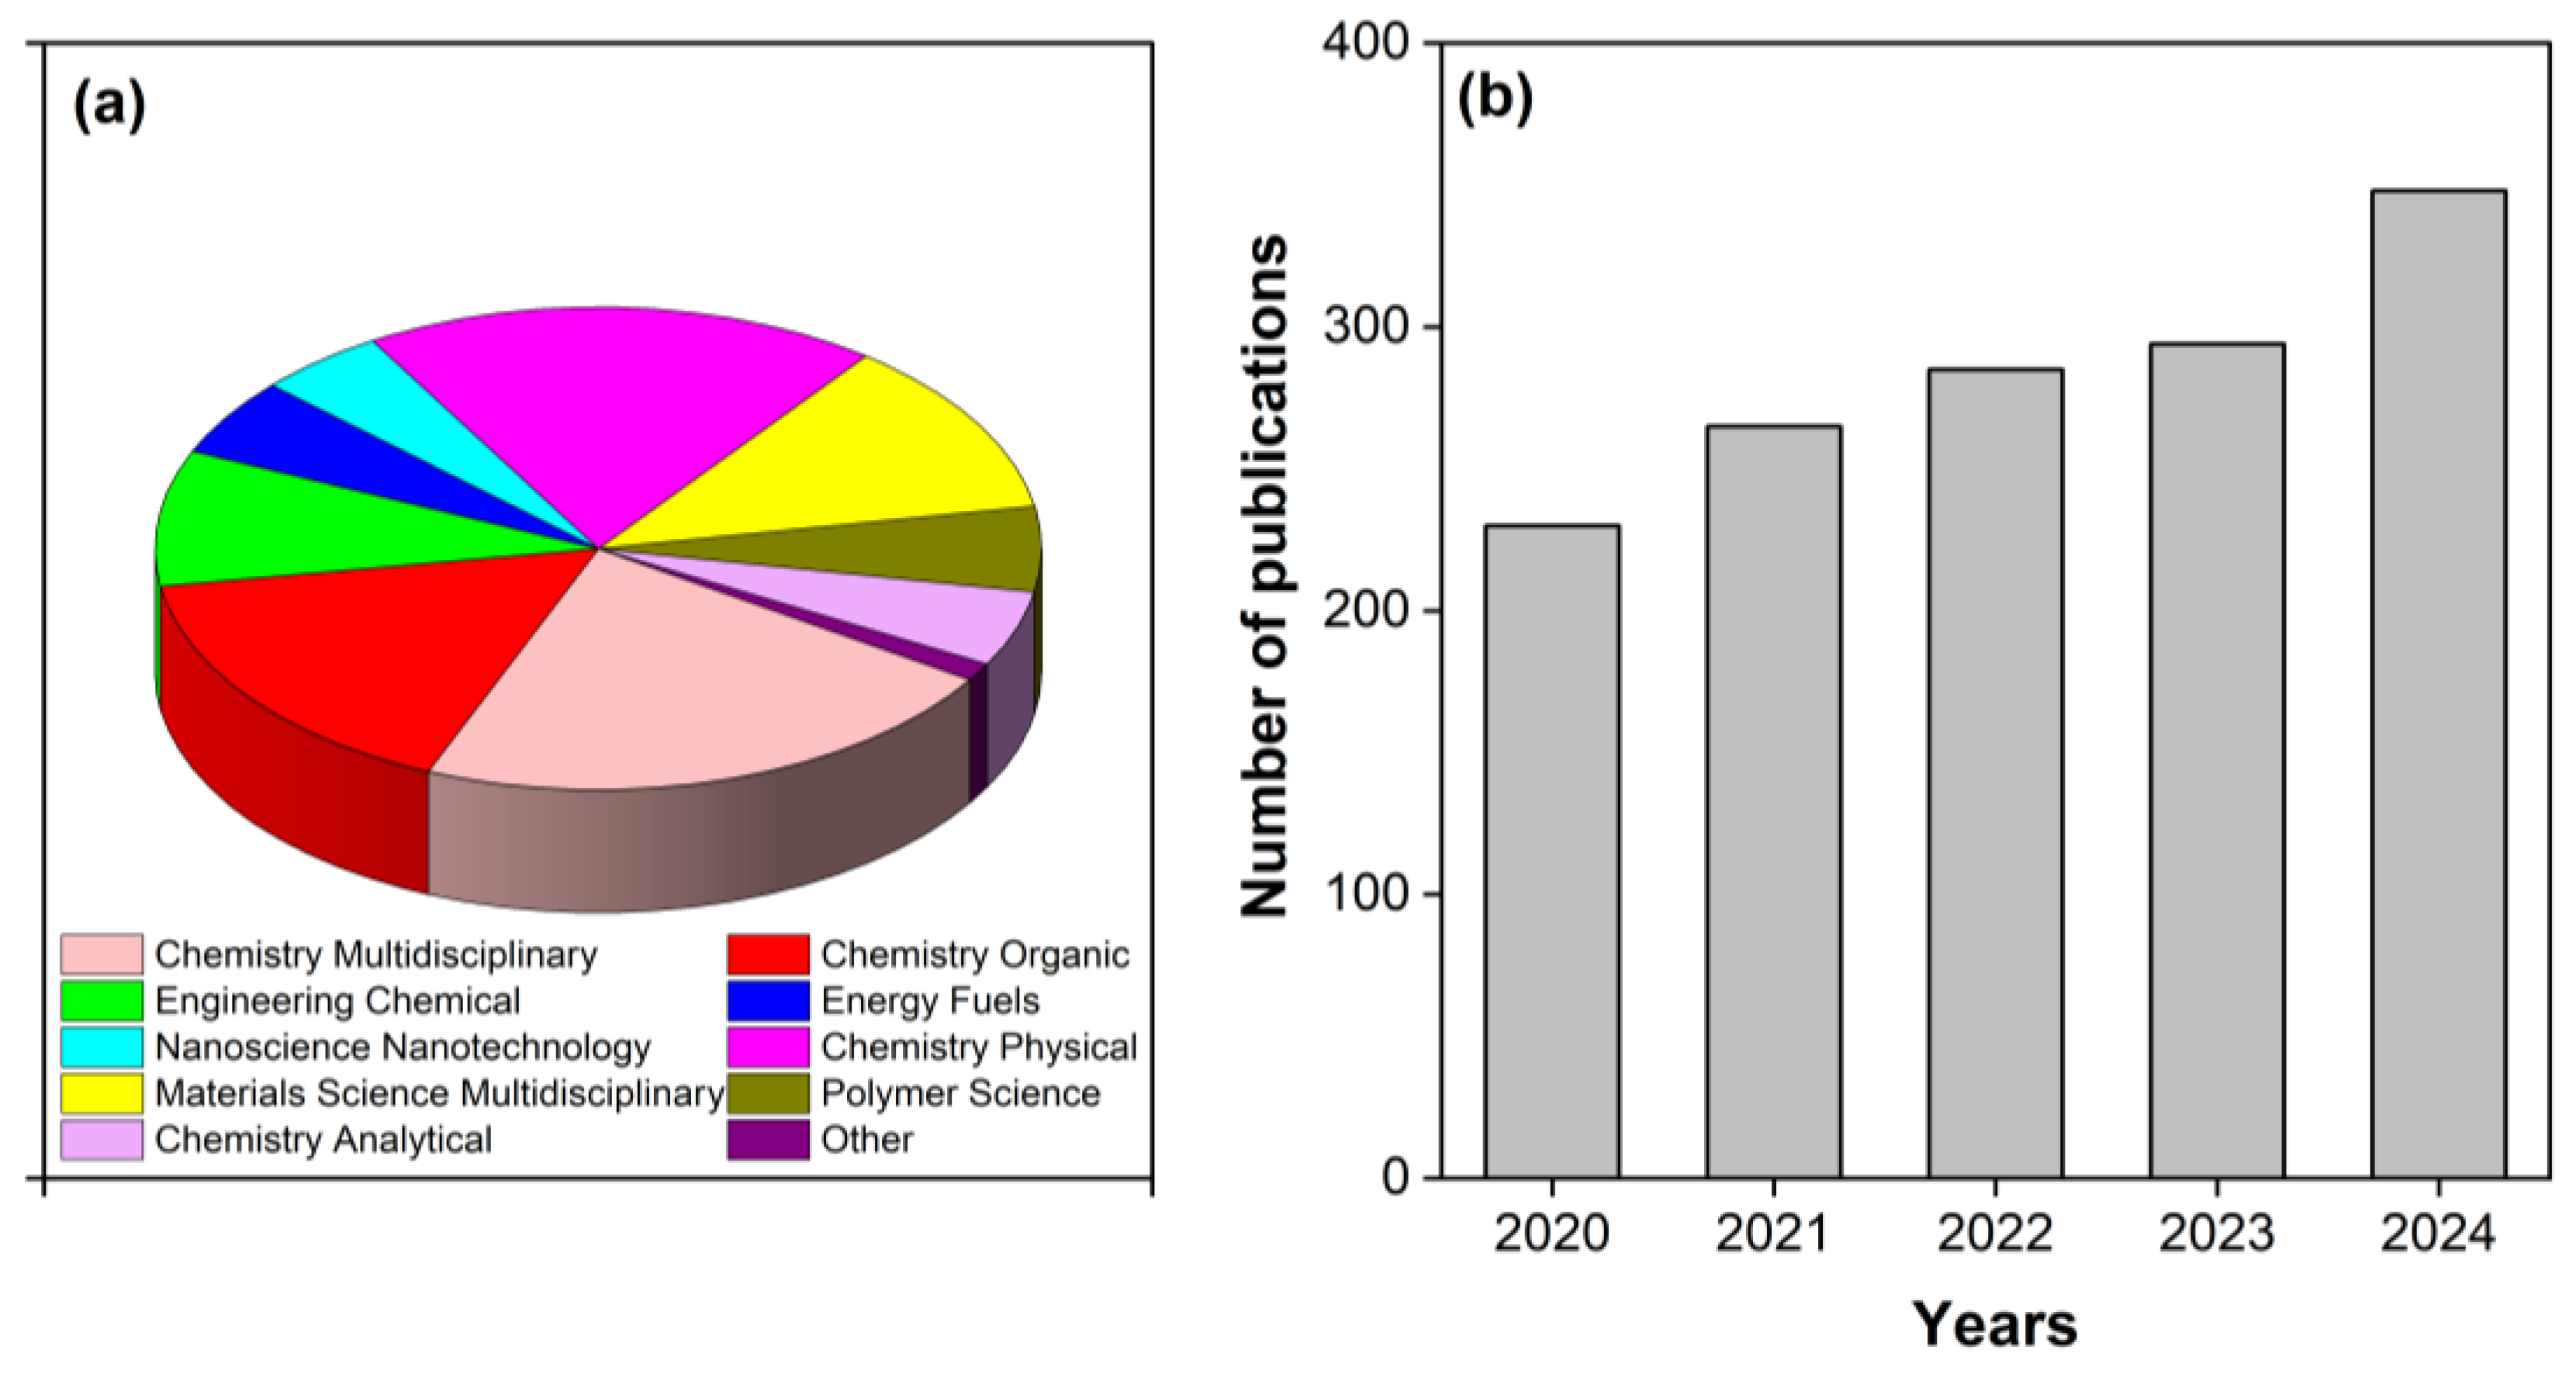
Figure 1. Scientific fields (a) and number of publications (b) with the keyword “Eosin Y” in the Web of Science database.
Molecules 30 03334 g001
Figure 2. Influence of pH on absorbance (a,b). c (EY) = 1.0 × 10⁻⁵ M.
Molecules 30 03334 g002
Figure 3. Excitation (1) and emission (2) spectra of a 1.0 × 10⁻⁵ M aqueous solution of the dye EY (a) and the calibration dependence of fluorescence intensity on the concentration of EY solutions (b).
Molecules 30 03334 g003
Figure 4. The structures of EY considered in this study. (a) Monocationic structures H-P, H-C, and H-L; (b) structures with the overall charge equal to 0: zwitterionic N-ZC and N-ZO and neutral N-LC and N-L; (c) monoanions A-C and A-O; and (d) dianions D-C and D-O. The most stable forms are highlighted in red, and also less stable but still plausible are highlighted in grey. The least possible structures are not highlighted.
Molecules 30 03334 g004
Figure 5. Screening charge distribution over the DES clusters: (a) DES cluster of TBAB-butanol; (b) DES cluster of TBAB-hexanol; (c) DES cluster of TBAB-heptanol; (d) DES cluster of TBAB-octanol; (e) DES cluster of TBAB-decanol; and (f) σ-profiles of the DES clusters mentioned in subsections a–e; screening charge distribution over the forms of EY: (g) cationic H-C form; (h) neutral N-LC; (i) neutral N-L; (j) anionic A-C; (k) dianionic D-C; and (l) σ-profiles of the EY forms mentioned in subsections (gk).
Molecules 30 03334 g005
Figure 6. Solvation Gibbs free energies of five forms of EY (cation H-C, neutral open form N-LC, neutral lactone form N-L, monoanionic form A-C, dianionic form D-C, monoanionic form A-C+ with counter-ion included, and dianionic form D-C+ with counter-ion included) for DESs: TBAB and butanol (DES-C4), hexanol (DES-C6), heptanol (DES-C7), octanol (DES-C8), decanol (DES-C10), and selected solvents: amyl acetate (AmAc), chloroform, octanol, tetrachloromethane (TCM), toluene, and water.
Molecules 30 03334 g006
Figure 7. Hansen’s spheres determined for H-C with Br counter anion (a), N-LC (b), N-L (c), A-C+ with a Na+ counter cation (d), D-C+ with two Na+ counter cations (e), A-C+ with a TBA+ counter cation (f), D-C+ with two TBA+ counter cations (g). The red color of the sphere highlights a very high value of R0 = 35 MPa0.5, the green color of the sphere represents moderate values of R0 = 15 MPa0.5, and the blue color of the sphere corresponds to a low value of R0 (~8 MPa0.5). Green stars correspond to DESs, golden cubes represent classical organic solvents (COSs), the blue dot corresponds to water, and the purple dot in the center of a sphere corresponds to the considered form of EY.
Molecules 30 03334 g007
Figure 8. Impact of organic solvents on the fluorescent signal. c (EY) = 2 × 10⁻⁷ M; Extraction solvents = 500 µL.
Molecules 30 03334 g008
Figure 9. Fluorescence emission spectra and corresponding calibration curve of EY at various concentrations. pH 5.0; DES volume = 500 µL.
Molecules 30 03334 g009
Figure 10. Evaluation of the environmental sustainability of the proposed method using BAGI and AGREE tools.
Molecules 30 03334 g010
Table 1. The relative Gibbs free energies (G, in kcal/mol) and mole fractions (p, in %) of the neutral, monocationic, and dicationic species in a water solution. The dielectric constant is 80, and the pH influence is neglected.
H-CH-PH-LN-ZCN-ZO/N-LCN-LA-CA-OD-CD-O
water
ΔG, kcal/mol0.050.546.312.80.90.00.01.70.08.8
p, % 1000.00.00.018.181.994.45.61000.0
octanol
ΔG, kcal/mol0.051.947.615.01.60.00.07.40.08.7
p, % 1000.00.00.06.793.31000.01000.0
Table 2. Evaluation of method precision and accuracy for EY determination in model samples (n = 5, p = 0.95).
EY Added, µg L−1Intra-DayInter-Day
EY determined, µg L−1RSD, %Recovery, %EY determined, µg L−1RSD, %Recovery, %
38.938.5 ± 1.32.799.041.3 ± 0.71.3106.2
77.782.5 ± 1.31.3106.281.0 ± 1.11.1104.2
Table 3. Determination of EY in real water samples (n = 5, p = 0.95).
EY Concentration, µg L−1
SamplesAddedFoundRSD, %Recovery, %
Tap water-≤LOQ--
38.938.1 ± 0.71.497.9
77.774.3 ± 1.11.295.6
Energy drink-≤LOQ--
38.940.6 ± 0.71.5104.4
77.778.3 ± 1.31.3100.8
Ice Tea-≤LOQ--
38.938.8 ± 0.81.799.7
77.776.5 ± 0.80.898.5
Disclaimer/Publisher’s Note: The statements, opinions and data contained in all publications are solely those of the individual author(s) and contributor(s) and not of MDPI and/or the editor(s). MDPI and/or the editor(s) disclaim responsibility for any injury to people or property resulting from any ideas, methods, instructions or products referred to in the content.