Article

Exometabolome and Molecular Signatures Associated with HPV 16 in Cervical Cancer: Integrative Metabolomic and Transcriptomic Analysis for Biomarker Discovery

by
Adán Arizmendi-Izazaga
1,
Napoleón Navarro-Tito
2,
Gabriela Elizabeth Campos-Viguri
3,
Hilda Jiménez-Wences
1,4,5,
Macdiel Emilio Acevedo-Quiroz
6,
Eric Genaro Salmerón-Bárcenas
7,
Berenice Illades-Aguiar
8,
Marco Antonio Leyva-Vázquez
8 and
Julio Ortiz-Ortiz
1,*
1
Laboratorio de Investigación en Metabolismo y Cáncer, Facultad de Ciencias Químico Biológicas, Universidad Autónoma de Guerrero, Av. Lázaro Cárdenas S/N, Ciudad Universitaria, Colonia La Haciendita, Chilpancingo 39090, Guerrero, Mexico
2
Laboratorio de Biología Celular del Cáncer, Facultad de Ciencias Químico Biológicas, Universidad Autónoma de Guerrero, Av. Lázaro Cárdenas S/N, Ciudad Universitaria, Colonia La Haciendita, Chilpancingo 39090, Guerrero, Mexico
3
Centro de Investigación en Ciencia Aplicada y Tecnología Avanzada Unidad Morelos, Instituto Politécnico Nacional, Boulevard de la Tecnología, 1036 Z-1, P 2/2, Atlacholoaya 62790, Morelos, Mexico
4
Laboratorio de Investigación en Biomoléculas, Facultad de Ciencias Químico Biológicas, Universidad Autónoma de Guerrero, Av. Lázaro Cárdenas S/N, Ciudad Universitaria, Colonia La Haciendita, Chilpancingo 39090, Guerrero, Mexico
5
Laboratorio de Investigación en Enfermedades Infecciosas y Cáncer, Facultad de Ciencias Químico Biológicas, Universidad Autónoma de Guerrero, Av. Lázaro Cárdenas S/N, Ciudad Universitaria, Colonia La Haciendita, Chilpancingo 39090, Guerrero, Mexico
6
Department of Chemical and Biochemical Engineering, National Technological Institute of Mexico, Technological/IT Institute of Zacatepec, Zacatepec 62780, Morelos, Mexico
7
Departamento de Biomedicina Molecular, Centro de Investigación y de Estudios Avanzados del Instituto Politécnico Nacional, Ciudad de México 07360, Mexico
8
Laboratorio de Biomedicina Molecular, Facultad de Ciencias Químico Biológicas, Universidad Autónoma de Guerrero, Av. Lázaro Cárdenas S/N, Ciudad Universitaria, Colonia La Haciendita, Chilpancingo 39090, Guerrero, Mexico
*
Author to whom correspondence should be addressed.
Molecules 2025, 30(19), 3909; https://doi.org/10.3390/molecules30193909
Submission received: 24 July 2025 / Revised: 10 September 2025 / Accepted: 22 September 2025 / Published: 28 September 2025
(This article belongs to the Special Issue Novel Metabolism-Related Biomarkers in Cancer)

Abstract

Cervical cancer (CC) represents a major public health concern, ranking as the fourth most frequently diagnosed cancer and one of the leading causes of cancer-related mortality among middle-aged women worldwide. CC is caused by persistent infection with high-risk human papillomaviruses (HR-HPVs), with HPV 16 being the cause of more than 50% of CC cases. In this study, the exometabolome of the HPV 16-positive cell lines SiHa and Ca Ski, as well as the HPV 16-negative control cell line C-33 A, was evaluated. The exometabolome was validated through molecular signatures using a transcriptomic approach to identify genes encoding cellular metabolic enzymes. The exometabolome was analyzed using 1H nuclear magnetic resonance spectroscopy (1H-NMR). Exometabolomic profiles were subsequently compared through both multivariate and univariate statistical analyses to identify significant differences between cell lines. Molecular signatures were analyzed from the GSE9750 dataset obtained from the GEO database. Exometabolic profiling of the HPV 16 positive cell lines showed higher concentrations of leucine, isoleucine, valine, lysine, methionine, glutamine, ornithine, choline, glucose, and tryptophan. An expression analysis showed increased expression of enzymes involved in amino acid synthesis, the tricarboxylic acid cycle, glycolysis, the pentose phosphate pathway, galactose metabolism, and HIF-1α. These data suggest metabolites and metabolism-associated genes that can be used as non-invasive, stable diagnostic and prognostic biomarkers, as well as therapeutic targets for CC in the presence of HPV 16.

Graphical Abstract

1. Introduction

Cervical cancer (CC) is the fourth most common cancer and the leading cause of cancer-related death in middle-aged women [1,2]. Precursor lesions and progression to CC are caused by persistent infection with high-risk human papillomavirus (HR-HPV), and HPV 16 is the most common [3]. In this regard, the expression of the viral oncoproteins E6 and E7 of HPV 16 are involved in cell transformation and tumor generation [4,5,6]. However, in addition to virus-associated factors such as continuous expression of viral oncogenes E6 and E7, E2 gene cleavage and integration of viral DNA into host cell DNA, viral load and genetic variability, host-associated factors such as immunological, genetic, epigenetic, and metabolic factors are required for tumor development and progression [3,7,8].
Cancer cells have been shown to adopt different metabolic patterns compared with normal cells [9]. Cancer cells consume more glucose to obtain sufficient energy through glycolysis, even in the presence of oxygen, a process known as the Warburg effect [10], a redox state that provides proteins, nucleic acids, lipids, and other macromolecules [9,11,12]. In addition to different types of cancer, metabolic patterns have been identified in CC that may serve as biomarkers of progression, including the dysregulation of glycolytic metabolism, high lactate levels, decreased α- and β-glucose levels, increased low-density lipoproteins levels, lipid accumulation, and abnormal kynurenine/tryptophan ratios [13,14]. E6 and E7 from HPV 16 have been proposed to participate in metabolic reprogramming by regulating proteins responsible for the degradation of hypoxia-inducible factor 1α (HIF-1α) [15]. E6 and E7 can interact with VHL, CUL2, and ELOC, inhibiting the formation of the E3 ubiquitin ligase complex that ubiquitinates HIF-1α for subsequent degradation via the proteasomal pathway. On one hand, E6 interacts with VHL by blocking its interaction with HIF-1α; on the other hand, E7 interacts with CUL2 and ELOC, preventing their binding to VHL and RBX1, respectively. Consequently, HIF-1α stabilizes and binds with HIF-1β to form the active HIF1 complex, which binds to hypoxia response elements (HREs) in DNA, allowing for the expression of genes related to energy metabolism such as glucose transporter member 1 (GLUT1), glycolytic enzymes such as hexokinase II (HKII), phosphofructokinase (PFK), enolase A (ENOA), pyruvate kinase M2 (PKM2) and lactate dehydrogenase A (LDHA) [15,16]. In contrast, the mitochondrial oxidative phosphorylation system (OXPHOS) is affected by HPV 16 at the level of the mitochondrial structure by the release of and increase in reactive oxygen species (ROS), the inactivation of mitochondrial complex III and ATP synthase, and decreased levels of glutathione (GSH) and superoxide dismutase 1 and 2 (SOD1 and SOD2) [16]. Additional mechanisms by which E6 promotes metabolic reprogramming involve the deregulation of proteins and signaling pathways, including p53, c-Myc, and STAT3 and the Wnt/β-catenin, MAPK, mTOR, and PI3K/AKT pathways. Specifically, E7 promotes metabolic reprogramming by inactivating the retinoblastoma protein [17].
At present, poor prognosis and absence of symptoms in the early stages hinder early diagnosis of gynecological cancers such as CC. Thus, prompt intervention is required to improve the survival statistics of cancer patients and reduce the social and financial burdens of the disease [18]. Currently employed conventional screening and cytological diagnostic methods have low sensitivity and specificity, and are not widely used for risk assessment, resulting in delayed diagnosis of CC. In addition, metabolomics-focused studies are a current resource that focuses on the analysis of endpoint metabolites; specifically, the end products generated or maintained by genetic or environmental changes in a living system. The metabolome then provides an identification profile of the cell end condition, discriminates tumor phenotype, and is an efficient platform to differentiate between healthy individuals and cancer patients [18]. In addition, metabolomics can be applied in in vitro systems; for example, in exometabolomics studies for the detection of changes in the composition of cell growth media [19]. Exometabolomics offers a powerful strategy for identifying cellular phenotypes while avoiding the challenges of measuring intracellular metabolites because exometabolite levels are integrated within minutes or hours, whereas intracellular metabolites can be altered or degraded within milliseconds of extraction [19]. Recently, through a study of the CC metabolome, new potential non-invasive markers have been identified to predict the disease substage [20].
This work aims to analyze the exometabolome of three cell models positive and negative to HPV 16. We performed a 1H nuclear magnetic resonance (1H-NMR) metabolomic profile analysis of the culture media used by HPV 16 positive and negative CC cell lines to identify potential biomarkers for the diagnosis and progression of CC. In addition, using a transcriptomic approach, we validated and correlated the expression of metabolic enzymes that are underexpressed in HPV 16-positive and negative CC cell lines. This global and specific approach could be useful in discovering new biomarkers for disease risk prediction.

2. Results

2.1. Unsupervised Analysis of Culture Media Reveals HPV 16–Driven Metabolic Discrimination in Cervical Cancer Cell Lines

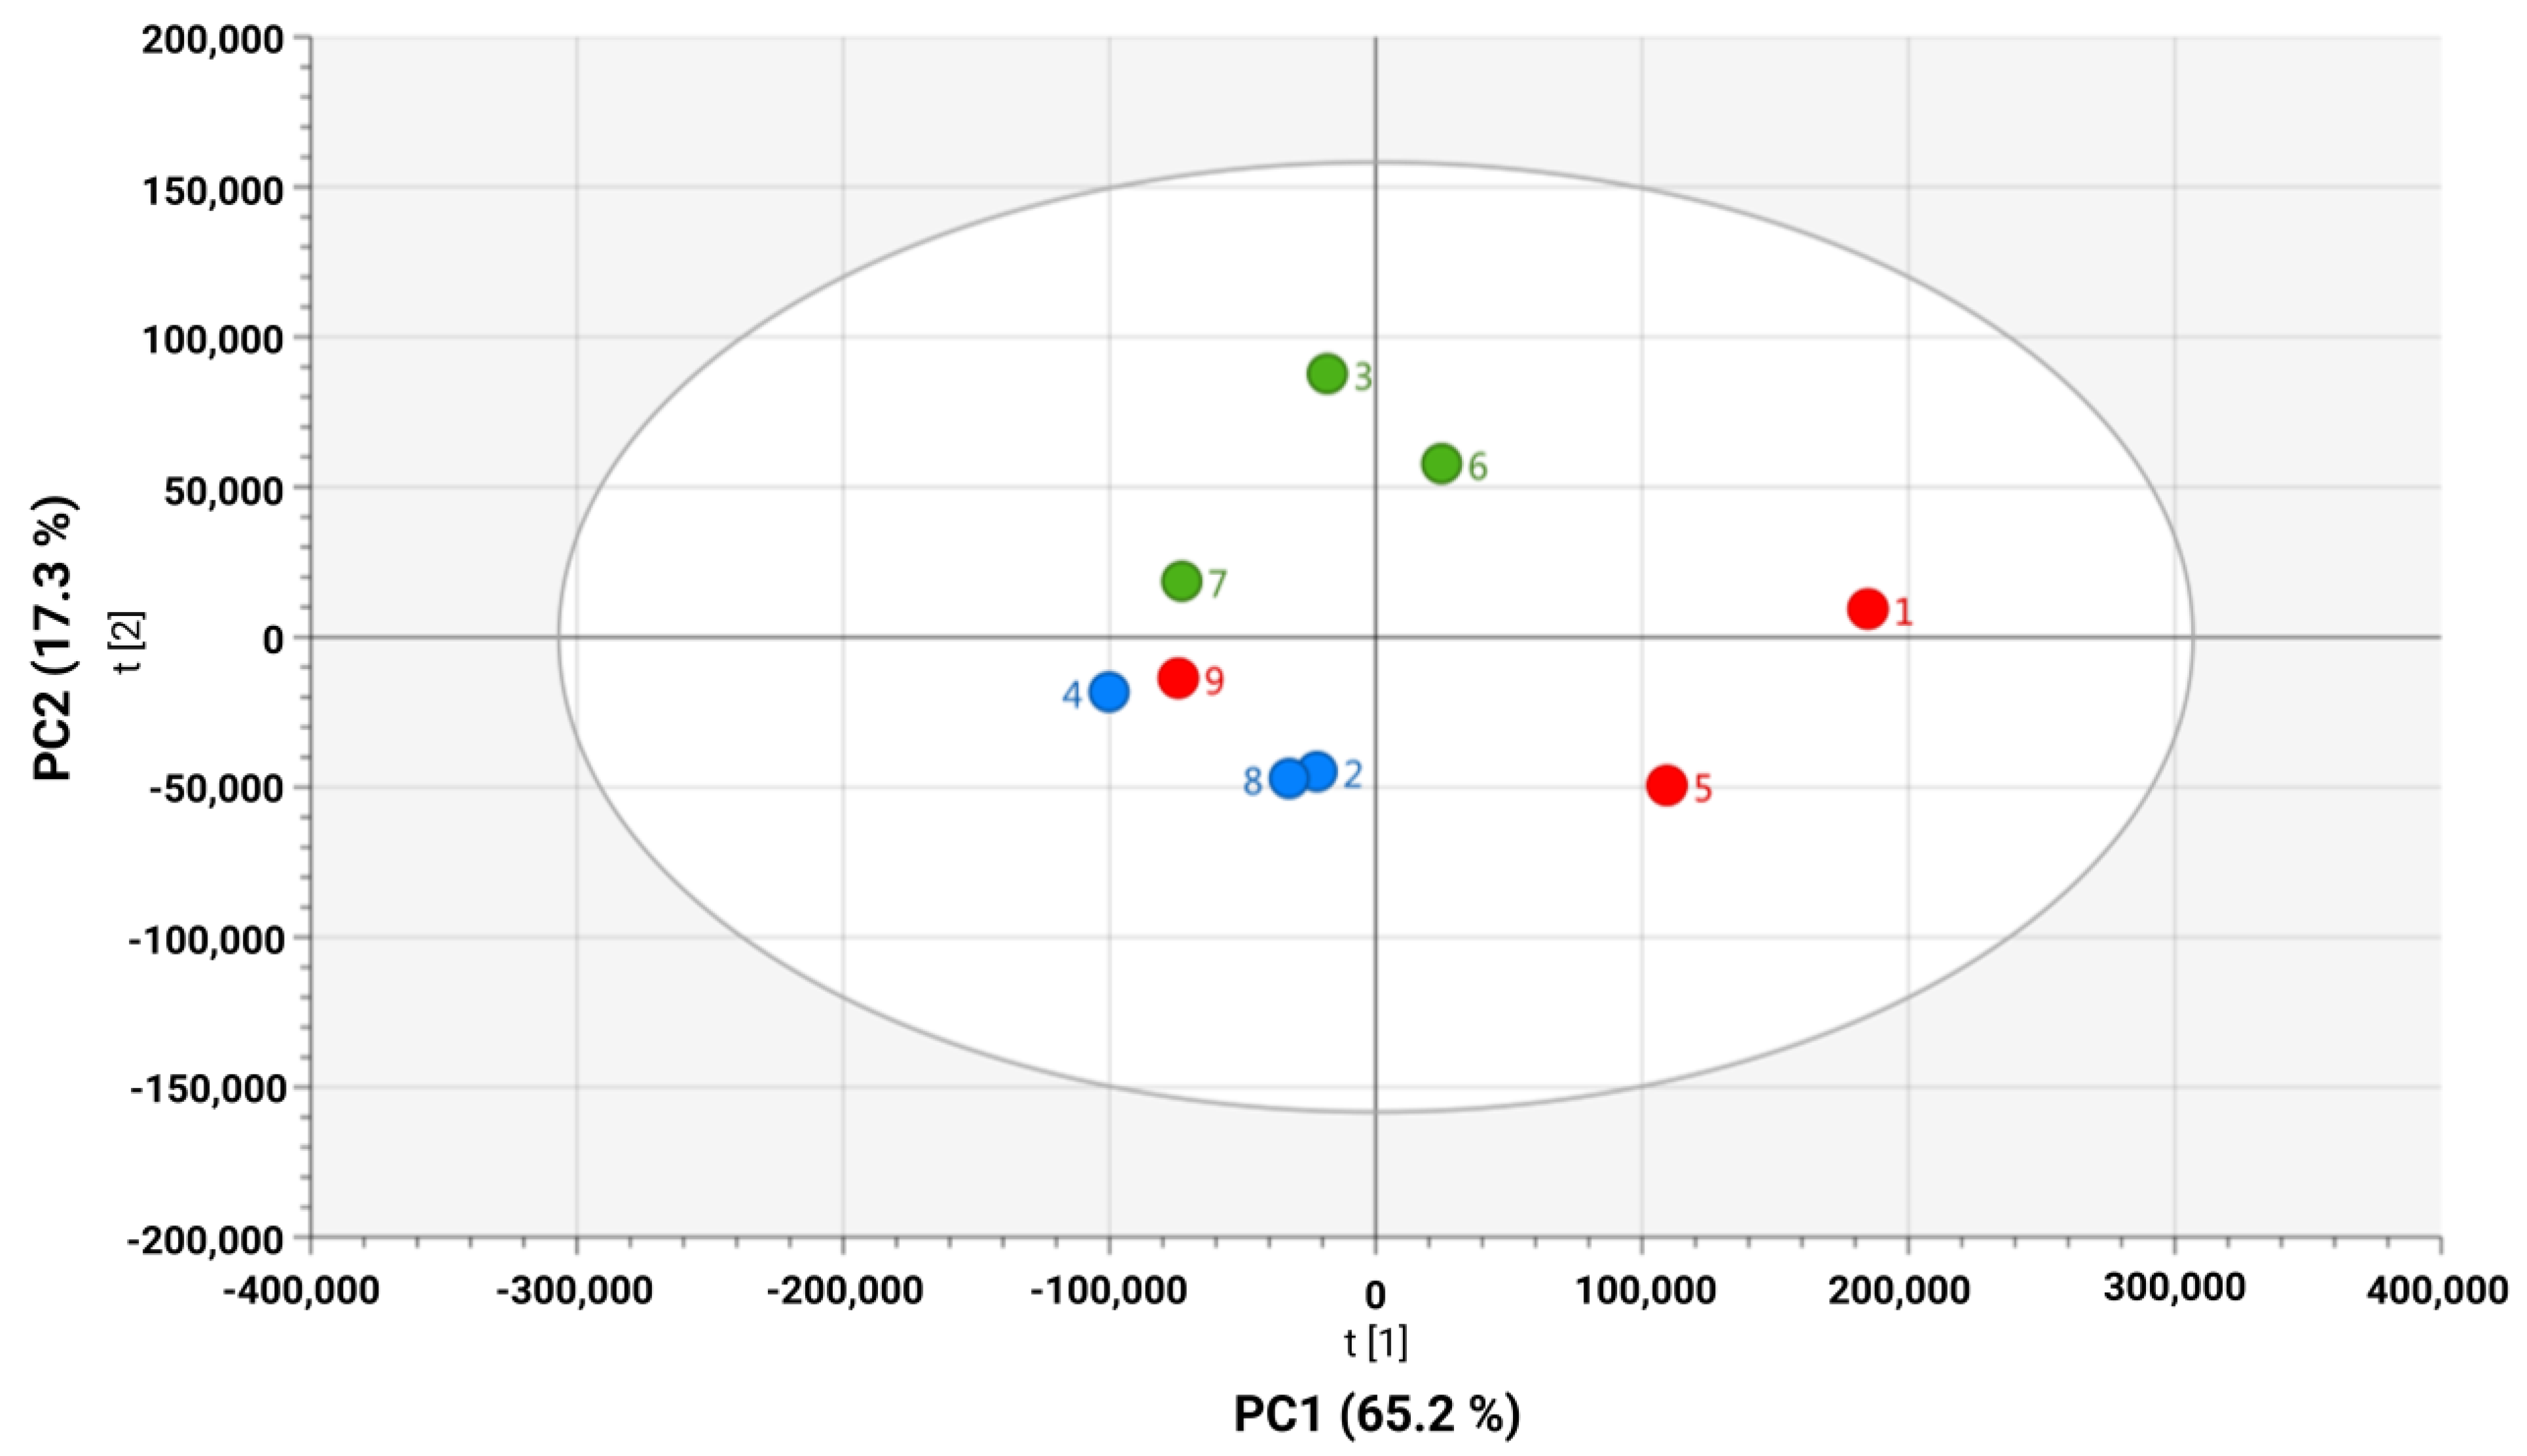
To evaluate the possible influence of HPV 16 on the metabolic profiles obtained from the C-33 A, SiHa, and Ca Ski cell lines, an unsupervised analysis of 1H-NMR spectra was performed (Figure 1). Differences in the clustering of the data were observed when comparing the three cell models (Figure 2). A Principal Component Analysis (PCA) revealed a clear, high variation (82.5%) between the C-33 A, SiHa, and Ca Ski cell lines, with PC1 contributing 65.2% of the variation. The unsupervised data reveal differences between the datasets in the C-33 A, SiHa and Ca Ski cell lines, suggesting that the presence of HPV 16 and the integrated copy number contribute to alterations in the different metabolomic profiles of the media where the cell lines were cultured.

2.2. Supervised Analysis Reveals Significant Exometabolomic Differences Between HPV 16-Positive and -Negative Cervical Cancer Cell Lines

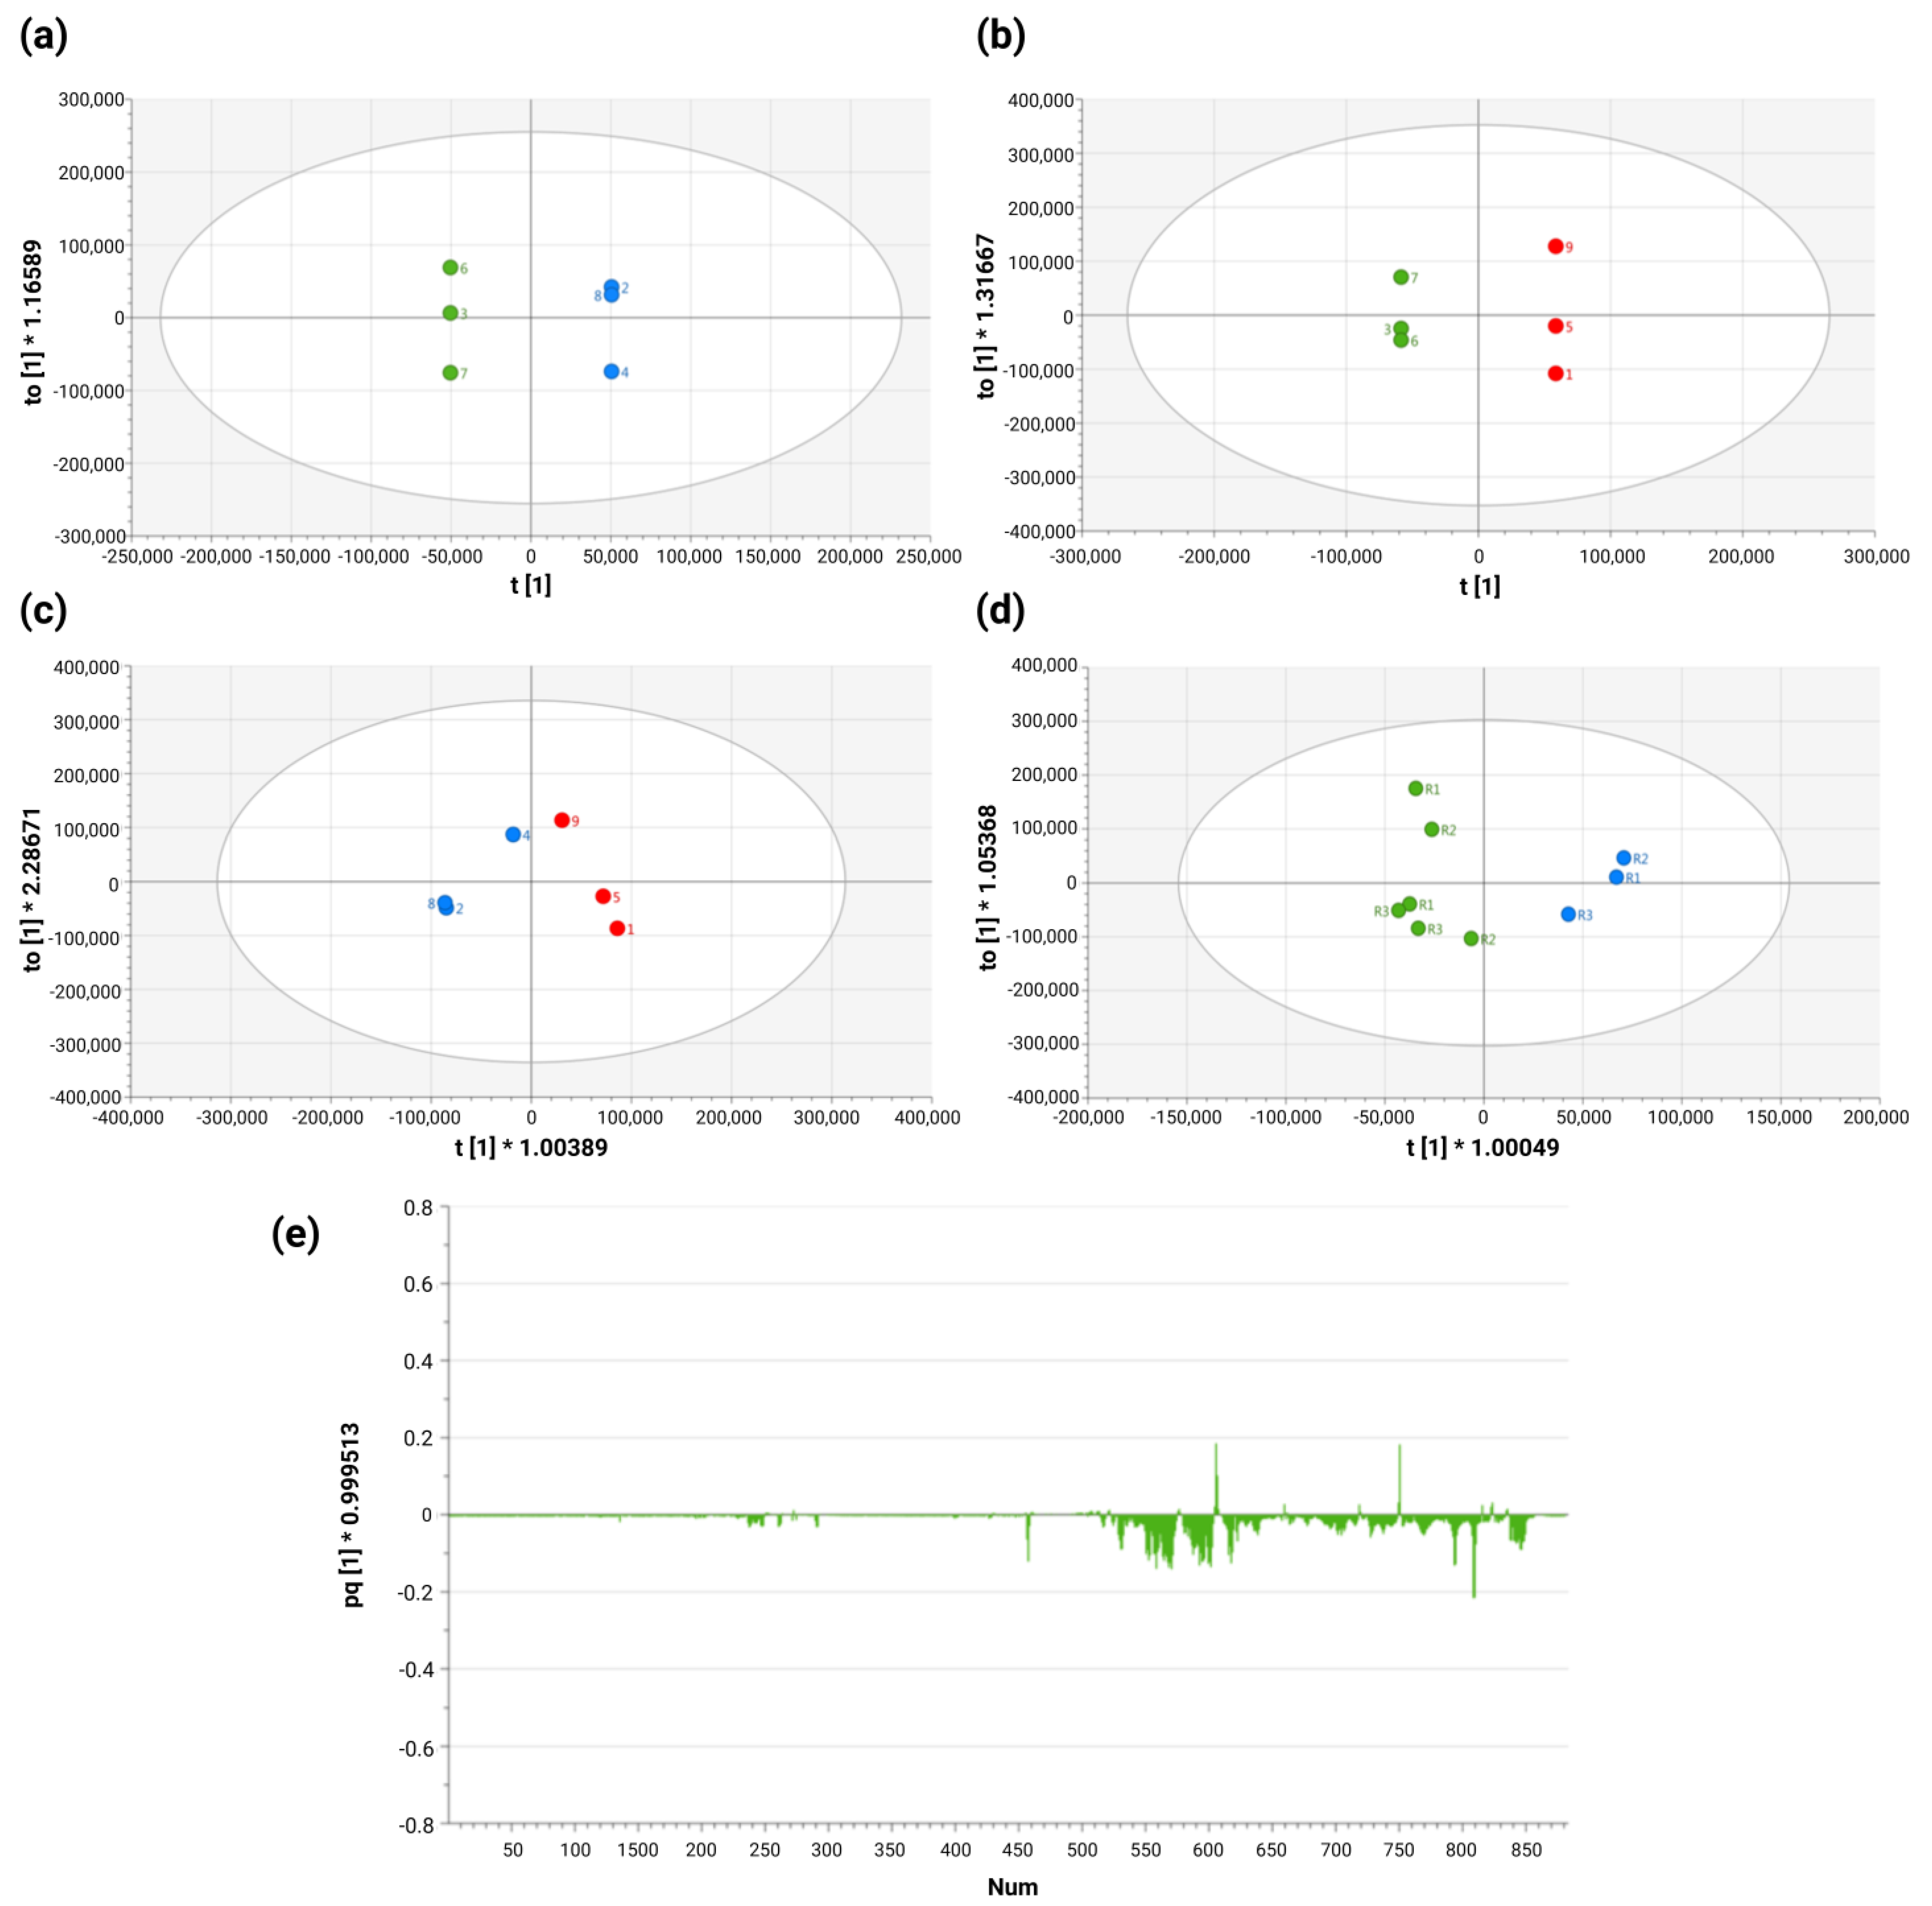
To determine the differences between the exometabolome of HPV 16-positive and -negative cell lines, statistical discriminant models (OPLS-DA) were utilized based on comparisons between the three different groups of cells included in the training set (Figure 3), with the significance of the OPLS-DA model being assessed using a cross-validation ANOVA (p ≤ 0.05 was considered significant) and a permutation test (n = 100). In the analysis, C-33 A, SiHa, and Ca Ski cells were found to exhibit a specific metabolic profile (R2X = 1; Q2 = 1) characterized by statistically significant differences in the concentrations of several metabolites (Figure 3a,b). We observed that in the SiHa and Ca Ski cell lines, which exhibit variations in the number of HPV 16 copies integrated into their genomes, specific metabolic profiles were present, and had statistically significant differences in the concentrations of various metabolites of R2X = 0.834; Q2 = 0.159 (Figure 3c). When the comparison was made between the HPV 16-negative and -positive groups, we observed that the exometabolomic profile is different and specific for HPV 16-negative cells compared with the HPV 16-positive cell lines, in which the presence and viral load alter the exometabolome and the viral load exhibits a significant effect, yielding statistically significant differences in the concentrations of various metabolites with R2X = 0.925; Q2 = 0.749 (Figure 3d). In a subset of highly discriminating metabolites between the two analyzed groups, marked differences were observed in intensity, which are considered responsible for the separation observed in the OPLS-DA space (Figure 3e).
An analysis of metabolic differences based on the results of the shared and single structure plots (SUS-plots) (Figure 4) revealed significant common variations between the metabolic profile of the exometabolome of the HPV 16-negative cell line (C-33 A cells) and both positive cell lines (SiHa and Ca Ski cells) (Figure 4a,b). The blue dots in Figure 4b represent metabolites whose variation is in the same direction in both models and have a VIP greater than 1.5 in the individual models. The common metabolites in both OPLS were alanine, isoleucine, leucine, glutamate–glutamine, trimethylamine-n-oxide, and glucose.

2.3. Specific Combinations of Metabolites Discriminate HPV 16-Negative and Positive Cells

To determine the differential profile of the exometabolites of the C-33 A cell lines (HPV 16-negative) and SiHa and Ca Ski cells (HPV 16-positive), an inspection of the contribution to the separation between groups was performed, which resulted in the identification of the spectral signals and metabolites that contributed the most to the discrimination between the groups being compared. Using this approach, the concentrations of 11 metabolites showed statistically significant differences when compared between the study groups (Table 1). When the metabolite concentrations of the SiHa and Ca Ski cells were compared, significant differences were observed in glutamine. When comparing the C-33 A cells with the SiHa cells, significant differences were observed in glutamine and uracil. Furthermore, the glucose concentration showed statistically significant differences compared with the C-33 A cell for the Ca Ski cells. To determine the differential exometabolite profile of the C-33 A cells (HPV 16-negative) and the SiHa and Ca Ski cells (HPV 16-positive), their contributions to group separation were analyzed, allowing for the identification of spectral signals and metabolites. Leucine, isoleucine, valine, lysine, methionine, glutamine, ornithine, choline, glucose, and tryptophan were found to show significant differences when comparing the exometabolome of HPV 16-positive and -negative cell lines. These data confirm significant differences between the exometabolic profiles of HPV 16-negative (C-33 A) and -positive (SiHa and Ca Ski) cancer cell. These results could provide essential data for the diagnosis and prognosis of CC.
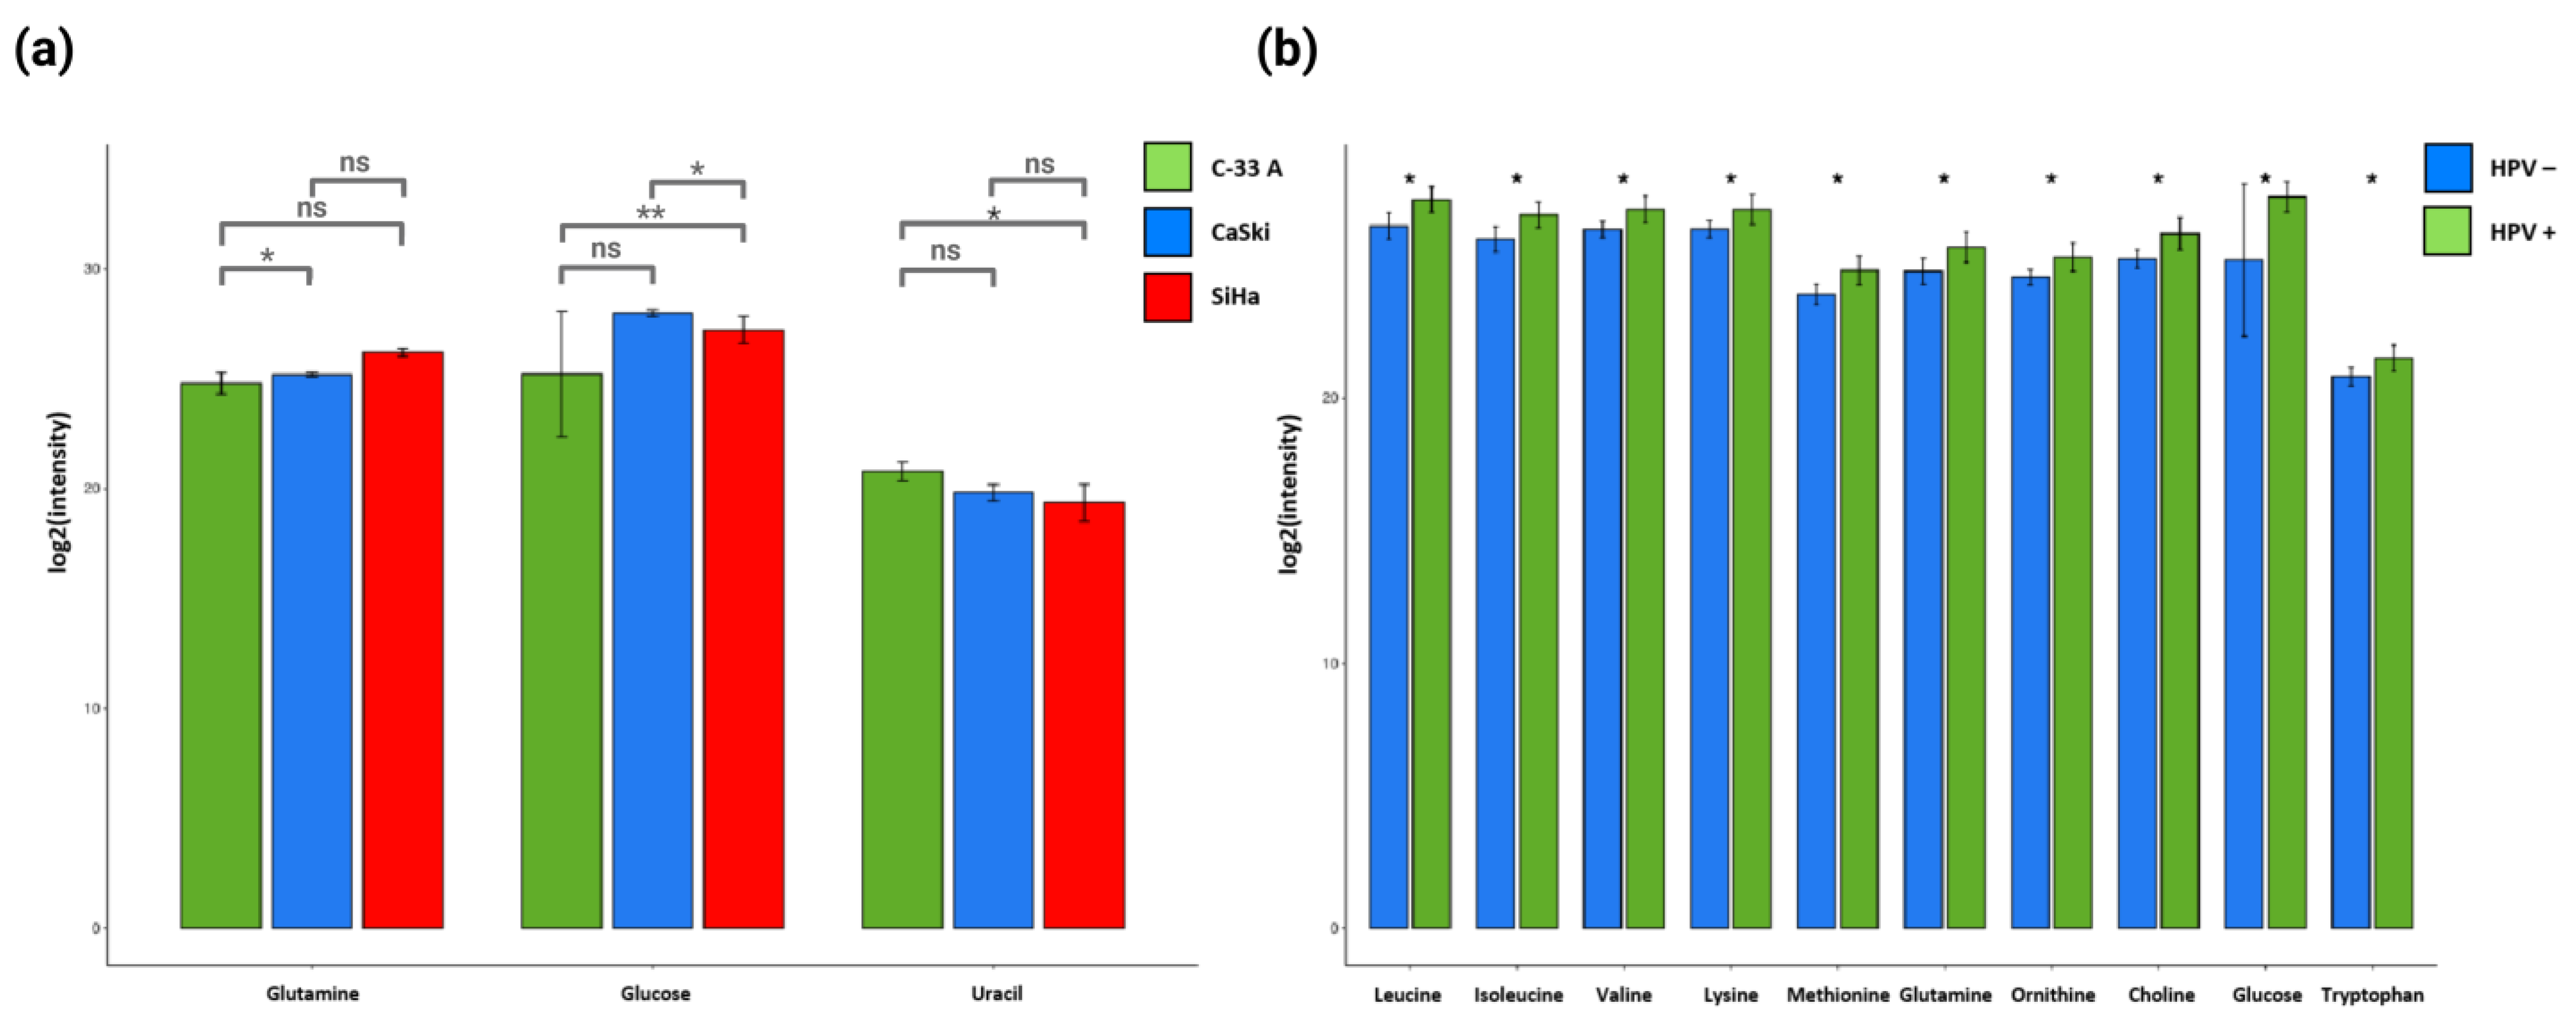
Metabolite levels were analyzed in depth, revealing significant differences in the metabolic profiles of HPV 16-negative and -positive cells (Figure 5). The concentration of glutamine was found to be higher in the SiHa cell line, while glucose showed high concentrations in the Ca Ski cell line, but uracil concentrations were higher in the C-33 A cell line (Figure 5a). When comparing the concentrations of metabolites in HPV 16-positive and -negative cell lines, the concentrations of leucine, isoleucine, valine, lysine, methionine, glutamine, ornithine, choline, glucose, and tryptophan were observed to be significantly higher in the Ca Ski cells (with a higher number of HPV 16 DNA copies integrated into the cell genome) and SiHa cells (with a lower number of HPV 16 DNA copies integrated into their genome) and lower in the C-33 A cells (negative cancer cells to HPV 16) (Figure 5). These data support the hypothesis that the presence of HPV 16; the density of its DNA integration into the cell genome; and, therefore, the viral load in CC cells are related to specific exometabolomic profiles. These findings may be helpful in the non-invasive identification of biomarkers associated with the diagnosis and progression of CC.

2.4. The Exometabolome Is Associated with the Expression of Genes Related to Metabolic Reprogramming in HPV 16-Positive and -Negative Cervical Cancer Cell Lines

To analyze whether the exometabolome of the cell lines is related to the gene expression of the enzymes responsible for producing the metabolites identified, a gene expression analysis was performed by querying the Affymetrix U133A oligonucleotide microarray GSE9750 dataset deposited in the GEO database (Figure 6a). C-33 A, SiHa, and Ca Ski cell lines were cultured by [21] under conditions similar to those used in our study. The expression of the PGM, PSAT1, ALDOA, HK2, IDH3G, CA9, RPIA, BSG, HMG1, ASL, PGK1, and IDH3B genes was observed to be higher in the Ca Ski cells than in the C-33 A and SiHa tumor lines. The expression of ACSL4, PADI3, SUCLG2, PGM1, IDH5, PKM, HIF1A, TKT, and SLC2A1 was observed to be higher in the Ca Ski cells than in the C-33 A cells. In contrast, the expression of ACSL3, GLUD1, and PHGDH is higher in the Ca Ski cells than in the SiHa cells. On the other hand, the expression of SLC2A1, TKT, HIF1A, PKM, IDH5, PGM1, SUCLG2, PADI3, ACSL4, SHMT1, SHM2, PDH, PSP, PSPH, IDH, IDH1, ASS, FUM1, IDHG, GLS, and PADI4 was observed to be higher in the SiHa cells than in the C-33 A and Ca Ski cells. The expression of HMG1, ASL, PGK1, and IDH3B was found to be higher in the SiHa cells than in the C-33 A cells. In contrast, the expression of PFKFB2, ACSM2B, and PADI1 was higher in the SiHa cells than in the Ca Ski cells. When comparing the expression of the C-33 A cells with those of the SiHa and Ca Ski cells, the expression of the PFKM, GAPDH, ACC1, SDH2, ICDH, ACLB2, ACCY, ACSS3, PADI2, PGD6, ALDOB, LDHAL6B, IDH2, AACS, CPT1A, ENO1, MDH1, and FASN genes was observed to be higher in the C-33 A cells than in the SiHa and Ca Ski cells. That the expression of ACSL3, GLUD1, and PHGDH was also observed to be higher in the C-33 A cells than in the SiHa cells, while the expression of PFKFB2 and ACSM2B was higher in the C-33 A cells than in the Ca Ski cells.
In the enrichment analysis of biological pathways and functions performed through the GO and KEGG databases, using the Hypergeometric Test and Gene Set Enrichment Analysis (GSEA) algorithms in both cases, differentially expressed genes (DEGs) were observed in the first part to substantially enrich metabolic processes such as ribose phosphate, monosaccharide, purine-containing compound, purine ribonucleotide, pyruvate, ribonucleotide, purine nucleotide, and NADH metabolic processes, as well as hexose and glucose catabolic processes (Figure 6b). It was observed in the background that DEGs enrich molecular functions such as NAD binding, oxidoreductase activity, acting on the CH-OH group of donors, NAD or NADP as acceptor, magnesium ion binding, acid-thiol ligase activity, monosaccharide binding, ligase activity, forming carbon–sulfur bonds, CoA-ligase activity, lyase activity, butyrate-CoA ligase activity, hydrolase activity, acting on carbon–nitrogen (but not peptide) bonds, and in linear amidines (Figure 6b). Finally, DEGs were observed to enrich the functions of cellular components of the mitochondrial matrix, ficolin-1-rich granule, ficolin-1-rich granule lumen, peroxisome, microbody, tertiary granule lumen, secretory granule lumen, cytoplasmic vesicle lumen, vesicle lumen, and mitochondrial outer membranes (Figure 6b). The pathways enriched in DEGs were the metabolic pathways of carbon metabolism; amino acid biosynthesis; glycolysis/gluconeogenesis; central carbon metabolism in cancer; HIF-1 signaling pathway; the citrate cycle (TCA cycle); the pentose phosphate pathway; fructose and mannose metabolism; 2-oxocarboxylic acid metabolism; and glycine, serine and threonine metabolism (Figure 6c,d).
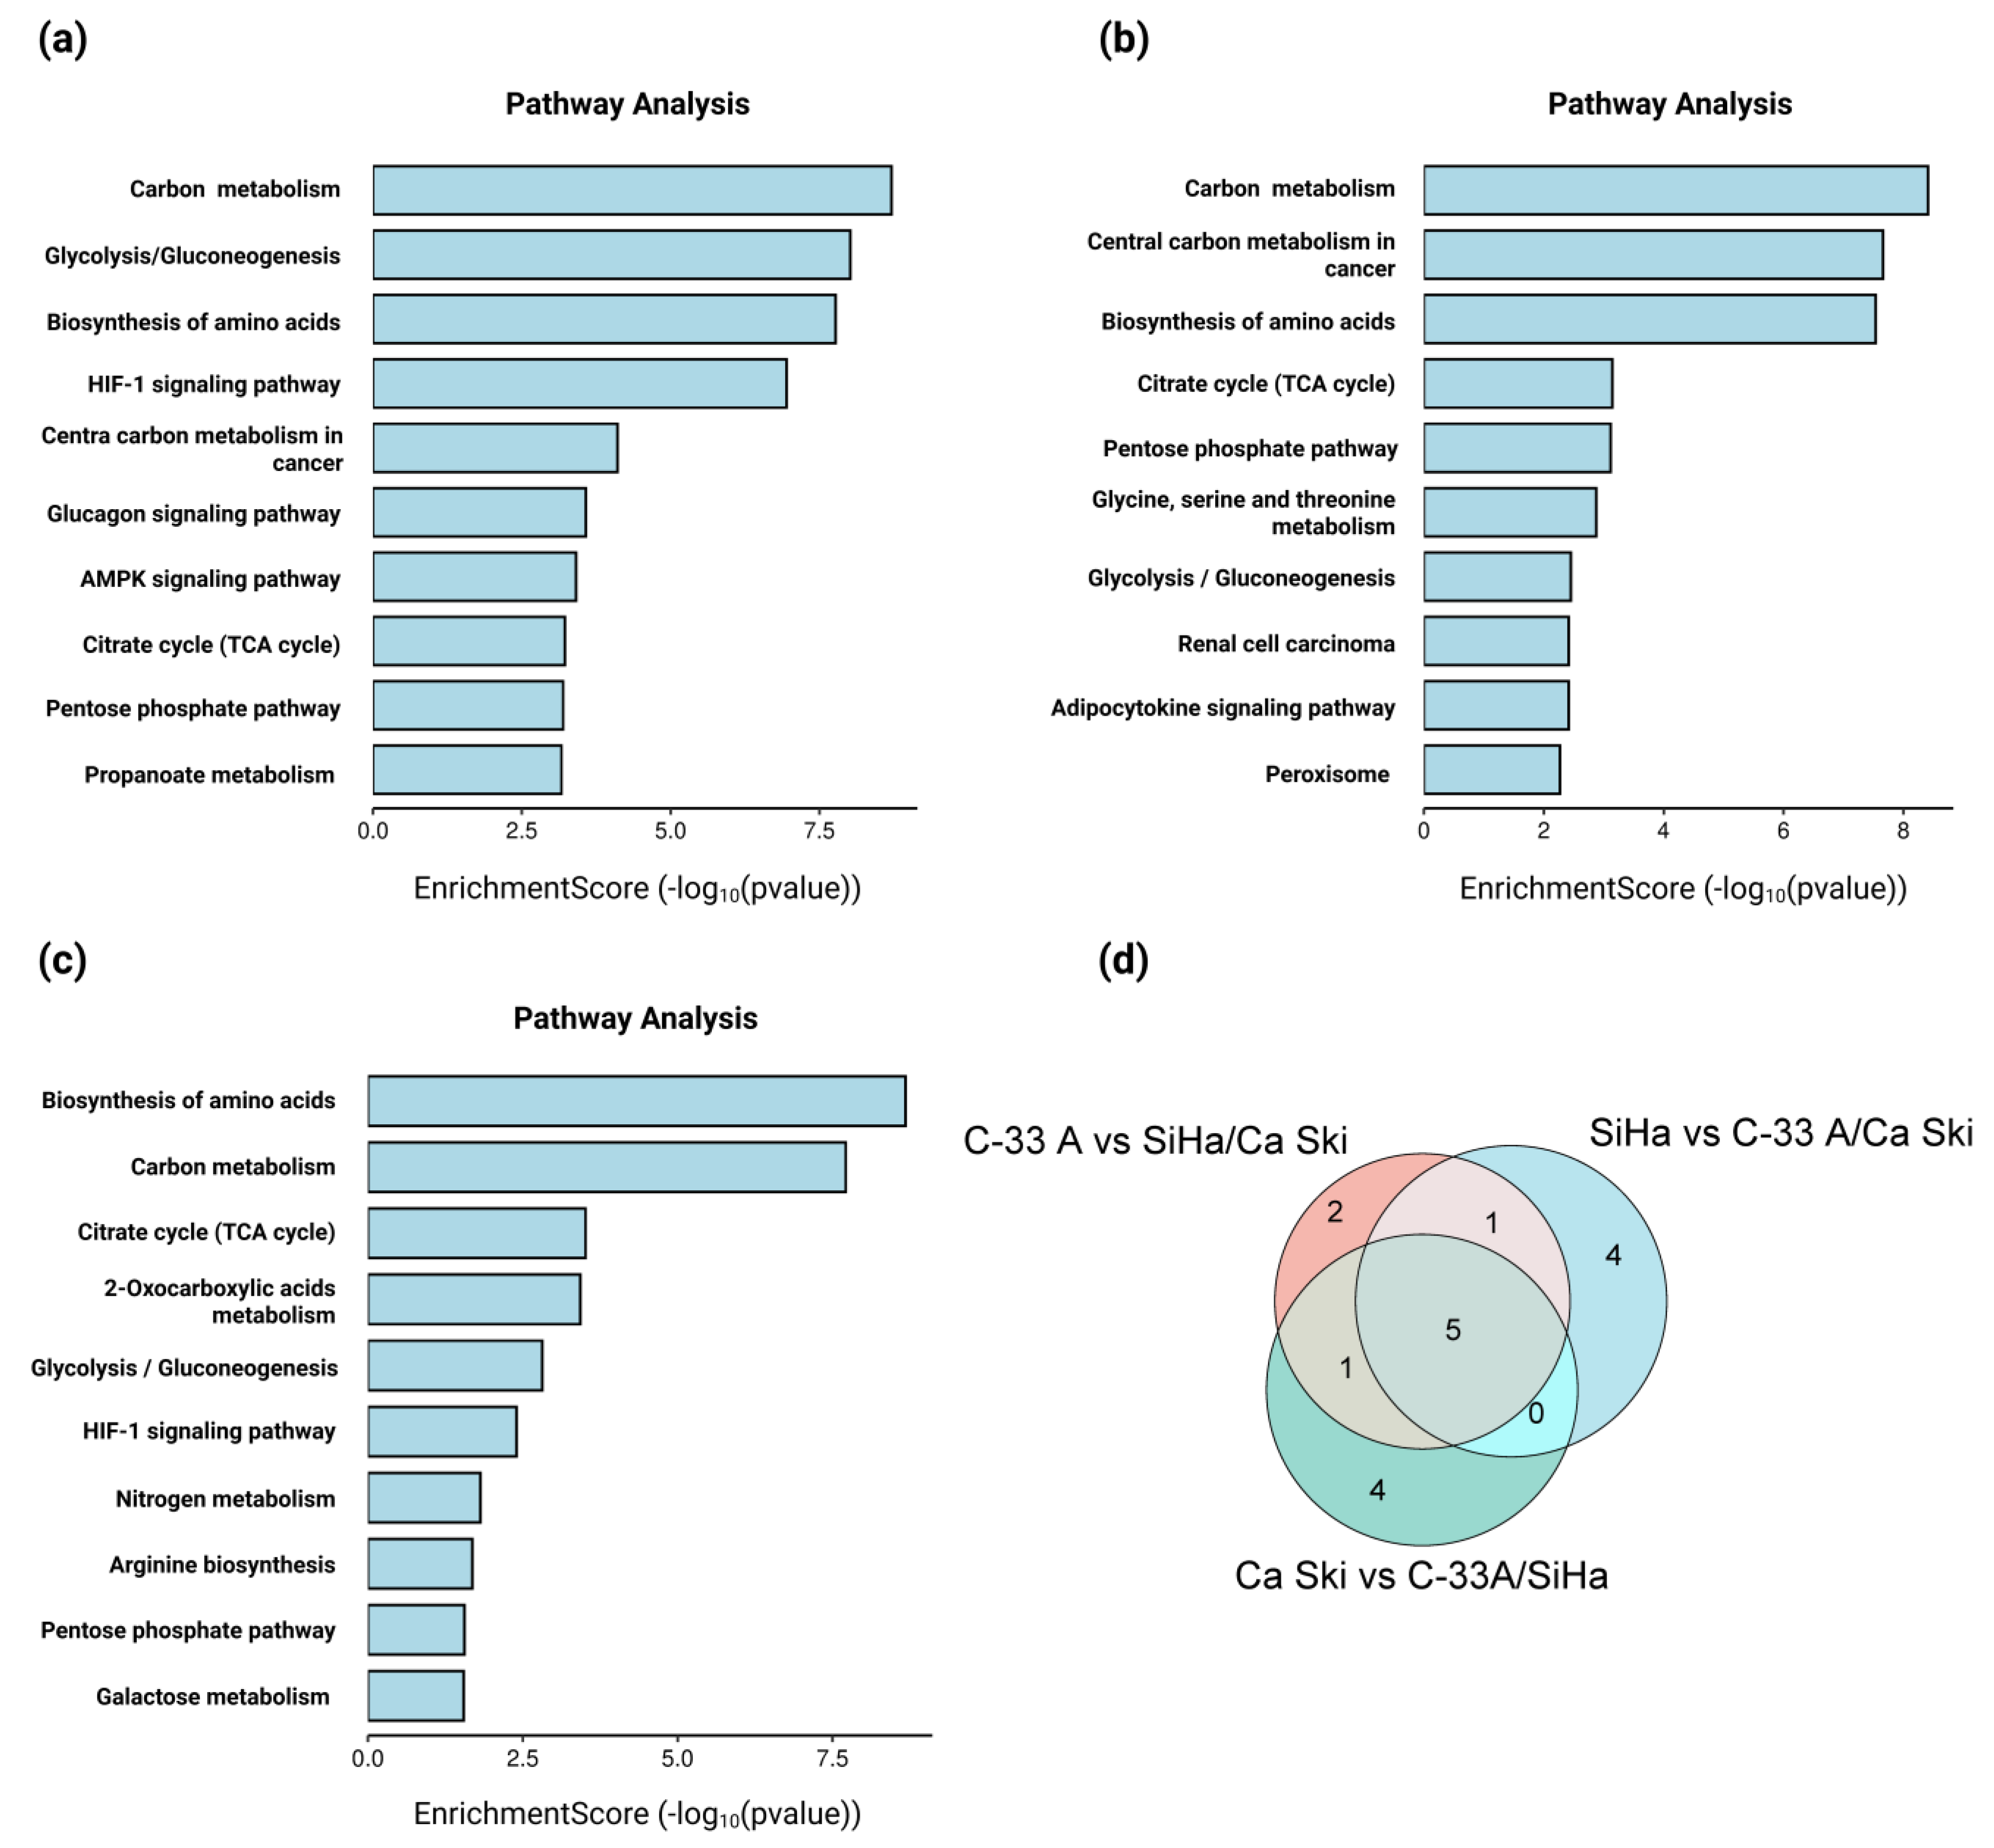
We observed that genes expressed in higher proportion in C-33 A cells than in SiHa and Ca Ski cells enrich the metabolic pathways of glucagon signaling and the AMPK signaling pathway (Figure 7a–d); whereas genes overexpressed in SiHa cells as opposed to C-33 A and Ca Ski cells enrich the glycine, serine, and threonine metabolism pathways, adipocytokine signaling pathway, and peroxisome signaling (Figure 7b–d). On the other hand, genes with higher overexpression in Ca Ski cells, as opposed to C-33 A and SiHa cells, were observed to enrich the pathways of 2-oxocarboxylic acid metabolism, nitrogen metabolism, arginine biosynthesis, and galactose metabolism (Figure 7c,d). In the three models, the genes with the highest expression were observed to enrich pathways related to carbon metabolism, glycolysis/gluconeogenesis, amino acid biosynthesis, the tricarboxylic acid cycle (TCA cycle), and the pentose phosphate pathway (Figure 7d).
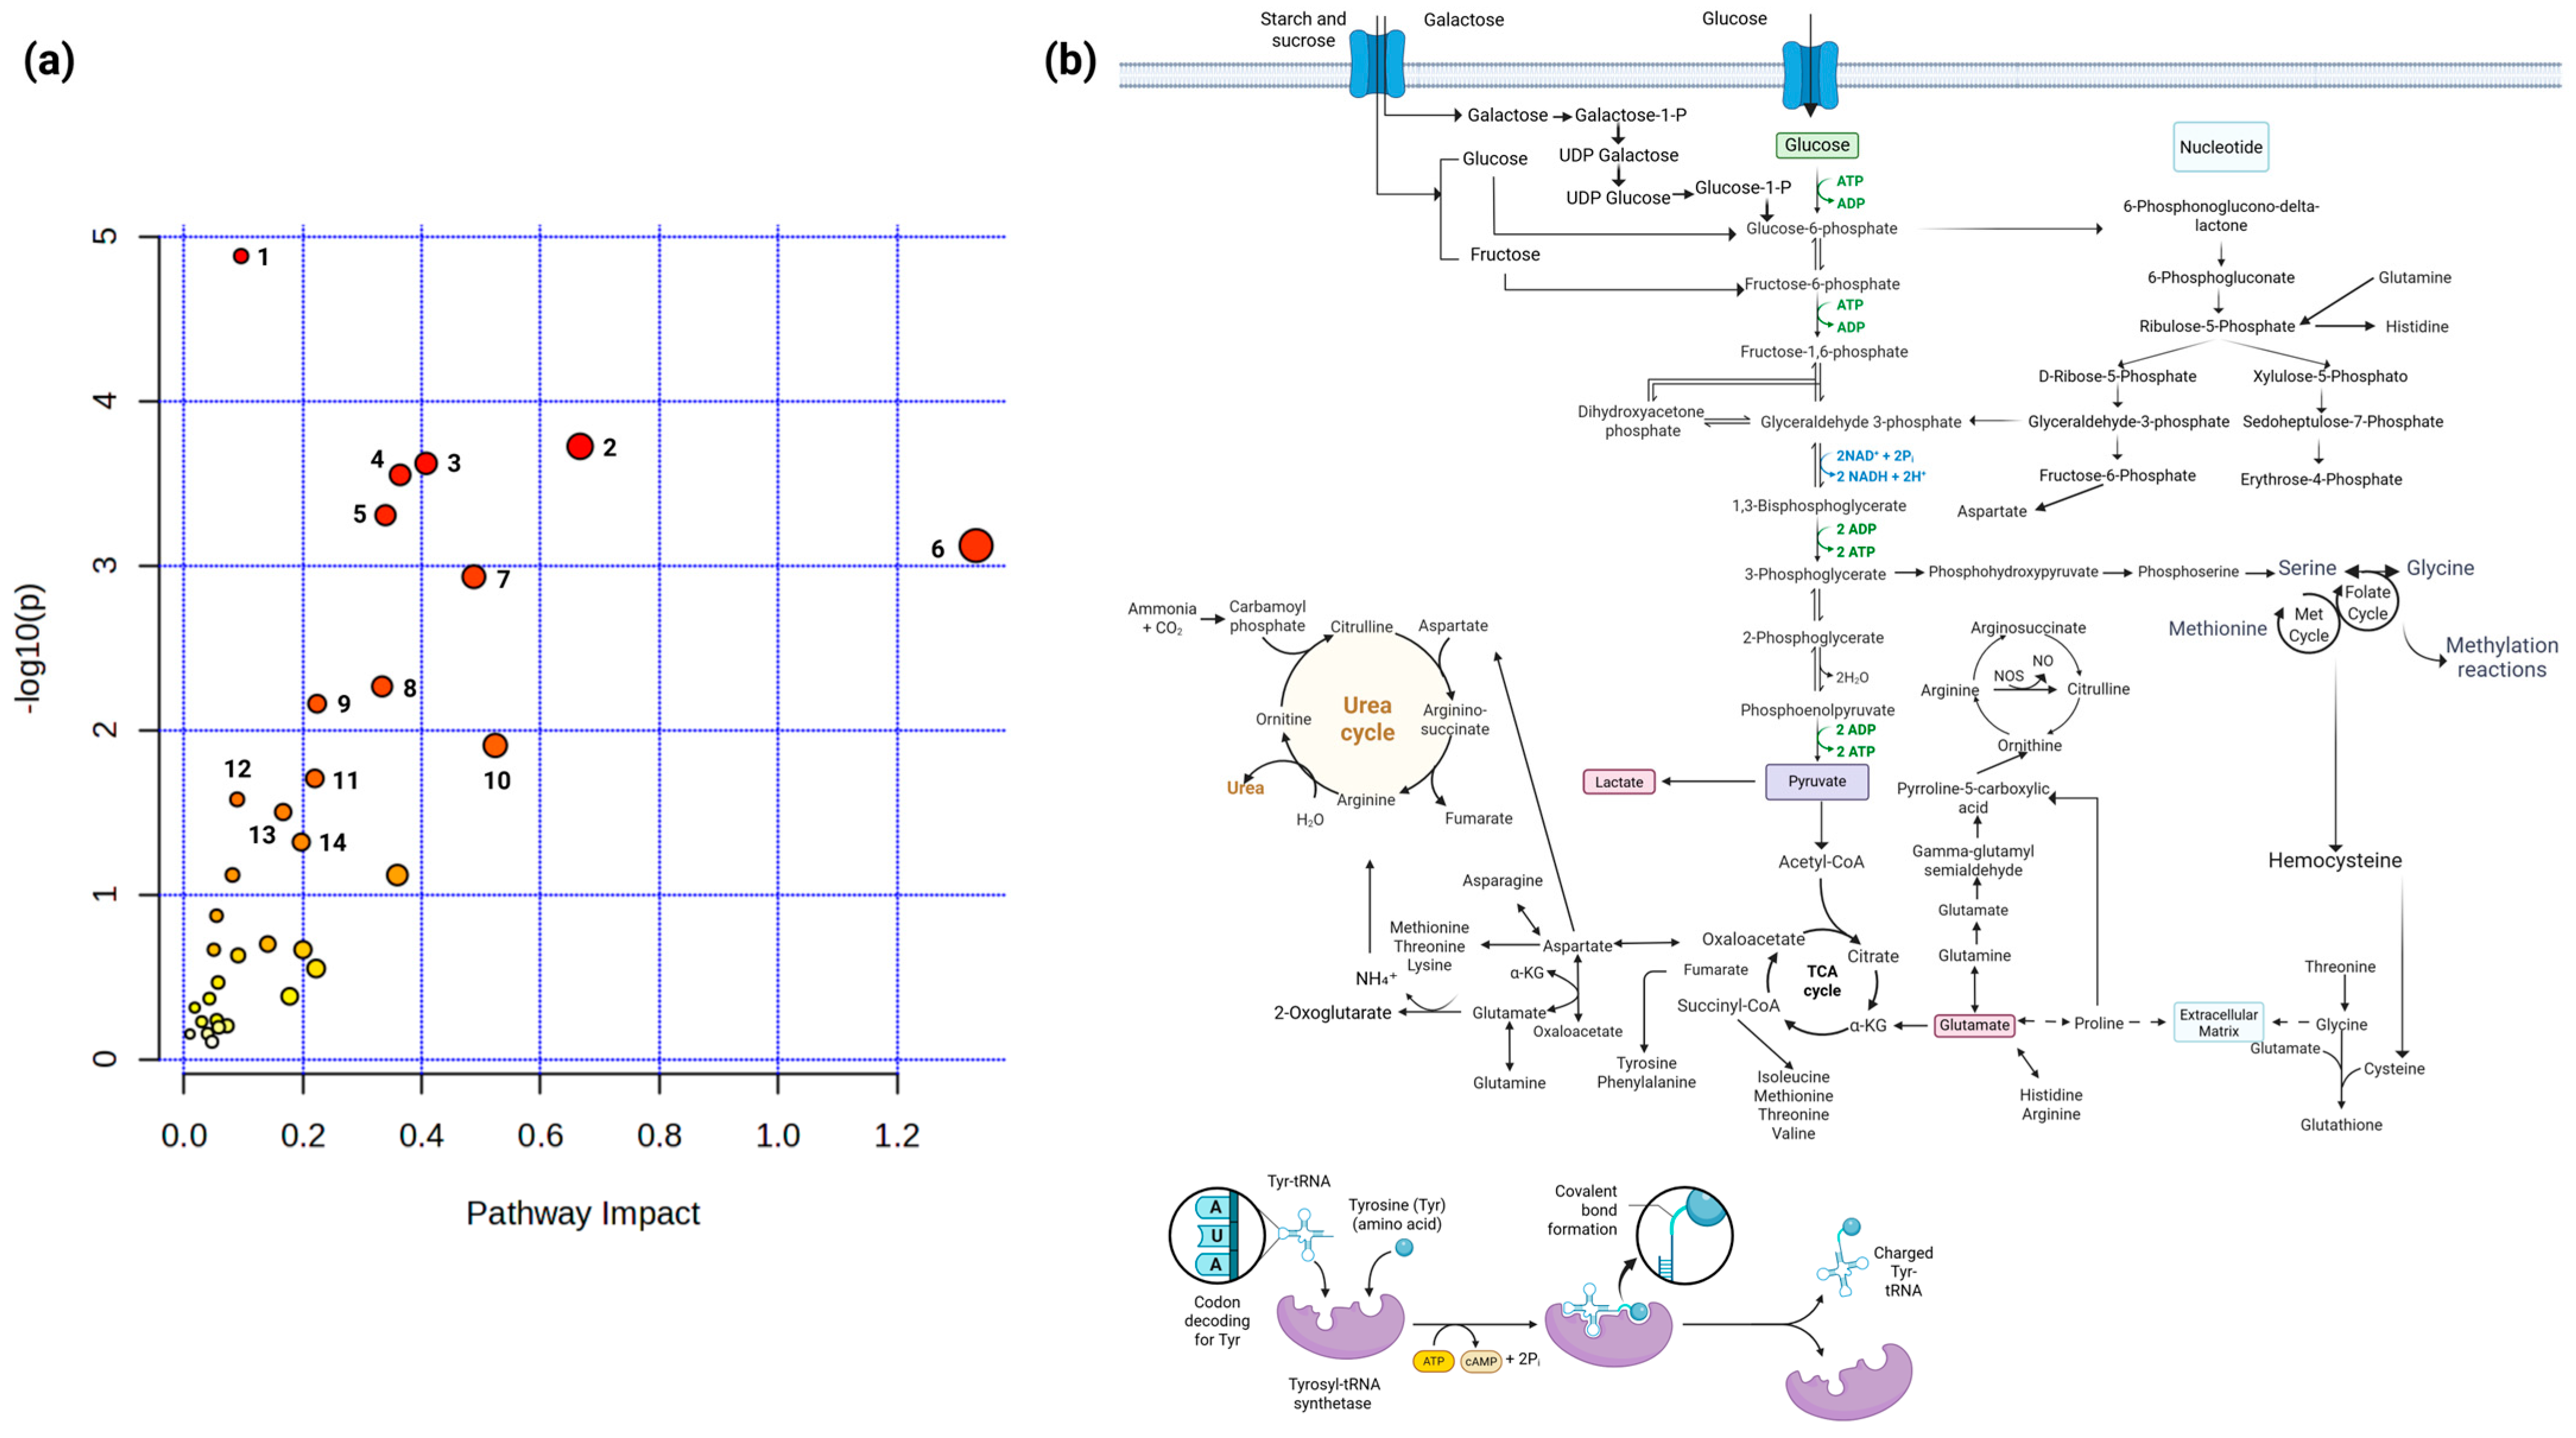
The dataset of metabolites and genes with increased concentration and expression, respectively, in HPV 16-positive and -negative cell lines was integrated to obtain the metabolic pathways favored by the effect of HPV 16. The analysis was performed using the MetaboAnalyst 6.0 web platform, which allows for the integration of metabolomic data, their interpretation, and their connection with other omics data from statistical and functional perspectives [22]. The analysis was performed using the joint pathway analysis option, through tight integration, which combines the list of metabolites and the list of significant genes with optional fold change values. For the enrichment analysis, the hypergeometric test was applied; for the topology measure, the degree centrality was applied; and for the integration method, a combination of queries was performed. We observed that gene overexpression and metabolite concentration (Figure 8) significantly favor (p-value > 0.05) the enrichment of the metabolic pathways of aminoacyl-tRNA biosynthesis; pentose phosphate pathway; arginine biosynthesis; valine, leucine, and isoleucine biosynthesis; glycolysis or gluconeogenesis; neomycin, kanamycin, and gentamicin biosynthesis; citrate cycle (TCA cycle); nitrogen metabolism; glycine, serine, and threonine metabolism; starch and sucrose metabolism; galactose metabolism; glutathione metabolism; alanine, aspartate, and glutamate metabolism; and one carbon pool by folate, suggesting that the presence and copy number of HPV 16 promote the production of energy and biomass synthesis necessary for tumor progression and maintenance in CC.

3. Discussion

The extraordinary versatility of cancer cells to reprogram their metabolism to meet energy demands, even in the presence of oxygen, was first described almost a century ago by Otto Warburg [23]. This premise has opened the door for the study of cancer metabolism. It is now known that not only are energy requirements essential in the study of cancer, but also that the a posteriori metabolic activity of tumors can be exploited as an analytical advantage. A large number of biologically active products from tumor metabolism are secreted into the tumor microenvironment, especially under conditions of unbalanced growth, and have been proposed as potential cancer-specific exometabolomic fingerprints [24]. Even though metabolomics studies in CC focus on characterizing and quantifying metabolic processes within the cell, metabolic differences in CC patients have been identified, ranging from the vaginal microenvironment to CC subtypes, the presence of HR-HPV, and the effectiveness of radiotherapy and chemotherapy treatments [20,25,26,27]. This suggests that specific metabolites may provide important insights into the mechanisms involved in tumor development and progression and could be potential candidates for new biomarkers of disease progression, early diagnosis, and treatment [25].
Exometabolomics is the study of how cells transform their environment via small molecules in culture media as a result of cell culture, typically by comparing media with different cellular conditions. Exometabolomics provides powerful insights into cellular phenotypes while circumventing the challenges of measuring intracellular metabolites, which are known to be altered and degraded within milliseconds of extraction [19,28]. This work focused on identifying potential biomarkers of CC diagnosis and progression by analyzing the exometabolomic profile using 1H NMR of three CC cell models with significant molecular differences: the C-33 A cell line (HPV-negative), SiHa cells (with one to two copies of HPV 16 DNA integrated into their genome), and Ca Ski cells (with about 600 copies of HPV 16 DNA in a mixed, genome-integrated, and episomal form) [29].
According to the analysis of the cell growth medium via 1H NMR, the three cell types were found to have unique exometabolomic profiles. Following discriminant model analysis, a marked significant difference observed not only between the metabolomic profiles of HPV-negative CC cells (C-33 A) and HPV-positive cells (SiHa and Ca Ski) but also between HPV 16-positive cells themselves. It is known that infection with human papillomavirus (HPV), particularly high-risk (HR) HPV types such as HPV 16, is an important factor in the progression of cervical cancer (CC) [30,31] and that the E6 and E7 oncoproteins of HPV 16 may promote metabolic reprogramming in CC. For example, E6 (via p53 and HIF-1α) and E7 (via pRb) increase anaerobic glycolysis even in the presence of oxygen and graded acid synthesis [16,17]. Proliferating cells must de novo synthesize several nitrogen-containing molecules, including nucleotides, non-essential amino acids, and polyamines [32,33]. When the exometabolomic profile of C-33 A cells was compared with the SiHa cell line, significant differences in glutamine and uracil concentrations were observed. When comparing the exometabolomic profile between the Ca Ski cell line against C-33 A and SiHa cells, the concentration of metabolites, such as glutamine and uracil, was observed to be higher in the Ca Ski cell line compared to the C-33 A and SiHa cells. However, when comparing the concentration of metabolites in HPV 16-positive and -negative cell lines, leucine, isoleucine, valine, lysine, methionine, glutamine, ornithine, choline, glucose, and tryptophan showed statistically significant differences.
Pyrimidines interact with biological macromolecules, such as receptors and enzymes, which are active components of RNA. Among these components, uracil is widely used for the synthesis of biologically relevant compounds in tumor cells [34]. The ketone body 3-hydroxybutyrate was observed to be elevated in ovarian cancer and to be associated with cancer cell invasion and migration [35,36]. Glutamine and glucose are used as building blocks for the assembly of various macromolecules and are considered critical molecules for tumor growth [37]. Glutamine is transformed into glutamate, which promotes TCA anaplerosis to ensure ATP maintenance.
Furthermore, glutamate stimulates the uptake of cysteine, which is then used as an antiporter and expelled into the extracellular milieu. Glutamine also participates in the incorporation of leucine, valine, tyrosine, and phenylalanine, as well as in the creation of substrates for glycosylation reactions and in the synthesis of heparan sulfate [37]. Acetyl-CoA has been reported to possibly be produced from lysine catabolism. Thus, acetyl-CoA can function as an obligate substrate for enzymes that acetylate histones and other proteins, mediating the deposition and removal of epigenetic marks from chromatin [38]. The metabolic state of a cancer cell may not only affect its long-term decision making, but also has the potential to influence the fate of neighboring cells [39]. Cancer cells often face nutrient-poor environments and develop various strategies for utilizing metabolic intermediates to circumvent these limitations, as has been described with metabolite secretion, where metabolites secreted into the extracellular milieu are reused by neighboring cells to enhance further cancer cell metabolism, which actively contributes to the emergence of a more aggressive phenotype [37]. These data suggest that the absence or presence (as well as the density) of HPV 16 DNA integration into cell genomes is key to each metabolomic profile identified, and that changes in exometabolomic profiles may contribute to the persistence of the virus and the process by which HPV 16 infection induces CC [27].
To date, our study is the first to describe the exometabolomic profiles of CC cells, and this comprehensive and specific approach could be useful in discovering new biomarkers for disease diagnosis and prognosis. HPV 16 oncoproteins E6 and E7 are known to modulate exometabolism by increasing the expression of genes that direct metabolic processes [40], including glucose metabolism, fatty acid synthesis, and glutamine metabolism [17,41,42]. Here, using a transcriptomic approach, we validate and correlate the exometabolomic profiles with those from the GSE9750 dataset obtained from the GEO repository; an overexpression of metabolic enzymes was obtained in HPV 16-positive and -negative CC cell lines. We observed that the expression of PGM, PSAT1, ALDOA, HK2, IDH3G, CA9, RPIA, BSG, HMG1, ASL, PGK1, and IDH3B is higher in Ca Ski cells compared with in SiHa and C-33 A cells. When comparing the expression of SiHa cells against Ca Ski and C-33 A cells, we observed that the expression of SLC2A1, TKT, HIF1A, PKM, IDH5, PGM1, SUCLG2, PADI3, ACSL4, SHMT1, SHM2, PDH, PSP, PSPH, IDH, IDH1, ASS, FUM1, IDHG, GLS and PADI4 genes is higher in SiHa cells, while the expression of PFKM, GAPDH, ACC1, SDH2, ICDH, ACLB2, ACCY, ACSS3, PADI2, PGD6, ALDOB, LDHAL6B, IDH2, AACS, CPT1A, ENO1, MDH1, and FASN is higher in C-33 A cells than in Ca Ski and SiHa cells. We also observed that gene overexpression in Ca Ski cells, compared with in C-33 A and SiHa cells, favored the enrichment of amino acid biosynthesis pathways; carbon metabolism, including the TCA cycle; glycolytic metabolism; gluconeogenesis; nitrogen metabolism; arginine biosynthesis; the pentose phosphate pathway; and galactose metabolism. These validated data are in agreement with the pathways that are mostly enriched when relating overexpressed genes and metabolites with higher concentrations of Ca Ski cells. In addition to the pathways mentioned above, pyruvate metabolism and the HIF-1α transcription factor signaling pathway were observed to gain importance in this analysis. It is known that high levels of HIF-1α can be associated with a predictive biomarker of CC [41].
Moreover, in CC, HIF-1α favors reprogramming to glycolytic metabolism and decreases TCA metabolism, as well as oxidative phosphorylation, through an increase in pyruvate concentration, which serves as an intermediate for lactate production [10,42,43,44]. The increase in the TCA pathway has also been suggested to be mediated by amino acids, such as glutamine, and this mechanism has been suggested to favor the production of TCA intermediates for the synthesis of cholesterol and fatty acids [10]. We consider that the high concentration of glutamine excreted by Ca Ski cells may favor TCA metabolism in the cells that comprise the tumor microenvironment, thereby balancing the acquisition of nutrients and biomolecules necessary for tumor maintenance.
On the other hand, the concentration of glucose could be even more inclined to activate the pentose phosphate pathway and consequently to obtain pyrimidine precursors such as uracil [10,34]. The genes overexpressed in HPV 16 cells were observed to favor arginine biosynthesis and to be in line with the metabolites observed in the exometabolomic analysis that favor its synthesis, such as ornithine [45]. Arginine has also been reported to possibly favor cancer progression and maintenance [45] through its epigenetic modifications, which ensure cell survival by regulating epigenetic-mediated gene expression, mRNA splicing, and response to DNA damage [46]. Thus, arginine could be considered an important biomarker in the treatment and diagnosis of CC, as reported in previous studies [45]. These data indicate that the presence and copy number of HPV 16 ensure viral persistence, energy production, and biomass synthesis, which are necessary for tumor progression and maintenance in CC and, consequently, the death of cancer patients.
CC is a serious public health problem, and although vaccination and screening programs have significantly reduced the incidence of CC worldwide by up to >80%, the mortality rate in low-income countries remains high. The search for predictive biomarkers to identify patients at risk of developing CC in a timely manner remains a limitation [47]. In this study, an exploratory exometabolomic approach was used with the primary objective of characterizing the differential metabolomic profile and its relationship with gene expression between HPV 16-positive and -negative cervical cancer (CC) cells. This approach allowed us to preliminarily identify potentially biologically relevant candidate metabolites, which could be validated in future studies with larger sample sizes. However, these findings should be interpreted with caution until confirmed in independent cohorts. Despite this limitation, this initial approach suggests potential diagnostic and prognostic biomarkers, as well as therapeutic targets, in HPV 16-associated CC.

4. Materials and Methods

4.1. Workflow Diagram

The procedure carried out in this work is summarized below in a step-by-step chart (Figure 9).

4.2. Cell Culture

The CC cell lines C-33 A HTB-31™ (negative for human papillomavirus DNA and RNA), SiHa HTB-35™ (HPV 16 positive; 1 to 2 copies of viral DNA integrated into the cell genome), and Ca Ski CRL-1550™ (HPV 16 positive, with approximately 600 copies of viral DNA integrated into the cell genome) were acquired from the ATCC and were cultured in DMEM (Dulbecco’s modified Eagle’s medium) supplemented with 10% fetal bovine serum (Gibco, Life Technologies, Grand Island, NY, USA), and 100 U/mL of penicillin and 100 µg/mL of streptomycin (Gibco, Life Technologies, Grand Island, NY, USA) were added. The cells were maintained at 37 °C in a 5% CO2 atmosphere.

4.3. Sample Preparation and 1H-NMR Acquisition

Metabolomic profiles were obtained using 1H-NMR. The culture medium was transferred to an Eppendorf tube and centrifuged to recover the supernatant, which was frozen in liquid nitrogen and stored at −80 °C until use. At the time of NMR analysis, the samples were thawed on ice. A total of 10% D2O (5 mM TSP, 140 mM Na2HPO4, 0.04% NaN3, pH 7.4) was added and then transferred to an NMR tube to determine the metabolomic profiles using a Bruker Avance II 600 MHz spectrometer (Bruker, Billerica, MA, USA) at 310 K (37 °C) [48,49]. The assignment of the identified metabolites to the exometabolome was determined using Amix v3.9.7 in combination with the Bruker BBIOREFCODE 2.0.0 NMR metabolic profiling database (Bruker Biospin, Rheinstetten, Germany), as well as other existing public databases and literature reports [50,51].

4.4. Multivariate Analysis

1H NMR spectra were integrated using Amix 3.9.7 (Bruker Biospin, Rheinstetten, Germany) in the δ 9.00–0.80 ppm region. The region corresponding to the residual water signal (δ 5.06–4.30 ppm) was excluded from the analysis to avoid interferences arising from differences in water suppression. All intensities from the integrated regions were normalized based on the protein quantity determined in the corresponding samples. The generated intensity tables were imported into SIMCA-P 12.0 software (Umetrics AB, Umeå, Sweden). Before statistical analysis, the data were Pareto-scaled.
PCA was used to examine intrinsic variability within the dataset, to observe clustering or separation trends, and to identify outliers. OPLS-DA was applied to minimize the potential contribution of intergroup variability and to improve the separation between sample groups further. The Centered and scaled regression coefficients (CoeffCS) and their Jack-knife standard error of the coefficients (CoeffCScvSE) computed from all rounds of cross validations were used to discard spectral regions that were redundant or not correlated to the response. With this strategy, only those variables, with a ratio between CoeffCS and CoeffCScvSE > 1, were included in the model. Once applied, the variable selection method, a new OPLS-DA model, was calculated and internal cross validation and permutation tests were performed to evaluate the model obtained. The default 7-fold internal cross-validation method was applied, from which the Q2 (predictive ability parameter, estimated by cross-validation) and R2X (goodness-of-fit parameter) values were extracted. These parameters, the VIP criteria > 1, p < 0.05 along with the corresponding permutation tests (n = 100), were used to assess the quality of the obtained OPLS-DA models. SUS plots were also obtained to assess shared (metabolites aligned with the diagonals) and unique (metabolites aligned with the axes) differences between the two OPLS-DA statistical models.

4.5. Quantitative Metabolite Selection Analysis

The main metabolites contributing to group discrimination in each model were integrated using Amix 3.9.7. The normality of the distribution of variables was assessed using Student’s t-test. A p-value < 0.05 (95% confidence level) was considered statistically significant.

4.6. Gene Expression Analysis

Gene expression analysis was performed using the public functional genomics data repository Gene Expression Omnibus (GEO) (https://www.ncbi.nlm.nih.gov/geo/), which provides tools to help users query and download selected experiments and gene expression profiles [52]. Gene expression profiles of the C-33 A, SiHa, and CaSki cell lines were compared using the GSE9750 dataset (Affymetrix U133A oligonucleotide microarray (Santa Clara, CA, USA)) [21].

4.7. GO, KEGG and GSEA of Differentially Expressed Genes in C-33 A, SiHa, and Ca Ski Cells

Enrichment analysis was performed using the SRplot web server (https://www.bioinformatics.com.cn/srplot) with the access date on 9 January 2025. SRplot integrates all commonly used data visualization and plotting functions with over 2700 citations [53]. The Gene Ontology (GO) database (http://geneontology.org/), the Kyoto Encyclopedia of Genes and Genomes (KEGG) database (http://www.kegg.jp/kegg/kegg1.html (accessed on 25 June 2025) and the Gene Set Enrichment Analysis (GSEA) database (https://www.gsea-msigdb.org/gsea (accessed on 30 June 2025)) were employed for pathway enrichment analysis of differentially expressed genes, which facilitated the annotation of their biological functions and molecular mechanisms. To differentiate the enriched and common pathways in the different cellular models, Venn diagrams were created using the Venny 2.0 web server (https://bioinfogp.cnb.csic.es/tools/venny/index2.0.2.html (accessed on 30 June 2025)). Significant enrichment parameters were defined as |NES|>1, NOM p.adjust < 0.05, and FDR q value < 0.25. The metabolic pathways enriched by the effect of HPV 16 were created by integrating the dataset of metabolites and genes that increase their concentration and expression, respectively, in the Ca Ski cell lines. The analysis was performed on the MetaboAnalyst 6.0 web platform, which allows the integration of metabolomic data, their interpretation, and integration with other omic data from a statistical and functional context (https://www.metaboanalyst.ca/MetaboAnalyst/home.xhtml (accessed on 14 July 2025)) [22]. The pathways with the highest enrichment were defined based on the Hits and p-value.

4.8. Statistical Analysis of Gene Expression

Gene expression of the C-33 A, SiHa, and CaSki cell lines was analyzed using the GSE9750 dataset (Affymetrix U133A oligonucleotide microarray (Santa Clara, CA, USA)). Gene expression data were calculated from data processed by Scotto et al. [21]. Signal intensity values were obtained using the perfect match/mismatch (PM/MM) difference model, followed by within-chip and between-chip signal normalization using model-based expression. Data were processed using the SRplot web server (https://www.bioinformatics.com.cn/srplot) (accessed on 20 July 2025)). Default parameters from several databases were used for statistical analysis in this study. Differential data were visualized using the ggplot2 package. Statistical differences in metabolite intensities were calculated using Student’s t-test. A * p < 0.05, ** p < 0.01, *** p < 0.001 value was used.

5. Conclusions

In conclusion, this study demonstrated the impacts of HPV 16 on the exometabolomic profile and gene expression patterns of CC cell lines. Our findings indicate that HPV 16 infection and its integrated copy number differentially deregulate cellular processes, resulting in distinct exometabolomic and transcriptomic signatures. HPV 16-positive cell lines exhibited elevated concentrations of leucine, isoleucine, valine, lysine, methionine, glutamine, ornithine, choline, glucose, and tryptophan. These metabolic alterations were associated with the upregulation of genes involved in metabolic reprogramming, including aminoacyl-tRNA biosynthesis, the pentose phosphate pathway, amino acid metabolism, glycolysis, the tricarboxylic acid cycle, nitrogen metabolism, starch and sucrose metabolism, galactose metabolism, glutathione metabolism, aspartate and glutamate metabolism, and nucleotide biosynthesis through the folate-mediated one-carbon pool. Collectively, these findings highlight metabolites and metabolism-associated genes that may serve as robust, non-invasive diagnostic and prognostic biomarkers, as well as potential therapeutic targets for HPV 16-related CC. Furthermore, these insights may be extended to the evaluation, monitoring, and therapeutic response of patients with CC.

Author Contributions

Conceptualization, J.O.-O. and A.A.-I.; methodology, A.A.-I., N.N.-T., H.J.-W., E.G.S.-B. and M.E.A.-Q.; validation, J.O.-O. and N.N.-T.; formal analysis, A.A.-I.; investigation, A.A.-I., G.E.C.-V., E.G.S.-B. and M.E.A.-Q.; resources, B.I.-A. and M.A.L.-V.; data curation, A.A.-I.; writing—original draft preparation, A.A.-I., J.O.-O. and N.N.-T.; writing—review and editing, A.A.-I., J.O.-O. and N.N.-T.; visualization, A.A.-I.; supervision, J.O.-O. and N.N.-T.; project administration, J.O.-O.; funding acquisition, J.O.-O. All authors have read and agreed to the published version of the manuscript.

Funding

This research was supported by SEP-CONACYT CB-2017-2018 A1-S-43704.

Institutional Review Board Statement

Not applicable.

Informed Consent Statement

Not applicable.

Data Availability Statement

The links to the expression data were posted in the Section 4.

Acknowledgments

In memory of Napoleón Navarro Tito, originally from Malinaltepec Guerrero, Mexico, a researcher at the Faculty of Chemical and Biological Sciences at UAGro, colleague, and a great friend. Rest in peace. We thank Ricardo Salazar López for his collaboration in this work. We thank the Drug Development and Innovation Support Unit of the La Fe Health Research Institute for their support in the design and execution of the MNR metabolomics experiments.

Conflicts of Interest

The authors declare no conflicts of interest. The funders had no role in the design of the study; in the collection, analyses, or interpretation of data; in the writing of the manuscript; or in the decision to publish the results.

Abbreviations

The following abbreviations are used in this manuscript:
CCCervical cancer
HPV 16Human papillomavirus 16
HPV-HRHigh-risk HPVs
1H-NMR1H nuclear magnetic resonance
VHLvon Hippel–Lindau
GEOGene Expression Omnibus
HIF-1αHypoxia-inducible factor-1α
KEGGKyoto Encyclopedia of Genes and Genomes
PCAPrincipal component analysis
GOGene Ontology
OPLS-DAOrthogonal Partial Least Squares Discriminant Analysis
PGMPhosphoglucomutase
PSAT1Phosphoserine Aminotransferase 1
ALDOA, BAldolase A and B
HK2Hexokinase 2
IDH3GIsocitrate Dehydrogenase (NAD(+)) 3 Non-Catalytic Subunit Gamma
CA9Carbonic Anhydrase 9
RPIARibose 5-Phosphate Isomerase A
BSGBasigin
HMG1High Mobility Group Box 1
ASLArgininosuccinate Lyase
PGK1Phosphoglycerate Kinase 1
IDH3BIsocitrate Dehydrogenase (NAD(+)) 3 Non-Catalytic Subunit Beta
ACSL3, 4Acyl-CoA Synthetase Long-Chain Family Member 3 and 4
PADI2, 3, 4Peptidyl Arginine Deiminase 2, 3 and 4
SUCLG2Succinate-CoA Ligase GDP-Forming Subunit Beta
PGM1Phosphoglucomutase 1
IDH1, 2 and 5Isocitrate Dehydrogenase 1, 2 and 5
PKMPyruvate Kinase M1/2
HIF1AHypoxia Inducible Factor 1 Subunit Alpha
TKTTransketolase
SLC2A1Solute Carrier Family 2 Member 1
GLUD1Glutamate Dehydrogenase 1
PHGDHPhosphoglycerate Dehydrogenase
SHMT1Serine Hydroxymethyltransferase 1
SHM2Serine Hydroxymethyltransferase 2
PDHPyruvate Dehydrogenase
PSPHPhosphoserine Phosphatase
ASSArgininosuccinate Synthase
FUM1Fumarate hydratase 1
IDHGIsocitrate Dehydrogenase Gamma
GLSGlutaminase
HMG1High Mobility Group 1
PFKFB26-Phosphofructo-2-Kinase/Fructose-2,6-Biphosphatase 2
ACSM2BAcyl-CoA Synthetase Medium-Chain Family Member 2B
PADI1Peptidyl Arginine Deiminase 1
PFKMPhosphofructokinase, Muscle
GAPDHGlyceraldehyde-3-Phosphate Dehydrogenase
ACC1Acetyl-CoA carboxylase 1
SDH2Succinate Dehydrogenase 2 or B
ICDHIsocitrate Dehydrogenase
ACLB2ATP-citrate synthase beta chain protein 2
ACCYPyruvate oxidase/decarboxylase
ACSS3Acyl-CoA Synthetase Short Chain Family Member 3
PGD6phosphogluconate dehydrogenase 6
LDHAL6BLactate Dehydrogenase A-Like 6B
AACSAcetoacetyl-CoA Synthetase
CPT1ACarnitine Palmitoyltransferase 1A
ENO1Enolase 1
MDH1Malate Dehydrogenase 1
FASNFatty Acid Synthase

References

  1. Bray, F.; Ferlay, J.; Soerjomataram, I.; Siegel, R.L.; Torre, L.A.; Jemal, A. Global cancer statistics 2018: GLOBOCAN estimates of incidence and mortality worldwide for 36 cancers in 185 countries. CA Cancer J. Clin. 2018, 68, 394–424. [Google Scholar] [CrossRef]
  2. Arbyn, M.; Weiderpass, E.; Bruni, L.; de Sanjosé, S.; Saraiya, M.; Ferlay, J.; Bray, F. Estimates of incidence and mortality of cervical cancer in 2018: A worldwide analysis. Lancet Glob. Health 2020, 8, e191–e203. [Google Scholar] [CrossRef]
  3. de Villiers, E.-M.; Fauquet, C.; Broker, T.R.; Bernard, H.-U.; zur Hausen, H. Classification of papillomaviruses (HPV). Virology 2004, 324, 17–27. [Google Scholar] [CrossRef]
  4. Doorbar, J.; Quint, W.; Banks, L.; Bravo, I.G.; Stoler, M.; Broker, T.R.; Stanley, M.A. The biology and life-cycle of human papillomaviruses. Vaccine 2012, 30, F55–F70. [Google Scholar] [CrossRef] [PubMed]
  5. Harden, M.E.; Munger, K. Human papillomavirus molecular biology. Mutat. Res.-Rev. Mutat. Res. 2017, 772, 3–12. [Google Scholar] [CrossRef] [PubMed]
  6. Estêvão, D.; Costa, N.R.; da Costa, R.M.G.; Medeiros, R. Hallmarks of HPV carcinogenesis: The role of E6, E7 and E5 oncoproteins in cellular malignancy. Biochim. Biophys. Acta-Gene Regul. Mech. 2019, 1862, 153–162. [Google Scholar] [CrossRef]
  7. Muñoz, N. New perspective for cervical cancer prevention based on human papilloma virus. Biomed. Rev. Inst. Nac. Salud 2007, 26, 471–474. [Google Scholar]
  8. Lizano, M.; Berumen, J.; García-Carrancá, A. HPV-related Carcinogenesis: Basic Concepts Viral Types and Variants. Arch. Med. Res. 2009, 40, 428–434. [Google Scholar] [CrossRef]
  9. Hay, N. Reprogramming glucose metabolism in cancer: Can it be exploited for cancer therapy? Nat. Rev. Cancer 2016, 16, 635–649. [Google Scholar] [CrossRef] [PubMed]
  10. Hanahan, D.; Weinberg, R.A. Hallmarks of cancer: The next generation. Cell 2011, 144, 646–674. [Google Scholar] [CrossRef] [PubMed]
  11. Soga, T. Cancer metabolism: Key players in metabolic reprogramming. Cancer Sci. 2013, 104, 275–281. [Google Scholar] [CrossRef]
  12. Pinheiro, C.; Garcia, E.A.; Morais-Santos, F.; Scapulatempo-Neto, C.; Mafra, A.; Steenbergen, R.D.M.; Boccardo, E.; Villa, L.L.; Baltazar, F.; Longatto-Filho, A. Lactate transporters and vascular factors in HPV-induced squamous cell carcinoma of the uterine cervix. BMC Cancer 2014, 14, 751. [Google Scholar] [CrossRef]
  13. Abudula, A.; Rouzi, N.; Xu, L.; Yang, Y.; Hasimu, A. Tissue-based metabolomics reveals potential biomarkers for cervical carcinoma and HPV infection. Bosn. J. Basic Med. Sci. 2020, 5, 78–87. [Google Scholar] [CrossRef]
  14. Li, B.; Sui, L. Metabolic reprogramming in cervical cancer and metabolomics perspectives. Nutr. Metab. 2021, 18, 93. [Google Scholar] [CrossRef]
  15. Arizmendi-Izazaga, A.; Navarro-Tito, N.; Jiménez-Wences, H.; Evaristo-Priego, A.; Priego-Hernández, V.D.; Dircio-Maldonado, R.; Zacapala-Gómez, A.E.; Mendoza-Catalán, M.Á.; Illades-Aguiar, B.; De Nova Ocampo, M.A.; et al. Bioinformatics Analysis Reveals E6 and E7 of HPV 16 Regulate Metabolic Reprogramming in Cervical Cancer, Head and Neck Cancer, and Colorectal Cancer Through the PHD2-VHL-CUL2-ELOC-HIF-1α Axis. Curr. Issues Mol. Biol. 2024, 46, 6199–6222. [Google Scholar] [CrossRef]
  16. Martínez-Ramírez, I.; Carrillo-García, A.; Contreras-Paredes, A.; Ortiz-Sánchez, E.; Cruz-Gregorio, A.; Lizano, M. Regulation of cellular metabolism by high-risk human papillomaviruses. Int. J. Mol. Sci. 2018, 19, 1839. [Google Scholar] [CrossRef]
  17. Arizmendi-Izazaga, A.; Navarro-Tito, N.; Jiménez-Wences, H.; Mendoza-Catalán, M.A.; Martínez-Carrillo, D.N.; Zacapala-Gómez, A.E.; Olea-Flores, M.; Dircio-Maldonado, R.; Torres-Rojas, F.I.; Soto-Flores, D.G.; et al. Metabolic reprogramming in cancer: Role of hpv 16 variants. Pathogens 2021, 10, 347. [Google Scholar] [CrossRef]
  18. Karekar, A.K.; Dandekar, S.P. Cancer metabolomics: A tool of clinical utility for early diagnosis of gynaecological cancers. Indian J. Med. Res. 2021, 154, 787–796. [Google Scholar] [CrossRef] [PubMed]
  19. Dunn, W.B.; Bailey, N.J.C.; Johnson, H.E. Measuring the metabolome: Current analytical technologies. Analyst 2005, 130, 606–625. [Google Scholar] [CrossRef] [PubMed]
  20. Li, X.; Zhang, L.; Huang, X.; Peng, Q.; Zhang, S.; Tang, J.; Wang, J.; Gui, D.; Zeng, F. High-throughput metabolomics identifies new biomarkers for cervical cancer. Discov. Oncol. 2024, 15, 9. [Google Scholar] [CrossRef] [PubMed]
  21. Scotto, L.; Gopeshwar, N.; Nandula, S.V.; Arias-Pulido, H.; Subramaniyam, S.; Schneider, A.; Kaufmann, A.M.; Wright, J.D.; Pothuri, B.; Mansukhani, M.; et al. Identification of Copy Number Gain and Overexpressed Genes on Chromosome Arm 20q by an Integrative Genomic Approach in Cervical Cancer: Potential Role in Progression. Genes Chromosomes Cancer 2008, 47, 755–765. [Google Scholar] [CrossRef]
  22. Pang, Z.; Lu, Y.; Zhou, G.; Hui, F.; Xu, L.; Viau, C.; Spigelman, A.F.; Macdonald, P.E.; Wishart, D.S.; Li, S.; et al. MetaboAnalyst 6.0: Towards a unified platform for metabolomics data processing, analysis and interpretation. Nucleic Acids Res. 2024, 52, W398–W406. [Google Scholar] [CrossRef]
  23. Warburg, O.; Wind, F.; Negelein, E.I. Killing-Off of Tumor Cells In Vitro. J. Gen. Physiol. 1927, 8, 519–530. [Google Scholar] [CrossRef]
  24. Kell, D.B.; Brown, M.; Davey, H.M.; Dunn, W.B.; Spasic, I.; Oliver, S.G. Metabolic footprinting and systems biology: The medium is the message. Nat. Rev. Microbiol. 2005, 3, 557–565. [Google Scholar] [CrossRef]
  25. Xu, H.; Liu, M.; Song, Y.; Liu, L.; Xu, F.; Chen, J.; Zhan, H.; Zhang, Y.; Chen, Y.; Lu, M.; et al. Metabolomics variation profiling of vaginal discharge identifies potential targets for cervical cancer early warning. Acta Biochim. Biophys. Sin. 2022, 54, 1561–1565. [Google Scholar] [CrossRef] [PubMed]
  26. Zhou, H.; Li, Q.; Wang, T.; Liang, H.; Wang, Y.; Duan, Y.; Song, M.; Wang, Y. Exploring metabolomics biomarkers for evaluating the effectiveness of concurrent radiochemotherapy for cervical cancers. Transl. Cancer Res. 2020, 9, 2734–2747. [Google Scholar] [CrossRef] [PubMed]
  27. Chen, A.; Xu, M.; Chen, J.; Chen, T.; Wang, Q.; Zhang, R.; Qiu, J. Plasma-Based Metabolomics Profiling of High-Risk Human Papillomavirus and their Emerging Roles in the Progression of Cervical Cancer. BioMed Res. Int. 2022, 2022, 6207701. [Google Scholar] [CrossRef]
  28. Vuckovic, D. Current trends and challenges in sample preparation for global metabolomics using liquid chromatography-mass spectrometry. Anal. Bioanal. Chem. 2012, 403, 1523–1548. [Google Scholar] [CrossRef]
  29. Priego-Hernández, V.D.; Arizmendi-Izazaga, A.; Soto-Flores, D.G.; Santiago-Ramón, N.; Feria-Valadez, M.D.; Navarro-Tito, N.; Jiménez-Wences, H.; Martínez-Carrillo, D.N.; Salmerón-Bárcenas, E.G.; Leyva-Vázquez, M.A.; et al. Expression of HIF-1α and Genes Involved in Glucose Metabolism Is Increased in Cervical Cancer and HPV-16-Positive Cell Lines. Pathogens 2023, 12, 33. [Google Scholar] [CrossRef] [PubMed]
  30. Echelman, D.; Feldman, S. Management of cervical precancers: A global perspective, Hematol. Oncol. Clin. N. Am. 2012, 26, 31–44. [Google Scholar] [CrossRef]
  31. Kim, M.A.; Oh, J.K.; Kim, B.W.; Chay, D.; Park, D.C.; Kim, S.M.; Kang, E.S.; Kim, J.H.; Cho, C.H.; Shin, H.R.; et al. Prevalence and seroprevalence of low-risk human papillomavirus in Korean women. J. Korean Med. Sci. 2012, 27, 922–928. [Google Scholar] [CrossRef]
  32. Fontenelle, L.J.; Henderson, J.F. Sources of nitrogen as rate-limiting factors for purine biosynthesis de novo tn ehrlich ascites tumor cells. Biochim. Biophys. Acta 1969, 77, 88–93. [Google Scholar] [CrossRef] [PubMed]
  33. Gaglio, D.; Soldati, C.; Vanoni, M.; Alberghina, L.; Chiaradonna, F. Glutamine Deprivation Induces Abortive S-Phase Rescued by Deoxyribonucleotides in K-Ras Transformed Fibroblasts. PLoS ONE 2009, 4, e4715. [Google Scholar] [CrossRef]
  34. Ramesh, D.; Vijayakumar, B.G.; Kannan, T. Therapeutic potential of uracil and its derivatives in countering pathogenic and physiological disorders. Eur. J. Med. Chem. 2020, 207, 112801. [Google Scholar] [CrossRef] [PubMed]
  35. Hilvo, M.; De Santiago, I.; Gopalacharyulu, P.; Schmitt, W.D.; Budczies, J.; Kuhberg, M. Accumulated metabolites of hydroxybutyric acid serve as diagnostic and prognostic biomarkers of ovarian high-grade serous carcinomas. Cancer Res. 2015, 4, 796–804. [Google Scholar] [CrossRef] [PubMed]
  36. Vettukattil, R.; Eline, T.; Ann, V.; Kærn, J.; Davidson, B.; Bathen, T.F. Proton magnetic resonance metabolomic characterization of ovarian serous carcinoma effusions: Chemotherapy-related effects and comparison with malignant mesothelioma and breast carcinoma. Hum. Pathol. 2013, 9, 1859–1866. [Google Scholar] [CrossRef]
  37. Pavlova, N.N.; Thompson, C.B. The Emerging Hallmarks of Cancer Metabolism. Cell Metab. 2016, 23, 27–47. [Google Scholar] [CrossRef]
  38. Katada, S.; Imhof, A.; Sassone-corsi, P. Essay Connecting Threads: Epigenetics and Metabolism. Cell 2012, 148, 24–28. [Google Scholar] [CrossRef]
  39. Kalyanaraman, B. Teaching the basics of cancer metabolism: Developing antitumor strategies by exploiting the differences between normal and cancer cell metabolism. Redox Biol. 2017, 12, 833–842. [Google Scholar] [CrossRef]
  40. Jang, M.; Rhee, J.E.; Jang, D.H.; Kim, S.S. Gene Expression Profiles are Altered in Human Papillomavirus-16 E6 D25E-Expressing Cell Lines. Virol. J. 2011, 8, 6–11. [Google Scholar] [CrossRef]
  41. Ortiz-Pedraza, Y.; Muñoz-Bello, J.O.; Ramos-Chávez, L.A.; Martínez-Ramírez, I.; Olmedo-Nieva, L.; López-Saavedra, A.; Manzo-Merino, J.; la Cruz, V.P.-D.; Lizano, M. HPV16 E6 and E7 Oncoproteins Stimulate the Glutamine Pathway Maintaining Cell Proliferation in a SNAT1-Dependent Fashion. Viruses 2023, 15, 324. [Google Scholar] [CrossRef]
  42. Cuninghame, S.; Jackson, R.; Lees, S.J.; Zehbe, I. Two common variants of human papillomavirus type 16 E6 differentially deregulate sugar metabolism and hypoxia signalling in permissive human keratinocytes. J. Gen. Virol. 2017, 98, 2310–2319. [Google Scholar] [CrossRef]
  43. Mulukutla, B.C.; Yongky, A.; Le, T.; Mashek, D.G.; Hu, W.S. Regulation of Glucose Metabolism—A Perspective From Cell Bioprocessing. Trends Biotechnol. 2016, 34, 638–651. [Google Scholar] [CrossRef]
  44. Guo, Y.; Meng, X.; Ma, J.; Zheng, Y.; Wang, Q.; Wang, Y.; Shang, H. Human papillomavirus 16 E6 contributes HIF-1α induced warburg effect by attenuating the VHL-HIF-1α interaction. Int. J. Mol. Sci. 2014, 15, 7974–7986. [Google Scholar] [CrossRef] [PubMed]
  45. Qiu, F.; Huang, J.; Sui, M. Targeting arginine metabolism pathway to treat arginine-dependent cancers. Cancer Lett. 2015, 364, 1–7. [Google Scholar] [CrossRef] [PubMed]
  46. Jarrold, J.; Davies, C.C. PRMTs and Arginine Methylation: Cancer’s Best-Kept Secret? Trends Mol. Med. 2019, 25, 993–1009. [Google Scholar] [CrossRef]
  47. Lizano, M.; Carrillo-García, A.; de la Cruz-Hernández, E.; Castro-Muñoz, L.J.A. Contreras-Paredes, Promising predictive molecular biomarkers for cervical cancer (Review). Int. J. Mol. Med. 2024, 53, 50. [Google Scholar] [CrossRef]
  48. Puchades-Carrasco, L.; Jantus-Lewintre, E.; Pérez-Rambla, C.; García-García, F.; Lucas, R.; Calabuig, S.; Blasco, A.; Dopazo, J.; Camps, C.; Pineda-Lucena, A. Serum metabolomic profiling facilitates the non-invasive identification of metabolic biomarkers associated with the onset and progression of non-small cell lung cancer. Oncotarget 2016, 7, 12904. [Google Scholar] [CrossRef]
  49. Nicholson, J.K.; Foxall, P.J.D.; Spraul, M.; Farrant, R.D.; Lindon, J.C. 750 MHz 1H and 1H-13C NMR Spectroscopy of Human Blood Plasma. Anal. Chem. 1995, 67, 793–811. [Google Scholar] [CrossRef] [PubMed]
  50. Guan, W.; Zhou, M.; Hampton, C.Y.; Benigno, B.B.; Walker, L.D.E.; Gray, A.; McDonald, J.F.; Fernández, F.M. Ovarian cancer detection from metabolomic liquid chromatography/mass spectrometry data by support vector machines. BMC Bioinform. 2009, 10, 259. [Google Scholar] [CrossRef]
  51. Wang, L.; Tang, Y.; Liu, S.; Mao, S.; Ling, Y.; Liu, D.; He, X.; Wang, X. Metabonomic Profiling of Serum and Urine by 1H NMR-Based Spectroscopy Discriminates Patients with Chronic Obstructive Pulmonary Disease and Healthy Individuals. PLoS ONE 2013, 8, e65675. [Google Scholar] [CrossRef] [PubMed]
  52. Clough, E.; Barrett, T.; Wilhite, S.E.; Ledoux, P.; Evangelista, C.; Kim, I.F.; Tomashevsky, M.; Marshall, K.A.; Phillippy, K.H.; Sherman, P.M.; et al. NCBI GEO: Archive for gene expression and epig enomics data sets: 23-year update. Nucleic Acids Res. 2024, 52, D138–D144. [Google Scholar] [CrossRef] [PubMed]
  53. Tang, D.; Chen, M.; Huang, X.; Zhang, G.; Zeng, L.; Zhang, G.; Wu, S.; Wang, Y. SRplot: A free online platform for data visualization and graphing. PLoS ONE 2023, 18, e0294236. [Google Scholar] [CrossRef] [PubMed]
Figure 1. Assignment of metabolites in a typical H-CPMG spectrum of culture medium. The water signal has been excluded from the spectrum. The region of the spectrum between 5 and 9 ppm has been expanded. The assignment of metabolites is: (1) Leucine (left 0.97 ppm and right 0.94 ppm); (2) Valine (left 0.99, 1.05 ppm and right 0.97, 1.01 ppm); (3) Isoleucine (left 1.01 ppm and right 0.99 ppm); (4) Propylene glycol (left 1.12 ppm and right 1.10 ppm); (5) Ethanol (left 1.20, 3.68 ppm and right 1.17, 3.62 ppm); (6) 3 Hydroxybuyrate (left 1.22 ppm and right 1.20 ppm); (7) 3-hydroxyisovalerate (left 1.28 ppm and right 1.27 ppm); (8) Lactate (left 1.34, 4.13 ppm and right 1.29, 4.07 ppm); (9) Alanine (left 1.50 ppm and right 1.45 ppm); (10) Lysine (left 1.75, 3.03 ppm and right 1.70, 3.01 ppm); (11) Acetate (left 1.93 ppm and right 1.89 ppm); (12) Glutamate (left 2.08, 2.35 ppm and right 2.04, 2.32 ppm); (13) Methionine (left 2.14, 2.66 ppm and right 2.12, 2.62 ppm); (14) Acetone (left 2.23 ppm and right 2.21 ppm); (15) Pyruvate (left 2.37 ppm and right 2.35 ppm); (16) Pyroglutamate (left 2.39, 2.53, 4.19 ppm and right 2.37, 2.47, 4.14 ppm); (17) Glutamine (left 2.45 ppm and right 2.43 ppm); (18) Citrate (left 2.67 ppm and right 2.66 ppm); (19) 2-oxoglutarate (left 2.99 ppm and right 2.97 ppm); (20) Ornithine (left 3.05 ppm and right 3.04 ppm); (21) Choline (left 3.19 ppm and right 3.18 ppm); (22) Methanol (left 3.37 ppm and right 3.32 ppm); (23) Glucose (left 3.91, 5.24 ppm and right 3.21, 5.19 ppm); (24) Glycine (left 3.56 ppm and right 3.55 ppmc; (25) Isopropanol (left 4.04 ppm and right 3.99 ppm); (26) Threonine (left 4.27 ppm and right 4.23 ppm); (27) Uracil (left 5.81 ppm and right 5.78 ppm); (28) Fumarate (left 6.52 ppm and right 6.49 ppm); (29) Tyrosine (left 6.93, 7.22 ppm and right 6.86, 7.15 ppm); (30) Histidine (left 7.11, 7.87 ppm and right 7.05, 7.82 ppm); (31) Phenylalanine (left 7.47 ppm and right 7.30 ppm); (32) Tryptophan (left 7.55, 7.75 ppm and right 7.52, 7.70 ppm); (33) Formate (left 8.48 ppm and right 8.42 ppm); (34) Nicotinate (left 8.62 ppm and right 8.58 ppm).
Molecules 30 03909 g001
Figure 2. Principal component analysis (PCA) score plot off medium global metabolic profile of SiHa (red ), Ca Ski (blue ), and C-33 A (green ) cell lines. Principal Component 1 (PC1 65.2%) is plotted vs. Principal Component 2 (PC2 17.3%).
Molecules 30 03909 g002
Figure 3. Orthogonal Partial Least Squared Discriminant Analysis (OPLS-DA) score plots for the comparison between: (a) C-33 A vs. Ca Ski, (b) C-33 A vs. SiHa and (c) Ca Ski vs. SiHa. In panels (ac), the green color () represents the C-33 A cell line, in blue color () the Ca Ski cell line, and in red color () the SiHa cell line. (d) OPLS-DA score plots of comparison between HPV 16-positive (green ) and HPV 16-negative (blue ) cells. (e) Loading plot of OPLS-DA score plot.
Molecules 30 03909 g003
Figure 4. SUS-plot graphs of comparison of OPLS-DA models of the negative HPV 16 cell line (C-33 A cells) and both positive HPV 16 cell lines (SiHa and Ca Ski). (a) SUS-plot plots of comparison of OPLS-DA models between C-33 A vs. Ca Ski and C-33 A vs. SiHa. (b) SUS-plot between C-33 A vs. Ca Ski and C-33 A vs. SiHa considering only the metabolites with a VIP greater than 1.5 and are common between both models.
Molecules 30 03909 g004
Figure 5. Concentration of metabolites in the C-33 A, SiHa, and Ca Ski cell lines. The logarithmic bar graph in (a) represents the intensity of the metabolites in the three cell groups: C-33 A (green bars), Ca Ski (blue bars), and SiHa (red bars). The logarithmic bar graph in (b) represents the intensity of the metabolites when comparing HPV 16 positive (SiHa and Ca Ski) and negative (C-33 A) cell lines. The intensity of the metabolites was analyzed in GraphPad Prism 8 software using Student’s t test. ns (not significant). Statistical significance: * p < 0.05, ** p < 0.01.
Molecules 30 03909 g005
Figure 6. Expression and general biological functions in the cervical cancer cell lines C-33 A (in green), SiHa (in blue), and Ca Ski (in pink). In (a) differential gene expression between C-33 A, SiHa, and Ca Ski is depicted in the heat map. Panel (b) represents GO analysis from differentially expressed genes in C-33 A, SiHa, and Ca Ski. The colored bars represent the Gene Ontology for molecular functions (MF), molecular components (MC), and biological processes (BP). In (c), the cnetplot corresponding to the pathways mainly enriched by genes expressed in C-33 A, SiHa, and Ca Ski is represented. The colored lines correspond to the categories of each pathway, and the genes involved in each enriched pathway are shown. In (d), a score dotplot is shown representing the metabolic pathways enriched by genes expressed in C-33 A, SiHa, and Ca Ski cell lines. The size and color of the circles represent the proportion of enrichment. Graphs were obtained from analysis in the KEGG, GO, and GSA databases. The plots were obtained from SRplot. Significant enrichments were defined as |NES| > 1, NOM p. adjust < 0.05, and FDR q value < 0.25.
Molecules 30 03909 g006
Figure 7. Pathway enrichment analysis of differentially expressed genes in C-33 A, SiHa, and Ca Ski cells. Panels (ac) represent the metabolic pathways with the highest enrichment when comparing C-33 A vs. SiHa/Ca Ski, SiHa vs. C-33 A/Ca Ski, and Ca Ski vs. C-33 A/SiHa, respectively. In (d), the Venn diagram integrates the commonly enriched pathways in C-33 A vs. SiHa/Ca Ski (pink), SiHa vs. C-33 A/Ca Ski (blue), and Ca Ski vs. C-33 A/SiHa (green). Numbers represent common and specific pathways in the three cell lines. Graphs were obtained from the analysis in the KEGG and GSA databases. Graphs and Ven diagram were obtained from SRplot. Significant enrichments were defined as |NES| > 1, NOM p. adjust < 0.05, and FDR q value < 0.25.
Molecules 30 03909 g007
Figure 8. Metabolic pathways favored by the effect of HPV 16. (a) Enrichment of metabolic pathways favored by HPV 16. The overview shows all matching pathways according to the p-values from the pathway enrichment analysis and the impact values from the pathway topology analysis. Each node represents a metabolic pathway, nodes colored red and numbered 1 to 14 represent metabolic pathways with a p-value > 0.05. (1) Aminoacyl-tRNA biosynthesis; (2) Pentose phosphate pathway; (3) Arginine biosynthesis; (4) Valine, leucine and isoleucine biosynthesis; (5) Glycolysis or Gluconeogenesis; (6) Neomycin, kanamycin and gentamicin biosynthesis; (7) Citrate cycle (TCA cycle); (8) Nitrogen metabolism; (9) Glycine, serine and threonine metabolism; (10) Starch and sucrose metabolism; (11) Galactose metabolism; (12) Glutathione metabolism; (13) Alanine, aspartate and glutamate metabolism and (14) One carbon pool by folate. (b) The integration of the metabolic pathways favored by HPV 16 is shown. The diagram was constructed by synthesizing the metabolic pathways presented in panel (a), and each pathway represented by a node was retrieved from the KEGG database.
Molecules 30 03909 g008
Figure 9. The figure represents the sequential graph of the steps, decisions and processes of a workflow.
Molecules 30 03909 g009
Table 1. Intensities and significant variations in metabolites were found in the culture medium where C-33 A, SiHa, and Ca Ski cell lines were cultured.
MetaboliteIntegration AreaT-Test SiHa vs. CaSkiT-Test C-33 A vs. SiHaT-Test C-33 A vs. CaSkiT-Test HPV− vs. HPV+
Leucine0.9442–0.96760.24070.06790.10180.0204 *
Isoleucine0.9889–1.01370.25560.07720.12140.0269 *
Valine1.0141–1.04190.28490.11500.14680.0313 *
3-hydroxybutyrate1.1986–1.22220.31570.35160.89380.5077
3-hydroxyisovalerate1.2505–1.25950.15390.83540.17210.3751
Alanine1.4511–1.49350.30360.14590.22760.0724
Lysine1.6981–1.73690.20920.10810.22520.0458 *
Acetic acid1.8904–1.92260.21930.63370.18970.3280
Methionine2.1293–2.13330.11890.05840.13620.0296 *
Glutamate2.3255–2.35340.25760.25030.94400.2456
Pyruvate2.3586–2.36810.27420.25590.75780.2140
Glutamine2.4254–2.45710.0153 *0.0039 **0.27790.0358 *
Citrate2.6594–2.67410.32860.36810.85660.4766
2-oxoglutarate2.9752–3.00560.20670.26350.47240.3942
Ornithine3.0491–3.07550.97190.21480.09460.0217*
Choline3.1807–3.19530.18250.10000.11300.0364 *
Glycine3.546–3.55830.30190.16190.22080.0536
Lactate4.0728–4.1330.23130.30540.37100.4316
Pyroglutamate4.142–4.1870.25020.28990.77990.4000
Threonine4.2218–4.27530.16450.19090.77170.3239
Glucose5.2005–5.25060.13870.23390.0288 *0.0498 *
Uracil5.7844–5.80880.46960.0462 *0.07730.0637
Fumarate6.5–6.51420.33420.25780.48480.1814
Tyrosine6.8701–6.92020.28010.16600.29710.0771
Histidine7.0391–7.10080.30130.18750.39530.1051
Phenylalanine7.3529–7.4430.25710.15430.24250.0647
Tryptophan7.7141–7.7410.35510.13910.16290.0390 *
Formate8.4346–8.45650.43520.29270.35670.1388
Nicotinate8.589–8.61140.52530.54270.15560.2038
Bold letters highlight metabolites with significant differences when compared between cell groups using Student’s t tests. Metabolites with significant differences were obtained by multiple comparison of the FDR between cell line culture media. Statistical significance: * p < 0.05, ** p < 0.01.
Disclaimer/Publisher’s Note: The statements, opinions and data contained in all publications are solely those of the individual author(s) and contributor(s) and not of MDPI and/or the editor(s). MDPI and/or the editor(s) disclaim responsibility for any injury to people or property resulting from any ideas, methods, instructions or products referred to in the content.