Abstract
Wastewater containing synthetic dyes harmful to aquatic environments supposes significant challenges for treatment. This study focuses on how structural characteristics of three N-containing carbons synthesized at high temperatures from polyacrylonitrile (PAN) as a precursor, i.e., an N-doped (PAN-C), an activated carbon (PAN-C-Act), and a carbon also incorporating sulfur (PAN-S-C), influence adsorption of a common dye employed for wood veneers (Red GRA 200%). The impact of pH (1.9–2.3, 6.0–6.8, and 11.8–12.6), adsorbent dosage (S/L, 0.43–0.53 and 1.73–1.91 g L−1), and amount of dye (24–28 mg L−1 and 231–285 mg L−1) on dye removal from aqueous solutions were investigated. In general, the results obtained in the present work indicate that the presence of larger pores in the materials plays an important role in dye adsorption by preventing size exclusion of the dye molecules. The activated carbon (PAN-C-Act) demonstrated the greatest adsorption performance, with an adsorption yield close to 100% achieved at a carbon dose of 0.47 g L−1 and acidic pH for the highest dye concentration and longest experiment time. The pseudo-second-order model best described the kinetics, and both external mass transfer and intra-particle diffusion were confirmed.
1. Introduction
Water pollution is an actual issue that is increasing daily [1,2]. Therefore, the presence of harmful compounds such as metals, dyes, and pharmaceuticals in untreated industrial effluents that end up in our rivers, lakes, and oceans represents a serious environmental problem. Numerous process industries across various sectors generate substantial amounts of colored wastewater [3]. In particular, dyeing and finishing processes in the textile industry are major contributors to wastewater pollution, discharging significant amounts of colored compounds [4], and often presenting high levels of suspended solids, organic matter, pH changes, and other inorganic contaminants. The existence of color reduces aquatic biodiversity by interfering with light transit through the water, consequently avoiding the photosynthesis of aqueous flora [5]. In some cases, dye concentrations below 1 mg L−1 are enough to cause a noticeable water coloration in water. Also, most of these compounds can cause dermatitis [6] and are toxic, carcinogenic, and mutagenic to human beings [7,8]. Consequently, different treatments of effluent-containing dyes have been developed to mitigate their adverse environmental effects and health risks [5].
In this way, various physical and physicochemical processes have been widely used for dye removal [5,9,10]. However, dyes are molecules with complex chemical structures highly resistant to degradation [11]. Among existing technologies, those based on adsorption are the most common and have shown good efficiencies for dye removal [12]. Over the past few decades, many studies have focused on finding the most effective adsorbent materials. In this context, carbon-based adsorbents have been the most extensively used with good results [13]. These materials tend to be hydrophobic or organophilic depending on their surface polarity, which arises from the surface chemical groups. Thus, they are widely used for the adsorption of organic compounds as dyes in water recovery and purification systems. In addition to the surface chemistry of the adsorbent, its internal porous structure is another key factor as it directly affects the material’s capacity to capture dye molecules. Moreover, the precursor used in carbon production plays a critical role because it affects its internal structure. For example, Table 1 shows representative precursors used for carbon production, along with their adsorption capacities for common dyes and pore volumes, observing the frequent use of lignocellulosic materials due to their low cost. However, a major drawback of lignocellulosic precursors is the limited ability to control the internal structure of the resulting carbonaceous matrix. On the other hand, the use of polymers as precursors allows for better control over pore size and provides materials with larger surface areas.
Polyacrylonitrile (PAN) is an excellent precursor for carbon materials with an extraordinary graphitization degree and a high surface area but relatively low porosity. These characteristics are due to forming a tightly stacked structure with a small number of defects during PAN pre-oxidation. Moreover, PAN is a nitrogen-containing polymer, which can contribute to proportionate functionalities in the carbon structure [14,15]. Also, heteroatom doping causes structural changes modifying the carbon physicochemical properties, which are used to provide carbon materials with adjustable functions for different applications [16]. Thus, when sulfur is incorporated into the carbon structures, the resulting nanocarbons exhibit a great specific surface area and controlled pore size [17]. Also, it has been found that sulfur doping provides the carbons of appropriate characteristics to be used as heavy metals or dye adsorbents and supercapacitors [18,19]. In addition, porosity and carbon-specific surfaces obtained through physical or chemical activation and carbon surface chemistry play a significant role in the adsorption process [20,21].

Table 1.
Dyes adsorption capacities for carbon materials made from different precursors.
Table 1.
Dyes adsorption capacities for carbon materials made from different precursors.
| Precursor | Activation | Surface Area (m2 g−1) | Dye | Adsorption Capacity (mg g−1) | Pore Volume (cm3 g−1) | Source |
|---|---|---|---|---|---|---|
| Banana peel | --- | --- | Reactive Black 5 | 26.9 | --- | [20] |
| Congo red | 46.7 | |||||
| Macroalgae (Ulothrix zonata) | --- | 133.2 | Malachite green | 5306.2 | --- | [22] |
| Crystal violet | 1222.5 | |||||
| Congo red | 345.2 | |||||
| Rice straws | KOH | 1973.0 | Methylene blue | 527.6 | 1.131 | [23] |
| Congo red | 44.2 | |||||
| H3PO4 | 392.6 | Methylene blue | 34.7 | 0.463 | ||
| Congo red | 67.1 | |||||
| CO2 | 214.7 | Methylene blue | 44.2 | 0.164 | ||
| Congo red | 253.9 | |||||
| Bamboo | KOH | 1896.0 | Methylene blue | 454.2 | 1.109 | [24] |
| Sargassum fusiforme | CO2 | 1329 | Congo red | 234.0 | 1.2 | [25] |
| H2SO4-modified celery residue | --- | 24.93 | Congo red | 238.09 | 0.041 | [26] |
| ZnO-modified SiO2 nanospheres | --- | 34.5 | Congo red | 83.0 | 0.16 | [27] |
| Zeolitic imidazolate framework-67 | --- | 1388 | Congo red | 714.3 | --- | [28] |
In this work, three doped, porous carbons manufactured from polyacrylonitrile, N-doped carbon, N-doped activated carbon, and N,S-co-doped carbon (PAN-C, PAN-C-Act, and PAN-S-C, respectively), were used as adsorbents of an industrial wood dye. The aim was to demonstrate how the structural characteristics of these materials influence dye adsorption, and how appropriate selection can help overcome limitations associated with dye size exclusion. In addition, the effect of pH, initial dye concentration and carbon dosage on the adsorption capacity of each carbon was analyzed. Kinetics and diffusion mechanisms were also evaluated.
2. Results and Discussion
Adsorbent characterization was performed in a previous work [29]. BET surface areas, SBET, of PAN-C, PAN-S-C, PAN-C-Act, and CAC were 36.3, 150.5, 3154.9, and 1059.9 m2 g−1, respectively, as determined from N2 adsorption isotherms at 77 K. The nitrogen sorption isotherms for PAN-C and PAN-S-C carbons were type I isotherms. PAN-C-Act showed a combination of type I and IV isotherms and CAC presented type II isotherm adsorption. XPS analysis determined the presence of nitrogen and sulfur-containing functional groups, showing that the porous carbons fabricated from polyacrylonitrile had N groups in their structure, such as pyrrolic N and pyridinic N, as well as C-N bonds. However, PAN-C-Act lost pyridinic N groups during activation. PAN-C-S also showed S-rich groups, C-SO2-C, sulfur, and disulfide bonds. Moreover, the oxidation and activation stages provided a higher formation of carbonyl and hydroxyl groups. CAC showed only C=O and COOH groups.
The presence of OH-groups determines the acid–base character and reactivity of carbon materials. Moreover, the presence of various other surface functional groups makes surface chemistry more versatile compared to other adsorbents [30]. As a result, pollutants adsorption from aqueous solutions is complex and involves many parameters, such as solution pH, ionic strength, as well as solute–solute and solute–solvent interactions [31]. In this way, several series of adsorption experiments using manufactured carbons and commercial ones have been carried out (Table 2).
Table 2.
Experimental conditions essayed and kinetic parameters of the pseudo-second-order model for red wood dye adsorption with carbons prepared. * fits better for the first-order model (aqmax corresponds to the maximum adsorption capacity determined experimentally, and bqe is the amount of dye adsorbed (mg g−1) at equilibrium according to model fit).
2.1. Effect of Initial PH
Dye solution pH significantly affects the entire adsorption process, particularly the materials’ adsorption capacity [22]. Hence, adsorption of red dye on carbons was studied as a function of pH at acid (1.9–2.3), natural (6–6.8) and alkaline pH (11.8–12.6) in the range of two initial concentrations (24–28 mg L−1 and 231–285 mg L−1) and carbon dosages essayed (0.43–0.53 and 1.73–1.91 g L−1) at 298 K and 48 h. Figure 1 compares the effect of pH on dye removal efficiency for PAN-C, PAN-S-C, PAN-C-Act, and CAC.
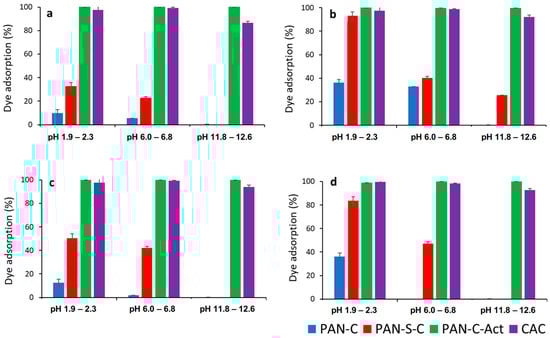
Figure 1.
Effect of pH on dye adsorption (%) for PAN-C, PAN-S-C, PAN-C-Act, and CAC. (a) Ci: 24–28 mg L−1, S/L: 0.43–0.53 g L−1; (b) Ci: 24–28 mg L−1, S/L: 1.73–1.91 g L−1, (c) Ci: 230–285 mg L−1, S/L: 0.43–0.53 g L−1; (d) Ci: 230–285 mg L−1, S/L: 1.73–1.91 g L−1.
As can be observed, pH affected the maximum adsorption efficiency for all carbons, especially for PAN-C and PAN-S-C, and the higher adsorption percentages were obtained at acid pH. Moreover, the PAN-C-Act carbon showed the best removal performance, even better than the commercial one, with an adsorption yield (%) of approximately 100%. Considering the point of zero charge of carbons, at acid and natural pH, lower than pHPZC (8.3 and 8.2 for PAN-C and PAN-S-C, respectively, and 7.4 for both PAN-C-Act and CAC) [29], cationic functional groups predominate on the carbon surface while the surface is negatively charged at alkaline pH. As previously found [32], the dye behaves as a weak acid (pKa of 10.6). Consequently, in aqueous solution, it predominantly exists in its anionic form and is more effectively adsorbed onto cationic surfaces. This behavior has also been evidenced by Al-Degs et al. [33] with a commercial activated carbon F-400. Furthermore, the presence of oxygen functional groups, such as ketone and hydroxyl groups, gives basicity to the carbon surface, with PAN-C-Act showing an increase in the oxygen content after KOH activation with respect to the other two carbons [29]. Conversely, PAN-C is the carbon with the lowest removal efficiency, with a higher yield of 36.2% (5.1 mg g−1) at pH 2, adsorbent dosage (S/L = 1.7 g L−1), and initial concentration of 24 mg L−1. In addition, this carbon has the lower BET surface area (36.3 m2 g−1) and pore volume (0.018 cm3 g−1) [29], which can indicate that these characteristics directly influence adsorption capacity. The pH variations observed (Table 2) are due to the solution becoming slightly alkaline as the initial concentration was increased.
2.2. Effect of Carbon-Structural Properties
In general, the materials with a greater surface area tend to adsorb better the molecules under study. To analyze more carefully the effect of the surface area measured by CO2 at 273 K and N2 at 77 K [29] on dye adsorption, the surface areas of each carbon (PAN-C, 148.7 and 36.3; PAN-S-C, 209.9 and 150.5; PAN-C-Act, 599.7 and 3154.9; and CAC, 350.9 and 1059.9 m2 g−1, respectively) were related to the red dye adsorption percentages at acid, natural, and basic pH (1.9–2.3; 6–6.8; 11.8–12.6), higher initial concentration (Ci, 231–285 mg L−1), and lower carbon dosage (S/L, 0.43–0.53 g L−1), as shown in Figure 2a,b.
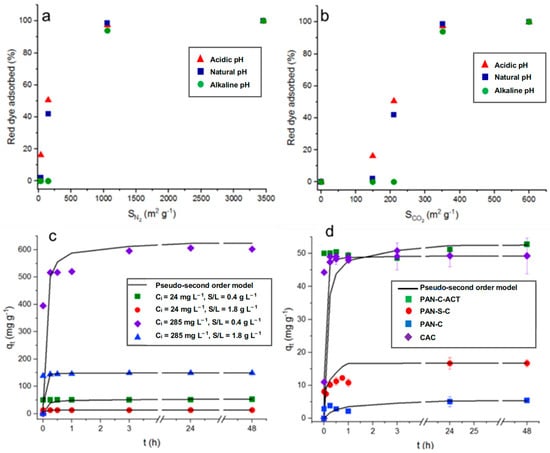
Figure 2.
Top plots: Influence of surface area determined in PAN-C, PAN-S-C, PAN-C-Act, and CAC, with (a) N2 at 77 K and (b) CO2 at 273 K, on dye adsorption at 48 h (pH: 1.9–2.3; 6–6.8; 11.8–12.6; Ci: 230–285 mg L−1 and S/L, 0.43–0.53 g L−1). Plots below: Red dye adsorption kinetic data. The lines correspond to a pseudo-second-order model. (c) Effect of initial dye concentration (Ci: 24 and 285 mg L−1) and adsorbent dosage (0.45–0.47 and 1.86–1.89 g L−1) on adsorption capacity for PAN-C-Act at pH ~ 2 and 298 K. (d) Effect of adsorbent on adsorption kinetics at pH ~ 2 and 298 K (Ci: 24–28 mg L−1 and 0.43–0.53 g L−1).
It can be observed that, in general, the adsorption percentage increases with the surface area increasing, regardless of pH. As a result, it was observed in Figure 2a that as the N2 surface area tends to very low values, while the adsorption efficiency tends to zero. However, the results in Figure 2b indicate that the CO2 surface area does not contribute to the dye adsorption. So, adsorption percentages that are almost nil will be obtained, especially at alkaline pH, even with surface areas of nearly 150 m2 g−1. From previous studies [34], it was concluded that those pores in the ultramicroporosity range generate the surface area determined with CO2 at 273 K (dp < 0.7 nm). Therefore, the results suggest that a part of the surface area is inaccessible for dye adsorption due to a size exclusion phenomenon as the highest distance between two extreme atoms of dye molecule, 1.28 nm [35], exceeds the size of ultramicropores. This fact is very clearly observed for PAN-C (36.3 m2 g−1 with N2 at 77 K and 148.7 m2 g−1 with CO2 at 273 K), in which surface area due to ultramicropores represents 80% of the total area [29], and it is not available for dye access, showing low adsorption percentages under all conditions (Table 2). On the contrary, PAN-S-C, which is also a non-activated carbon but doped with sulfur, showed higher adsorption percentages, with the highest value, 92.0% (qmax, 11.9 mg g−1), at pH ~ 2, S/L 1.9 g L−1, and 24 mg L−1 of initial dye concentration. The presence of S causes the formation of mesopores (68% of total pore volume) [29], allowing the access of dye. As mentioned before, PAN-C-Act with a very large surface area containing high mesopore volume almost completely adsorbed the dye under all conditions essayed (Table 2). From Figure 2a, it is possible to conclude that the results of dye adsorption (%) correlate with the surface area determined by N2 adsorption, considering the accessibility of mesopores and larger micropores, while excluding the contribution from ultramicroporosity. This highlights this parameter as a key factor influencing the adsorption performance.
2.3. Effect of Initial Concentration and Adsorbent Dosage
The influence of initial dye concentration, which varied from 24 to 28 mg L−1 to 231–285 mg L−1 depending on the carbon, affected their adsorption performance (Table 2). As it can be observed, for a fixed pH and adsorbent dosage (S/L), as well as a general increase in the dye’s initial concentration, the adsorption capacity of all carbons were up to 70.5, 252.7, 602.3, and 556.1 mg g−1 for PAN-C, PAN-S-C, PAN-C-Act, and CAC, respectively, at pH ~ 2, S/L ~ 0.5 g L−1, and Ci = 231–285 mg L−1. This behavior is also shown as a function of time for PAN-C-Act at the initial dye concentrations, and adsorbent doses essayed (Figure 2c).
The adsorbent dosage positively affected the dye adsorption percentage, increasing these values, as shown in Figure 1. If Figure 1a is compared with Figure 1b,c is compared with Figure 1d, a general improvement in the adsorption percentages is observed for PAN-C and PAN-C-S at acid and natural pH, and even at alkaline pH for lower initial concentrations (Ci, 24–28 mg L−1). Increasing adsorbent dosage provides more active sites for the dye to be adsorbed and increases the adsorption percentage, as observed in Table 2. On the contrary, the adsorption capacity of porous carbons decreases with increasing adsorbent dosage, as observed in Table 2 and, specifically, for PAN-C-Act adsorption in Figure 2c. Figure 2d shows the red dye adsorption kinetic data for all carbons and the effect of the type of adsorbent on dye adsorption at 298 K over 48 h (Ci, 24–28 mg L−1 and 0.43–0.53 g L−1). The use of PAN-C-Act together with the CAC led to better adsorption performance.
2.4. Adsorption Kinetic Modeling
Kinetic studies are important as they provide information on the mechanism of the adsorption process [36]. Figure 2d shows the effect of time on the red dye adsorption capacity of the porous carbons at pH ~ 2, observing fast adsorption of the dye during the first minutes and reaching the maximum adsorption capacity after 24 h, 3 h, and 15 min for PAN-C, PAN-S-C, and PAN-C-Act, respectively, for all experiments performed. Moreover, although the PAN-C-Act reaches a slightly higher dye adsorption capacity than CAC, possibly due to its higher N2 surface area joined to its surface chemistry and pore structure, Figure 2d shows that the CAC has a more favorable kinetic. This fact is probably due to the presence of smaller porous PAN-C-Act inside, which exhibits slightly higher microporosity (25.6 vs. 24.4%) and significantly greater ultramicroporosity (599.7 vs. 350.9 m2 g−1 for CO2 surface areas) compared to CAC [29], which significantly decreases the diffusivity of the dye in its porous structure.
Table 2 and Table 3 present the kinetics parameters obtained for the pseudo-second-order and the intra-particle diffusion models, respectively, along with the corresponding determination coefficients. Low R2 values indicated that the pseudo-first-order model is inappropriate for fitting the experimental data. On the contrary, the pseudo-second-order kinetic model explained better the adsorption behavior, except for PAN-C at natural pH, obtaining determination coefficients higher than 0.96 (Table 2). The dye diffusion mechanism into PAN-C and PAN-S-C occurs in two simultaneous stages: external mass transfer followed by intra-particle diffusion, as demonstrated by the fitting to the intra-particle diffusion model (Table 3). PAN-C-Act and commercial activated carbon show a two-step adsorption mechanism, where in the first step, there is a fast adsorption of the dye by the carbon. These materials do not fit well to the intra-particle diffusion model since the determination coefficients are often lower than 0.5. In general, a good agreement is observed between the calculated and experimental adsorption capacities for the pseudo-second-order kinetic model (Table 2 and Figure 2c,d).
Table 3.
Experimental conditions essayed and parameters of the intra-particle diffusion model for red wood dye adsorption with carbons prepared.
Adsorption is influenced by various factors, including the adsorbent textural and surface properties, surface functional groups, adsorbate–adsorbent interactions, and the adsorbate diffusion process into the adsorbent. In this work, the results suggest that chemical processes between the dye and the carbon primarily control the overall rate of red wood dye adsorption.
Table 4 shows dye adsorption capacities for commercial activated carbons published by other authors. The activated carbon PAN-C-Act prepared in this work showed, in general, higher adsorption capacity than those commercial ones and those prepared from other precursors (Table 1), though these values are, of course, dependent on the type of dye used and the conditions applied. This comparison underscores the good adsorption capacity of PAN-C-Act and clearly demonstrates the feasibility of synthesizing activated carbons with enhanced properties.
Table 4.
Reported dye adsorption capacities of azo dyes on commercial activated carbons.
3. Materials and Methods
3.1. Carbon Synthesis
N-doped carbon (PAN-C), N-doped carbon activated with KOH (PAN-C-Act), and N, S-co-doped carbon with sulfur in a 1:1 weight ratio (PAN-S-C) were prepared using PAN as a precursor (150,000 g mol−1), with the experimental procedure reported in the previous work [29] using PAN as a precursor (150,000 g mol−1). Briefly, the carbonization process consisted of two continuous stages. The first stage was performed at 553 K to stabilize the PAN structure, initially under an oxygen flow (10 mL min−1) for 1 h, followed by 0.5 h under an inert atmosphere at the same temperature. The second stage involved pyrolysis at 1073 K under a N2 atmosphere, where the polymer was completely pyrolyzed. For activation, PAN-C was ground with KOH (1:4 w/w) and carbonized in an inert N2 atmosphere at 1073 K (10 mL min−1) for 2 h. In addition, commercial activated carbon (CAC) was used as a reference material (Merck, Kenilworth, NJ, USA). Porous carbon characterization, including surface textural properties and morphological features, can be found in the previous work [29].
3.2. Wood Red Dye
Red GRA 200% (C17H11F3N3NaO4S+, 433.34 g mol−1) is an industrial acidic and anionic wood dye provided by ASERPAL S.A. company (Grupo Losán S.A., Galicia, Spain), which manufactured wood veneer boards. Figure 3 shows the structural formula of the dye. Working solutions at the required red dye concentrations were prepared by diluting an aqueous dye solution of 500 mg L−1. Approximately 1 mol L−1 NaOH or HCl aqueous solutions (Sigma Aldrich, Steinheim, Germany) were used to adjust pH. A scan of red dye solutions (10 mg L−1) between pH 1.5 and 12.5 was performed by UV/VIS spectroscopy (V-630, Jasco, Tokyo, Japan), obtaining the maximum wavelength (λmax) at 506 nm for pH from 1.5 to 8. At pH 8, the red dye solution changed to yellow at λmax of 505 nm, and finally, the λmax was 482 nm at pH 11.5. A previous study confirmed that dye solutions under all conditions of initial concentration and pH used were stable over time (48 h). The determination of the acid dissociation constant (pKa) of the Red GRA 200% dye was previously performed by a UV–Visible spectroscopic method [32]. pKa, which predicts the ionization state of the molecule concerning pH, is 10.6.
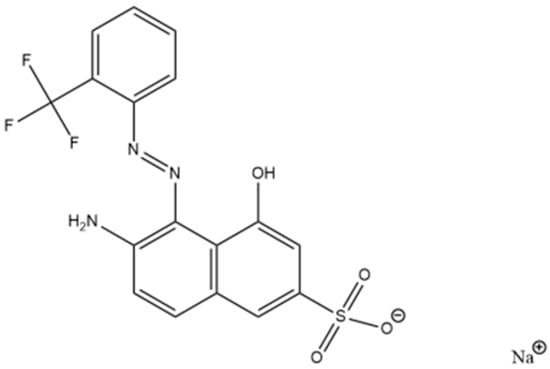
Figure 3.
Structural formula of dye red GRA-200% [35].
3.3. Batch Adsorption Experiments
Figure 4 shows the process followed to carry out the adsorption kinetics experiments. Experiments were performed in an orbital mini shaker (VWR, Cienytech, PA, USA) at 25 °C and 400 rpm to study the dye adsorption. The influence of pH (acidic, 1.9–2.3; natural, 6–6.8; alkaline, 11.8–12.6), adsorbent dosage (S/L, 0.43–0.53 and 1.73–1.91 g L−1) and initial dye concentration (Ci, 24–28 mg L−1 and 231–285 mg L−1) were evaluated for over 48 h. At fixed times, the suspensions were centrifuged (Alresa Microcen, Madrid, Spain) at 9000 rpm for 6 min, and the supernatants were collected. Finally, the dye concentration was obtained at the λmax. All the experiments were duplicated. A commercial carbon was also used as a comparison.
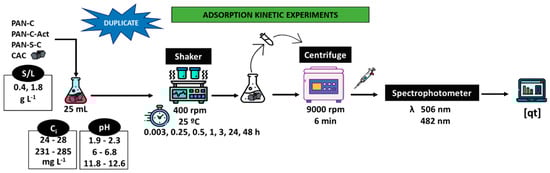
Figure 4.
Scheme of the batch adsorption kinetic experiments.
The adsorption capacity (qt) in mg g−1 was calculated following Equation (1):
where Ci and Ct are the initial dye concentration and concentration at any time t (h), respectively (mg L−1), V is the volume of dye solution (L), and m is the dry mass of carbon used (g). The maximum qt is referred to as qmax and corresponds to the maximum adsorption capacity determined experimentally.
The removal efficiency, expressed as the percentage of dye adsorbed was determined using Equation (2):
Lagergren’s first-order model expressed by Equation (3) [43], and Ho’s pseudo-second-order model given by Equation (4) [44] were used to describe dye kinetic adsorption:
where qe is the amount of dye adsorbed on the carbon (mg g−1) at equilibrium; k1 (h−1) and k2 (g mg−1 h−1) are the corresponding kinetic constants for the models. The intra-particle diffusion model, Equation (5) [45], was also considered.
where Kid and I are the intra-particle diffusion rate constant (mg g−1 h−0.5) and intercept (mg g−1), respectively.
4. Conclusions
Three porous carbons produced using PAN as a precursor were used as adsorbents of a red wood dye in aqueous solutions. In general, it was found that the adsorption capacity for all carbons increased at acid pH. In addition, the initial dye concentration and carbon dosage considerably affected only the adsorption performance of N-doped carbon (PAN-C) and N,S co-doped carbon with sulfur (PAN-S-C). In the case of N-doped activated carbon (PAN-C-Act), the maximum sorption yield (approximately 100%) was reached for all conditions essayed, with values higher than those obtained for the commercial activated carbon (CAC). In particular, PAN-C-Act showed a higher adsorption capacity (602.3 mg g−1) compared to CAC (556.1 mg g−1), highlighting its superior performance and greater practical applicability. This achievement was probably due to porosity development and a higher specific surface area. The pseudo-second-order model better fitted the adsorption kinetics, and the existence of external mass transfer followed by intra-particle diffusion was confirmed by the intra-particular diffusion model. In general, the results obtained in the present work conclude that the presence of mesoporosity (>2 nm) in the materials plays an important role in dye adsorption by providing accessible pathways to the dye molecules. In contrast, ultramicroporosity has a negative effect due to molecular size exclusion. Despite the availability of surface area (mainly into the solid particles), adsorption is not attained because dye molecules do not have access to the carbon porous structure. Therefore, the selection of carbons for the red dye removal must be performed based not only on the chemical characteristics of the carbon surface and the total surface area available but also on pore size distribution to avoid dye size exclusion.
Author Contributions
Conceptualization, M.S.F., D.G.-D., J.G.-Á. and M.L.; Formal analysis, L.D.-R. and I.T.; Investigation, L.D.-R. and I.T.; Supervision, M.S.F., D.G.-D., J.G.-Á. and M.L.; Visualization, L.D.-R.; Writing—original draft preparation, L.D.-R.; Writing—review & editing, M.S.F., D.G.-D., J.G.-Á. and M.L.; Project administration, M.L. and J.G.-Á.; Funding acquisition, M.L. and J.G.-Á. All authors have read and agreed to the published version of the manuscript.
Funding
This research is part of I+D+i project, Reference PID2021-122923NB-I00; financed by MCIN/AEI/10.13039/501100011033/FEDER, UE, and Consellería de Educación, Universidade e Formación Profesional, grants number ED431B 2020/39 and ED431B 2020/13.
Data Availability Statement
The raw data supporting the conclusions of this article will be made available by the authors on request.
Conflicts of Interest
The authors declare no competing interests.
References
- Silva, J.A. Wastewater Treatment and Reuse for Sustainable Water Resources Management: A Systematic Literature Review. Sustainability. 2023, 15, 10940. [Google Scholar] [CrossRef]
- Kathi, S.; Mahmoud, A.E.D. Trends in effective removal of emerging contaminants from wastewater: A comprehensive review. Desalin. Water Treat. 2024, 317, 100258. [Google Scholar] [CrossRef]
- Litefti, K.; Freire, M.S.; Stitou, M.; González-Álvarez, J. Adsorption of an anionic dye (Congo red) from aqueous solutions by pine bark. Sci. Rep. 2019, 9, 16530. [Google Scholar] [CrossRef]
- Al-Tohamy, R.; Ali, S.S.; Li, F.; Okasha, K.M.; Mahmoud, Y.A.-G.; Elsamahy, T.; Jiao, H.; Fu, Y.; Sun, J. A critical review on the treatment of dye-containing wastewater: Ecotoxicological and health concerns of textile dyes and possible remediation approaches for environmental safety. Ecotoxicol. Environ. Saf. 2022, 231, 113160. [Google Scholar] [CrossRef]
- Khan, M.D.; Singh, A.; Khan, M.Z.; Tabraiz, S.; Sheikh, J. Current perspectives, recent advancements, and efficiencies of various dye-containing wastewater treatment technologies. J. Water Process Eng. 2023, 53, 103579. [Google Scholar] [CrossRef]
- Lellis, B.; Fávaro-Polonio, C.Z.; Pampile, J.A.; Polonio, J.C. Effects of textile dyes on health and the environment and bioremediation potential of living organisms. Biotechnol. Res. Innov. 2019, 3, 275–290. [Google Scholar] [CrossRef]
- Alves, R.O.; Bazo, A.P.; Fávero, D.M.; Rech, C.M.; de Palma, D.; de Aragão, G. Mutagenic and carcinogenic potential of a textile azo dye processing plant effluent that impacts a drinking water source. Mutat. Res. 2007, 626, 53–60. [Google Scholar] [CrossRef] [PubMed]
- Carneiro, P.A.; Umbuzeiro, G.A.; Oliveira, D.P.; Zanoni, M.V.B. Assessment of water contamination caused by a mutagenic textile effluent/dyehouse effluent bearing disperse dyes. J. Hazard. Mater. 2010, 174, 694–699. [Google Scholar] [CrossRef] [PubMed]
- Zhou, Y.; Lu, J.; Zhou, Y.; Liu, Y. Recent advances for dyes removal using novel adsorbents: A review. Environ. Pollut. 2019, 252, 352–365. [Google Scholar] [CrossRef]
- Garg, V.K.; Amita, M.; Kumar, R.; Gupta, R. Basic dye (methylene blue) removal from simulated wastewater by adsorption using Indian Rosewood sawdust: A timber industry waste. Dyes Pigment. 2004, 63, 243–250. [Google Scholar] [CrossRef]
- Hosseini, E.; Alavi, M.R.; Hashemi, S.H. Investigation of decolorization kinetics and biodegradation of azo dye Acid Red 18 using sequential process of anaerobic sequencing batch reactor/moving bed sequencing batch biofilm reactor. Int. Biodeterior. Biodegrad. 2012, 71, 43–49. [Google Scholar] [CrossRef]
- Katheresan, V.; Kansedo, J.; Lau, S.Y. Efficiency of various recent wastewater dye removal methods: A review. J. Environ. Chem. Eng. 2018, 6, 4676–4697. [Google Scholar] [CrossRef]
- Al-Degs, Y.; Khraisheh, M.A.M.; Allen, S.J.; Ahmad, M.N.; Walker, G.M. Competitive adsorption of reactive dyes from solution: Equilibrium isotherm studies in single and multisolute systems. Chem. Eng. J. 2007, 128, 163–167. [Google Scholar] [CrossRef]
- Li, Y.; Liang, Y.; Hu, H.; Dong, H.; Zheng, M.; Xiao, Y.; Liu, Y. KNO3-mediated synthesis of high-surface-area polyacrylonitrile-based carbon material for exceptional supercapacitors. Carbon 2019, 152, 120–127. [Google Scholar] [CrossRef]
- Kim, B.H.; Yang, K.S.; Woo, H.G. Thin, bendable electrodes consisting of porous carbon nanofibers via the electrospinning of polyacrylonitrile containing tetraethoxy orthosilicate for supercapacitor. Electrochem. Commun. 2011, 13, 1042–1046. [Google Scholar] [CrossRef]
- Wang, H.; Shao, Y.; Mei, S.; Lu, Y.; Zhang, M.; Matyjaszewski, K.; Antonietti, M.; Yuan, J. Polymer-derived heteroatom-doped porous carbon materials. Chem. Rev. 2020, 120, 9363–9419. [Google Scholar] [CrossRef]
- Yuan, R.; Wang, H.; Sun, M.; Damodaran, K.; Gottlieb, E.; Kopeć, M.; Eckhart, K.; Li, S.; Whitacre, J.; Matyjaszewski, K.; et al. Well-defined N/S co-doped nanocarbons from sulfurized PAN- b-PBA block copolymers: Structure and supercapacitor performance. ACS Appl. Nano Mater. 2019, 2, 2467–2474. [Google Scholar] [CrossRef]
- Manoukian, M.; Tavakol, H.; Fashandi, H. Synthesis of highly uniform sulfur-doped carbon sphere using CVD method and its application for cationic dye removal in comparison with undoped product. J. Environ. Chem. Eng. 2018, 6, 6904–6915. [Google Scholar] [CrossRef]
- Sevilla, M.; Fuertes, A.B. Highly porous S-doped carbons. Microporous Mesoporous Mat. 2012, 158, 318–323. [Google Scholar] [CrossRef]
- Munagapati, V.S.; Yarramuthi, V.; Kim, Y.; Lee, K.M.; Kim, D.S. Removal of anionic dyes (Reactive Black 5 and Congo Red) from aqueous solutions using banana peel powder as an adsorbent. Ecotox. Environ. Safe. 2018, 148, 601–607. [Google Scholar] [CrossRef]
- Pimentel, C.H.; Díaz-Fernández, L.; Gómez-Díaz, D.; Freire, M.S.; González-Álvarez, J. Separation of CO2 using biochar and KOH and ZnCl2 activated carbons derived from pine sawdust. J. Environ. Chem. Eng. 2023, 11, 111378. [Google Scholar] [CrossRef]
- Chen, Y.-D.; Lin, Y.-C.; Ho, S.-H.; Zhou, Y.; Ren, N.-Q. Highly efficient adsorption of dyes by biochar derived from pigments-extracted macroalgae pyrolyzed at different temperature. Bioresour. Technol. 2018, 259, 104–110. [Google Scholar] [CrossRef] [PubMed]
- Sangon, S.; Hunt, A.J.; Attard, T.M.; Mengchang, P.; Ngernyen, Y.; Supanchaiyamat, N. Valorisation of waste rice straw for the production of highly effective carbon based adsorbents for dyes removal. J. Clean Prod. 2018, 172, 1128–1139. [Google Scholar] [CrossRef]
- Hameed, B.H.; Din, A.T.M.; Ahmad, A.L. Adsorption of methylene blue onto bamboo-based activated carbon: Kinetics and equilibrium studies. J. Hazard. Mater. 2007, 141, 819–825. [Google Scholar] [CrossRef]
- Mingjie, M.; Ying, H.; Cao, F.; Wang, Q.; Ai, N. Adsorption of Congo red on mesoporous activated carbon prepared by CO2 physical activation. Chin. J. Chem. Eng. 2020, 28, 1069–1076. [Google Scholar] [CrossRef]
- Mohebali, S.; Bastani, D.; Shayesteh, H. Equilibrium, kinetic and thermodynamic studies of a low-cost biosorbent for the removal of Congo red dye: Acid and CTAB-acid modified celery (Apium graveolens). J. Mol. Struct. 2019, 1176, 181–193. [Google Scholar] [CrossRef]
- Zhang, J.; Yan, X.; Hu, M.; Hu, X.; Zhou, M. Adsorption of Congo red from aqueous solution using ZnO-modified SiO2 nanospheres with rough surfaces. J. Mol. Liq. 2018, 249, 772–778. [Google Scholar] [CrossRef]
- Thanh Tu, N.T.; Thien, T.V.; Du, P.D.; Thi, T.V.; Mau, T.X.; Khieu, D.Q. Adsorptive removal of Congo red from aqueous solution using zeolitic imidazolate framework–67. J. Environ. Chem. Eng. 2018, 6, 2269–2280. [Google Scholar] [CrossRef]
- Domínguez-Ramos, L.; Prieto-Estalrich, A.; Malucelli, G.; Gómez-Díaz, D.; Freire, M.S.; Lazzari, M.; González-Álvarez, J. N- and S-doped carbons derived from polyacrylonitrile for gases separation. Sustainability 2022, 14, 3760. [Google Scholar] [CrossRef]
- Carlos, A.; Leon y Leon, D.; Radovic, L.R. Interfacial chemistry and electrochemistry of carbon surfaces. Chem. Phys. Carb. 1994, 24, 213–310. [Google Scholar]
- Wu, Z.; Ye, X.; Liu, H.; Zhang, H. Interactions between adsorbents and adsorbates in aqueous solutions. Pure Appl. Chem. 2020. [Google Scholar] [CrossRef]
- Pimentel, C.H.; Freire, M.S.; Gómez-Díaz, D.; González-Álvarez, J. Removal of wood dyes from aqueous solutions by sorption on untreated pine (Pinus pinaster) sawdust. Cellulose 2023, 30, 4587–4608. [Google Scholar] [CrossRef]
- Al-Degs, Y.; Khraisheh, M.A.M.; Allen, S.J.; Ahmad, M.N. Effect of carbon surface chemistry on the removal of reactive dyes from textile effluent. Water Res. 2000, 34, 927–935. [Google Scholar] [CrossRef]
- Kim, K.C.; Yoon, T.-U.; Bae, Y.-S. Applicability of using CO2 adsorption isotherms to determine BET surface areas of microporous materials. Microporous Mesoporous Mater. 2016, 224, 294–301. [Google Scholar] [CrossRef]
- Pimentel, C.H.; Freire, M.S.; Gómez-Díaz, D.; González-Álvarez, J. Preparation of activated carbon from pine (Pinus radiata) sawdust by chemical activation with zinc chloride for wood dye adsorption. Biomass Conv. Bioref. 2023, 13, 16537–16555. [Google Scholar] [CrossRef]
- Cardoso, N.F.; Lima, E.C.; Royer, B.; Bach, M.V.; Dotto, G.L.; Pinto, L.A.A.; Calvete, T. Comparison of Spirulina platensis microalgae and commercial activated carbon as adsorbents for the removal of Reactive Red 120 dye from aqueous effluents. J. Hazard. Mater. 2012, 241-242, 146–153. [Google Scholar] [CrossRef]
- Ribas, M.C.; Adebayo, M.A.; Prola, L.D.T.; Lima, E.C.; Cataluña, R.; Feris, L.A.; Puchana-Rosero, M.J.; Machado, F.M.; Pavan, F.A.; Calvete, T. Comparison of a homemade cocoa shell activated carbon with commercial activated carbon for the removal of reactive violet 5 dye from aqueous solutions. Chem. Eng. J. 2014, 248, 315–326. [Google Scholar] [CrossRef]
- Martins, A.; Nunes, N. Adsorption of a textile dye on commercial activated carbon: A simple experiment to explore the role of surface chemistry and ionic strength. J. Chem. Educ. 2015, 92, 143–147. [Google Scholar] [CrossRef]
- Giannakoudakis, D.A.; Kyzas, G.Z.; Avranas, A.; Lazaridis, N.K. Multi-parametric adsorption effects of the reactive dye removal with commercial activated carbons. J. Mol. Liq. 2016, 213, 381–389. [Google Scholar] [CrossRef]
- Choy, K.K.; Porter, J.F.; McKay, G. Langmuir isotherm models applied to the multicomponent sorption of acid dyes from effluent onto activated carbon. J. Chem. Eng. Data. 2000, 45, 575–584. [Google Scholar] [CrossRef]
- Aksu, Z.; Tezer, S. Biosorption of reactive dyes on the green alga Chlorella vulgaris. Process Biochem. 2005, 40, 1347–1361. [Google Scholar] [CrossRef]
- Venkata Mohan, S.; Chandrasekhar Rao, N.; Karthikeyan, J. Adsorptive removal of direct azo dye from aqueous phase onto coal based sorbents: A kinetic and mechanistic study. J. Hazard. Mater. 2002, 90, 189–204. [Google Scholar] [CrossRef] [PubMed]
- Lagergren, S. Zur theorie der sogenannten adsorption gelöster stoffe. K. Sven. Vetenskapsakademiens 1898, 24, 1–39. [Google Scholar]
- Ho, Y.S.; McKay, G. Pseudo-second order model for sorption processes. Process Biochem. 1999, 34, 451–465. [Google Scholar] [CrossRef]
- Weber, W.J.; Morris, J.C. Kinetics of adsorption on carbon from solution. J. Sanit. Eng. Div. 1963, 89, 31–59. [Google Scholar] [CrossRef]
Disclaimer/Publisher’s Note: The statements, opinions and data contained in all publications are solely those of the individual author(s) and contributor(s) and not of MDPI and/or the editor(s). MDPI and/or the editor(s) disclaim responsibility for any injury to people or property resulting from any ideas, methods, instructions or products referred to in the content. |
© 2025 by the authors. Licensee MDPI, Basel, Switzerland. This article is an open access article distributed under the terms and conditions of the Creative Commons Attribution (CC BY) license (https://creativecommons.org/licenses/by/4.0/).