Article

Ionic Liquid-Based Centrifuge-Less Cloud Point Extraction of a Copper(II)–4-Nitrocatechol Complex and Its Analytical Application

1
Research Institute at the Medical University of Plovdiv, 15A, Vassil Aprilov Blvd., 4002 Plovdiv, Bulgaria
2
Department of Chemical Sciences, Faculty of Pharmacy, Medical University of Plovdiv, 120 Buxton Bros Str., 4004 Plovdiv, Bulgaria
3
Faculty of Pharmacy, Yeni Yüzyıl Üniversitesi, 26 Yılanlı Ayazma Caddesi, Istanbul 34010, Turkey
*
Author to whom correspondence should be addressed.
Molecules 2025, 30(15), 3287; https://doi.org/10.3390/molecules30153287
Submission received: 1 July 2025 / Revised: 20 July 2025 / Accepted: 4 August 2025 / Published: 6 August 2025
(This article belongs to the Special Issue Recent Advances in Extraction Techniques for Elemental Analysis)

Abstract

A novel centrifuge-less cloud point extraction (CL-CPE) method was developed for the spectrophotometric determination of copper(II) using 4-nitrocatechol (4NC) as the chelating agent. The extraction system utilizes a mixed micellar phase composed of the nonionic surfactant Triton X-114 and the ionic liquid (IL) Aliquat® 336 (A336). The extracted ternary ion-association complex, identified as (A336+)2[Cu(4NC)2], exhibits a maximum absorbance at 451 nm, with a molar absorption coefficient of 8.9 × 10⁴ M−1 cm−1 and a Sandell’s sensitivity of 0.71 ng cm−2. The method demonstrates a linear response in the copper(II) concentration range of 32–763 ng mL−1 and a limit of detection of 9.7 ng mL−1. The logarithmic extraction constant (log Kex) was determined to be 7.9, indicating efficient extraction. Method performance, evaluated by the Blue Applicability Grade Index (BAGI) and the Click Analytical Chemistry Index (CACI), confirmed its feasibility, practicality, simplicity, convenience, cost-effectiveness, environmental friendliness, and analytical competitiveness. The proposed IL-CL-CPE method was successfully applied to the analysis of a dietary supplement, a solution for infusion, and synthetic mixtures simulating various copper alloys.

1. Introduction

Copper is a highly conductive, malleable, and ductile metal that plays a central role in numerous industrial and technological applications. It is the second most widely used non-ferrous metal [1] and ranks as the 26th most abundant element in the Earth’s lithosphere [2]. Of the 808 identified copper-bearing minerals [3], sulfide and oxide forms hold the greatest economic importance [4]. Extracting copper from these sources involves complex, multi-stage operations that yield significant amounts of slag, dust, and aerosols, which, if not properly managed, can pose serious environmental and health risks [1,5,6].
Despite its potential toxicity at high doses, with an upper tolerable intake level of 10 mg per day [7], copper is classified as an essential trace element necessary for nearly all living organisms. It is involved in numerous biochemical reactions and functions as a cofactor in various enzymes. In the human body, copper is primarily stored in the liver, muscles, and brain, with total body levels typically ranging between 90 and 110 mg [8]. The European Food Safety Authority recommends a daily intake of 1.3 mg for women and 1.6 mg for men aged 18 and older [9].
Notably, copper deficiency has become more recognized and better characterized than in the past [10]. This condition has been linked to a range of health issues, including hematological abnormalities, skeletal deformities, neurological disorders, and impaired immune function [7,10,11].
A variety of spectroscopic techniques have been employed to determine copper. These include atomic absorption spectrometry, inductively coupled plasma optical emission spectrometry, inductively coupled plasma mass spectrometry, and ultraviolet–visible spectroscopy (UV/Vis). Among these, UV/Vis stands out as a simple, cost-effective, rapid, energy-efficient, and widely accessible analytical method. It is frequently used in both research and quality control laboratories and can be readily coupled with various pre-concentration techniques, including solid-phase extraction [12], liquid–liquid extraction [13,14,15], and cloud point extraction (CPE) [16,17,18,19,20,21,22,23,24,25,26,27,28,29,30,31,32].
In recent years, CPE has emerged as a preferred method for the preconcentration of copper ions [16,17,18,19,20,21,22,23,24,25,26,27,28,29,30,31,32,33,34,35,36,37,38,39,40,41,42,43,44] and a viable option for routine analytical applications, primarily due to its environmental sustainability and cost-effectiveness. First introduced in the 1970s [45], CPE operates by heating a solution containing a nonionic surfactant to its cloud point, the temperature at which the homogeneous solution separates into two distinct phases. This phase separation is typically enhanced through centrifugation, followed by cooling. Hydrophobic species, such as neutral chelates and ion associates, tend to partition into the denser surfactant-rich phase (SRP), enabling efficient preconcentration before subsequent analytical determination.
Over time, numerous advanced variations of conventional CPE have been developed to improve performance and address specific limitations. These include microwave-assisted CPE (MA-CPE), ultrasound-assisted CPE (UA-CPE), room-temperature CPE (RT-CPE), mixed micelle-mediated CPE (MM-CPE), micro-CPE (M-CPE), ionic liquid-based CPE (IL-CPE), rapidly synergistic CPE (RS-CPE), centrifuge-less CPE (CL-CPE), and supramolecular solvent-based CPE (SUPRAS-CPE), among others. Each of these variants offers distinct advantages, such as reduced extraction time, improved selectivity, enhanced energy efficiency, lower operational costs, superior extraction efficiency, and greater procedural simplicity [46,47,48,49,50].
The objective of this study was to develop a novel CPE–UV/Vis method for the determination of CuII, integrating the key advantages of CL-CPE, MM-CPE, and IL-CPE. The chelating agent selected for this work was 4-nitrocatechol (4NC), a well-established, commercially available compound that has recently been employed in our laboratory for the CPE–UV/Vis determination of MoVI [51] and VV [52]. According to the Classification, Labelling and Packaging (CLP) regulation, 4NC is classified as a non-hazardous substance and does not require hazard pictograms, hazard statements, precautionary statements, or signal words on its labeling [53].
It is well established that in alkaline media, 4NC forms a stable anionic complex with CuII, [CuL2]2− [54,55,56]. However, this complex is unstable at pH values below 8.2 [54], which hampers its application in spectrophotometric determinations due to its high blank absorbance. This limitation can be overcome by introducing a cationic reagent capable of forming an electroneutral ion-association complex with the anionic CuII–4NC species, thereby facilitating its extraction. The formation of such a ternary complex may shift the optimal extraction pH to lower values, favoring the prevalence of protonated the 4NC form (H2L; pKH2L ≈ 6.7 [56]), which is essential for minimizing blank absorbance and improving analytical reliability.
In the preliminary phase of this study, two cationic ion-association reagents, benzalkonium chloride and Aliquat 336 (A336), were evaluated in conjunction with the nonionic surfactant Triton X-114 (TX). A336 demonstrated superior performance and was therefore selected for further method development. As a room-temperature IL with surfactant-like behavior under certain conditions, A336 forms a mixed micellar system with TX [50,51,57], which enhances the extractability of the CuII complex. This combination facilitates the complex formation and efficient extraction in a mildly acidic medium (optimal pH < pKₐ of 4NC), thereby improving selectivity and reducing blank absorbance. A key advantage of TX over other nonionic surfactants, which accounts for its widespread use, is its low cloud point temperature. This feature has the potential to minimize energy consumption and reduce the risk of thermal degradation of analytes [50].

2. Results and Discussion

2.1. Optimal Operating Conditions

The extracted ternary complex exhibits an orange color, with a maximum absorbance (λmax) at 451 nm, whereas the blank appears yellow. Figure 1 shows the corresponding UV/Vis spectra: (1) the spectrum of the complex against the blank, and (2) the spectrum of the blank against water.
Buffer solutions, prepared from 2 M CH3COOH and NH3, were used to study the effect of pH. As illustrated in Figure 2, the analytical signal achieves its maximum level within the pH range of 6.0–6.1. Subsequent studies were conducted at pH 6, as the blank absorption is lower.
The volume of the buffer solution (Vbuff) was also optimized (Figure 3). Subsequent studies were conducted in the presence of 1 mL of this solution. As can be seen at larger buffer volumes, absorbance decreases, which is likely due to competing complex formation with the buffer components. Centrifugation is necessary for phase separation when using buffer solution volumes smaller than 0.5 mL.
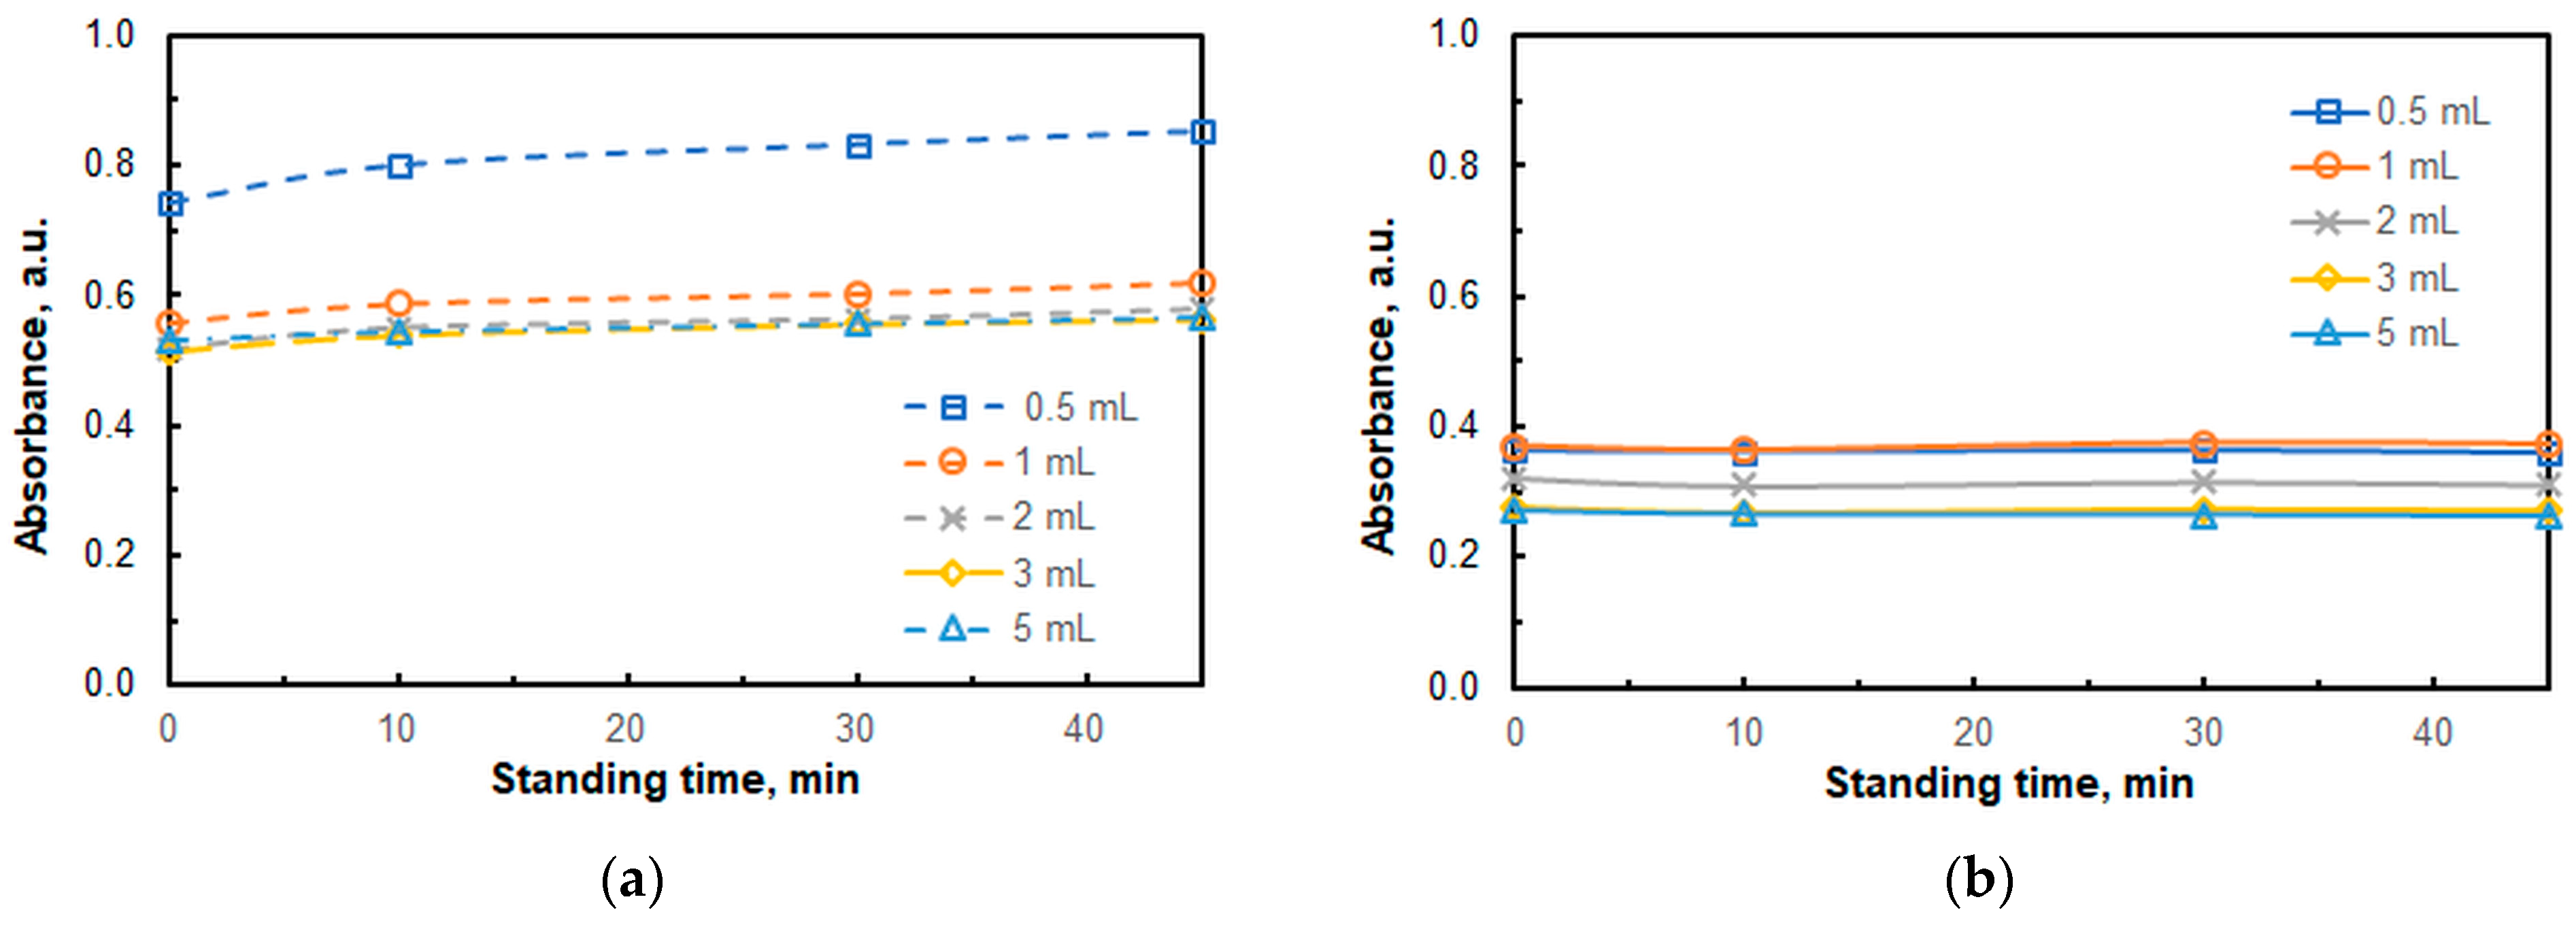
Figure 4 shows the results of the combined effects of two factors: buffer volume and standing time. The absorbance of the blank at λ = 451 nm increases over time, with the most pronounced effect occurring during the first 10 min (Figure 4a). This increase can be explained by a reaction in which the neutral form of 4NC (H2L) converts into an ion pair containing HL (Equation (1)):
H2L + A336+ º [(A336+)(HL)] + H+
As demonstrated in Figure 3 and Figure 4a, the blank’s absorbance decreases in the presence of significant amounts of buffer. This is likely due to the suppression of the process shown in Equation (1). The same process also occurs in the sample containing CuII. As the 4NC concentration significantly exceeds the CuII concentration, the resulting curves shown in Figure 4b are nearly flat and parallel to the x-axis.
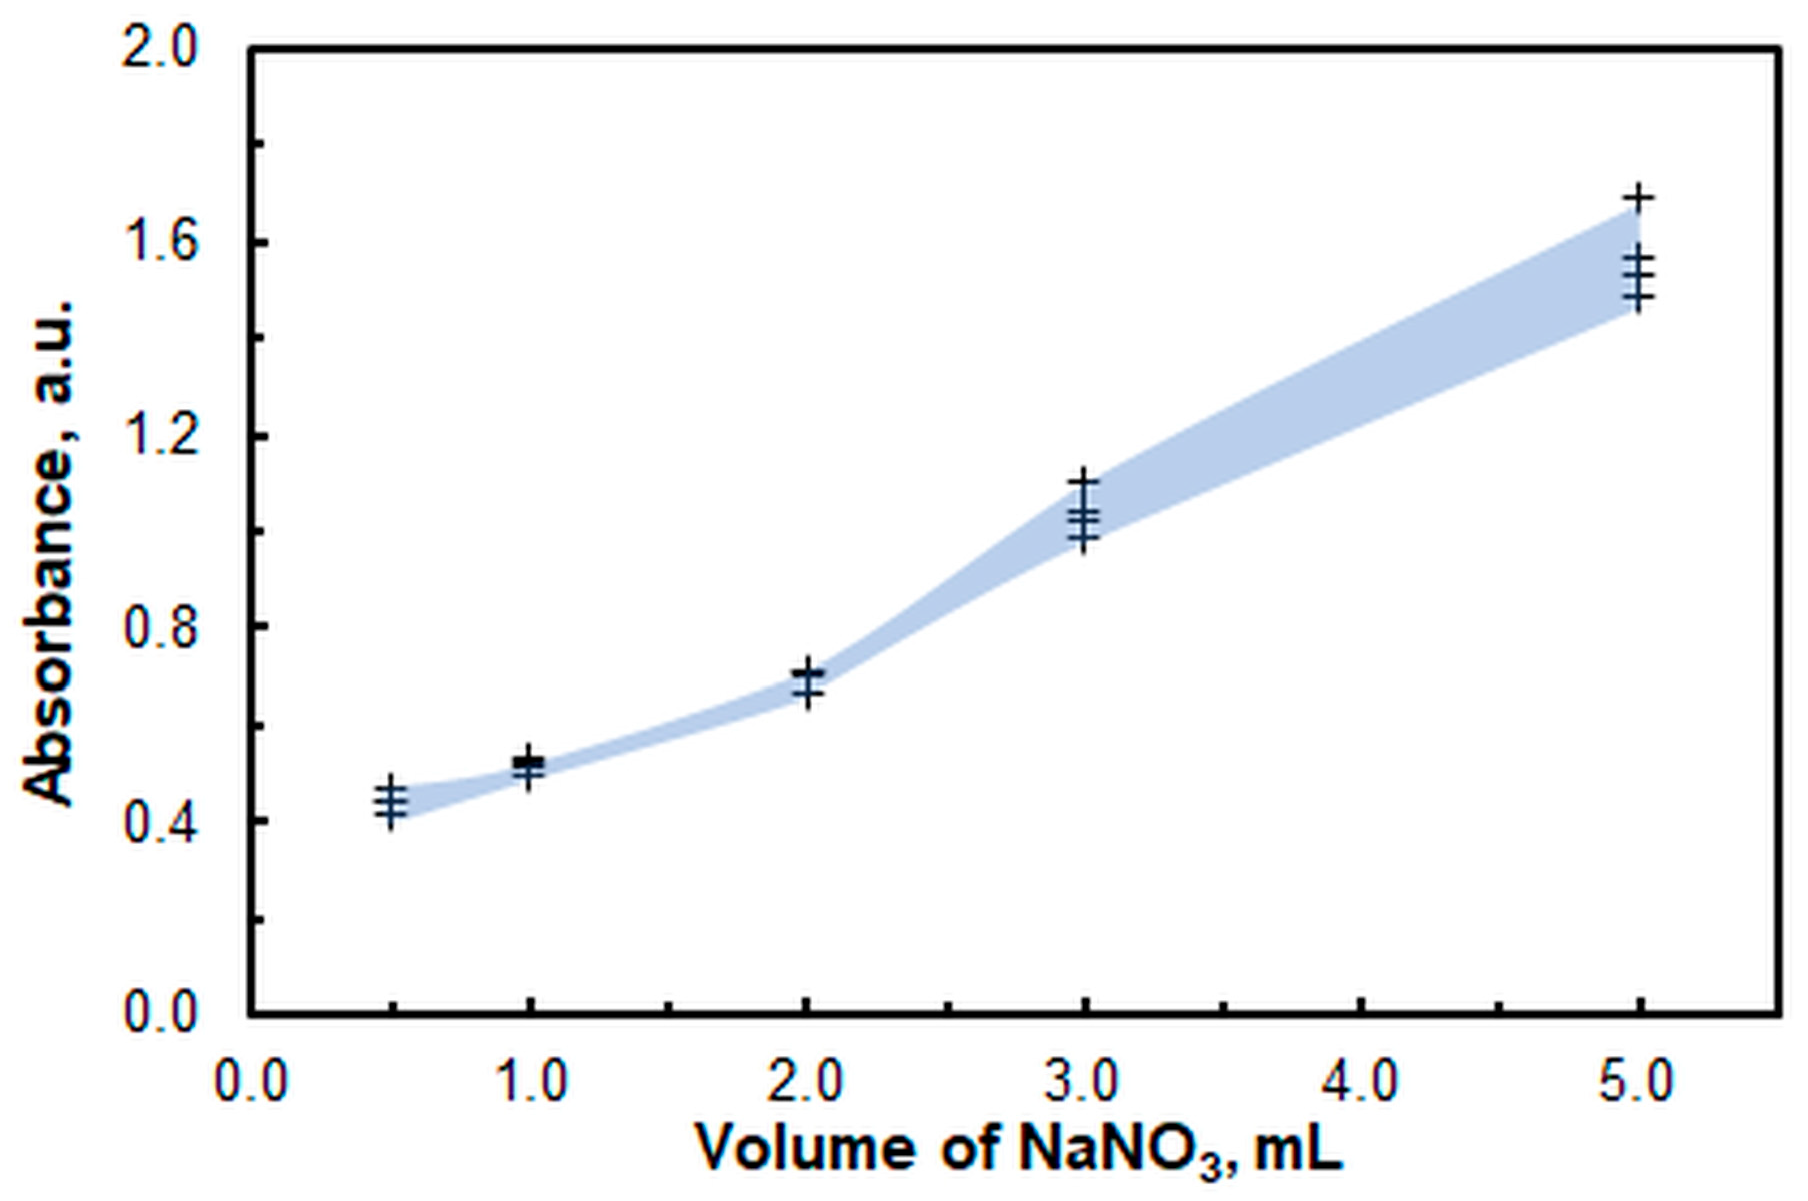
Without a salting-out agent, the absorbance of the blank is unstable, even with a buffer present. Several salts were tested as stabilizers to reduce the standard deviation of the blank: NaCl, NaNO3, and K2SO4. The best results were obtained using NaNO3 (c = 1.3 M). The optimal volume for minimal standard deviation was determined to be 1 mL (Figure 5).
Figure 6 shows the effects of the 4NC and A336 concentrations. The optimal 4NC concentration was found to be 1.5 × 10⁻⁴ M (curve 1). This value is five times lower than the concentration required for vanadium (V) determination [52]. At the current price of EUR 73 per 5 g, one package of this reagent would be sufficient for approximately 3700 samples, bringing the cost of 4NC per sample below EUR 0.020.
The cost of A336 is also reasonable (EUR 90.40 per 250 milliliters). Under the optimal concentration of 3 × 10⁻⁴ M (Figure 6, curve 2), a single 250 mL package would be sufficient for approximately 40,000 samples.
It is noteworthy that at cA336 = 0, the resultant absorbance is >0. The most probable explanation for this phenomenon is the partial extraction of the electrically neutral [Cu(4NC)] complex, which has been reported in some studies [54,56,58].
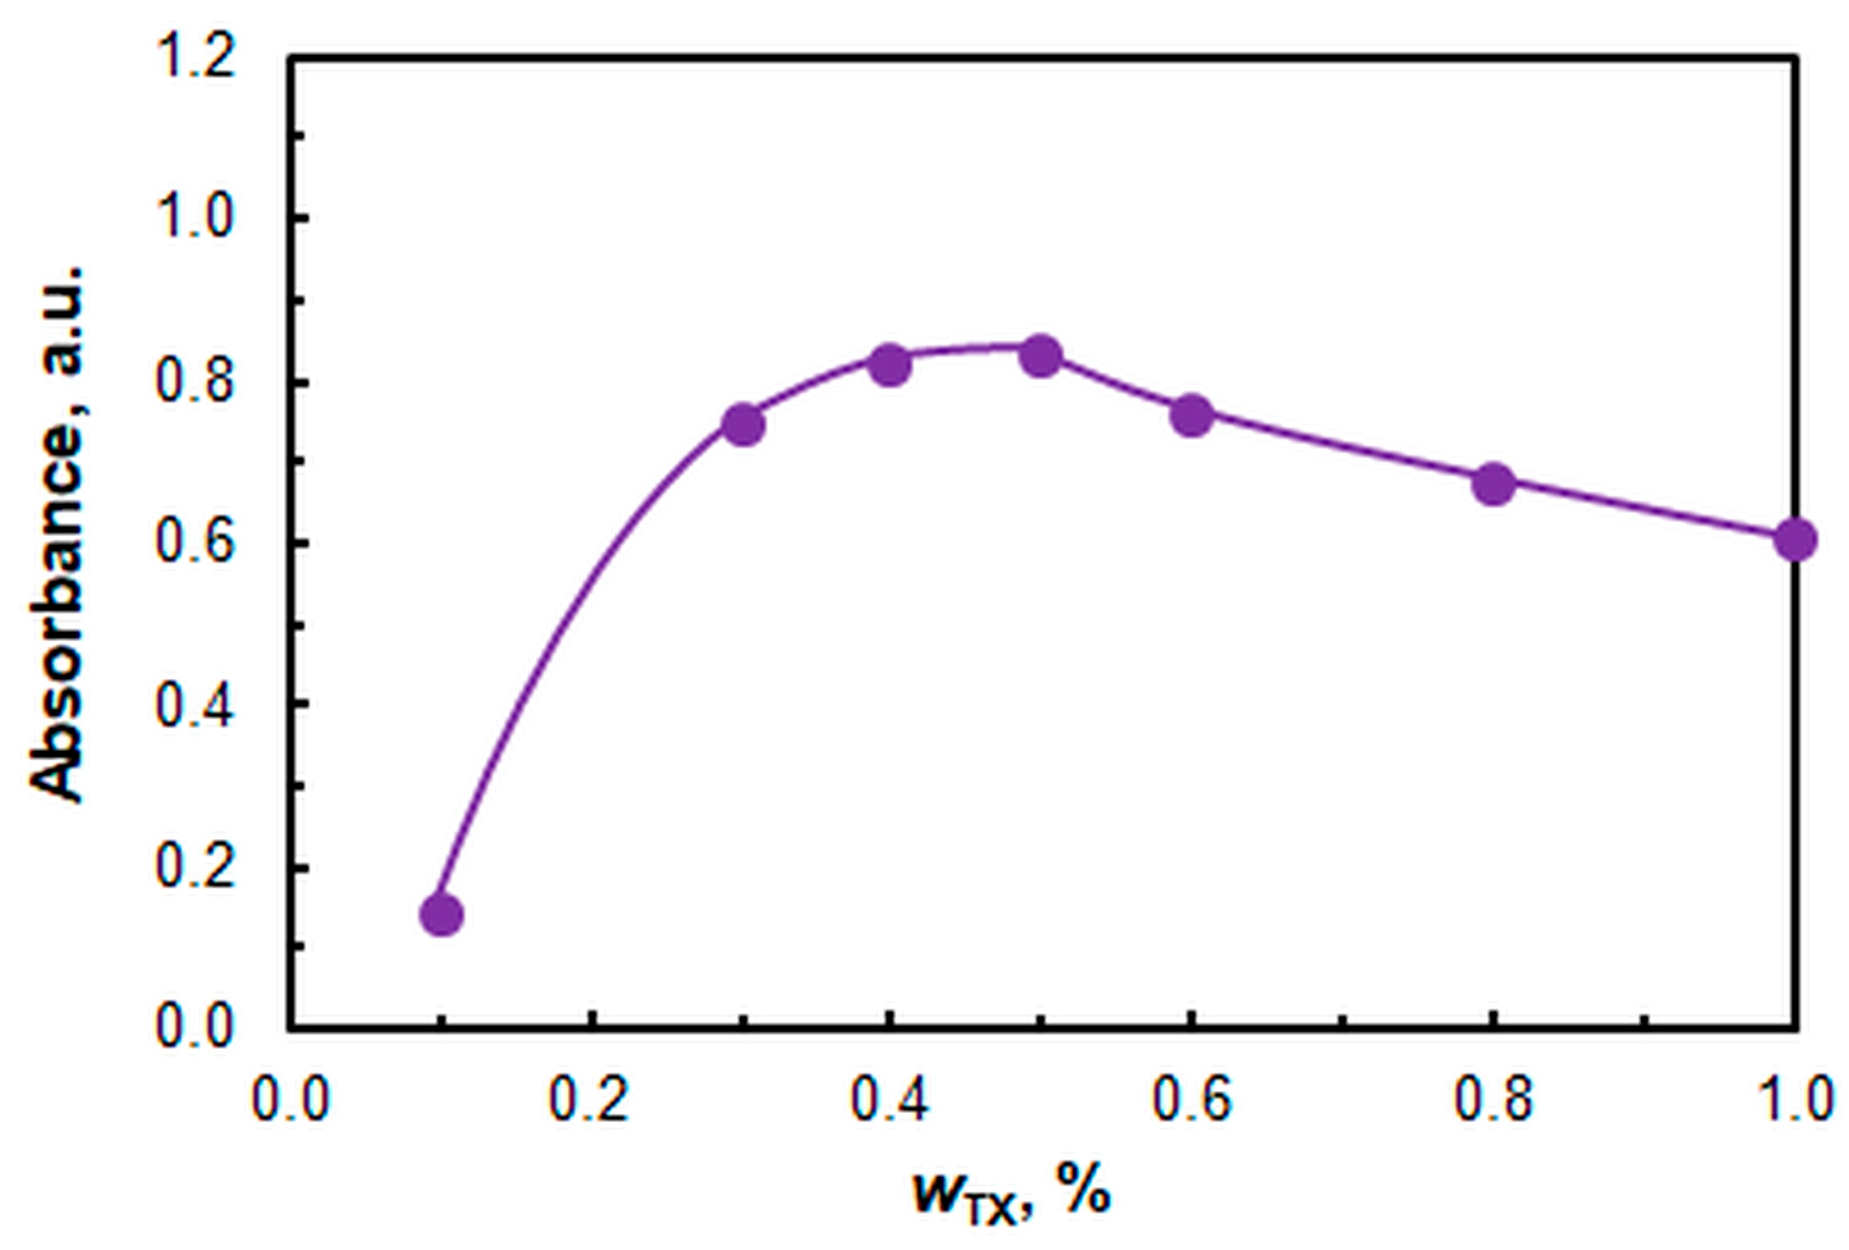
The effect of the nonionic surfactant mass fraction (wTX) is displayed in Figure 7. All subsequent studies were conducted at a wTX = 0.5%. Assuming that the average molar masses of TX and A336 are 537 g M−1 [59] and 432 g M−1 [60], respectively, it can be calculated that the molar ratio between the two surfactants (nTX:nA336) under optimal conditions is 31, and the corresponding mass ratio (mTX:mA336) is 38.6.
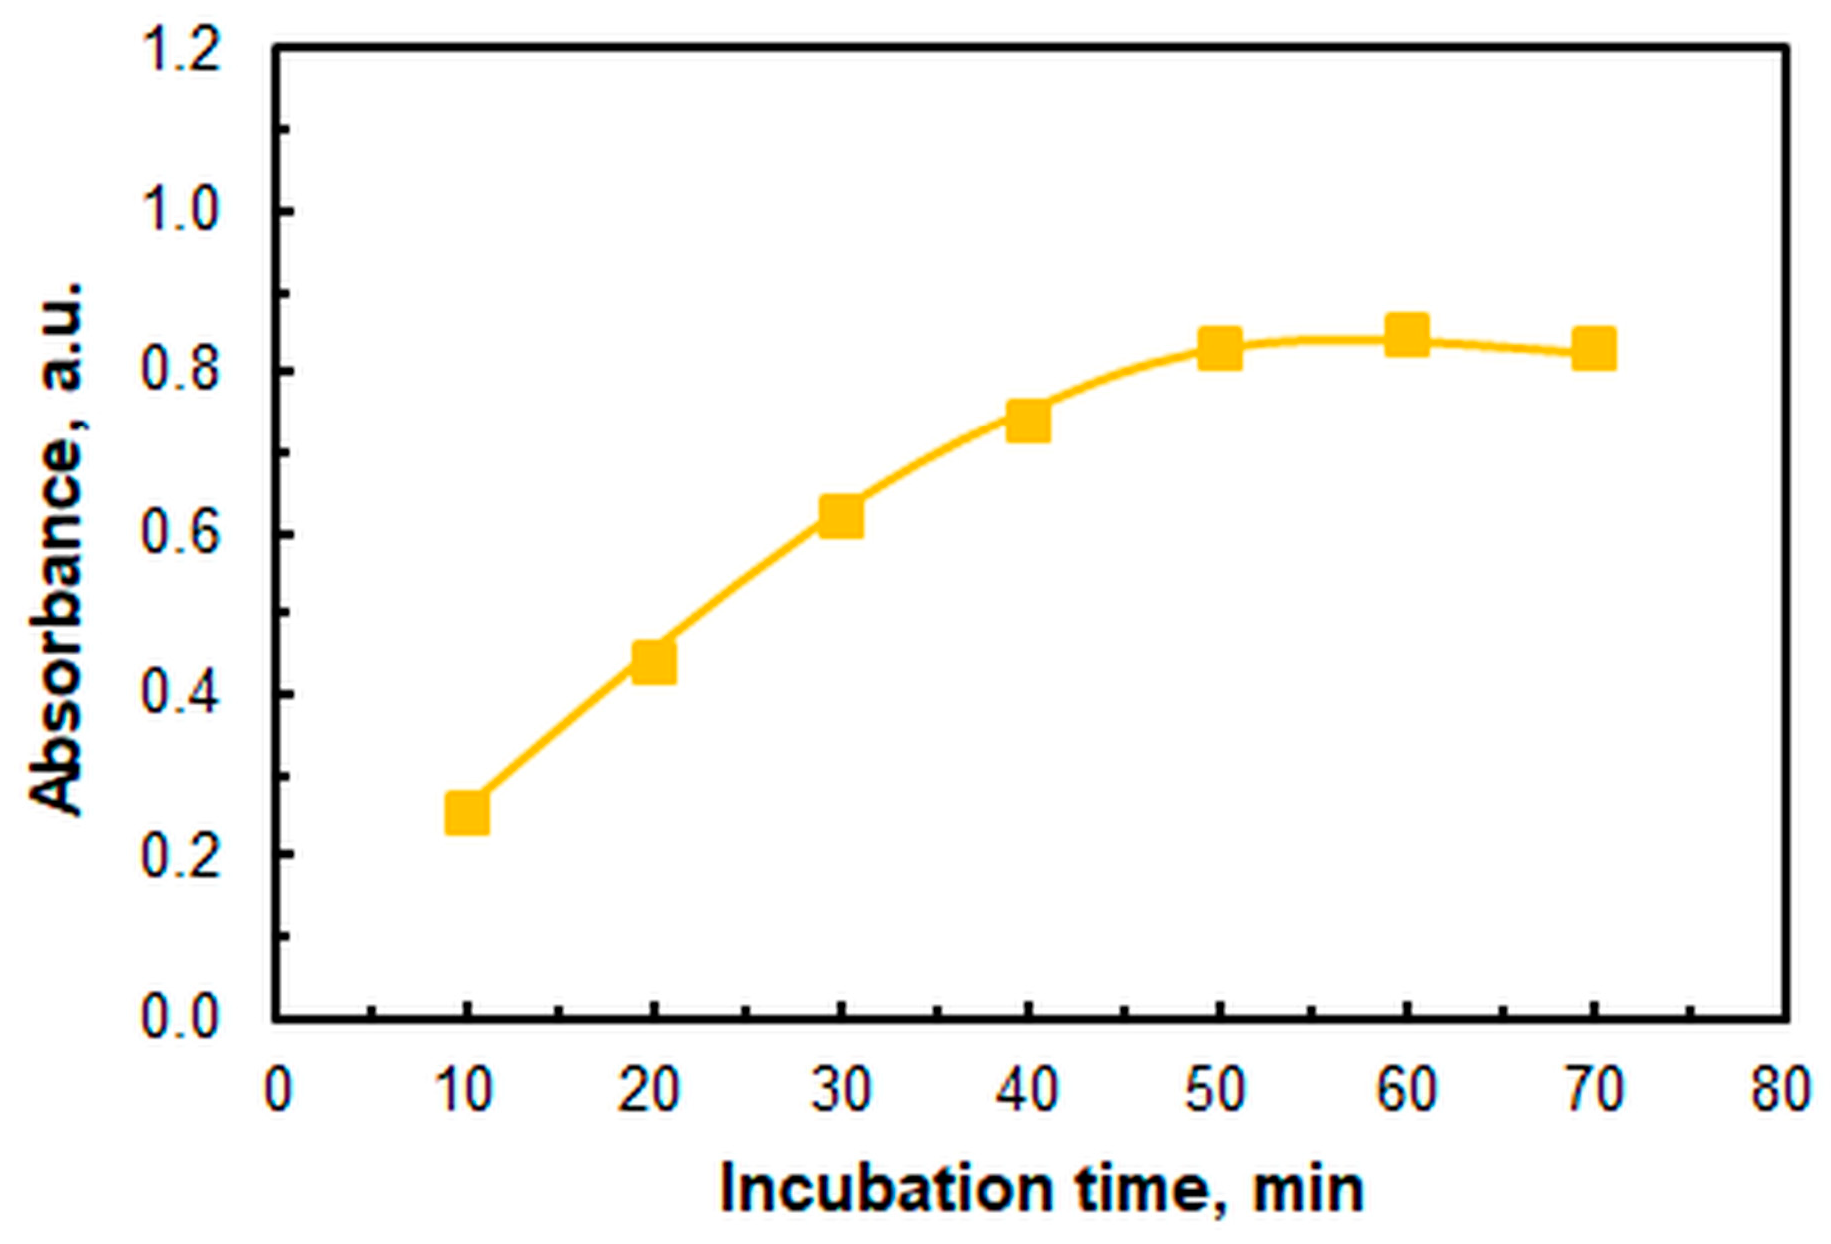
Figure 8 illustrates the relationship between absorbance and incubation time in a 60 °C water bath. The samples must remain at this temperature for at least 50 min. Therefore, the recommended incubation time is 50 min, starting from when the samples are submerged in preheated water. This incubation time is comparable to the times specified in other publications based on gravitational phase separation [29,51,52]. However, compared with other methods, the incubation time is often measured from the point at which the target temperature is reached, rather than from the moment of immersion.
The complete list of optimized parameters is shown in Table 1. The cooling time and SRP processing are based on the experiments described in previous papers [51,61]. As outlined in [52], the cooling process can be expedited by employing a centrifuge and an ice bath. However, the conventional method requires more labor and resources.
To obtain a reasonable blank absorbance, the mass of the diluted SRP was adjusted to 5.00 g. This mass included 0.5 mL of ethanol, which was added to decrease viscosity.

2.2. Formula and Extraction Constant

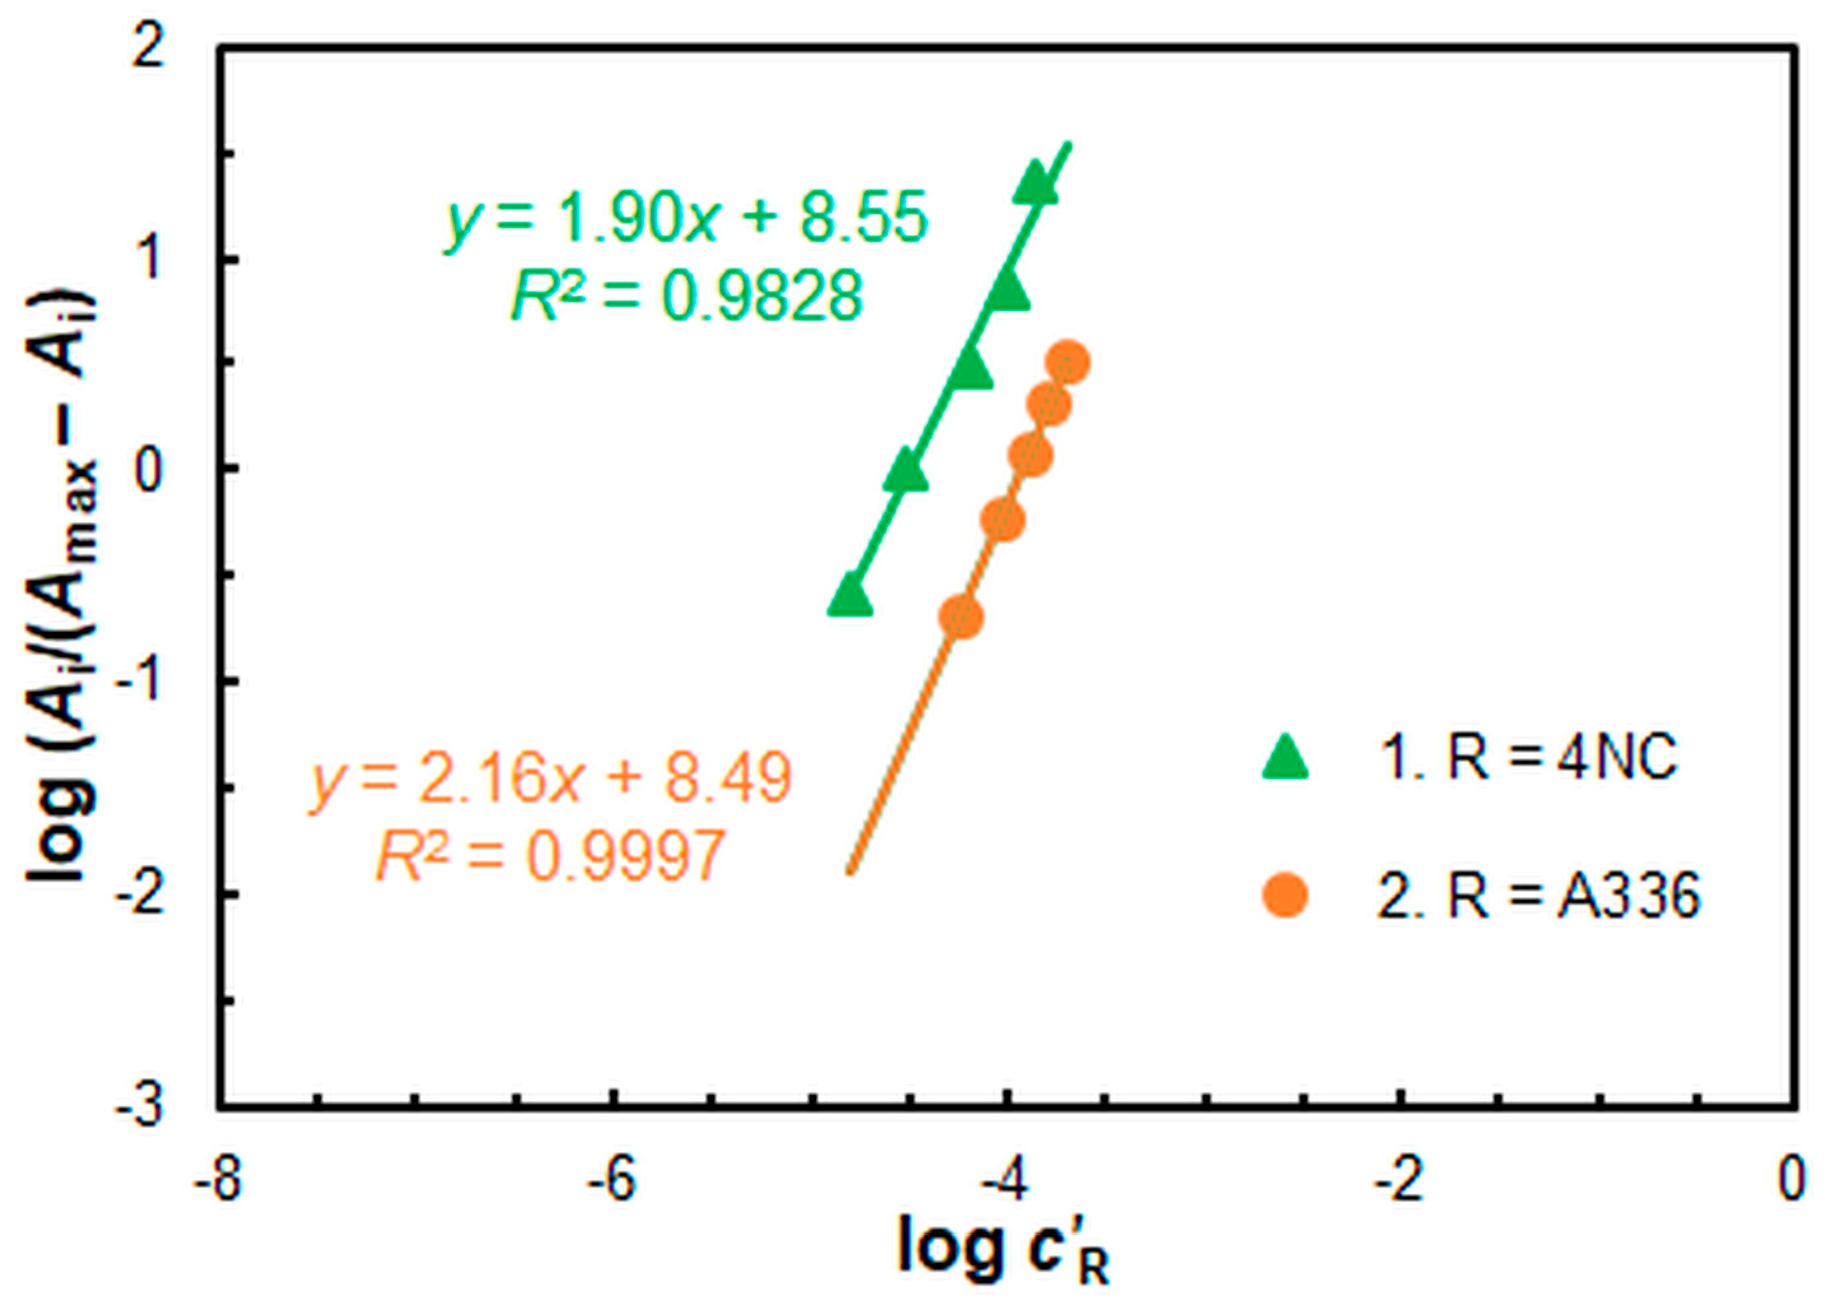
The presumed formula of the extracted ternary complex, (A336)2[CuL2], was verified by applying the mobile equilibrium method [62] (Figure 9) and the Asmus method [63] (Figure 10). Both methods revealed the following molar ratios between the components: 4NC:Cu = 2:1 and A336:Cu = 2:1. Consequently, the complex formation and CPE proceed according to Equation (2).
Cu2+(aq) + 2 H2L(aq) + 2 A336+(aq) ≡ (A336)2[CuL2] (SRP) + 4 H+
The extraction constant Kex characterizing this equation was calculated using two methods: the mobile equilibrium method [62] and the Holme–Langmyhr method [64]. The results in logarithmic form are displayed in Table 2.

2.3. Analytical Characteristics

A calibration curve was constructed using CuII standards with concentrations (γ) ranging from 0.038 to 1.59 µg mL−1. The linear segment extended up to 0.763 μg mL−1 of CuII (n = 10; R2 = 0.9992), and the linear regression equation was A = 1.40γ − 0.005, where A is the absorbance. The standard deviations of the slope and intercept were determined to be 0.015 and 0.0060, respectively. The apparent molar absorption coefficient and Sandell sensitivity were (8.9 ± 0.1) × 104 M−1 cm−1 and 0.71 ng cm−2, respectively. The calculated values for the limits of detection (LOD) and quantitation (LOQ) were 9.7 and 32 ng mL−1, respectively. These values were obtained by dividing the standard deviation of the blank (n = 10) by the slope, and then multiplying by three or ten. The preconcentration factor of 9.88 was determined by dividing the maximum initial volume (50 mL) by the volume of the final phase after dilution to 5.00 g (V = 5.06 mL). The volume of the final phase was derived by measuring its density with a pycnometer (ρ = 0.9877 g cm−3).

2.4. Effects of Diverse Ions and Analytical Applications

The effects of various ions are summarized in Table 3. The studied extraction–chromogenic system demonstrates significant resistance to high concentrations of alkali and halogen ions, including K+, Na+, Li+, Cl, Br, F, and I. It also tolerates substantial amounts of common acidic anions like NO3 and SO42−, enabling the dissolution and subsequent analysis of a wide range of samples. The most significant interference arises from VV, MoVI, WVI, CrIII, and FeIII. These ions form stable, extractable complexes with 4NC [51,52,65,66], which can markedly increase the level of absorption. According to Refs. [54,67], the CuII–4NC complex is more stable than the corresponding complexes of ZnII, NiII, CoII, and MgII—a finding that aligns with the current experiments. In addition, MnII, ReVII, CdII, and several other ions have shown satisfactory levels of tolerability. Given that many of these metals are the principal constituents of copper alloys [4], the developed method proves suitable for such samples.
In addition to artificial mixtures (Table 4), the novel method was tested in the analysis of the copper-containing dietary supplement Biligo 2 Plantis® Copper (Artesania Agricola, Barcelona, Spain). According to the manufacturer, each ampoule of the product contains 858 µg CuII, a dose intended to provide maximum benefits without the risk of excessive intake [68]. After dilution with water in a 100 mL flask, the product was analyzed for two days (five replicates per day). The results showed that the measured CuII content was statistically indistinguishable from the value specified by the manufacturer. The relative standard deviations were 2.4% on Day 1 and 3.2% on Day 2. The corresponding CuII masses were 870 µg (R = 101.4%) and 842 µg (R = 97.9%), respectively. A two-sample t-test comparing these measurements revealed no significant difference between the Day 1 and Day 2 results at the 95% confidence level (tcalculated = 1.84 < tcritical = 2.306).
The scope of the research was expanded to include an analysis of a solution for infusion of 0.9% NaCl (B Braun Melsungen AG, Melsungen, Germany), which is expected to contain no copper. The analysis was executed using the standard addition method at three levels between 38 ng/mL and 153 ng/mL (with four replicates at each level). The recoveries obtained were in the range of 91.9–102.6%, and the y-intercept of the straight line (R2 = 0.9994) was b = 0.0009 ± 0.0016.

2.5. Comparisons with Existing Methods and Evaluations with Modern Assessment Tools

Table 5 compares the key characteristics of the proposed method with those of other spectrophotometric CPE techniques. The current method distinguishes itself by its feasibility, practicality, simplicity, convenience, cost-effectiveness, environmental friendliness, and analytical competitiveness. Unlike conventional CPE methods [16,17,18,19,20,21,22,23,25,26,27,28,30,31,32,33,34,35,36,37,38,39,41,42,44], it eliminates the need for centrifugation by relying on spontaneous gravitational phase separation. In contrast to techniques that require pipettes, syringes, or other tools for final phase isolation [19,21,25,33,34,39,40,44], this approach enables faster and easier decantation. Additionally, unlike the RS-CPE method, it avoids the use of large volumes of organic solvents, [22]. The reagents used—4NC and A336—are inexpensive and readily available. Unlike other approaches that involve the synthesis of reagents, composites, or supramolecular systems [16,17,19,20,23,26,33,35,38,43], this method does not require any synthetic steps. All solutions are aqueous and exhibit long-term stability, eliminating the need for daily preparation, as required in the pyrogallol method [27].
The method provides a strongly linear calibration curve with stable absorbance over time and shows good tolerance to common ions and salt solutions. However, it has some limitations, including a relatively long analysis time, limited selectivity for certain ions, relatively high blank absorbance, and a lack of miniaturization and automation.
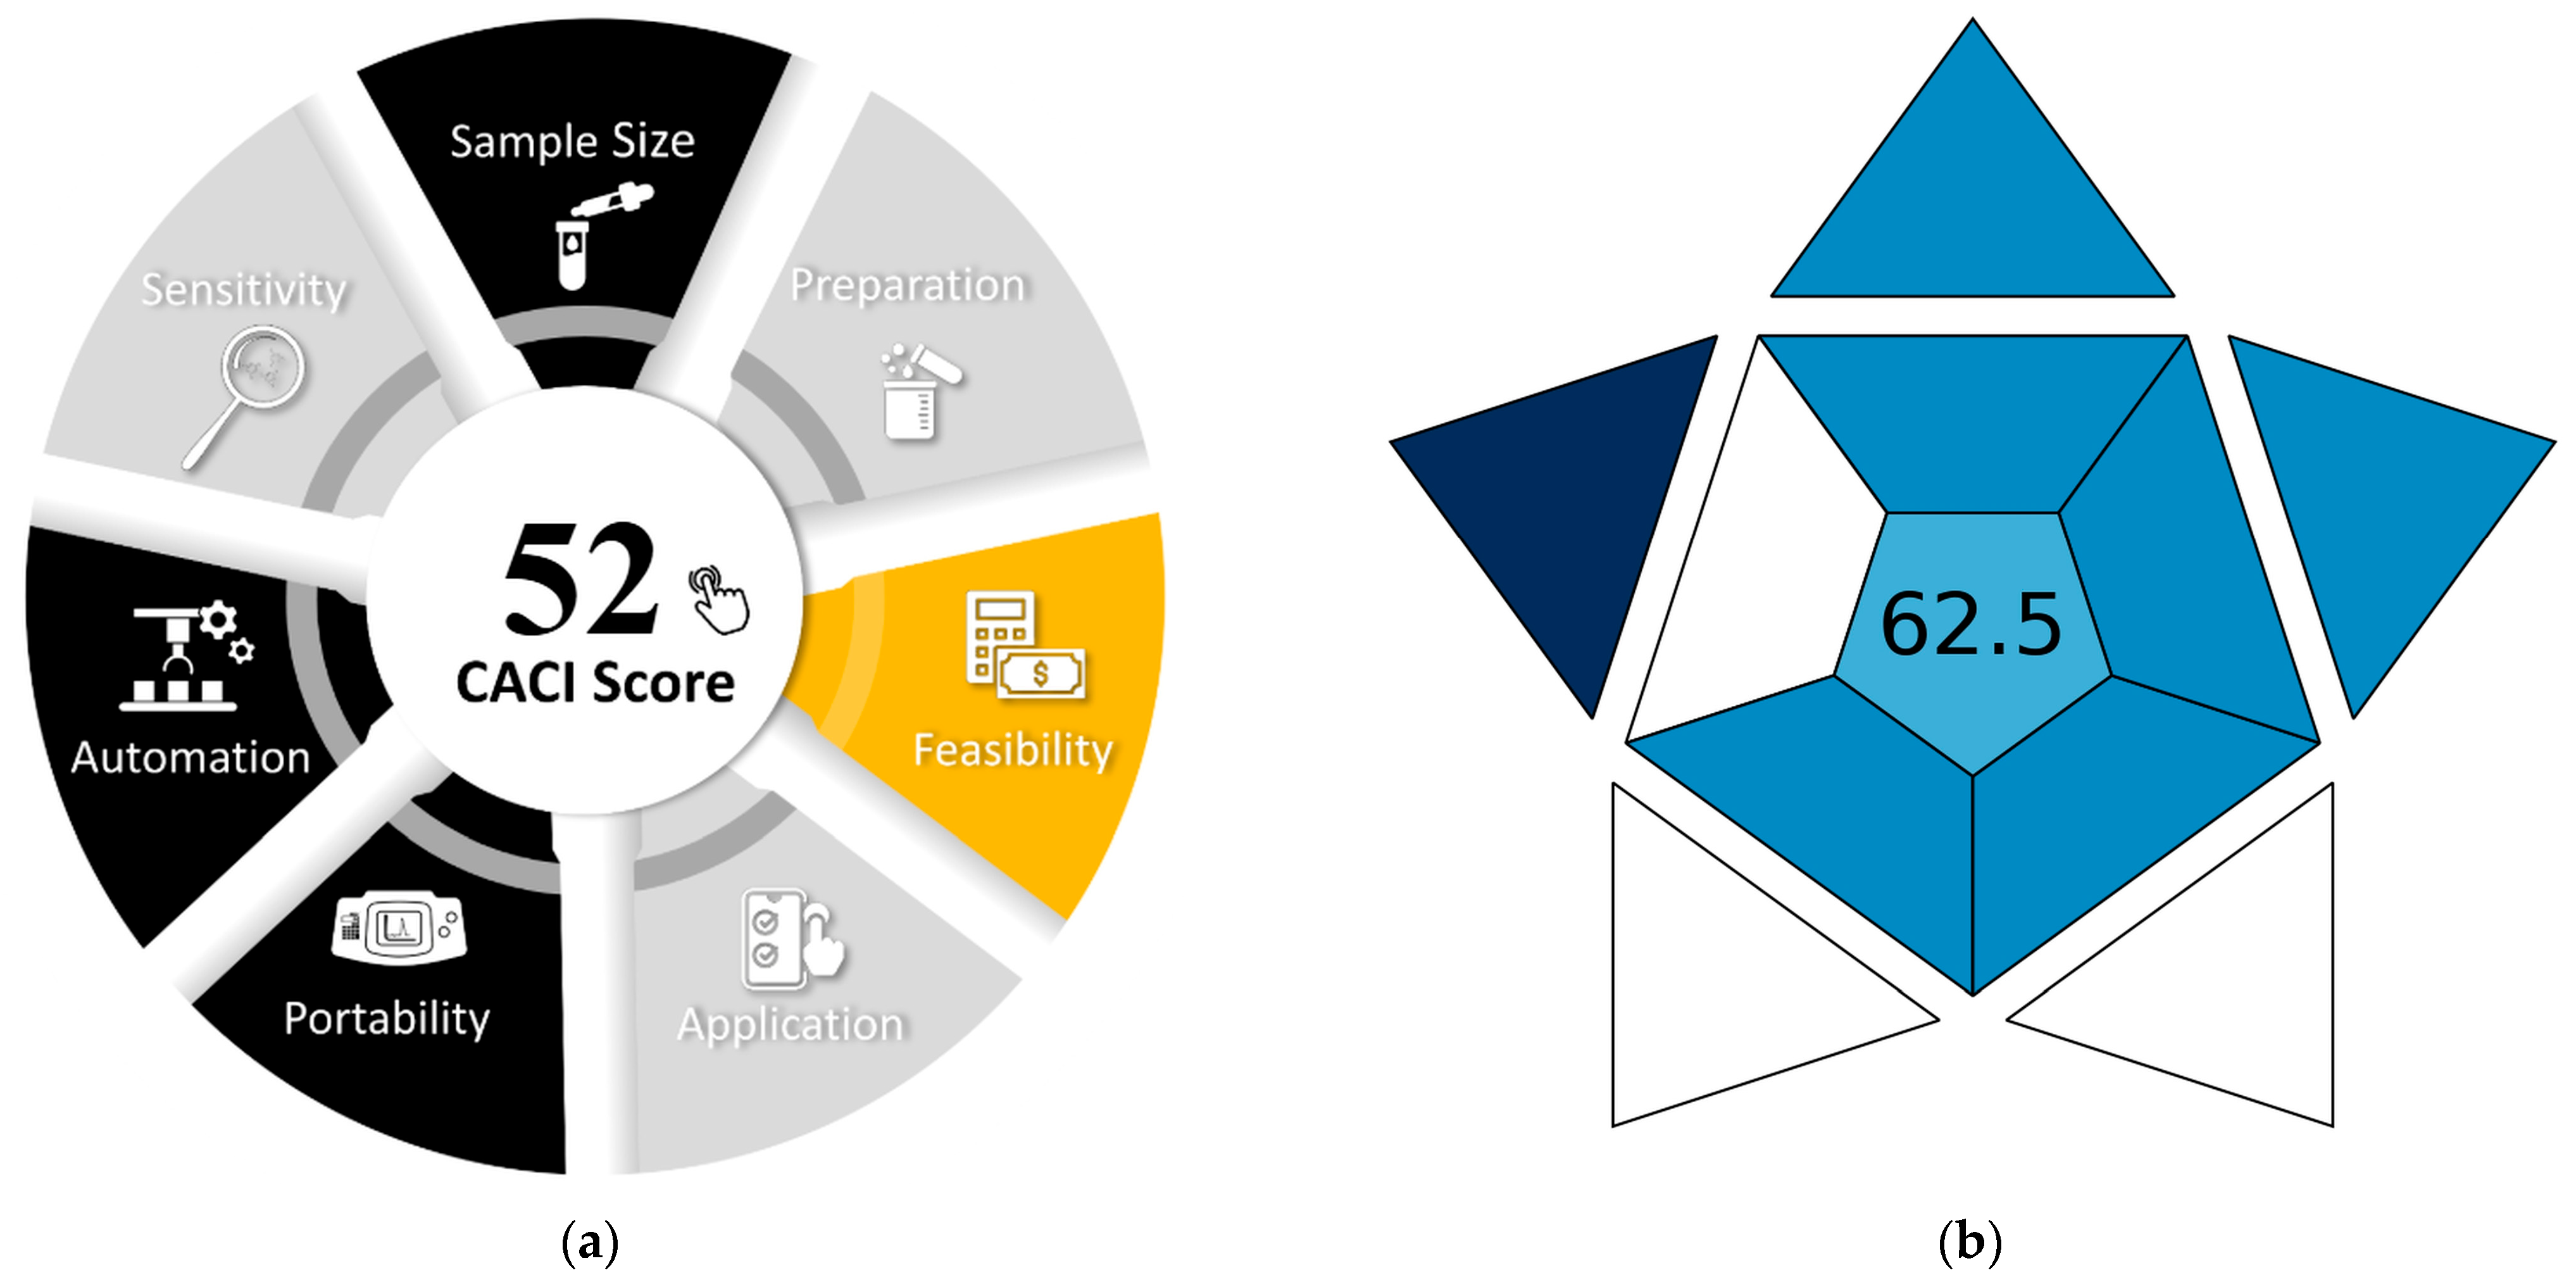
Despite these drawbacks, the method achieves high scores on two recently developed assessment tools, the Blue Applicability Grade Index (BAGI) [69] and the Click Analytical Chemistry Index (CACI) [70], highlighting its practical applicability (Figure 11).

3. Materials and Methods

3.1. Reagents and Chemicals

The chemicals were obtained from Merck (Schnelldorf, Germany) and utilized without additional purification. The stock solution of CuII was prepared from CuSO4·5H2O at a concentration of 1 mg mL−1 [71], and the working solutions were properly diluted with water. In the optimization step, an aqueous solution of the nonionic surfactant TX at a mass fraction of 10% and a methanol solution of A336 at a concentration of 1 × 10⁻² M were utilized. A mixed aqueous solution of these two substances was also used: it was prepared by combining 50 g of TX, 1.296 g of A336, and water in a 500 mL volumetric flask. The aqueous solutions of 4NC (≥96.0%) and NaNO3 had concentrations of 7.5 × 10⁻³ M and 1.3 M, respectively. Buffer solutions with pH ranging from 4.5 to 8.0 were prepared from 2.0 M solutions of NH3 and CH3COOH. The water was purified through either deionization (18.2 MΩ cm) or distillation.

3.2. Instrumentation

The UV–Vis spectrophotometers employed in this study were Ultrospec 3300 pro (Biochrom Ltd., Garforth, UK) and Drawell DU-8800RS (Drawell, Chongqing, China). Both instruments were equipped with 2.5 mL, 10 mm macro cuvettes. The CPE experiments were carried out using an Ohaus Pioneer PA214C analytical balance (Pubcompare, Parsippany, NJ, USA) and a GFL 1023 water bath (Gemini BV, Berlin, Germany). The pH measurements were taken using a WTW InoLab 7110 pH meter (Xylem Analytics, Weilheim, Germany).

3.3. Samples and Sample Preparation

The solution for infusion (0.9% NaCl, 500 mL; B Braun Melsungen AG, Melsungen, Germany) and the dietary supplement (Biligo 2 Plantis® Copper, 20 ampoules for drinking 2 mL each; Artesania Agricola, Barcelona, Spain) were procured from a local pharmacy. The solution for infusion was applied without further processing. Aliquots of 5 mL were used for the analysis. The ampoules of the dietary supplement required appropriate dilution. For this purpose, one ampoule was diluted with water to 100 mL, and 1.8 mL aliquots was taken for analysis. To assess the effect of time on method characteristics, the analysis was performed on two consecutive days.
Artificial mixtures that mimic alloys were prepared from copper sulfate (15.3 µg CuII) and corresponding amounts of salts of the other metals. The formulas of these salts are shown in Table 3.

3.4. Optimization Procedure

Solutions of TX, A336, CuII, buffer, 4NC, and NaNO3 were transferred to 50 mL centrifuge tubes. The mixtures were diluted to 50 mL with water and then incubated in a water bath at 60 °C for 10–70 min. After a brief cooling period in running water, the tubes were stored in a freezer set at −20 °C for 50–60 min. This cooling process is essential for the solidification of SRPs, which can then be easily separated through decantation. Subsequently, 0.5 mL of C2H5OH and a few drops of water were added to the remaining SRPs, yielding a total mass of 5.00 g per sample. Finally, the contents were homogenized by shaking and loaded into cuvettes to measure the light absorbances.

3.5. Recommended Analytical Procedure

Place an aliquot of the analyzed solution containing 32–763 ng mL−1 CuII in a 50 mL centrifuge tube. Then, add 2.5 mL of the combined TX–A336 solution, 1 mL of the NaNO3 solution (c = 1.3 M), 1 mL of the pH 6 buffer solution, and 1 mL of the 4NC solution (c = 7.5 × 10⁻³ M). Dilute the sample to 50 mL with water. Place the tube in a water bath at 60 °C. After 50 min, cool the tube briefly under running water. Then, place it in a freezer set at −20 °C for 50 min. Decant the top liquid phase. Add 0.5 mL of C2H5OH to the SRP, and then add water until the total mass reaches 5.00 g. Homogenize the mixture by shaking and then load the cuvette. Measure the absorbance at λmax = 451 nm against a blank prepared simultaneously. Finally, determine the unknown CuII concentration using a calibration or standard addition curve.

4. Conclusions

The formation of a ternary complex between CuII and 4NC in the presence of A336 was systematically investigated. The stoichiometry of the complex was determined, and the optimal conditions for a centrifuge-less extraction process were successfully established. This novel method can be categorized as a mixed micelle-mediated CL-CPE method, utilizing the synergistic properties of two surfactants: Triton X-114 and A336. This approach offers key benefits, including simplicity and efficiency, making it a promising alternative for the determination of copper(II).
Among the simplifications of the experimental procedure outlined in this paper that may positively impact future research is the use of a combined surfactant solution (A336 + TX). It is noteworthy that A336 is not soluble in water; however, it is soluble in an aqueous solution of TX114. The elimination of the need for an organic solvent to dissolve A336 renders the procedure more environmentally friendly. Moreover, the number of flasks, experimental steps, and costs is reduced.
The study of 4NC complexes is both interesting and promising. Building on the findings of this work, future research could explore the complexation behavior of iron and chromium ions under similar conditions. Such investigations would help address the challenge of determining CuII in the presence of these ions and further broaden the applicability of the proposed method.

Author Contributions

Conceptualization, K.G. and D.K.; methodology, K.G.; validation, D.K., N.M., M.R., and P.R.; formal analysis, D.K., N.M., M.R., P.R., and F.G.; investigation, D.K., N.M., M.R., P.R., and F.G.; resources, K.G., D.K., N.M., and P.R.; writing—original draft preparation, K.G.; writing—review and editing, D.K., N.M., F.G., and K.G.; visualization, D.K. and N.M.; supervision, K.G.; funding acquisition, K.G. All authors have read and agreed to the published version of the manuscript.

Funding

The APC was funded by the Medical University of Plovdiv.

Institutional Review Board Statement

Not applicable.

Informed Consent Statement

Not applicable.

Data Availability Statement

Data are contained within the article.

Conflicts of Interest

The authors declare no conflicts of interest.

References

  1. Izydorczyk, G.; Mikula, K.; Skrzypczak, D.; Moustakas, K.; Witek-Krowiak, A.; Chojnacka, K. Potential environmental pollution from copper metallurgy and methods of management. Environ. Res. 2021, 197, 111050. [Google Scholar] [CrossRef]
  2. Oorts, K. Copper. In Heavy Metals in Soils: Trace Metals and Metalloids in Soils and Their Bioavailability; Alloway, B.J., Ed.; Springer: Dordrecht, The Netherlands, 2013; pp. 367–394. [Google Scholar] [CrossRef]
  3. IMA Database of Mineral Properties. Available online: https://rruff.info/ima/ (accessed on 28 June 2025).
  4. Chatterjee, K.K. Uses of Metals and Metallic Minerals; New Age International (P) Ltd.: New Delhi, India, 2007; pp. 205–209. [Google Scholar]
  5. Chen, L.; Zhou, M.; Wang, J.; Zhang, Z.; Duan, C.; Wang, X.; Zhao, S.; Bai, X.; Li, Z.; Li, Z.; et al. A global meta-analysis of heavy metal(loid)s pollution in soils near copper mines: Evaluation of pollution level and probabilistic health risks. Sci. Total Environ. 2022, 835, 155441. [Google Scholar] [CrossRef]
  6. Potysz, A.; van Hullebusch, E.D.; Kierczak, J.; Grybos, M.; Lens, P.N.L.; Guibaud, G. Copper metallurgical slags—Current knowledge and fate: A review. Crit. Rev. Environ. Sci. Technol. 2015, 45, 2424–2488. [Google Scholar] [CrossRef]
  7. Collins, J.F. Chapter Nine—Copper nutrition and biochemistry and human (patho)physiology. In Advances in Food and Nutrition Research; Eskin, N.A.M., Ed.; Elsevier: Amsterdam, The Netherlands, 2021; Volume 96, pp. 311–364. [Google Scholar] [CrossRef]
  8. Witt, B.; Schaumlöffel, D.; Schwerdtle, T. Subcellular localization of copper—Cellular bioimaging with focus on neurological disorders. Int. J. Mol. Sci. 2020, 21, 2341. [Google Scholar] [CrossRef]
  9. EFSA Panel on Dietetic Products. Nutrition and Allergies, Scientific opinion on dietary reference values for copper. EFSA J. 2015, 13, 4253. [Google Scholar] [CrossRef]
  10. Altarelli, M.; Ben-Hamouda, N.; Schneider, A.; Berger, M.M. Copper deficiency: Causes, manifestations, and treatment. Nutr. Clin. Pract. 2019, 34, 504–513. [Google Scholar] [CrossRef] [PubMed]
  11. Scheiber, I.; Dringen, R.; Mercer, J.F.B. Copper: Effects of deficiency and overload. In Interrelations Between Essential Metal Ions and Human Diseases; Sigel, A., Sigel, H., Sigel, R.K.O., Eds.; Springer: Dordrecht, The Netherlands, 2013; pp. 359–387. [Google Scholar] [CrossRef]
  12. Topuz, B. Simultaneous spectrometric determination of Cu(II), Co(II), and Ni(II) in pharmaceutical and environmental samples with XAD-4/DMMDTC solid-phase extraction system. Biol. Trace Elem. Res. 2020, 194, 295–302. [Google Scholar] [CrossRef] [PubMed]
  13. Tehrani, M.B.; Souri, E. Third derivative spectrophotometric method for simultaneous determination of copper and nickel using 6-(2-naphthyl)-2, 3-dihydro-1,2,4- triazine-3-thione. J. Chem. 2011, 8, 905139. [Google Scholar] [CrossRef]
  14. Shaikh, A.B.; Barache, U.B.; Anuse, M.A.; Gaikwad, S.H. 4-(4’-Nitrobenzylideneimino)-3-methyl-5-mercapto-1,2,4-triazole, A new chromogenic reagent for extractive spectrophotometric determination of copper (II) in pharmaceutical and alloy samples. S. Afr. J. Chem. 2016, 69, 157–165. [Google Scholar] [CrossRef]
  15. Barache, U.B.; Shaikh, A.B.; Lokhande, T.N.; Kamble, G.S.; Anuse, M.A.; Gaikwad, S.H. An efficient, cost effective, sensing behaviour liquid-liquid extraction and spectrophotometric determination of copper(II) incorporated with 4-(4′-chlorobenzylideneimino)-3-methyl-5-mercapto-1, 2, 4-triazole: Analysis of food samples, leafy vegetables, fertilizers and environmental samples. Spectrochim. Acta Part A Mol. Biomol. Spectrosc. 2018, 189, 443–453. [Google Scholar] [CrossRef]
  16. Wannas, F.A.; Azooz, E.A.; Shalan Al-Mushhdi, A.A.A.A.-H.; Naguib, I.A. Ionic liquid-based cloud point extraction for spectrophotometric determination of copper in water and food samples using a novel imidazole derivative. J. Food Compos. Anal. 2024, 135, 106638. [Google Scholar] [CrossRef]
  17. AbdulKareem, E.A.; Al-Murshedi, A.Y.M.; Ridha, R.K.; Azooz, E.A. Optimization and greenness assessments of the supramolecular solvent-assisted cloud point extraction method for copper spectrophotometric determination in water and food samples. Green Anal. Chem. 2024, 11, 100181. [Google Scholar] [CrossRef]
  18. Snigur, D.; Duboviy, V.; Barbalat, D.; Zhukovetska, O.; Chebotarev, A.; Bevziuk, K. A rapid room-temperature cloud point extraction for spectrophotometric determination of copper (II) with 6,7-dihydroxy-2,4-diphenylbenzopyrylium chloride. Anal. Sci. 2022, 38, 949–954. [Google Scholar] [CrossRef]
  19. Gouda, A.A.; Amin, A.S. Cloud-point extraction, preconcentration and spectrophotometric determination of trace quantities of copper in food, water and biological samples. Spectrochim. Acta Part A Mol. Biomol. Spectrosc. 2014, 120, 88–96. [Google Scholar] [CrossRef]
  20. Ghali, A.A.; Hussein, A.S. Cloud point extraction for the separation, preconcentration and spectrophotometric determination of trace copper (II) in herbal plants samples using new synthesized reagent. J. Glob. Pharma Technol. 2019, 11, 817–826. [Google Scholar]
  21. Mussa, Y.O.; Ghali, A.A.; Hussei, A.S. Cloud point extraction, preconcentration and spectrophotometric determination of Co(II) and Cu(II) using 15-crown-5. Indian J. Forensic Med. Toxicol. 2020, 14, 1146–1152. [Google Scholar] [CrossRef]
  22. Wen, X.; Ye, L.; Deng, Q.; Peng, L. Investigation of analytical performance for rapidly synergistic cloud point extraction of trace amounts of copper combined with spectrophotometric determination. Spectrochim. Acta Part A Mol. Biomol. Spectrosc. 2011, 83, 259–264. [Google Scholar] [CrossRef]
  23. Snigur, D.; Chebotarev, A.; Dubovyi, V.; Barbalat, D.; Klochkova, A. Room temperature cloud point extraction: An application to preconcentration and spectrophotometric determination of copper(II). J. Serb. Chem. Soc. 2020, 85, 89–96. [Google Scholar] [CrossRef]
  24. Racheva, P.V.; Milcheva, N.P.; Genc, F.; Gavazov, K.B. A centrifuge-less cloud point extraction-spectrophotometric determination of copper(II) using 6-hexyl-4-(2-thiazolylazo)resorcinol. Spectrochim. Acta Part A Mol. Biomol. Spectrosc. 2021, 262, 120106. [Google Scholar] [CrossRef]
  25. Ghasemi, E.; Kaykhaii, M. Determination of zinc, copper, and mercury in water samples by using novel micro cloud point extraction and UV-Vis spectrophotometry. Eurasian J. Anal. Chem. 2017, 12, 313–324. [Google Scholar] [CrossRef]
  26. Zengin, H.B.; Marsan, H.; Gürkan, R. Selective extraction of Cu+ and Cu2+ ions from mushroom and lichen samples prior to analysis by micro-volume UV-Vis spectrophotometry: Application of a novel poly (SMIm)-Tris-Fe3O4 nanocomposite. J. Food Compos. Anal. 2020, 91, 103539. [Google Scholar] [CrossRef]
  27. Temel, N.K.; Gürkan, R. Application of ultrasound-assisted cloud-point extraction and spectrophotometry for preconcentration and determination of trace amounts of copper(II) in beverages. J. Anal. Chem. 2019, 74, 1174–1183. [Google Scholar] [CrossRef]
  28. Hassan, M.K.; Khudhair, A.F. Analysis and cloud point extraction of trace copper (II) in urine of occupational workers. Asian J. Chem. 2019, 31, 353–359. [Google Scholar] [CrossRef]
  29. Stefanova-Bahchevanska, T.; Ahmedov, R.S.; Zaruba, S.; Andruch, V.; Gavazov, K.B.; Delchev, V.B.; Dospatliev, L.K. A cloud-point extraction-chromogenic system for copper(II) based on 1-(2-thiazolylazo)-2-naphthol. Bulg. Chem. Commun. 2018, 50, 38–43. [Google Scholar]
  30. Liang, P.; Yang, J. Cloud point extraction preconcentration and spectrophotometric determination of copper in food and water samples using amino acid as the complexing agent. J. Food Compos. Anal. 2010, 23, 95–99. [Google Scholar] [CrossRef]
  31. Silva, S.G.; Oliveira, P.V.; Rocha, F.R. A green analytical procedure for determination of copper and iron in plant materials after cloud point extraction. J. Braz. Chem. Soc. 2010, 21, 234–239. [Google Scholar] [CrossRef]
  32. Yang, S.; Fang, X.; Duan, L.; Yang, S.; Lei, Z.; Wen, X. Comparison of ultrasound-assisted cloud point extraction and ultrasound-assisted dispersive liquid liquid microextraction for copper coupled with spectrophotometric determination. Spectrochim. Acta Part A Mol. Biomol. Spectrosc. 2015, 148, 72–77. [Google Scholar] [CrossRef]
  33. Altantawy, H.A.; Mortada, W.I.; Abdel-Latif, E.; El-Reash, Y.G.A. Cloud point extraction of copper using 4-(2-chloroacetamido)-salicylic acid as a complexing agent. Egypt. J. Chem. 2021, 64, 25–32. [Google Scholar] [CrossRef]
  34. Abbas, A.S.; Al-Khafaji, Y.; Al-Khafaji, H.A.H. Cloud point extraction as a procedure of separation and pre-concentration for cupper(II) determination using spectrofluorometric techniques. J. Pharm. Sci. Res. 2018, 10, 1748–1752. [Google Scholar]
  35. Akl, M.A.; AL-Rabasi, A.; Molouk, A.F. Cloud point extraction and FAAS determination of copper(II) at trace level in environmental samples using N-benzamido-N’-benzoylthiocarbamide and CTAB. Egypt. J. Chem. 2021, 64, 313–322. [Google Scholar] [CrossRef]
  36. Snigur, D.V.; Dubovyi, V.P.; Chebotarev, A.N. Atomic-absorption determination of copper(II) in water samples after its cloud-point extraction preconcentration. Mosc. Univ. Chem. Bull. 2020, 75, 328–332. [Google Scholar] [CrossRef]
  37. Yeliz, C.; Bişgin, A.T.; Sürme, Y.; Uçan, M.; Narin, İ. Micelle Mediated Extraction and Flame Atomic Absorption Spectrometric determination of trace amounts of copper in different mushroom species. J. Anal. Chem. 2020, 75, 1131–1136. [Google Scholar] [CrossRef]
  38. Aswathi, M.; Mathai, S.; Joseph, S.C.; Biju, V.M. Room temperature ionic liquid, cetyl pyridinium naphthenate, supported cloud point extractive separation and ultra trace determination of copper in blood and environmental samples. Sep. Sci. Technol. 2017, 52, 2540–2546. [Google Scholar] [CrossRef]
  39. Karadaş, C. A novel cloud point extraction method for separation and preconcentration of cadmium and copper from natural waters and their determination by flame atomic absorption spectrometry. Water Qual. Res. J. Can. 2017, 52, 178–186. [Google Scholar] [CrossRef]
  40. Yıldız, D.; Demir, M. Flame atomic absorption determination of copper in environmental water with cloud point extraction using Isonitrosoacetophenone 2-aminobenzoylhydrazone. J. Anal. Chem. 2019, 74, 437–443. [Google Scholar] [CrossRef]
  41. Snigur, D.; Vitaliy, D.; Michael, A.; Kateryna, B.; Viacheslav, M.; Dmytro, B.; Zhukovetska, O. A novel fast room-temperature cloud point extraction coupled to graphite furnace atomic absorption spectroscopy for copper(II) traces determination. Int. J. Environ. Anal. Chem. 2024, 104, 5254–5263. [Google Scholar] [CrossRef]
  42. Souza, V.S.; Teixeira, L.S.G.; Santos, Q.O.; Gomes, I.S.; Bezerra, M.A. Determination of copper and cadmium in petroleum produced formation water by electrothermal atomic absorption spectrometry after cloud point extraction. J. Braz. Chem. Soc. 2020, 31, 1186–1193. [Google Scholar] [CrossRef]
  43. Nekouei, F.; Nekouei, S. Solid phase-assisted determination of trace copper(II) and iron(III) in food and water samples by cloud point extraction: Response surface methodology optimization. Chiang Mai J. Sci. 2018, 45, 1960–1974. [Google Scholar]
  44. Procházková, S.; Halko, R. Determination of copper in human urine by cloud point extraction and flame atomic absorption spectrometry. Anal. Lett. 2016, 49, 1656–1668. [Google Scholar] [CrossRef]
  45. Miura, J.; Ishii, H.; Watanabe, H. Extraction and separation of nickel chelate of 1-(2-thiazolylazo)-2-naphthol in nonionic surfactant solution. Bunseki Kagaku 1976, 25, 808–809. [Google Scholar] [CrossRef]
  46. Yamini, Y.; Feizi, N.; Moradi, M. Chapter 7—Surfactant-Based Extraction Systems. In Liquid-Phase Extraction; Poole, C.F., Ed.; Elsevier: Amsterdam, The Netherlands, 2020; pp. 209–239. [Google Scholar] [CrossRef]
  47. Mortada, W.I. Recent developments and applications of cloud point extraction: A critical review. Microchem. J. 2020, 157, 105055. [Google Scholar] [CrossRef]
  48. Halko, R.; Hagarová, I.; Andruch, V. Innovative approaches in cloud-point extraction. J. Chromatogr. A 2023, 1701, 464053. [Google Scholar] [CrossRef]
  49. Snigur, D.; Azooz, E.A.; Zhukovetska, O.; Guzenko, O.; Mortada, W. Recent innovations in cloud point extraction towards a more efficient and environmentally friendly procedure. Trac-Trends Anal. Chem. 2023, 164, 117113. [Google Scholar] [CrossRef]
  50. Semysim, F.A.; Shabaa, G.J.; Azooz, E.A.; Snigur, D. Alternative green solvents in cloud point extraction methods: Recent developments, challenges, and greenness evaluation. Trends Environ. Anal. Chem. 2025, 45, e00250. [Google Scholar] [CrossRef]
  51. Divarova, V.; Gajdošová, A.; Racheva, P.; Gavazov, K. An ionic liquid-assisted mixed micelle-mediated centrifuge-less cloud point extraction spectrophotometric method for the determination of molybdenum(VI). Int. J. Mol. Sci. 2025, 26, 4597. [Google Scholar] [CrossRef]
  52. Gajdošová, A.; Racheva, P.; Kiradzhiyska, D.; Divarova, V.; Saravanska, A.; Šandrejová, J.; Gavazov, K. Centrifuge-less mixed micelle-mediated cloud point extraction-spectrophotometric determination of vanadium using 4-nitrocatechol and cetylpyridinium chloride. Int. J. Mol. Sci. 2025, 26, 5808. [Google Scholar] [CrossRef] [PubMed]
  53. Sigma-Aldrich Safety Data Sheet: 4-Nitrocatechol. Available online: https://www.sigmaaldrich.com/BG/en/sds/aldrich/n15553?userType=anonymous (accessed on 28 June 2025).
  54. Alempijević, S.B.; Vidović, K.; Vukosav, P.; Frka, S.; Kroflič, A.; Mihaljević, I.; Grgić, I.; Strmečki, S. Integrating voltammetry in ecotoxicology: Cu(II)-nitrocatechol complexes formation as a driver of Cu(II) and nitrocatechol toxicity in aquatic systems. Electrochim. Acta 2025, 522, 145938. [Google Scholar] [CrossRef]
  55. Häkkinen, P. Formation of copper(II) and zinc(II) complexes of 1,2-dihydroxy-4-nitrobenzene in aqueous solution. Finn. Chem. Lett. 1984, 9–12. [Google Scholar]
  56. Gavazov, K.B. Nitroderivatives of catechol: From synthesis to application. Acta Chim. Slov. 2012, 59, 1–17. [Google Scholar]
  57. Sai Krishna, D.; Noorbasha, N.M.; Jai Kumar, S. A new sequential and simultaneous speciation analysis of thallium in coal effluents by graphite furnace atomic absorption spectrometry after a novel ligandless mixed micelle cloud point extraction. Int. J. Environ. Anal. Chem. 2020, 100, 1079–1093. [Google Scholar] [CrossRef]
  58. Jameson, R.F.; Wilson, M.F. Thermodynamics of the interactions of catechol with transition metals. Part III. The effect of 4-chloro- and 4-nitro-substitution on proton and metal catechol complex formation. Dalton Trans. 1972, 2617–2621. [Google Scholar] [CrossRef]
  59. Triton™ X-114. Available online: https://www.sigmaaldrich.com/BG/en/product/sial/x114?srsltid=AfmBOorNeNd-XYYwrMeloEmk2Ao3KyEv4boAEWyCarCUhMe0GWjMRuDD (accessed on 28 June 2025).
  60. Mikkola, J.-P.; Virtanen, P.; Sjoholm, R. Aliquat 336—A versatile and affordable cation source for an entirely new family of hydrophobic ionic liquids. Green Chem. 2006, 8, 250–255. [Google Scholar] [CrossRef]
  61. Gavazov, K.B.; Racheva, P.V.; Saravanska, A.D.; Genc, F.; Delchev, V.B. Mono- and binuclear complexes in a centrifuge-less cloud-point extraction system for the spectrophotometric determination of zinc(II). Molecules 2024, 29, 4511. [Google Scholar] [CrossRef]
  62. Zhiming, Z.; Dongsten, M.; Cunxiao, Y. Mobile equilibrium method for determining composition and stability constant of coordination compounds of the form MmRn. J. Rare Earths 1997, 15, 216–219. [Google Scholar]
  63. Asmus, E. Eine neue Methode zur Ermittlung der Zusammensetzung schwacher Komplexe. Fresenius’ J. Anal. Chem. 1960, 178, 104–116. [Google Scholar] [CrossRef]
  64. Holme, A.; Langmyhr, F.J. A modified and a new straight-line method for determining the composition of weak complexes of the form AmBn. Anal. Chim. Acta 1966, 36, 383–391. [Google Scholar] [CrossRef]
  65. Racheva, P.V.; Saravanska, A.D.; Toncheva, G.K.; Kiradzhiyska, D.D.; Milcheva, N.P.; Divarova, V.V.; Pencheva, I.P.; Stojnova, K.T.; Delchev, V.B.; Gavazov, K.B. A Semi-Micro Extraction Spectrophotometric Determination of Iron Using 4-Nitrocatechol and Xylometazoline Hydrochloride. Molecules 2025, 30, 899. [Google Scholar] [CrossRef] [PubMed]
  66. Divarova, V.V.; Stojnova, K.T.; Radkovska, I.D.; Saravanska, A.D.; Toncheva, G.K.; Delchev, V.B.; Gavazov, K.B. Extraction system for the spectrophotometric determination of tungsten(VI) with 4-nitrocatechol and benzalkonium chloride. Acta Chim. Slov. 2024, 71, 519–527. [Google Scholar] [CrossRef]
  67. Murakami, Y.; Tokunaga, M. Stability order in metal chelate compounds. III. 4-nitro-and 4-chlorocatechol complexes. Bull. Chem. Soc. Jpn. 1964, 37, 1562–1563. [Google Scholar] [CrossRef]
  68. Biligo 2 Copper Plantis®. Available online: https://fitness1.bg/minerali/artesania-agricola/biligo-2-copper-plantis-0.858-mg/52842 (accessed on 28 June 2025).
  69. Manousi, N.; Wojnowski, W.; Płotka-Wasylka, J.; Samanidou, V. Blue applicability grade index (BAGI) and software: A new tool for the evaluation of method practicality. Green Chem. 2023, 25, 7598–7604. [Google Scholar] [CrossRef]
  70. Mansour, F.R.; Bedair, A.; Locatelli, M. Click Analytical Chemistry Index as a novel concept and framework, supported with open source software to assess analytical methods. Adv. Sample Prep. 2025, 14, 100164. [Google Scholar] [CrossRef]
  71. Marczenko, Z.; Balcerzak, M. Separation, Preconcentration and Spectrophotometry in Inorganic Analysis; Elsevier: Amsterdam, The Netherlands, 2000; p. 178. [Google Scholar]
Figure 1. Absorption spectra of the CuII–4NC–A336 complex against blank (1) and the blank against water (2). cCu = 8.8 × 10⁻⁶ M, pH = 6, cNaNO3 = 2.6 × 10⁻², wTX = 0.5%, cA336 = 3 × 10⁻⁴ M, c4NC = 1.5 × 10⁻⁴ M, tinc = 55 min.
Molecules 30 03287 g001
Figure 2. Effect of pH. cCu = 1.1 × 10⁻⁵ M, cNaNO3 = 2.6 × 10⁻², cA336 = 3 × 10⁻⁴ M, wTX = 0.5%, c4NC = 1.5 × 10⁻⁴ M, tinc = 55 min, λ = 451 nm.
Molecules 30 03287 g002
Figure 3. Effect of buffer volume (pH 6). cCu = 4.2 × 10⁻⁶ M, cNaNO3 = 2.6 × 10⁻², cA336 = 3 × 10⁻⁴ M, wTX = 0.5%, c4NC = 1.5 × 10⁻⁴ M, tinc = 55 min, λ = 451 nm.
Molecules 30 03287 g003
Figure 4. The combined effect of the buffer volume (pH 6) and standing time on the absorbance of the blank against water (a) and the absorbance of the Cu–4NC–A336 complex against the blank (b). cCu = 4.2 × 10⁻⁶ M (b), cNaNO3 = 2.6 × 10⁻² (a,b), cA336 = 3 × 10⁻⁴ M (a,b), wTX = 0.5% (a,b), c4NC = 1.5 × 10⁻⁴ M (a,b), tinc = 55 min (a,b), λ = 451 nm (a,b).
Molecules 30 03287 g004
Figure 5. Effect of the NaNO3 volume (c = 1.3 M) on the absorbance of the blank (n = 4). pH = 6, cA336 = 3 × 10⁻⁴ M, wTX = 0.5%, c4NC = 1.5 × 10⁻⁴ M, tinc = 55 min, λ = 451 nm.
Molecules 30 03287 g005
Figure 6. Effect of reagent concentrations: 4NC (curve 1) and A336 (curve 2). cCu = 9.4 × 10⁻⁶ M, pH = 6, wTX = 0.5%, tinc = 55 min, λ = 451 nm. 1—cA336 = 3 × 10⁻⁴ M; 2—c4NC = 1.5 × 10⁻⁴ M.
Molecules 30 03287 g006
Figure 7. Effect of TX mass fraction. cCu = 9.4 × 10⁻⁶ M, pH = 6, cA336 = 3 × 10⁻⁴ M, c4NC = 1.5 × 10⁻⁴ M, tinc = 55 min, λ = 451 nm.
Molecules 30 03287 g007
Figure 8. Effect of incubation time. T = 60 °C, cCu = 9.4 × 10⁻⁶ M, pH = 6, wTX = 0.5%, cA336 = 3 × 10⁻⁴ M, c4NC = 1.5 × 10⁻⁴ M, λ = 451 nm.
Molecules 30 03287 g008
Figure 9. Determination of the 4NC:CuII (straight-line 1) and A336:CuII (straight-line 2) molar ratios via the mobile equilibrium method.
Molecules 30 03287 g009
Figure 10. Determination of the 4NC:CuII (a) and A336:CuII (b) molar ratios using the Asmus method.
Molecules 30 03287 g010
Figure 11. Application of CACI (a) and BAGI (b) for evaluating the present procedure.
Molecules 30 03287 g011
Table 1. The results of the system’s optimization.
ParameterOptimal Value
Wavelength, nm451
pH6.0
Volume of the buffer, mL1.0
Mass fraction of TX (wTX), %0.5
Concentration of A336 (cA336), M3.0 × 10−4
Concentration of 4NC (c4NC), M1.5 × 10−4
Concentration of NaNO3 (cNaNO3), M2.6 × 10−2
Incubation time at 60 °C (tinc), min50
Refrigeration time (−20 °C), min50
Test tube volume, mL50
Mass * of the diluted SRP, g5.00
* Diluted with ethanol (0.5 mL) and water.
Table 2. Conditional extraction constant values.
MethodLog Kex *
Mobile equilibrium method7.85 ± 0.08 (n = 5)
Holme–Langmyhr method7.93 ± 0.11 (n = 4)
* ± Standard deviation (SD).
Table 3. Effect of diverse ions on the determination of 15.3 μg CuII.
IonAdded Salt FormulaIon:CuII Mass RatioCuII Found, μgR, %
AlIIIAl2(SO4)3·18H2O 20 a16.0105
Br NaBr2000 b14.595.1
CaIICa(NO3)250014.695.6
CdIICd(NO3)2·4H2O25014.796.5
Cl NaCl2000 b14.997.6
CoIICo(NO3)2·6H2O20015.199.3
CrIIICr2(SO4)30.116.2106
FNaF100015.9104
FeIIINH4Fe(SO4)2·12H2O0.546.3303
HgIHg2(NO3)2214.695.4
IKI100015.3100
LiILiCl2000 b15.8104
MgIIMgSO4·7H2O2000 b15.6102
MnIIMnSO4·5H2O250 b15.3100
NiIINiSO4·6H2O25015.098.6
PbIIPb(NO3)2216.0105
ReVIINH4ReO425014.796.2
VVNH4VO30.223.0148
WVINa2WO4·2H2O117.8117
ZnIIZnSO4·7H2O10015.298.9
a In the presence of F (7.7 mg). b Higher mass ratios were not studied.
Table 4. Analysis of artificial mixtures that simulate copper alloys.
AlloyIngredients [4]Copper Found, %RSD, %R, %
Constantan55.0% Cu, 45.0% Ni54.63.899.3
German silver (#1) 55.0% Cu, 18.0% Ni, 27.0% Zn54.53.699.1
German silver (#2) 62.0% Cu, 10.0% Ni, 28.0% Zn63.62.7102.5
Die-casting brass60.0% Cu, 39.5% Zn; 0.5% Al58.62.397.7
Manganin86.0% Cu,12.0% Mn, 2.0% Ni85.92.399.9
Cupro-nickel (#1)68.0% Cu, 30.0% Zn; 1.0% Fe; 1.0% Mn69. 82.0102.6
Cupro-nickel (#2)88.0% Cu, 10.0% Zn; 1.5% Fe; 0.5% Mn87.71.099.7
Table 5. Comparison with other CPE methods coupled with UV/Vis.
Reagent(s)Extraction TechniqueExtractant(s)pHλmax, nmε·10−4, M−1 cm−1Linear Range,
ng mL−1
LOD,
ng mL−1
SampleRef.
15-Crown-5CPETX-11442521.02200–7000100Spinach, tomato sauce, green tea, and black tea[21]
ATAPCPETX-1144.560843.74.0–1151.20Food, water, and biological samples[19]
BIDP + OMIAFP6IL-CPETX-1009.0610N. R.0.3–6000.1Water, fruit, and vegetable samples[16]
BMPHSUPRAS-CPETX-11425706.30.2–700.00.1Food and drinking water[17]
BrPAACPETX-11485122.327–15005.9Herbal plants[20]
DDTCRS-CPETX-10012435N. R.Up to 500.4Water samples, defatted milk powder, tea[22]
DHMPhB RT-CPETX-1004.5540N. R.20–9506Water samples[23]
HTAR CL-CPETX-1145.953525.44.5–2541.34Water samples, saline solution for infusion[24]
IsoleucineCPETX-1009.0230N. R.10–10005Food and water samples[30]
PARM-CPETX-1148.0515N. R.20–1009.8Tap water[25]
PG + ST UA-CPETX-1145.5532N. R.2–300 0.6Beverages[27]
Poly (SMIm)-Tris-Fe3O4UA-CPETX-114 (CuI) CTAB (CuII)7.0
5.0
347N. R.0.3−150 (CuI)
10−350 (CuII)
0.093
3.03
Lichen and mushroom samples[26]
SAOCPETX-1144.2380N. R.500−16,000103Urine[28]
4NC+ A336IL-MM-CL-CPETX-114 6.04518.932–7639.7Synthetic mixtures and pharmaceutical samples This work
Abbreviations: ATAP, 2-amino-4-(m-tolylazo)pyridine-3-ol; BIDP, 2,2(1H-benzo[d]imidazole-1,2-diyl) diphenol; BMPH, benzyl mono(2-pyridyl) hydrazine; BrPAA, 6-(4-bromophenylazo) m-anisidine; CTAB, cetyltrimethylammonium bromide; DDTC, diethyldithiocarbamate; DHDPhB, 6,7-dihydroxy-2,4-diphenylbenzopyrylium chloride; HTAR, 6-hexyl-4-(2-thiazolylazo)-resorcinol; M-CPE, micro-CPE; N. R., not reported; OMIAFP6, 1-octyl-3-methylimidazolium hexafluorophosphate; PAR, 4-(2-pyridylazo)-resorcinol; PG, pyrogallol; RS-CPE, rapidly synergistic CPE; RT-CPE, room temperature CPE; SAO, salicylaldoxime; ST, Safranin T; TX-100, Triton X-100; TX-114, Triton X-114; Poly (SMIm)-Tris-Fe3O4, styrene–maleicimide copolymer functionalized with tris(2-hydroxymethyl)aminomethane and magnetite; SUPRAS, supramolecular solvent; UA-CPE, ultrasound assisted CPE.
Disclaimer/Publisher’s Note: The statements, opinions and data contained in all publications are solely those of the individual author(s) and contributor(s) and not of MDPI and/or the editor(s). MDPI and/or the editor(s) disclaim responsibility for any injury to people or property resulting from any ideas, methods, instructions or products referred to in the content.