
Therapeutic Drug Monitoring of Everolimus Using Volumetric Absorptive Microsampling and Quantitative Dried Blood Spot Methods with LC-MS/MS in Adult Solid Organ Transplant Recipients: An Analytical and Clinical Comparative Study

 ,
,  , , , and
Abstract

1. Introduction
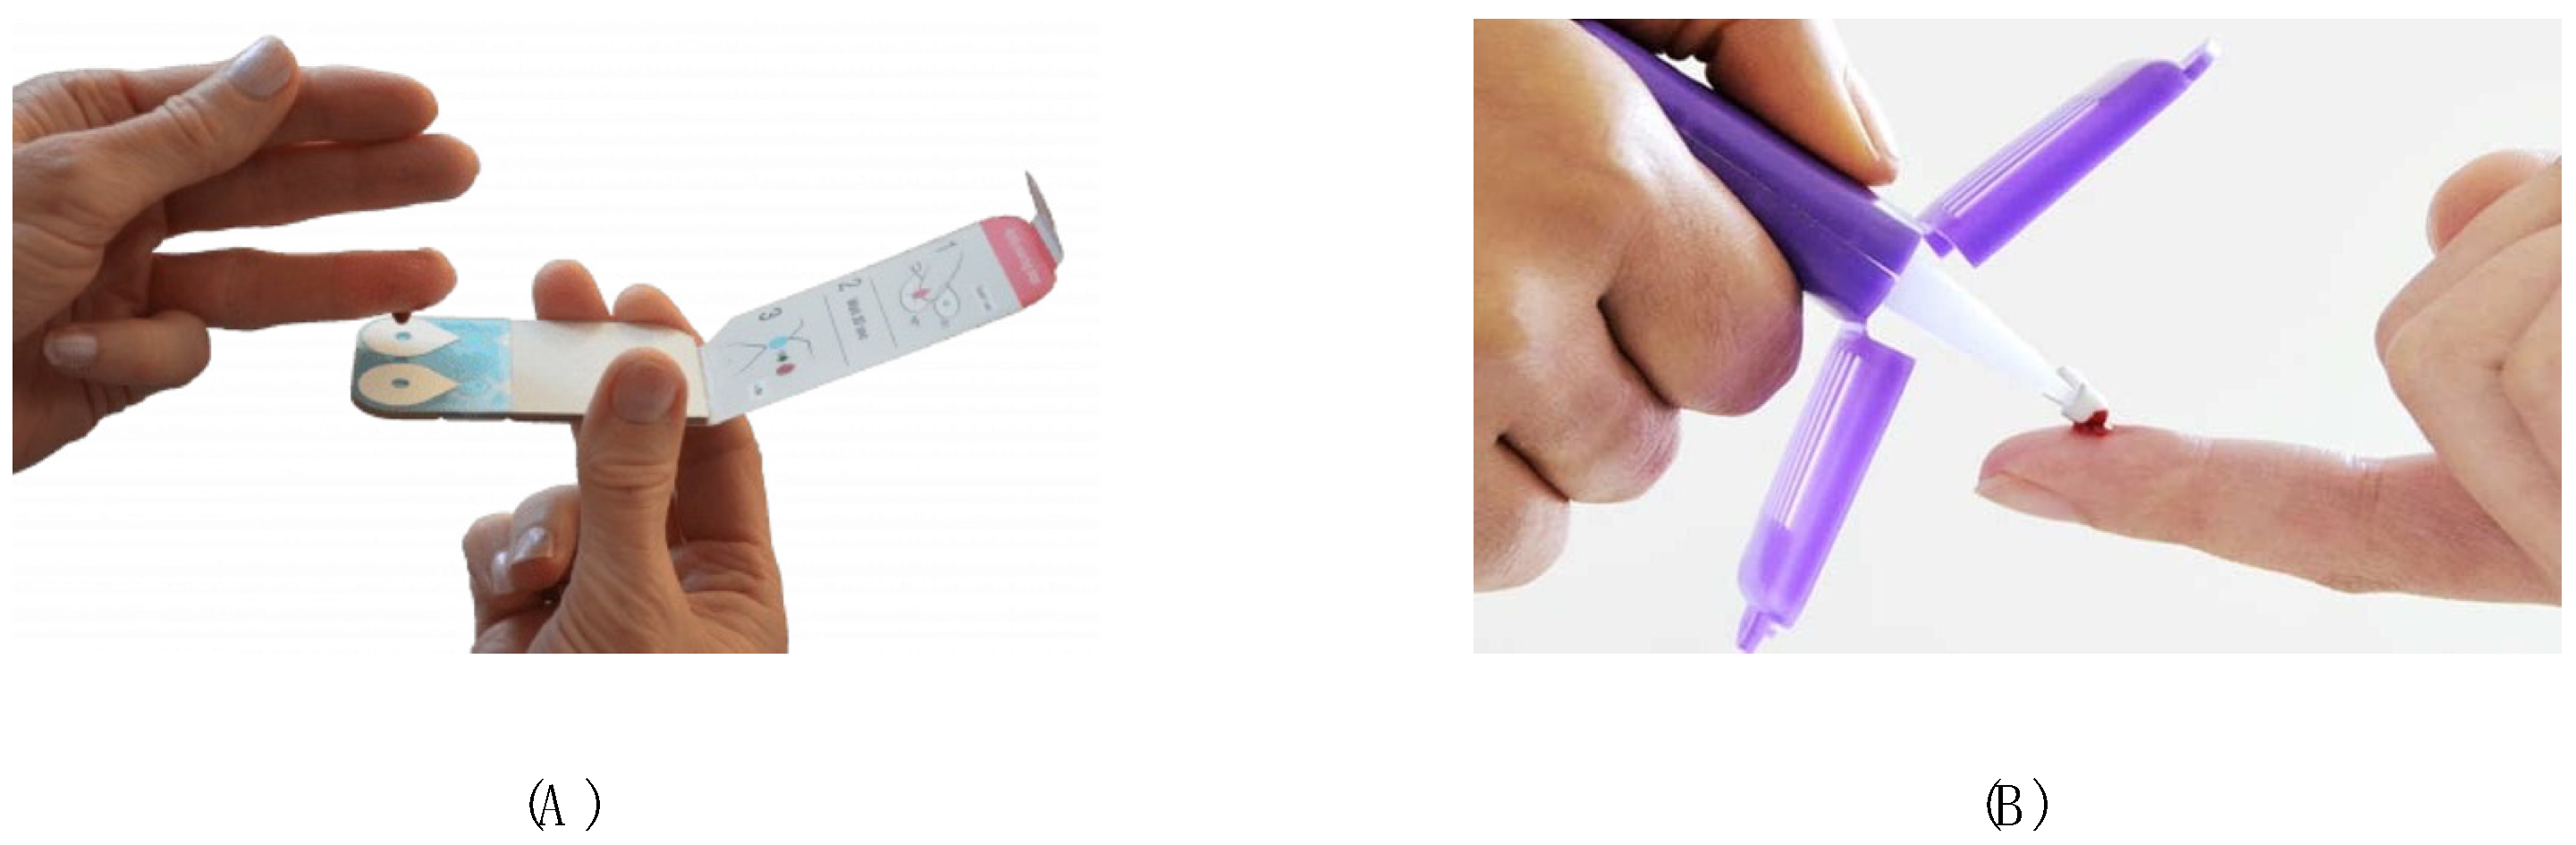
- Mitra™ (Neoteryx, Torrance, CA, USA)
- Tasso™ (Tasso Inc., Seattle, WA, USA)
- Capitainer® (Capitainer AB, Solna, Sweden)
- hemaPen™ (Trajan Scientific and Medical, Ringwood, Australia)
- HemaXis® (DBS System SA, Gland, Switzerland)
2. Results
2.1. Method Development and Optimization
2.2. Validation Results: Determination of EVE in Whole Blood
2.3. Validation Results: Determination of EVE in Mitra™ (VAMS) and Capitainer® (qDBS)
2.4. Clinical Results and Demographic Data
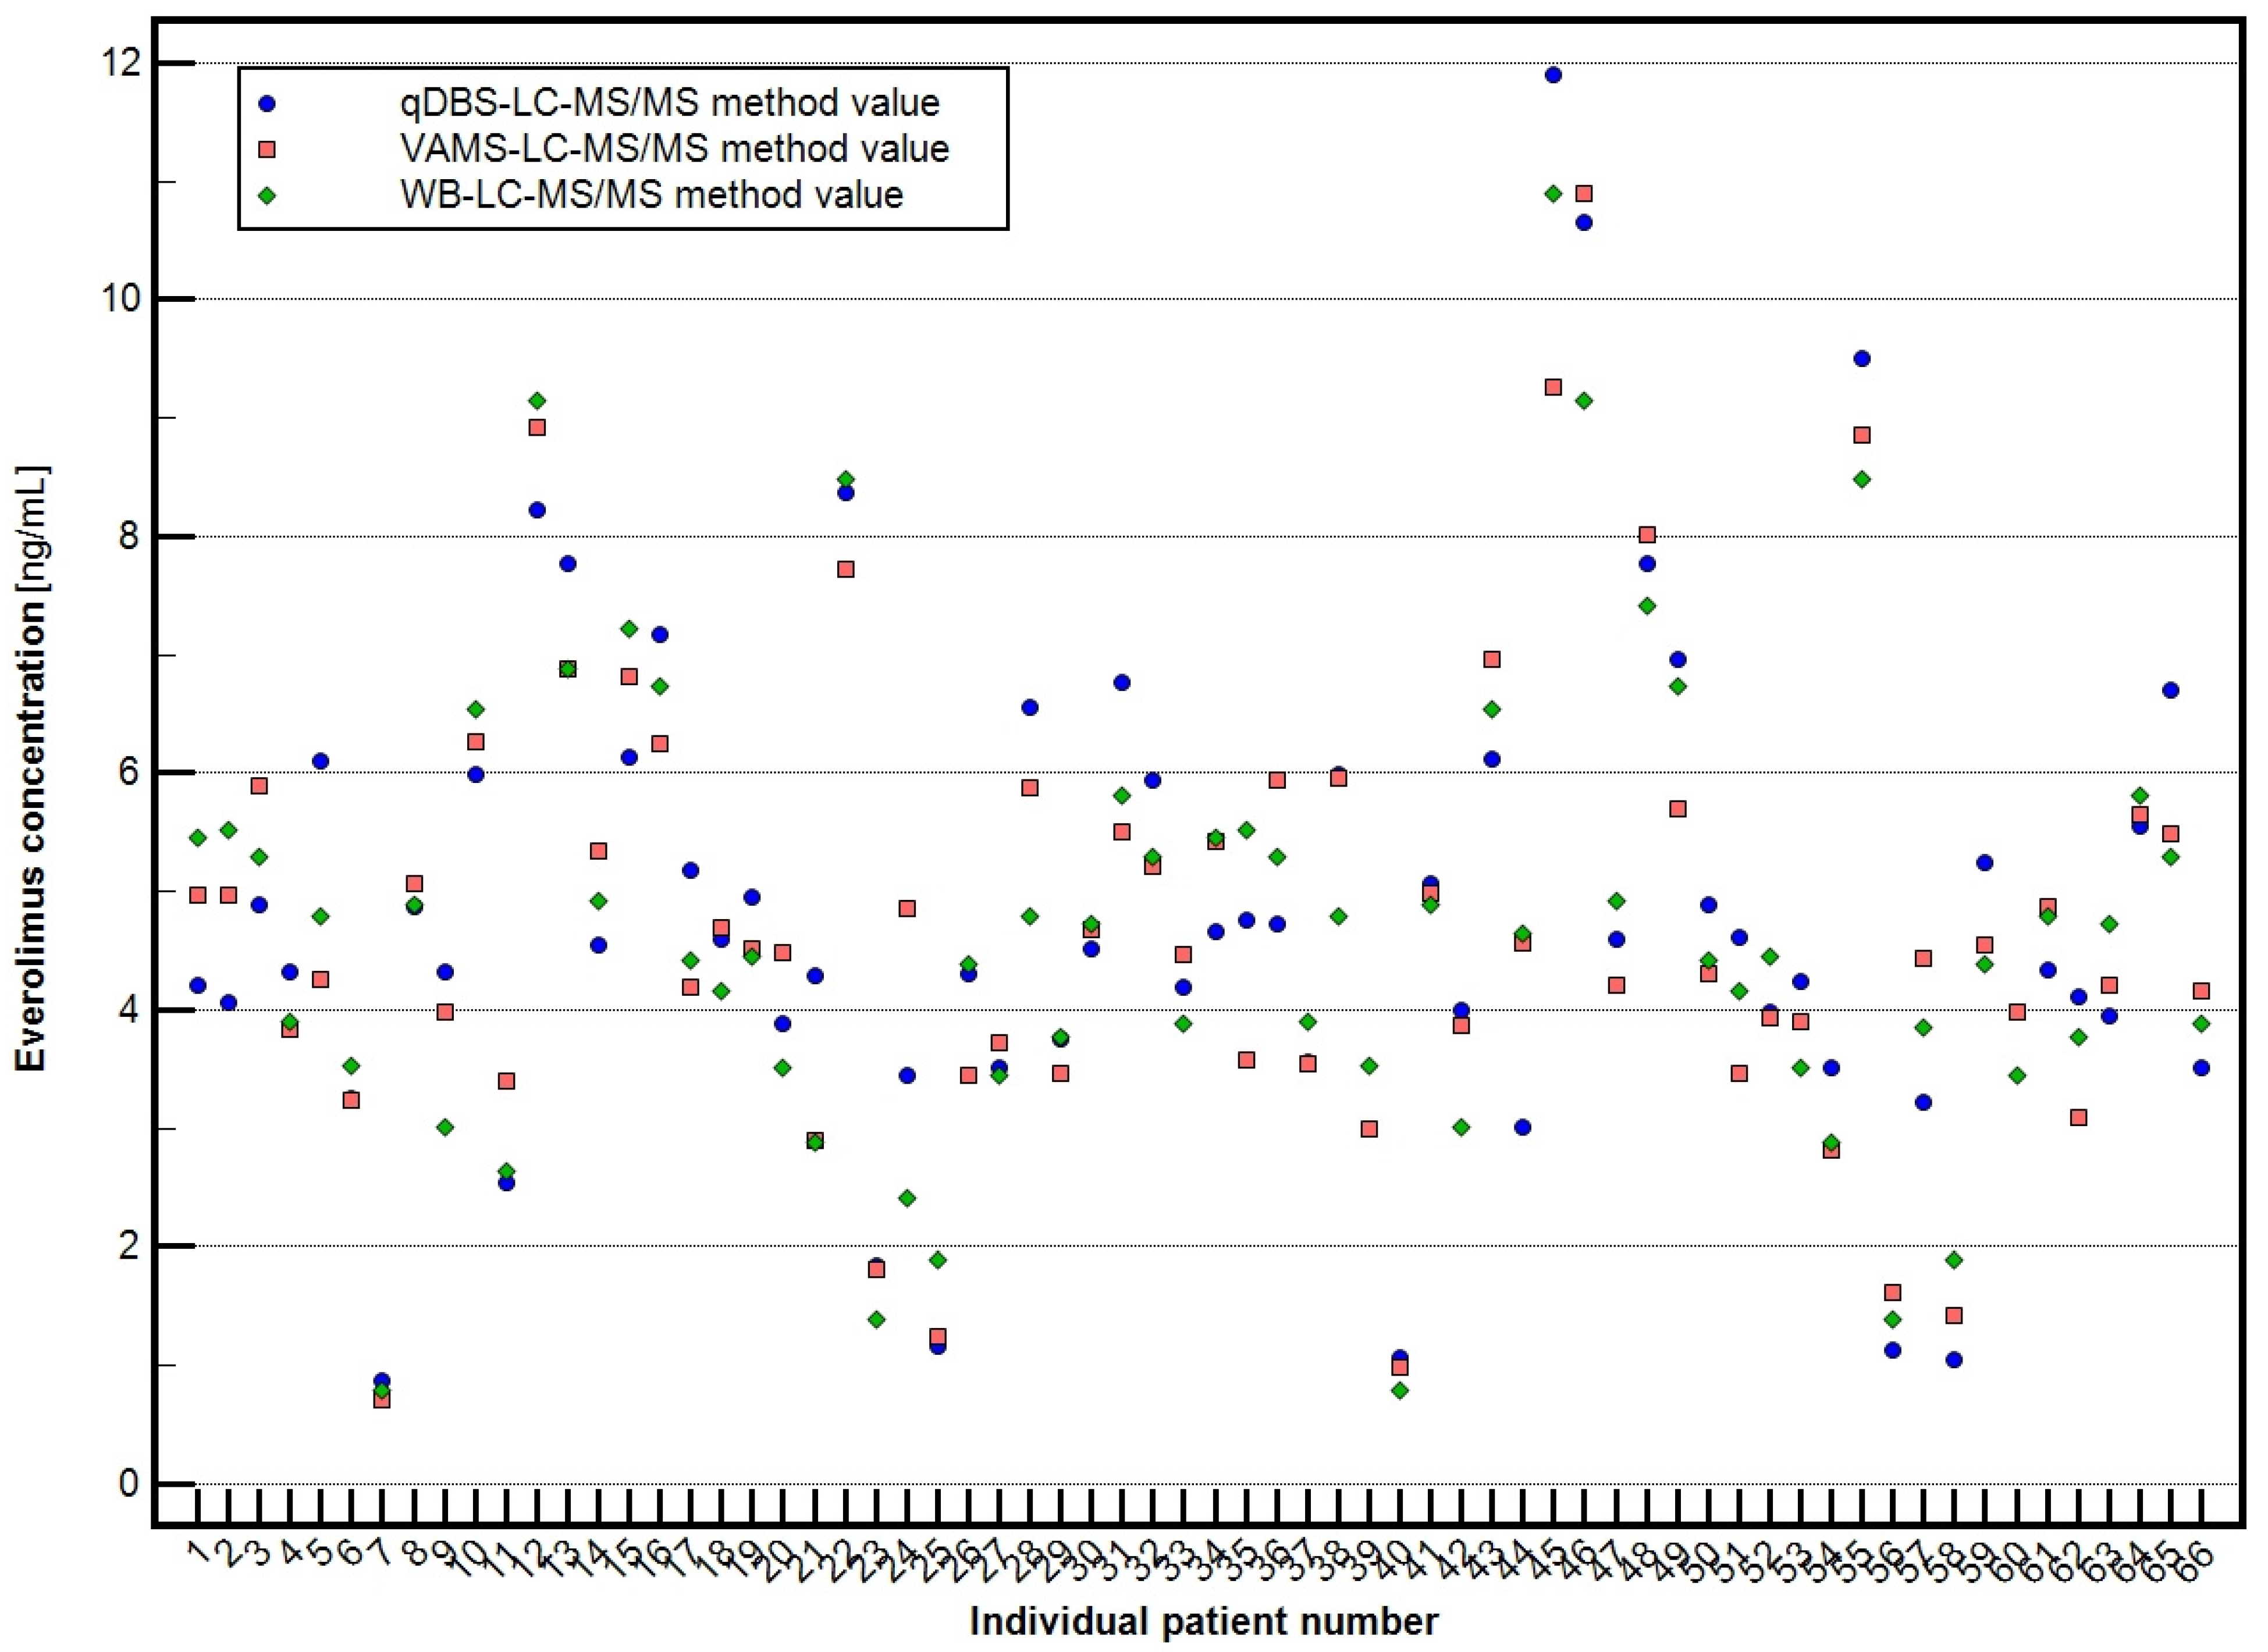
2.5. Clinical Application of Validated Methods
- Venous whole blood (WB): 4.696 ± 1.967 ng/mL (range: 0.800–10.895 ng/mL),
- Volumetric absorptive microsampling (VAMS): 4.707 ± 1.960 ng/mL (range: 0.710–10.895 ng/mL),
- Quantitative dried blood spots (qDBS): 4.820 ± 2.118 ng/mL (range: 0.877–11.897 ng/mL).
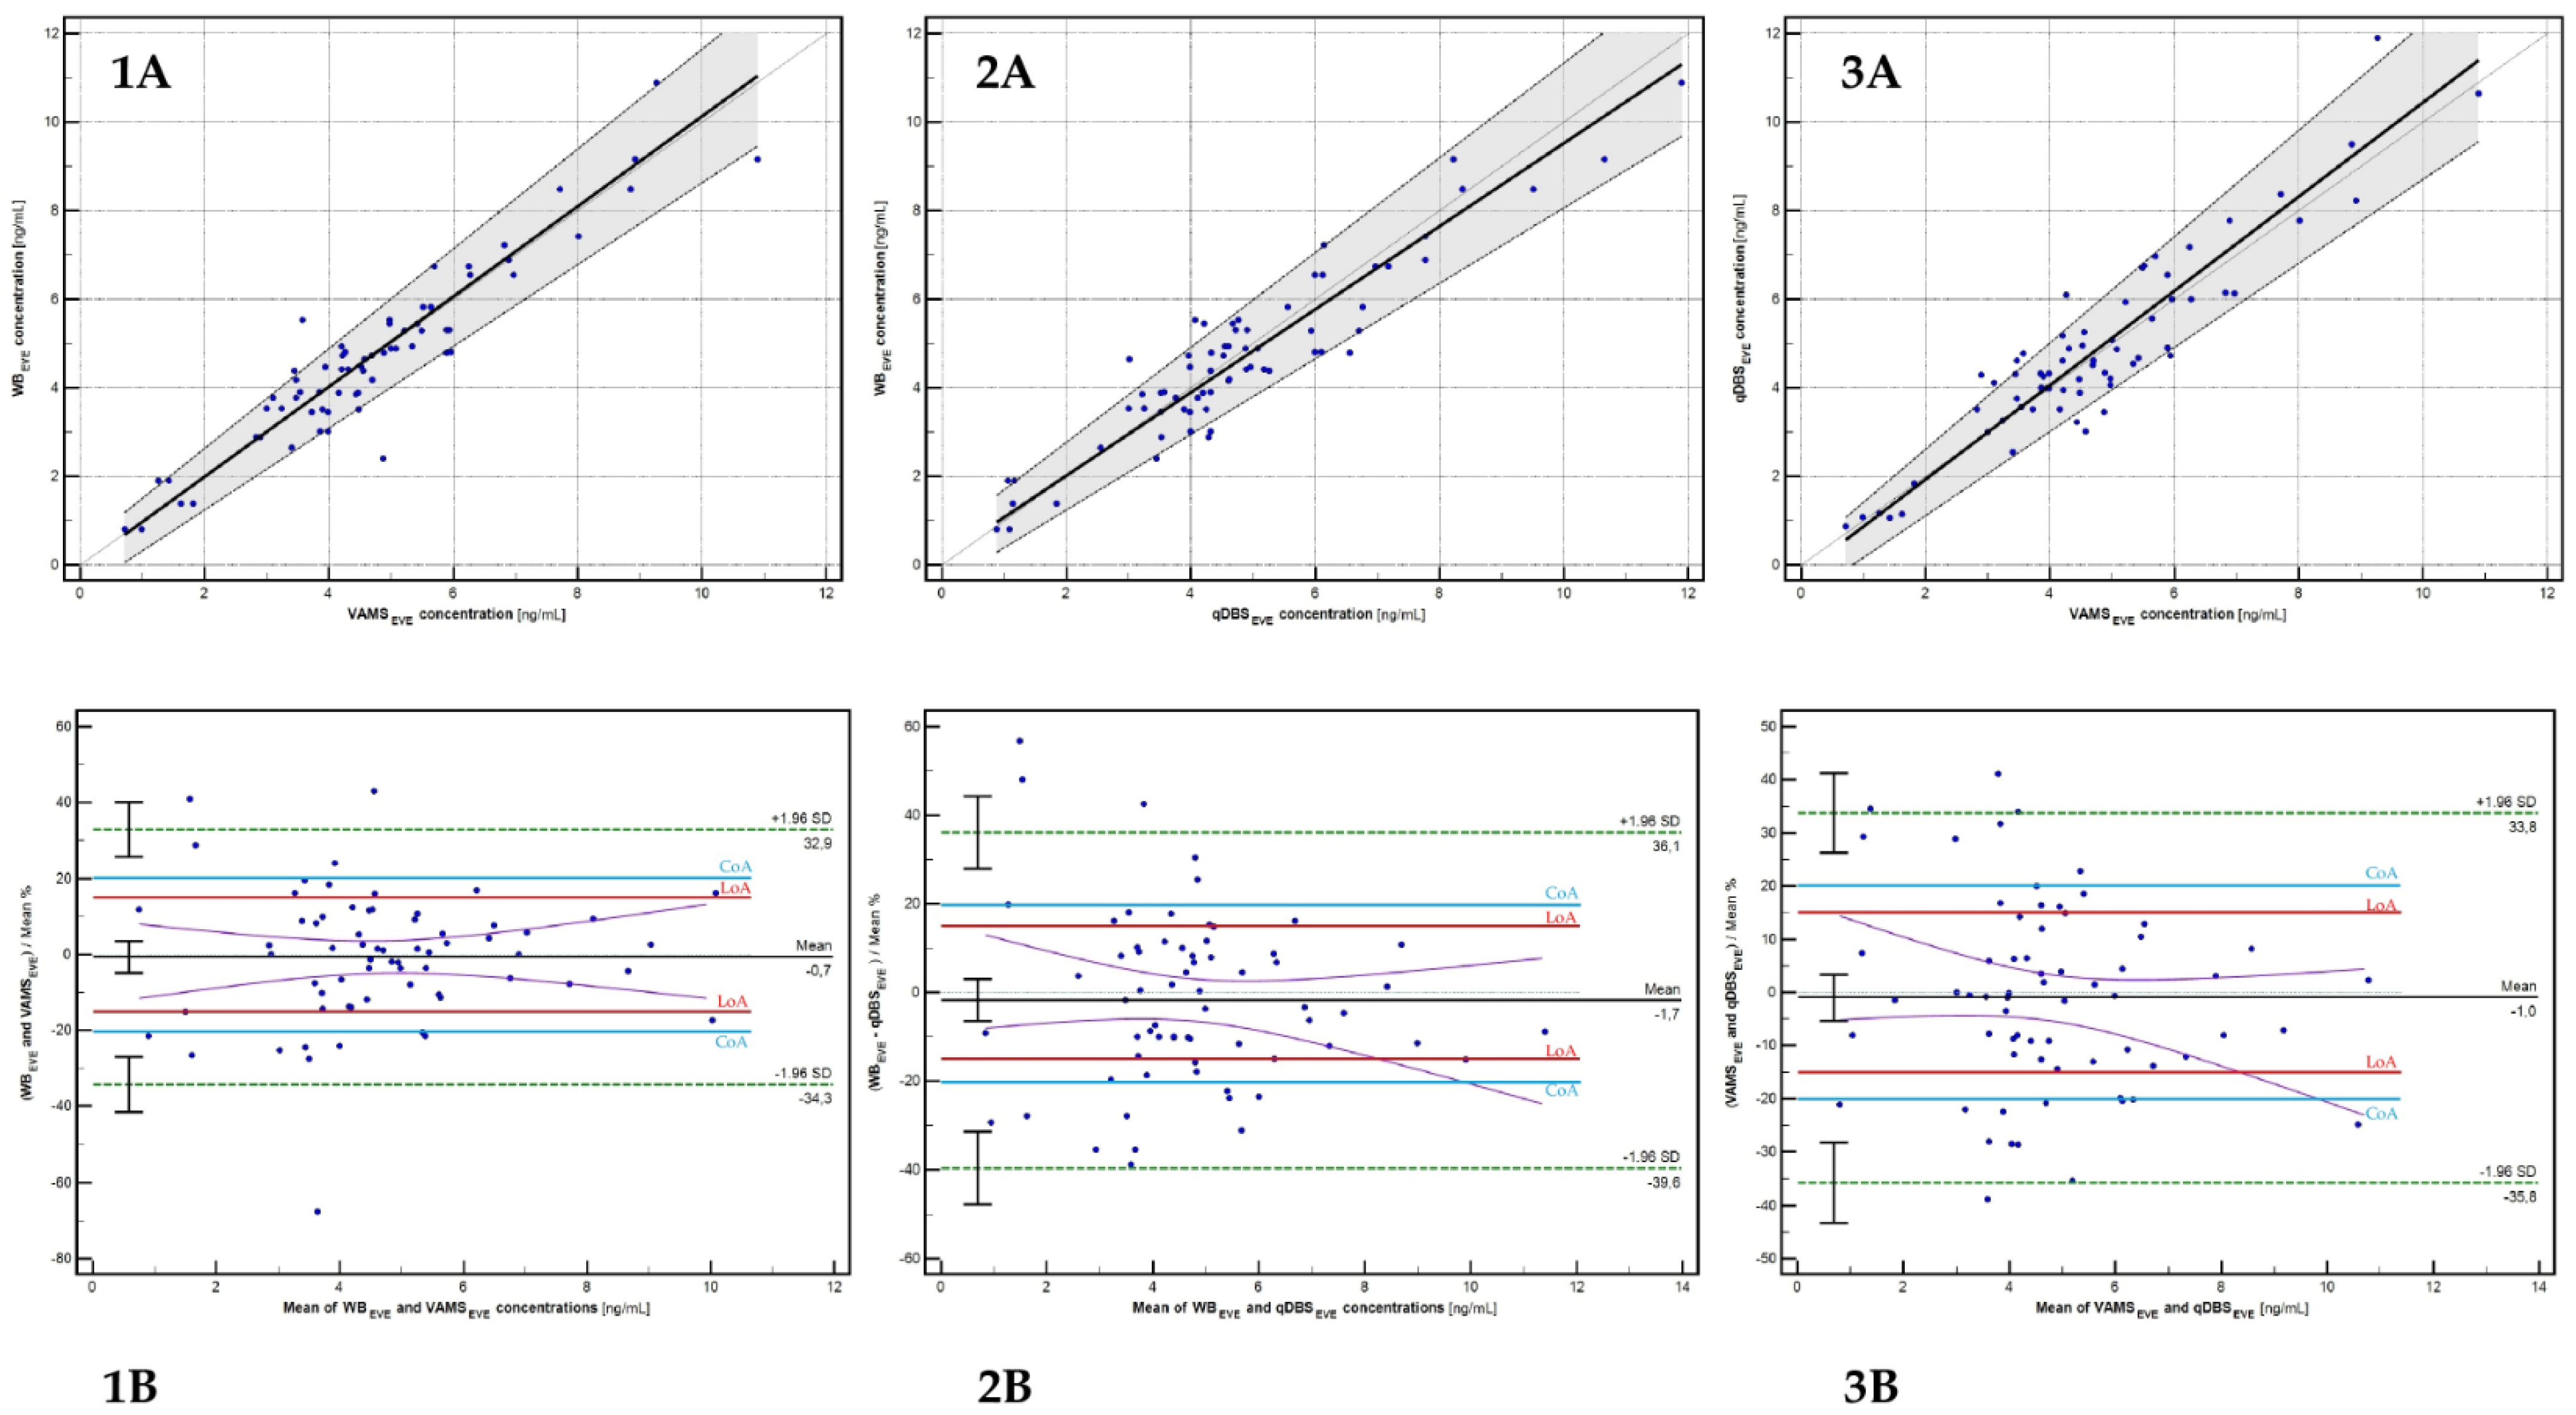
2.6. Cross-Validation and Clinical Evaluation
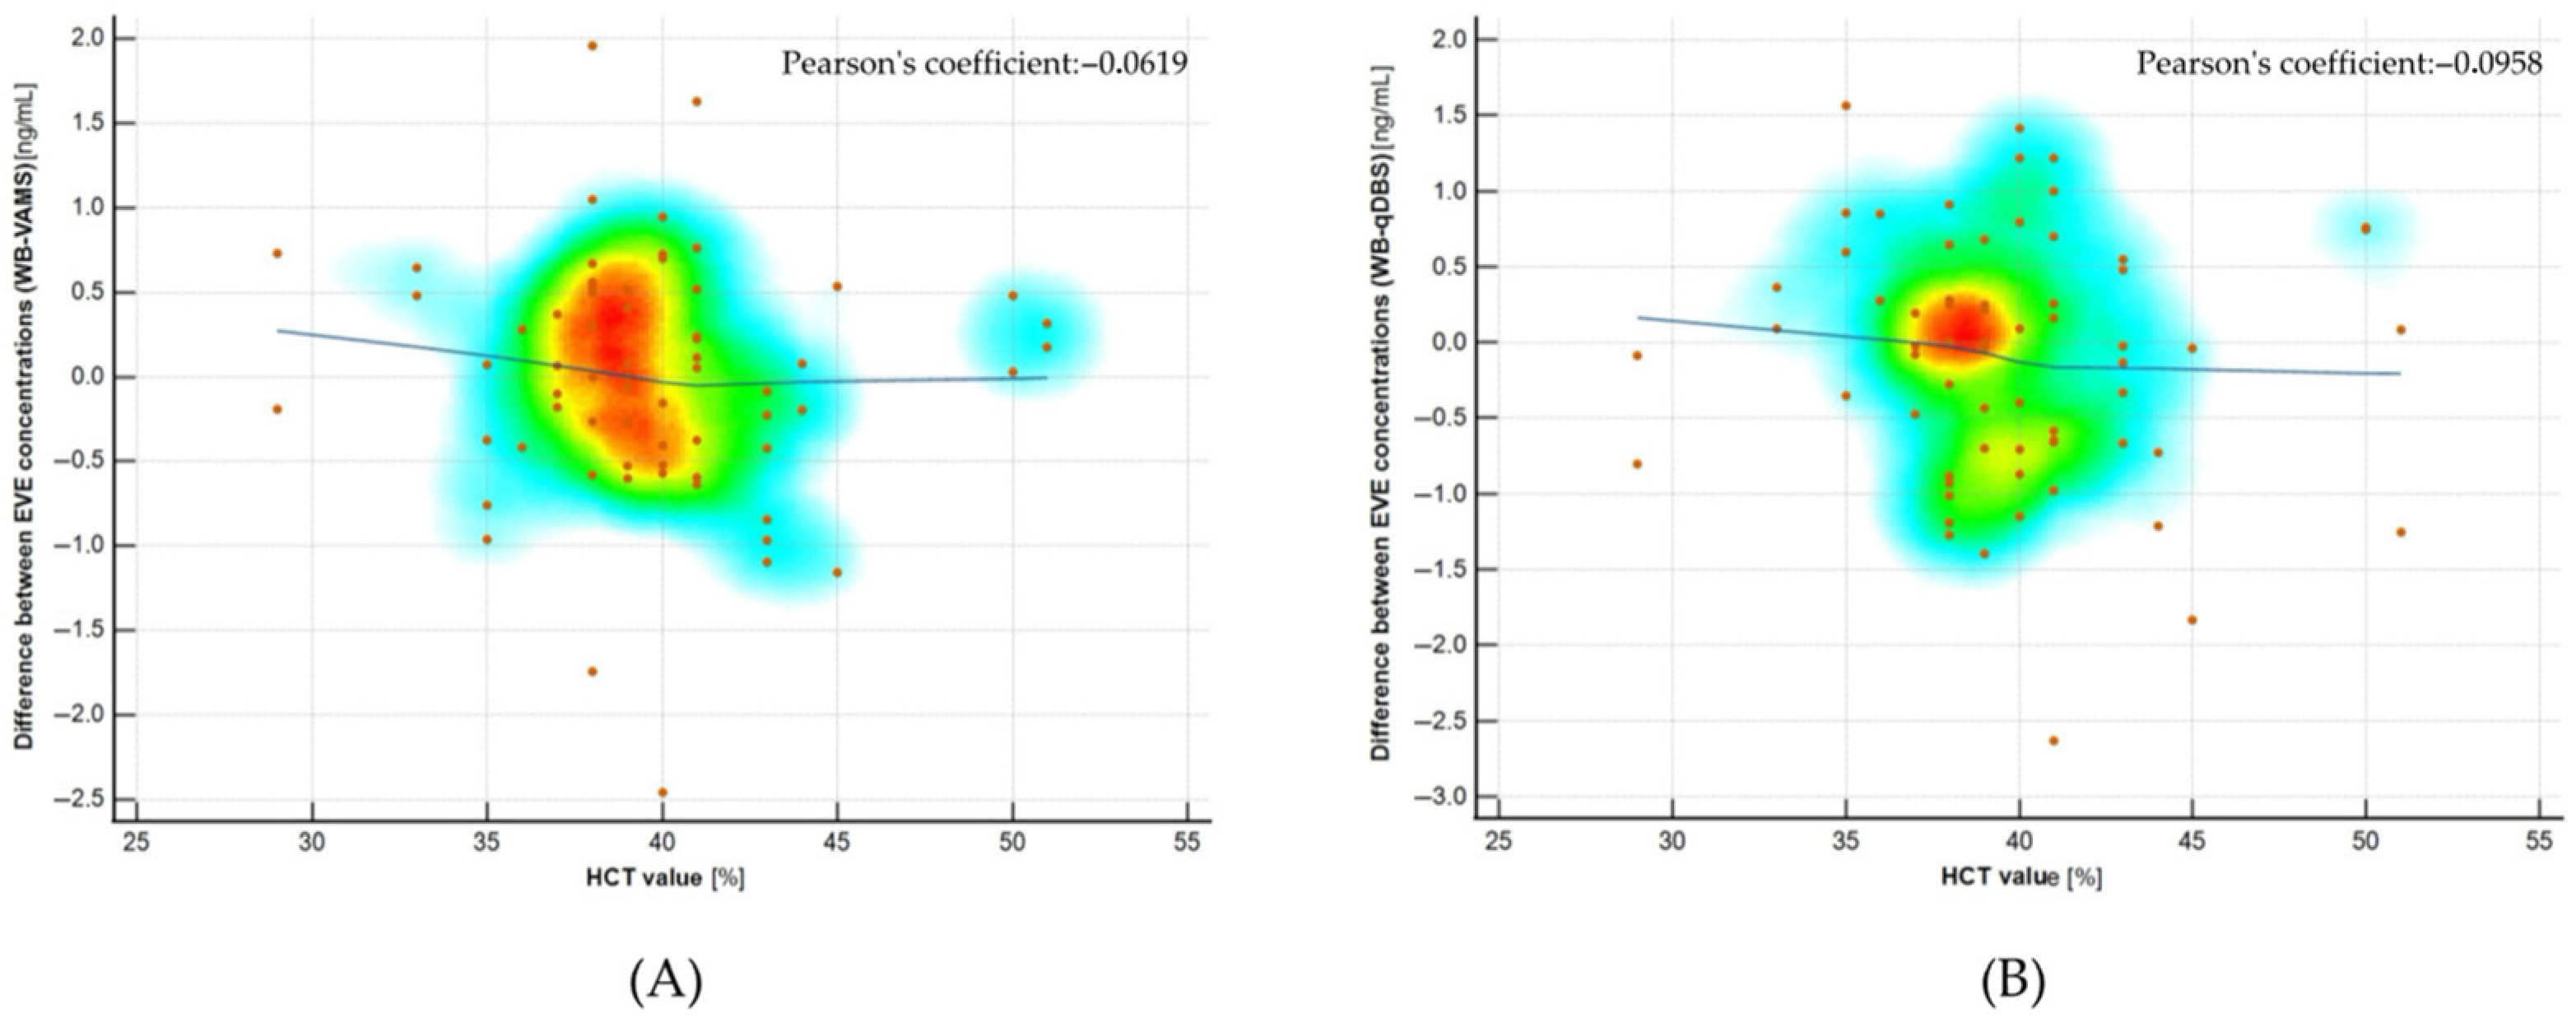
2.7. Hematocrit Effect Evaluation
3. Discussion
4. Materials and Methods
4.1. Reagents, Chemicals, and Laboratory Equipment
4.2. Stock, Working Solutions of Everolimus, and Internal Standard
4.3. Calibrators (CS) and Quality Control (QC) Preparation
4.4. Clinical Samples Collection
4.5. Samples Preparation Protocol
4.5.1. Whole Blood Samples
4.5.2. Mitra™ (VAMS) Samples
4.5.3. Capitainer® (qDBS) Samples
4.6. Chromatographic and Mass Spectrometry (LC-MS/MS) Conditions
- 0.01–0.50 min: 50% mobile phase A/50% mobile phase B;
- 0.51–1.49 min: 5% A/95% B;
- 1.50–2.00 min: 50% A/50% B (re-equilibration).
4.7. Analytical Validation Methodology
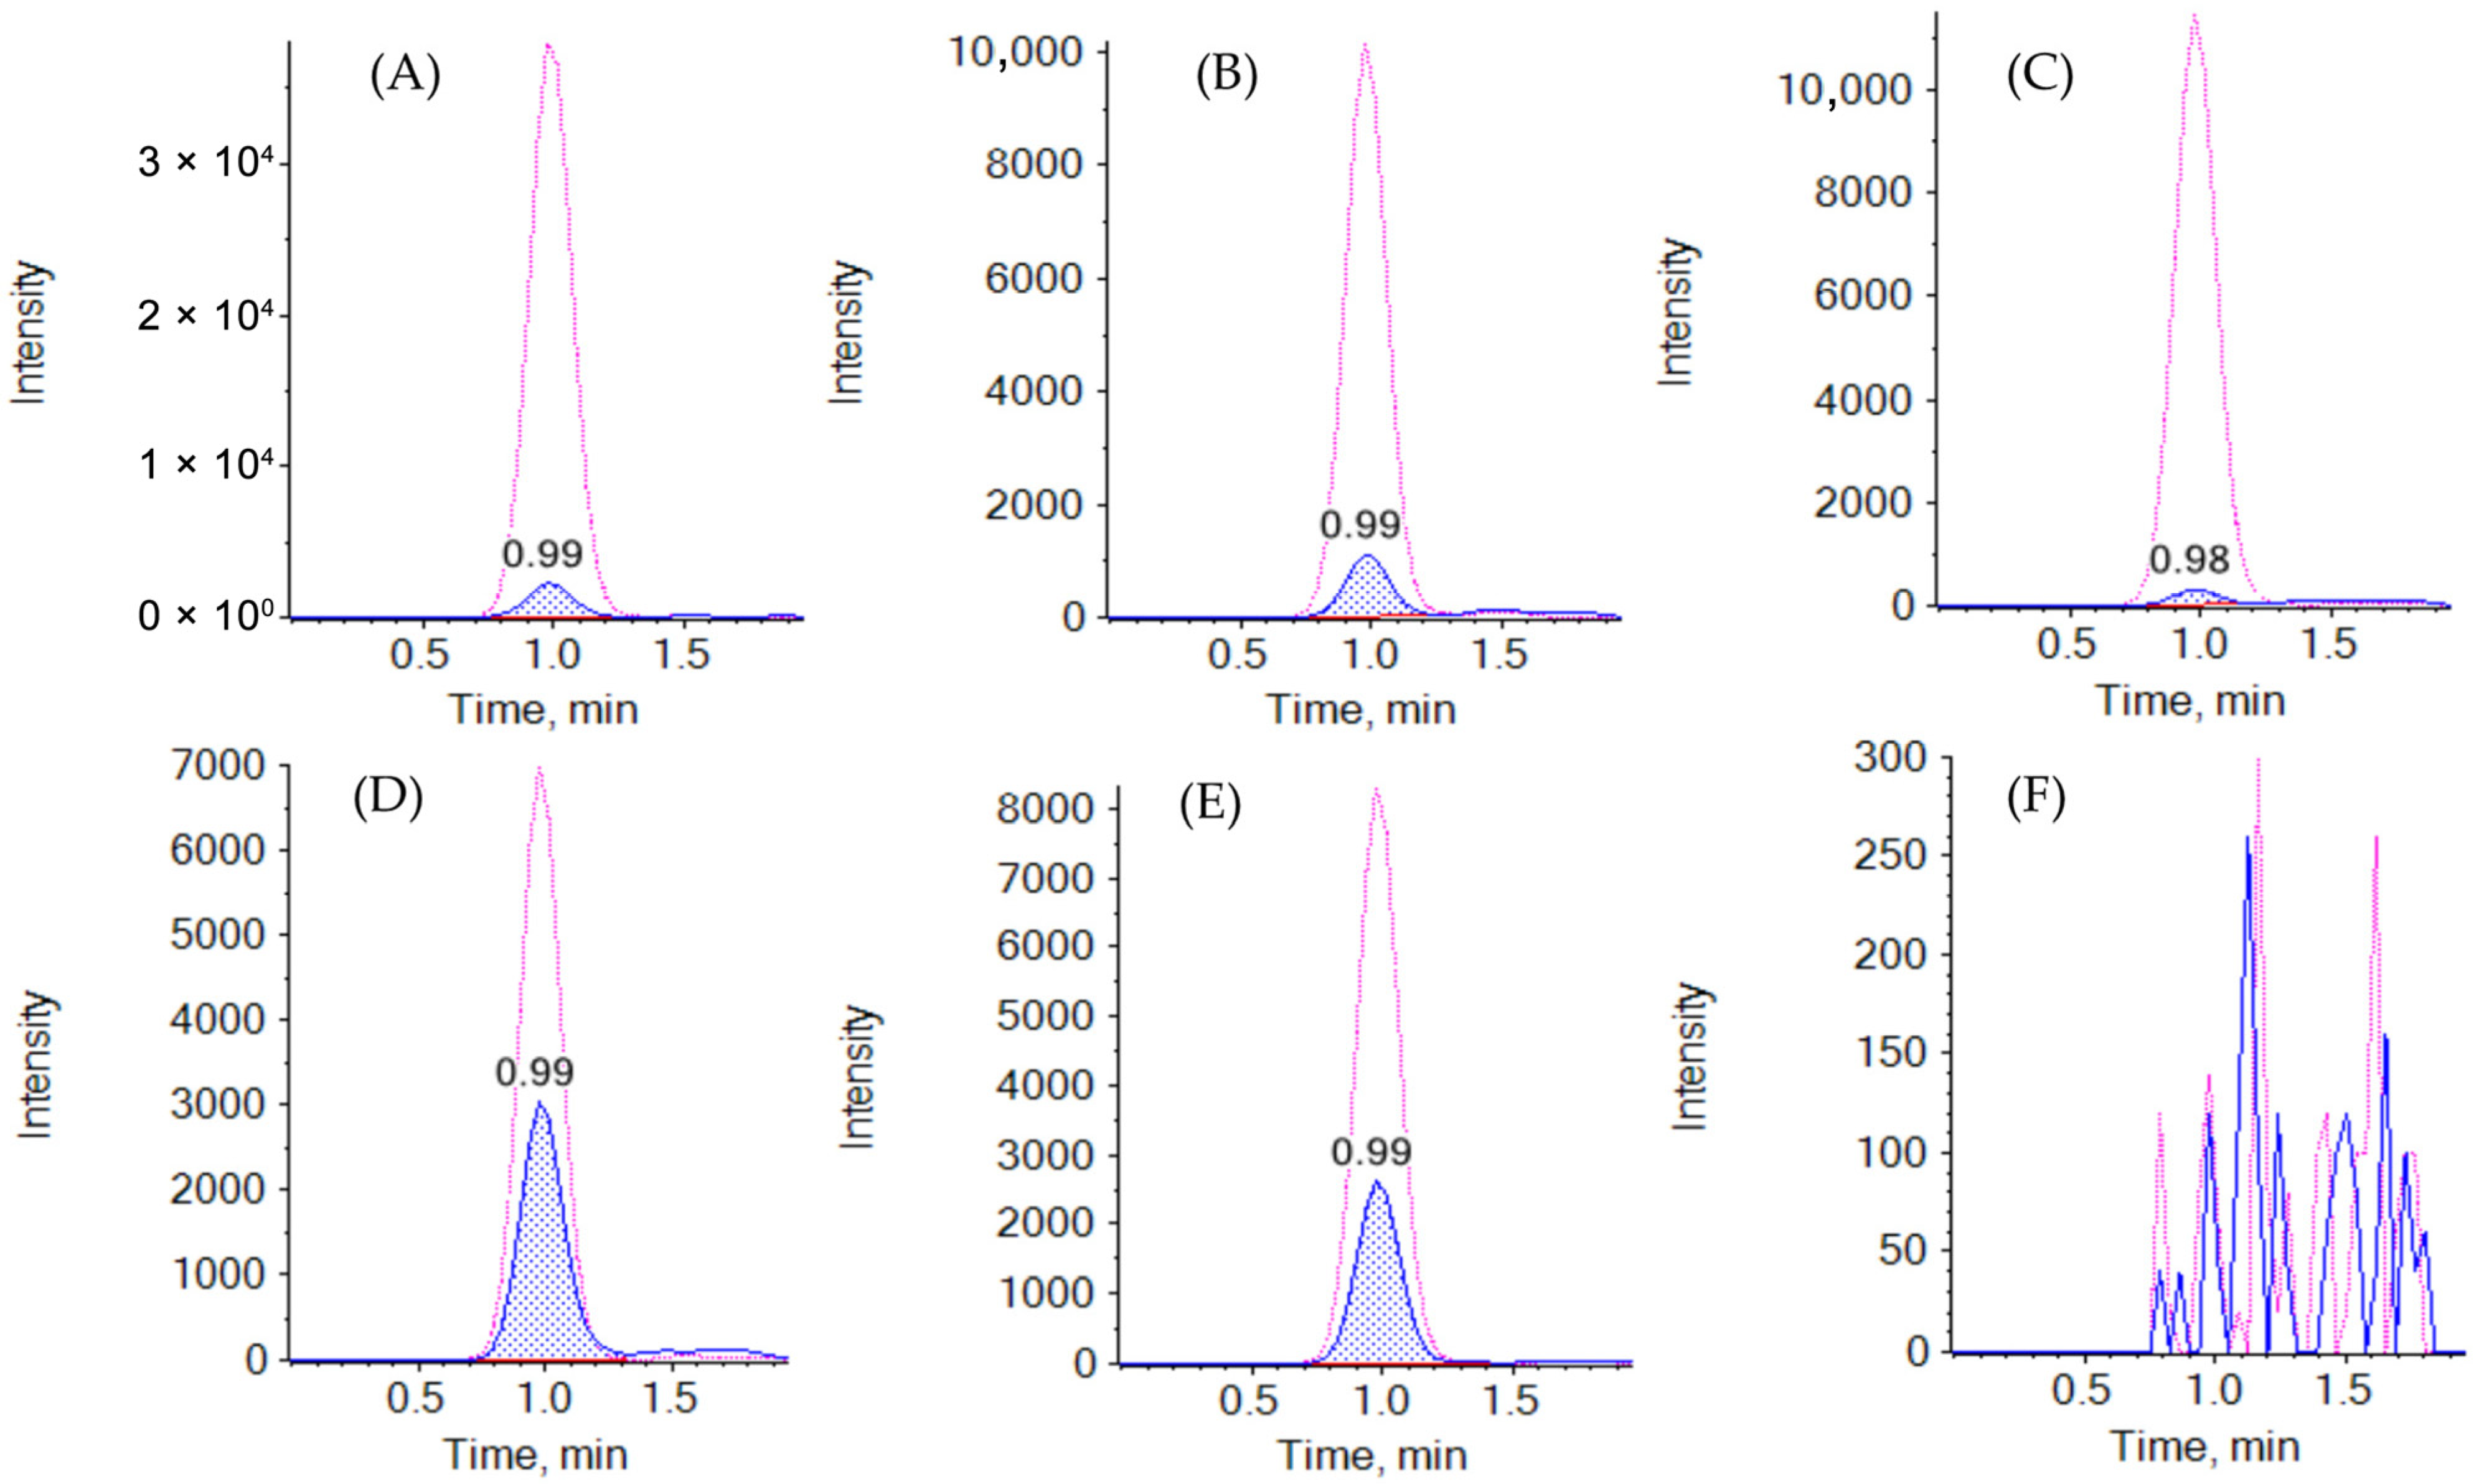
4.7.1. Selectivity and Specificity
4.7.2. Calibration and Linearity
4.7.3. Accuracy and Precision
4.7.4. Carry-Over Effect
4.7.5. Matrix Effect, Process Efficiency, and Extraction Recovery
- Set A: matrix-free samples spiked post-extraction (neat standard solutions);
- Set B: samples spiked before extraction (to assess recovery);
- Set C: samples spiked after extraction (to assess matrix effect).
- Matrix effect (ME) = (C/A) × 100%
- Process efficiency (PE) = (B/A) × 100%
- Extraction recovery (RE) = (B/C) × 100%
4.7.6. Stability
4.7.7. Incurred Sample Reanalysis (ISR)
4.8. Cross- and Clinical Validation—Correlation Study
4.9. Statistical Analysis
4.10. Hemoglobin Determination in Microsamples and Evaluation of Hematocrit Effect
- By spiking whole blood samples at three various HCT levels (23%, 37%, and 58%) with two concentrations of everolimus (LQC and HQC), followed by recovery assessment.
- By correlating individual HCT values with the differences in everolimus concentrations between venous whole blood and microsampling devices in clinical samples.
5. Conclusions
Author Contributions
Funding
Institutional Review Board Statement
Informed Consent Statement
Data Availability Statement
Acknowledgments
Conflicts of Interest
Appendix A

| Type of Tested Sample | Hematocrit Value | ||
|---|---|---|---|
| 0.23 | 0.37 | 0.58 | |
| qDBS (LQC) | 89.63 ± 2.97 (3.32) | 91.63 ± 1.67 (1.82) | 87.96 ± 2.51 (2.85) |
| qDBS (HQC) | 98.57 ± 0.52 (0.62) | 98.41 ± 0.94 (0.94) | 92.78 ± 1.74 (1.61) |
| VAMS (LQC) | 90.10 ± 2.06 (2.35) | 87.41 ± 2.06 (2.35) | 88.23 ± 2.51 (1.99) |
| VAMS (HQC) | 97.41 ± 0.51 (0.56) | 96.10 ± 0.41 (0.67) | 96.33 ± 0.91 (0.85) |
References
- Masuda, S.; Lemaitre, F.; Barten, M.J.; Bergan, S.; Shipkova, M.; van Gelder, T.; Vinks, S.; Wieland, E.; Bornemann-Kolatzki, K.; Brunet, M.; et al. Everolimus Personalized Therapy: Second Consensus Report by the International Association of Therapeutic Drug Monitoring and Clinical Toxicology. Ther. Drug Monit. 2025, 47, 4–31. [Google Scholar] [CrossRef]
- Seger, C.; Shipkova, M.; Christians, U.; Billaud, E.M.; Wang, P.; Holt, D.W.; Brunet, M.; Kunicki, P.K.; Pawiński, T.; Langman, L.J.; et al. Assuring the Proper Analytical Performance of Measurement Procedures for Immunosuppressive Drug Concentrations in Clinical Practice: Recommendations of the International Association of Therapeutic Drug Monitoring and Clinical Toxicology Immunosuppressive Drug Scientific Committee. Ther. Drug Monit. 2016, 38, 170–189. [Google Scholar]
- Kocur, A.; Pawiński, T. Microsampling techniques and patient-centric therapeutic drug monitoring of immunosuppressants. Bioanalysis 2025, 17, 413–427. [Google Scholar] [CrossRef]
- Kocur, A.; Pawiński, T. Volumetric Absorptive Microsampling in Therapeutic Drug Monitoring of Immunosuppressive Drugs-From Sampling and Analytical Issues to Clinical Application. Int. J. Mol. Sci. 2022, 24, 681. [Google Scholar] [CrossRef]
- Capiau, S.; Veenhof, H.; Koster, R.A.; Bergqvist, Y.; Boettcher, M.; Halmingh, O.; Keevil, B.G.; Koch, B.; Linden, R.; Pistos, C.; et al. Official International Association for Therapeutic Drug Monitoring and Clinical Toxicology Guideline: Development and Validation of Dried Blood Spot-Based Methods for Therapeutic Drug Monitoring. Ther. Drug Monit. 2019, 41, 409–430. [Google Scholar] [CrossRef]
- Capitainer AB. Capitainer®—Volumetric Dried Blood Spot Sampling. Available online: https://www.capitainer.com (accessed on 24 June 2025).
- Neoteryx. Volumetric Absorptive Microsampling (VAMS™) Technology. Available online: https://www.neoteryx.com (accessed on 24 June 2025).
- European Medicines Agency (EMA). ICH Guideline M10 on Bioanalytical Method Validation. Available online: https://www.ema.europa.eu/en/documents/scientific-guideline/ich-guideline-m10-bioanalytical-method-validation-step-5_en.pdf (accessed on 24 June 2025).
- Vethe, N.T.; Åsberg, A.; Bergan, S.; Robertsen, I.; Midtvedt, K. Implementation of Volumetric Finger-Prick Self-Sampling for Therapeutic Drug Monitoring of Immunosuppressants After Kidney Transplantation: Lessons Learned From the Practice. Ther. Drug Monit. 2025, 47, 98–104. [Google Scholar] [CrossRef]
- Vethe, N.T.; Åsberg, A.; Andersen, A.M.; Heier Skauby, R.; Bergan, S.; Midtvedt, K. Clinical performance of volumetric finger-prick sampling for the monitoring of tacrolimus, creatinine and haemoglobin in kidney transplant recipients. Br. J. Clin. Pharmacol. 2023, 89, 3690–3701. [Google Scholar] [CrossRef]
- Deprez, S.; Van Uytfanghe, K.; Stove, C.P. Liquid chromatography-tandem mass spectrometry for therapeutic drug monitoring of immunosuppressants and creatinine from a single dried blood spot using the Capitainer® qDBS device. Anal. Chim. Acta. 2023, 1242, 340797. [Google Scholar] [CrossRef]
- Velghe, S.; Stove, C.P. Evaluation of the Capitainer-B Microfluidic Device as a New Hematocrit-Independent Alternative for Dried Blood Spot Collection. Anal. Chem. 2018, 90, 12893–12899. [Google Scholar] [CrossRef]
- U.S. Food and Drug Administration (FDA). Process Validation: General Principles and Practices; FDA: Silver Spring, MD, USA, 2011. Available online: https://www.fda.gov/files/drugs/published/Process-Validation--General-Principles-and-Practices.pdf (accessed on 24 June 2025).
- Christians, U.; Vinks, A.A.; Langman, L.J.; Clarke, W.; Wallemacq, P.; van Gelder, T.; Renjen, V.; Marquet, P.; Meyer, E.J. Impact of Laboratory Practices on Interlaboratory Variability in Therapeutic Drug Monitoring of Immunosuppressive Drugs. Ther. Drug Monit. 2015, 37, 7–724. [Google Scholar] [CrossRef]
- Taylor, P.J. Matrix effects: The Achilles heel of quantitative high-performance liquid chromatography-electrospray-tandem mass spectrometry. Clin. Biochem. 2005, 38, 328–334. [Google Scholar] [CrossRef]
- Matuszewski, B.K.; Constanzer, M.L.; Chavez-Eng, C.M. Strategies for the Assessment of Matrix Effect in Quantitative Bioanalytical Methods Based on HPLC-MS/MS. Anal. Chem. 2003, 75, 3019–3030. [Google Scholar] [CrossRef]
- Chromsystems Instruments & Chemicals GmbH. MassTox® Immunosuppressants in Whole Blood—Instruction Manual for LC-MS/MS Analysis, Version 1.0 IVDR; Chromsystems Instruments & Chemicals GmbH: Gräfelfing, Germany, 2023.
- RECIPE Chemicals + Instruments GmbH. ClinMass® TDM Kit System: Immunosuppressants in Whole Blood—Instruction Manual for LC-MS/MS Analysis, Version 1.1 IVDD; RECIPE Chemicals + Instruments GmbH: Munich, Germany, 2024.
- Giavarina, D. Understanding Bland Altman analysis. Biochem. Med. 2015, 25, 141–151. [Google Scholar] [CrossRef]
- Bilić-Zulle, L. Comparison of methods: Passing and Bablok regression. Biochem. Med. 2011, 21, 49–52. [Google Scholar] [CrossRef]
- Clinical and Laboratory Standards Institute (CLSI). Measurement Procedure Comparison and Bias Estimation Using Patient Samples. In Approved Guideline, 3rd ed.; CLSI Document EP09-A3; CLSI: Wayne, PA, USA, 2013. [Google Scholar]
- Nascimento, J.O.; Costa, E.R.; Estrela, R.; Moreira, F.L. A Narrative Review of Chromatographic Bioanalytical Methods for Quantifying Everolimus in Therapeutic Drug Monitoring Applications. Ther. Drug Monit. 2025, 47, 49–63. [Google Scholar] [CrossRef]
- Verheijen, R.; Thijssen, B.; Atrafi, F.; Schellens, J.; Rosing, H.; de Vries, N.; Beijnen, J.; Mathijssen, R.; Steeghs, N.; Huitema, A. Validation and clinical application of an LC-MS/MS method for the quantification of everolimus using volumetric absorptive microsampling. J. Chromatogr. B. 2018, 1104, 234–239. [Google Scholar] [CrossRef]
- Le, J.; Peng, R.; Yang, S.L.; Chen, J.L.; Cheng, J.R.; Li, Y.; Wang, S.T. Quantification of immunosuppressants from one 3.2 mm dried blood spot by a novel cold-induced phase separation based LC-MS/MS method. Anal. Chim. Acta. 2022, 1210, 339889. [Google Scholar] [CrossRef]
- Veenhof, H.; Koster, R.A.; Bouamar, R. Results from a proficiency testing pilot for microsampling in therapeutic drug monitoring. Clin. Chem. Lab. Med. 2022, 60, 1039–1048. [Google Scholar]
- Yoo, S.; Kim, G.; Kim, S.; Ha, J.; Cho, B.S.; Joo, D.J.; Lee, J.I. Volumetric Absorptive Microsampling for the Therapeutic Drug Monitoring of Everolimus in Patients who have Undergone Liver Transplant. Ther. Drug Monit. 2022; ahead of print. [Google Scholar]
- Paniagua-González, L.; Díaz-Louzao, C.; Álvarez-Fernández, M. Volumetric absorptive microsampling (VAMS) for assaying immunosuppressant drugs in capillary blood. J. Pharm. Biomed. Anal. 2020, 178, 112925. [Google Scholar]
- Gruzdys, V.; Merrigan, S.D.; Johnson-Davis, K.L. Feasibility of Immunosuppressant Drug Monitoring by a Microsampling Device. J. Appl. Lab. Med. 2019, 4, 241–246. [Google Scholar] [CrossRef]
- Boffel, L.; Van Mensel, A.; Pauwels, J.; Den Hond, E.; Bessems, J.; Van Uytfanghe, K.; Stove, C.P. Self-sampling by adolescents at home: Assessment of the feasibility to successfully collect blood microsamples by inexperienced individuals. AAPS J. 2024, 26, 75. [Google Scholar] [CrossRef]
- Cayman Chemical. Hemoglobin Colorimetric Assay Kit (Item No. 700540). Available online: https://www.caymanchem.com/product/700540/hemoglobin-colorimetric-assay-kit (accessed on 24 June 2025).
| Microsampling Device | Strengths | Limitations |
|---|---|---|
| Mitra™ (VAMS) |
|
|
| Capitainer® (qDBS) |
|
|
| Parameter | LLOQ | LQC | MQC1 | MQC2 | HQC | ||||||||||
|---|---|---|---|---|---|---|---|---|---|---|---|---|---|---|---|
| WB (1.27 ng/mL) | VAMS (0.50 ng/mL) | qDBS (0.50 ng/mL) | WB (2.36 ng/mL) | VAMS (0.75 ng/mL) | qDBS (0.75 ng/mL) | WB (4.34 ng/mL) | VAMS (3.50 ng/mL) | qDBS (3.50 ng/mL) | WB (8.77 ng/mL) | VAMS (7.50 ng/mL) | qDBS (7.50 ng/mL) | WB (30.0 ng/mL) | VAMS (35.0 ng/mL) | qDBS (35.0 ng/mL) | |
| Intra-run (intra-day) accuracy and precision [n = 6] | |||||||||||||||
| CEVE [ng/mL] | 1.33 ± 0.11 | 0.52 ± 0.04 | 0.52 ± 0.04 | 2.43 ± 0.22 | 0.71 ± 0.04 | 0.72 ± 0.04 | 4.58 ± 0.30 | 3.54 ± 0.11 | 3.45 ± 0.13 | 8.81 ± 0.48 | 7.53 ± 0.09 | 7.57 ± 0.25 | 30.40 ± 1.34 | 35.44 ± 2.06 | 36.40 ± 2.48 |
| Accuracy [%] | 106.70 | 105.55 | 103.28 | 101.60 | 101.64 | 97.71 | 101.86 | 99.66 | 98.95 | 99.34 | 100.02 | 94.94 | 99.97 | 98.98 | 99.97 |
| Precision [%] | 9.67 | 8.34 | 7.77 | 8.89 | 8.61 | 7.56 | 6.65 | 7.17 | 7.66 | 5.42 | 2.04 | 6.35 | 1.40 | 2.01 | 1.92 |
| Between-run (inter-day) accuracy and precision [n = 6] | |||||||||||||||
| CEVE [ng/mL | 1.30 ± 0.10 | 0.53 ± 0.03 | 0.51 ± 0.03 | 2.34 ± 0.14 | 0.75 ± 0.04 | 0.73 ± 0.03 | 4.48 ± 0.23 | 3.60 ± 0.11 | 3.65 ± 0.09 | 8.55 ± 0.29 | 7.53 ± 0.09 | 7.57 ± 0.17 | 29.96 ± 1.39 | 34.57 ± 1.45 | 35.40 ± 0.48 |
| Accuracy [%] | 98.24 | 103.44 | 99.55 | 98.28 | 100.64 | 100.84 | 98.57 | 101.43 | 101.00 | 101.22 | 101.02 | 101.70 | 100.19 | 100.75 | 99.95 |
| Precision [%] | 7.95 | 8.22 | 6.26 | 5.90 | 6.12 | 5.70 | 5.09 | 5.71 | 4.20 | 3.38 | 2.04 | 2.20 | 0.73 | 2.04 | 1.32 |
| Tested Matrix | Matrix Effect (ME) 1 | Absolute Recovery (AR) 1 | Process Efficiency (PE) 1 |
|---|---|---|---|
| WB LQC | 0.89 (2.75) | 1.03 (2.16) | 1.01 (4.87) |
| WB HQC | 1.21 (9.42) | 1.11 (11.58) | 1.05 (9.79) |
| VAMS LQC | 0.99 (1.96) | 0.92 (2.34) | 0.93 (3.68) |
| VAMS HQC | 1.06 (11.01) | 0.97 (10.99) | 0.95 (10.97) |
| qDBS LQC | 0.95 (2.41) | 0.91 (2.41) | 0.89 (3.99) |
| qDBS HQC | 1.10 (12.06) | 0.94 (11.46) | 0.91 (11.08) |
| Stability Experiment | 24 H [%] | 1 Week [%] | 1 Month [%] | 3 Months [%] | 6 Months [%] |
|---|---|---|---|---|---|
| AT/VAMS LQC | 100.09 (2.10) | 97.98 (4.08) | N/T | N/T | N/T |
| AT/VAMS HQC | 99.56 (0.77) | 98.99 (1.20) | N/T | N/T | N/T |
| RT/VAMS LQC | 97.99 (1.77) | 98.34 (3.33) | 96.04 (1.45) | 92.45 (2.04) | 89.39 (2.69) |
| RT/VAMS HQC | 98.51 (1.01) | 98.01 (1.79) | 97.23 (0.97) | 93.67 (0.99) | 90.81 (1.51) |
| 40°/VAMS LQC | 99.16 (1.67) | 99.23 (1.45) | 96.56 (1.37) | 93.21 (1.45) | 90.14 (1.87) |
| 40°/VAMS HQC | 101.34 (0.81) | 97.99 (1.22) | 98.23 (1.66) | 94.67 (2.08) | 89.36 (2.98) |
| 60°/VAMS LQC | 87.07 (4.49) | 83.95 * (6.42) | N/T | N/T | N/T |
| 60°/VAMS HQC | 91.21 (3.56) | 87.02 * (3.99) | N/T | N/T | N/T |
| AT/qDBS LQC | 102.30 (3.32) | 98.43 (3.65) | N/T | N/T | N/T |
| AT/qDBS HQC | 100.11 (3.50) | 97.99 (1.58) | N/T | N/T | N/T |
| RT/qDBS LQC | 99.86 (1.68) | 97.94 (2.22) | 98.03 (3.44) | 96.25 (4.46) | 93.23 (4.74) |
| RT/qDBS HQC | 101.01 (0.89) | 100.87 (1.06) | 98.76 (1.18) | 97.28 (1.76) | 94.56 (2.01) |
| 40°/qDBS LQC | 99.98 (2.54) | 97.34 (3.89) | 95.44 (2.53) | 93.22 (2.79) | 90.93 (3.59) |
| 40°/qDBS HQC | 100.56 (0.99) | 98.65 (4.06) | 96.71 (2.19) | 95.17 (2.42) | 91.58 (2.79) |
| 60°/qDBS LQC | 90.43 (5.89) | 86.42 * (7.44) | N/T | N/T | N/T |
| 60°/qDBS LQC | 89.23 (2.60) | 85.01 * (2.82) | N/T | N/T | N/T |
| Variable | Value or Characteristics |
|---|---|
| Total number of patients | 33 |
| Total number of samples (WB/VAMS/qDBS) | 66/66/66 |
| Patient’s sex [♂/♀] | 18/15 |
| Patient’s age [mean, range] | 60.88 (38.67–78.83) |
| Type of transplantation (Tx) (KTx/LTx/PTx) | (29/2/2) |
| Hematocrit [%] Hemoglobin [mg/dL] | 39.78 (29–51) 13.11 (9.5–16.6) |
| Creatinine [mg/dL] | 1.80 (0.80–3.58) |
| eGFR (MDRD) [mL/min/m2] | 38.71 (18–94) |
| ALT [U/L] | 27 (12–82) |
| AST [U/L] | 26 (12–39) |
| Daily dose of EVE (Certican®) [mean, range; mg] | 1.82 (0.75–3.00) |
| Type of Statistical Test | Evaluated Relationship (Paired Samples) [n = 66] | ||
|---|---|---|---|
| WB-LC-MS/MS Versus VAMS-LC-MS/MS | WB-LC-MS/MS Versus qDBS-LC-MS/MS | VAMS-LC-MS/MS Versus qDBS-LC-MS/MS | |
| Regression formula | EVEWB = 1.017(EVEVAMS) − 0.040 | EVEWB = 0.938(EVEqDBS) + 0.143 | EVEqDBS = 1.064(EVEVAMS) − 0.193 |
| Intercept (A) | −0.040 (−0.603 to 0.382) | 0.1435 (−0.460 to 0.634) | −0.1934 (−0.7829 to 0.2177) |
| Slope (B) | 1.017 (0.923 to 1.127) | 0.938 (0.852 to 1.071) | 1.0636 (0.9490 to 1.1994) |
| Mean bias [%] | −0.68 (−4.89 to 3.53) | −1.73 (−6.48 to 3.02) | −1.00 (−5.37 to 3.36) |
| Residual Standard Deviation (RSD) | 0.5022 | 0.5355 | 0.5640 |
| % of paired samples fulfilled LoA (mean bias < 20%) | 83.33% | 77.27% | 75.76% |
| % of paired samples fulfilled CoA (mean bias < 15%) | 69.69% | 69.67% | 62.12% |
| Pearson’s correlation coefficient (R2) | 0.935 | 0.932 | 0.923 |
| Spearman rank correlation coefficient (SRCC) [p < 0.0001] | 0.887 | 0.867 | 0.841 |
| Sample Type | Assigned Concentration [ng/mL] | ||||||
|---|---|---|---|---|---|---|---|
| CS1 (LLOQ) | CS2 | CS3 | CS4 | CS5 | CS6 | CS7 (ULOQ) | |
| whole blood (WB) | 1.27 | 2.60 | 5.36 | 11.70 | 24.30 | 47.80 | 64.80 |
| Mitra™ (VAMS) | 0.50 | 1.00 | 2.50 | 5.00 | 10.00 | 25.00 | 60.00 |
| Capitainer® (qDBS) | 0.50 | 1.00 | 2.50 | 5.00 | 10.00 | 25.00 | 60.00 |
| Sample Type | Assigned Concentration [ng/mL] | |||
|---|---|---|---|---|
| LQC | MQC1 | MQC2 | HQC | |
| whole blood (WB) | 2.36 | 4.34 | 8.77 | 30.00 |
| Mitra™ (VAMS) | 0.75 | 3.50 | 7.50 | 35.00 |
| Capitainer® (qDBS) | 0.75 | 3.50 | 7.50 | 35.00 |
| Analyte | Monitored Adduct | Q1 [m/z] | Q3 [m/z] | DP [eV] | CE [eV] | EP [eV] | CXP [eV] |
|---|---|---|---|---|---|---|---|
| EVE-1 (quantitative pair) | [M + NH4]+ | 975.60 | 908.40 | 50 | 25 | 15 | 5 |
| EVE-2 (qualitative pair) | 975.60 | 926.70 | 70 | 25 | 15 | 5 | |
| D4-EVE-1 (quantitative pair) | 979.60 | 912.50 | 50 | 20 | 15 | 5 | |
| D4-EVE-2 (qualitative pair) | 979.60 | 930.60 | 50 | 25 | 15 | 5 |
Disclaimer/Publisher’s Note: The statements, opinions and data contained in all publications are solely those of the individual author(s) and contributor(s) and not of MDPI and/or the editor(s). MDPI and/or the editor(s) disclaim responsibility for any injury to people or property resulting from any ideas, methods, instructions or products referred to in the content. |
© 2025 by the authors. Licensee MDPI, Basel, Switzerland. This article is an open access article distributed under the terms and conditions of the Creative Commons Attribution (CC BY) license (https://creativecommons.org/licenses/by/4.0/).
Share and Cite
Kocur, A.; Olkowski, B.; Moczulski, M.; Miszewska-Szyszkowska, D.; Rostkowska, O.M.; Polak, K.; Korniluk, K.; Bączkowska, T.; Durlik, M.; Pawiński, T. Therapeutic Drug Monitoring of Everolimus Using Volumetric Absorptive Microsampling and Quantitative Dried Blood Spot Methods with LC-MS/MS in Adult Solid Organ Transplant Recipients: An Analytical and Clinical Comparative Study. Molecules 2025, 30, 3139. https://doi.org/10.3390/molecules30153139
Kocur A, Olkowski B, Moczulski M, Miszewska-Szyszkowska D, Rostkowska OM, Polak K, Korniluk K, Bączkowska T, Durlik M, Pawiński T. Therapeutic Drug Monitoring of Everolimus Using Volumetric Absorptive Microsampling and Quantitative Dried Blood Spot Methods with LC-MS/MS in Adult Solid Organ Transplant Recipients: An Analytical and Clinical Comparative Study. Molecules. 2025; 30(15):3139. https://doi.org/10.3390/molecules30153139
Chicago/Turabian StyleKocur, Arkadiusz, Bartosz Olkowski, Mateusz Moczulski, Dorota Miszewska-Szyszkowska, Olga Maria Rostkowska, Katarzyna Polak, Katarzyna Korniluk, Teresa Bączkowska, Magdalena Durlik, and Tomasz Pawiński. 2025. "Therapeutic Drug Monitoring of Everolimus Using Volumetric Absorptive Microsampling and Quantitative Dried Blood Spot Methods with LC-MS/MS in Adult Solid Organ Transplant Recipients: An Analytical and Clinical Comparative Study" Molecules 30, no. 15: 3139. https://doi.org/10.3390/molecules30153139
APA StyleKocur, A., Olkowski, B., Moczulski, M., Miszewska-Szyszkowska, D., Rostkowska, O. M., Polak, K., Korniluk, K., Bączkowska, T., Durlik, M., & Pawiński, T. (2025). Therapeutic Drug Monitoring of Everolimus Using Volumetric Absorptive Microsampling and Quantitative Dried Blood Spot Methods with LC-MS/MS in Adult Solid Organ Transplant Recipients: An Analytical and Clinical Comparative Study. Molecules, 30(15), 3139. https://doi.org/10.3390/molecules30153139