
Evaluation of Oil Displacement by Polysaccharide Fermentation Broth of Athelia rolfsii Under Extreme Reservoir Conditions

Abstract
1. Introduction
2. Materials and Methods
2.1. Experimental Materials
2.1.1. Polymer Production
2.1.2. Culture Medium
2.1.3. Instruments and Equipment
2.2. Quantitative and Structural Analysis of Polysaccharides from Athelia rolfsii
2.2.1. Extracellular Polysaccharide Solution Was Obtained
2.2.2. Quantitative Method of Crude Polysaccharide
2.2.3. Analysis of Polysaccharide Composition and Structure
2.3. Evaluation of Rheological Properties of Polysaccharides Solution of Athelia rolfsii
2.3.1. Study on Viscosity and Concentration Relationship of Exopolysaccharides
2.3.2. Evaluation of Temperature, pH and Salinity Tolerance of Exopolysaccharides
2.3.3. The Modulus Test of Polysaccharide Solution
2.3.4. Long-Term Stability of Exopolysaccharides Under High Temperature and High Salinity Conditions
2.4. Oil Displacement Effect Test
3. Results
3.1. The Composition and Structure of Polysaccharide Were Analyzed
3.2. Steady-State Rheology Performance Evaluation Results
3.2.1. Steady State Rheological Shear Test
3.2.2. Solution Stability at Different Temperatures, pH, and Salinity
3.2.3. Long-Term Stability Studies
3.3. The Results Can Be Evaluated by Dynamic Rheology
3.3.1. Linear Viscoelastic Region Test
3.3.2. Oscillating Frequency Scanning Test
3.3.3. Effect of High Temperature and High Salt on Polymer Solution Modulus
3.4. Test Results of Oil Displacement Effect
4. Outlook
5. Conclusions
- (1)
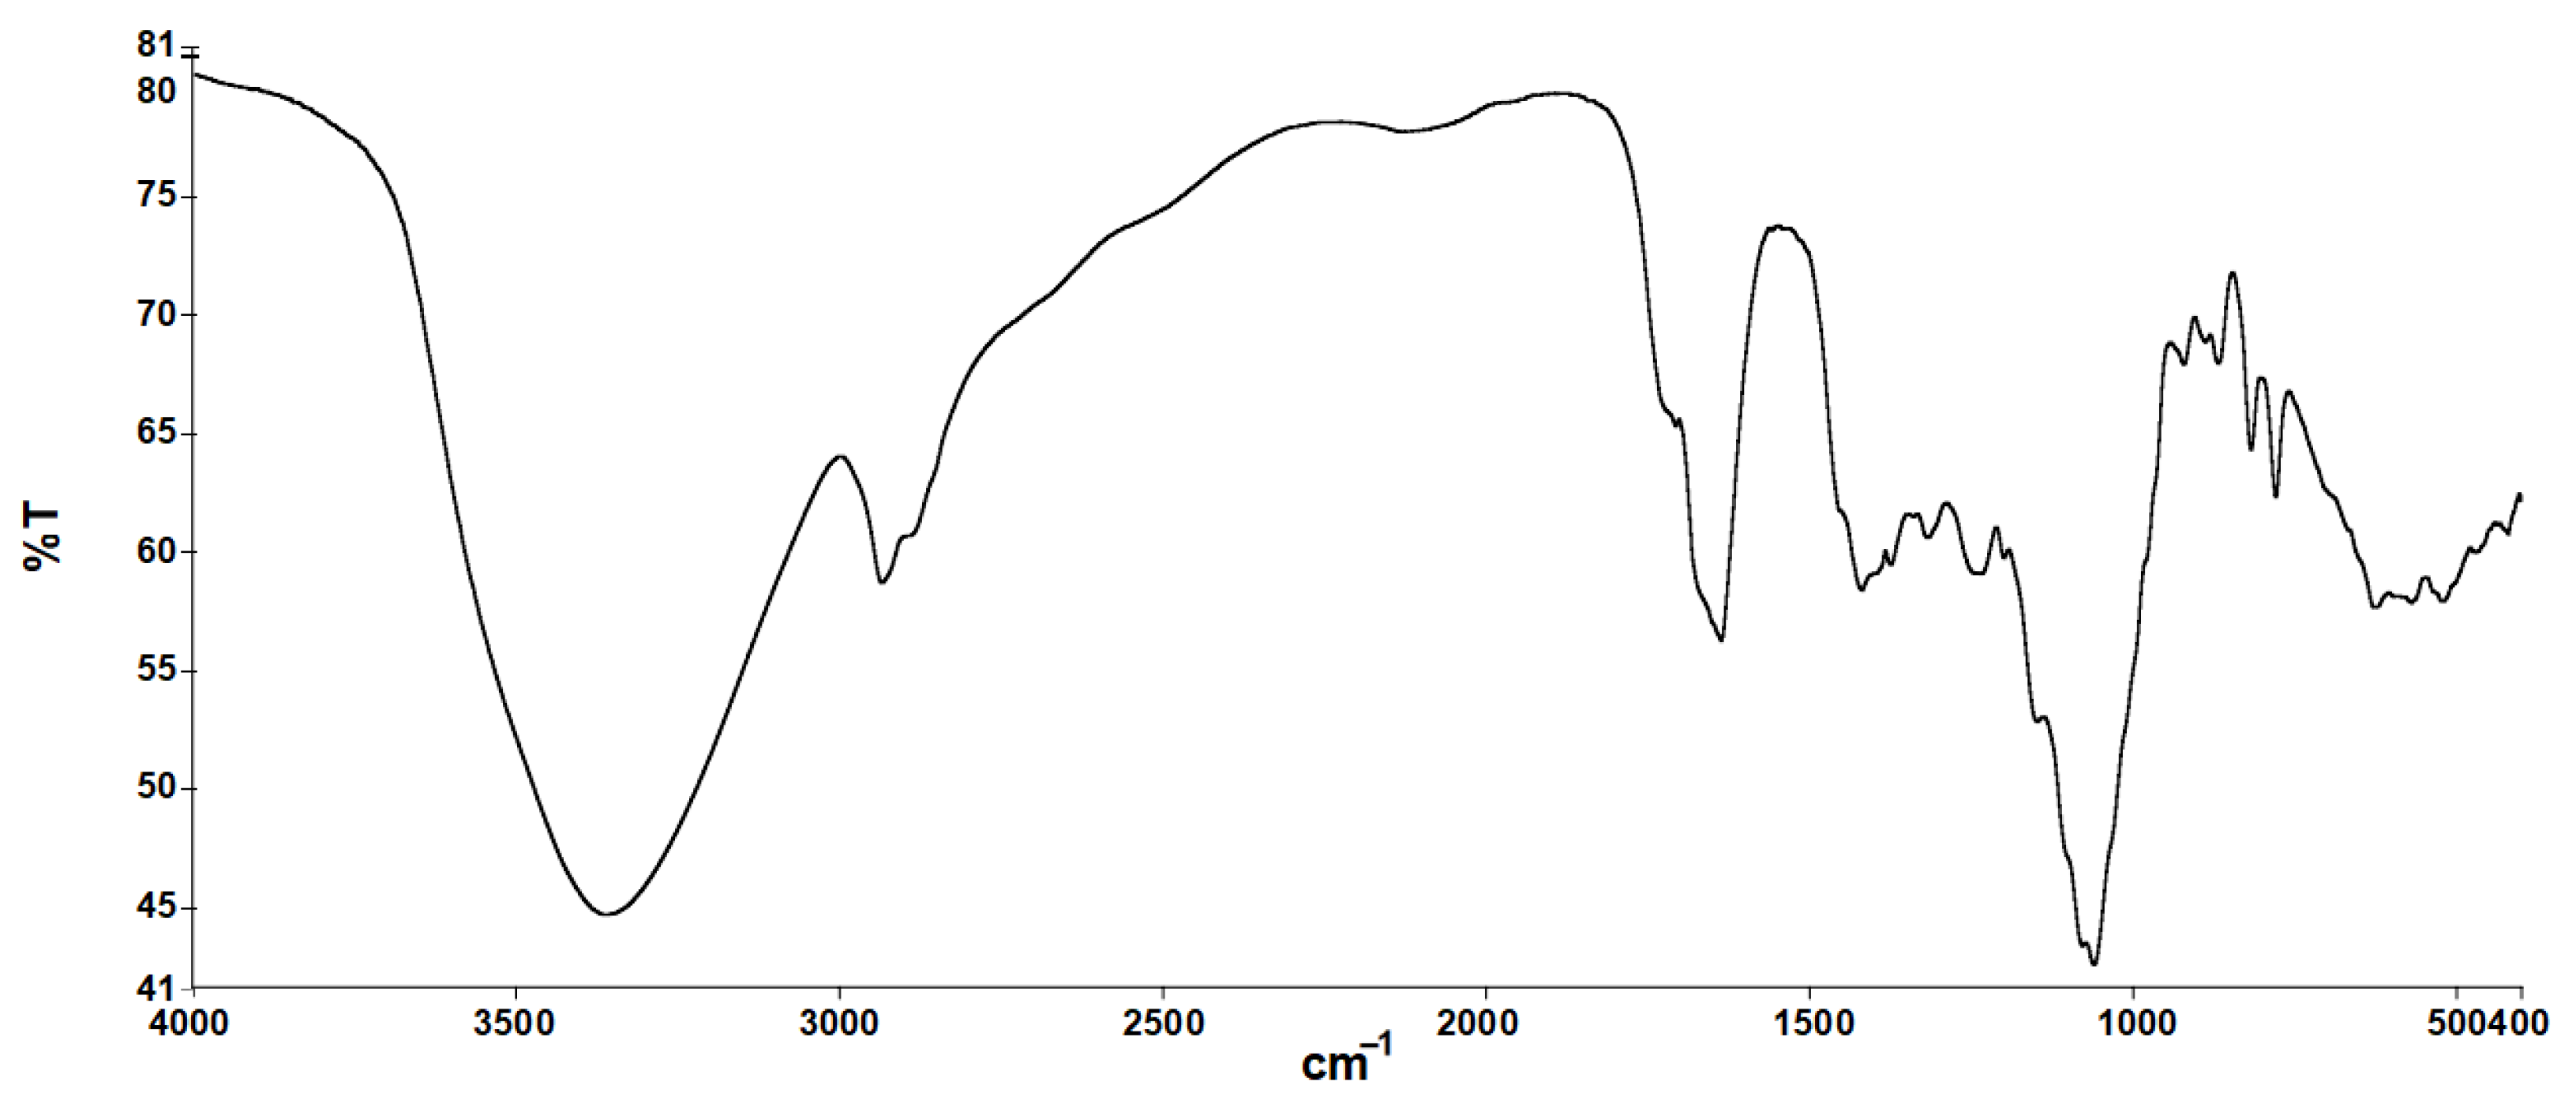
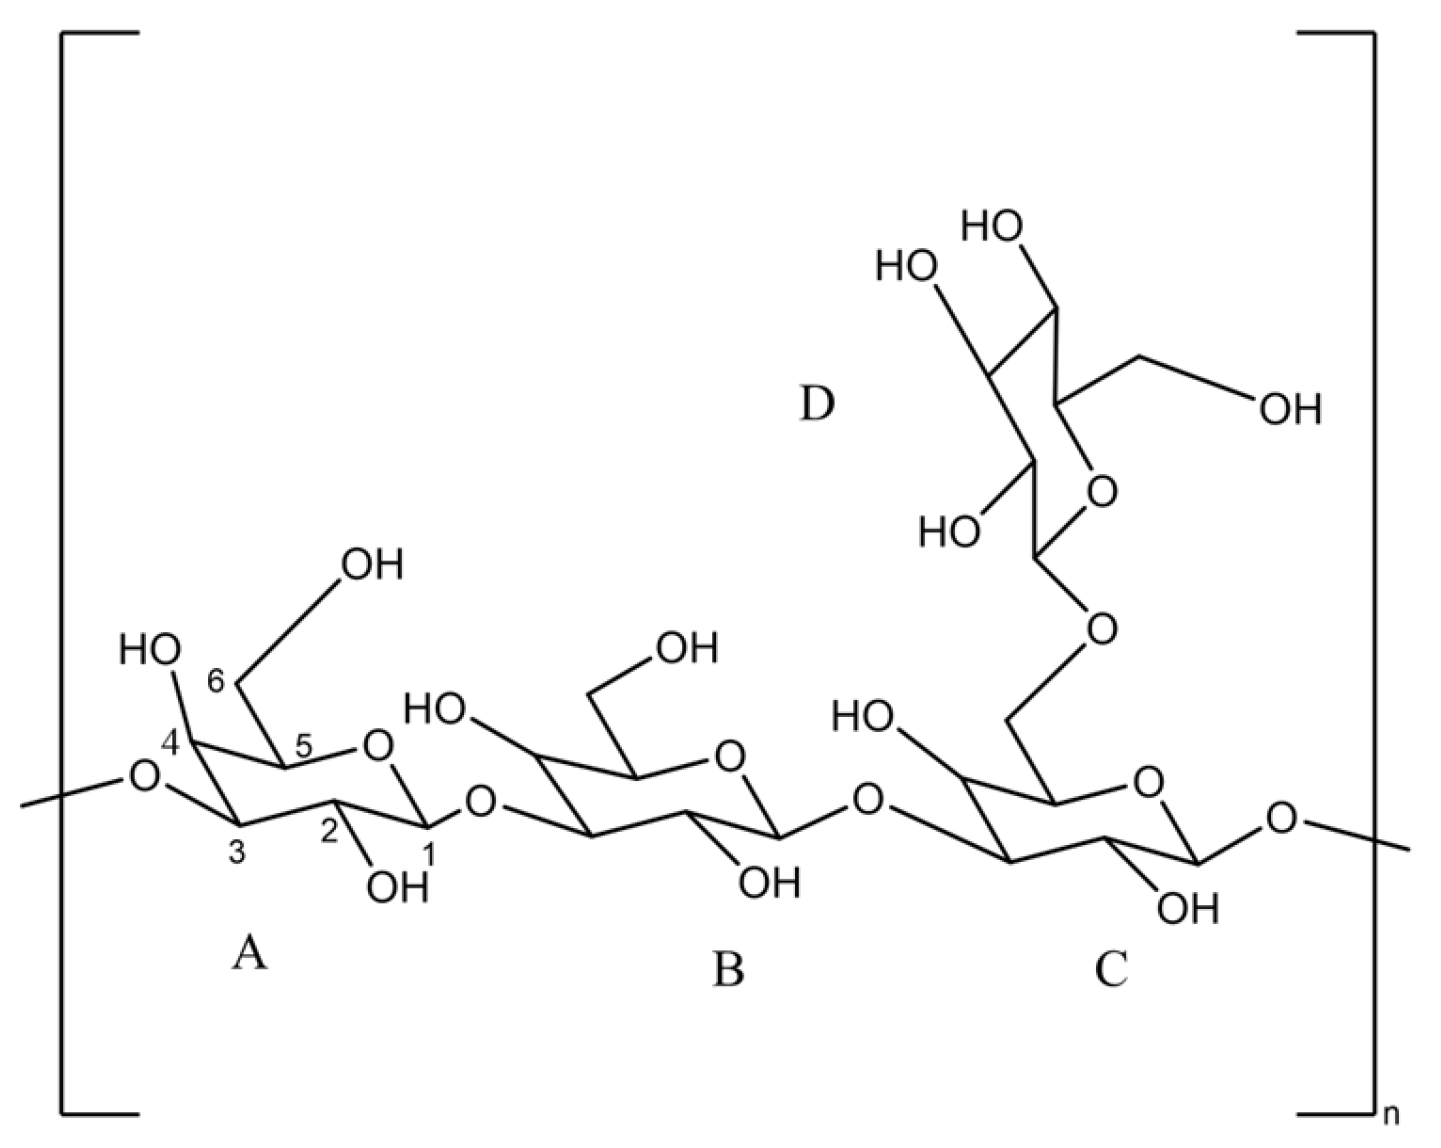
- Structure and composition: elemental analysis and ultraviolet spectroscopy showed that the extracted polysaccharide contained a very small amount of protein residue, indicating that the purification process was effective. By NMR and IR analysis, it was confirmed that the polysaccharide had the structure of a pyranose ring connected by a β-glucoside bond, which showed the typical characteristics of scleroglucan. These results indicated that the original fermentation broth of the exopolysaccharides of Athelia rolfsii was structurally consistent with commercial scleroglucan.
- (2)
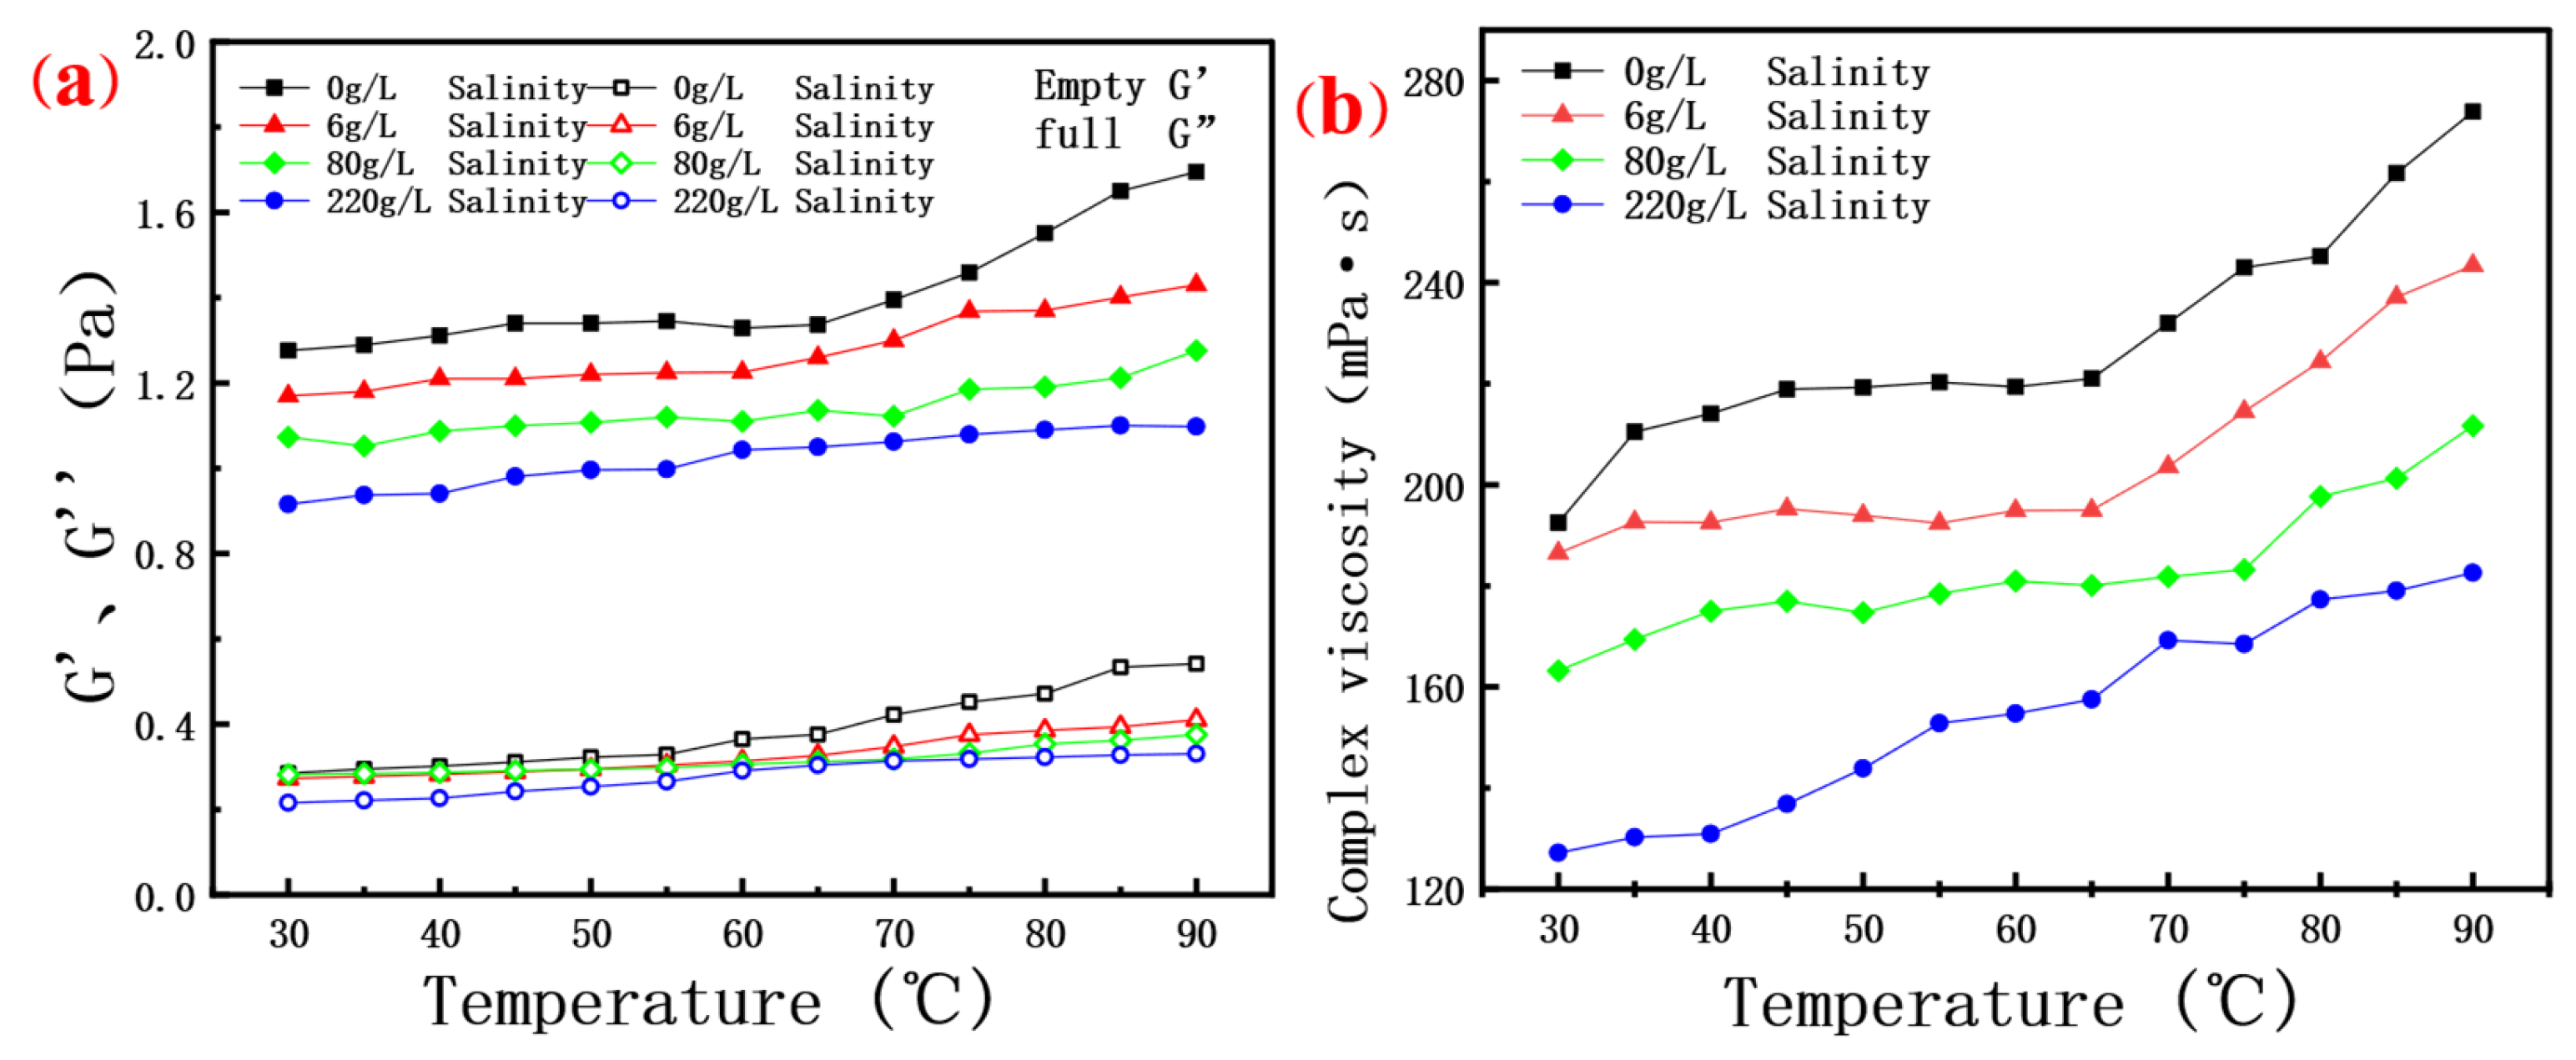
- Stability: High temperature stability: At temperatures up to 150 °C, the viscosity of the scleroglucan solution showed little change, showing excellent thermal stability. pH stability: In the range of pH 1–13, the viscosity of the solution was higher than 70 mPa·s, indicating that it exhibits good stability under both strongly acidic and strongly alkaline conditions. This shows that scleroglucan is able to maintain its properties in a wide range of pH environments and adapt to reservoirs with different geological conditions. Salinity stability: At a salinity of up to 220 g/L, the viscosity of the solution remained above 70 mPa·s, showing excellent salt tolerance. Viscoelasticity: At low shear stress, the storage modulus G’ of scleroglucan solution was significantly higher than the loss modulus G”, indicating that it has significant elastic properties. Even under high salinity conditions, G’ is still higher than G”, indicating that its elastic advantage can be maintained at different salinities. This property enables the scleroglucan solution to better maintain its structure in the reservoir and improve the oil displacement efficiency. Long-term stability: At 76.6 °C and 220 g/L salinity, the viscosity of scleroglucan solution remained above 80% for 35 days, showing good long-term stability.
- (3)
- Oil displacement effect: Scleroglucan solution can significantly increase oil recovery by more than 15% under conditions simulating high temperature and high salt reservoirs in the Middle East. When injected in medium and low permeability reservoirs, there is no core plugging phenomenon, indicating that it can effectively improve oil–water flow characteristics and improve sweep efficiency as a thickening agent. This result proves the application potential of scleroglucan fermentation broth under actual reservoir conditions, which can significantly improve oil field recovery.
- (4)
- Excellent features of the original fermentation solution: Simplified processing, only requiring dilution stirring and centrifugation steps of the original fermentation solution, fully meeting the requirements of extreme reservoir applications without complex chemical treatment. This simplified process not only reduces the treatment cost, but also improves the treatment efficiency, making the original fermentation liquid more feasible in industrial applications. Under the condition of a medium and low permeability reservoir, there is no plugging phenomenon during the original fermentation fluid injection, which indicates that it has good injectivity. Although the viscosity of the original fermentation liquid is slightly lower than that of the purified scleroglucan, the processing is simple, the cost is lower, and the economy is higher. This characteristic makes the original fermentation liquid more cost advantageous in practical applications and it can reduce the cost of oilfield development.
Author Contributions
Funding
Institutional Review Board Statement
Informed Consent Statement
Data Availability Statement
Conflicts of Interest
References
- Hassan, A.M.; Al-Shalabi, E.W.; Ayoub, M.A. Updated Perceptions on Polymer-Based Enhanced Oil Recovery toward High-Temperature High-Salinity Tolerance for Successful Field Applications in Carbonate Reservoirs. Polymers 2022, 14, 2001. [Google Scholar] [CrossRef]
- Ferreira, V.H.S.; Moreno, R.B.Z.L. Experimental evaluation of low concentration scleroglucan biopolymer solution for enhanced oil recovery in carbonate. Oil Gas Sci. Technol.—Revue d’IFP Energ. Nouv. 2020, 75, 61. [Google Scholar] [CrossRef]
- Meng, Y.; Lyu, F.; Xu, X.; Zhang, L. Recent Advances in Chain Conformation and Bioactivities of Triple-Helix Polysaccharides. Biomacromolecules 2020, 21, 1653–1677. [Google Scholar] [CrossRef]
- Muhammed, F.; Dean, E.; Pitts, M.; Wyatt, K.; Kozlowicz, B.; Khambete, M.; Jensen, T.; Sumner, E.; Ray, C. Scleroglucan Polymer Injectivity Test Results in the Adena Oilfield. In Proceedings of the SPE Improved Oil Recovery Conference, Tulsa, OK, USA, 31 August–4 September 2020. [Google Scholar]
- Wang, Y.C.; Mcneil, B. Scleroglucan. Crit. Rev. Biotechnol. 1996, 16, 185–215. [Google Scholar] [CrossRef]
- Gao, X.; Huang, L.; Xiu, J.; Yi, L.; Zhao, Y. Evaluation of Viscosity Changes and Rheological Properties of Diutan Gum, Xanthan Gum, and Scleroglucan in Extreme Reservoirs. Polymers 2023, 15, 4338. [Google Scholar] [CrossRef]
- Cao, X.; Ji, Y.; Zhu, Y.; Zhao, F. Research progress and technical prospect of polymer flooding. Oil Gas Reserv. Eval. Dev. 2020, 10, 8–16. (In Chinese) [Google Scholar]
- Lai, N.; Wen, Y.; Yang, Z.; Chen, J.; Zhao, X.; Wang, D.; He, W.; Chen, Y. Polymer flooding in high-temperature and high-salinity heterogeneous reservoir by using diutan gum. J. Pet. Sci. Eng. 2020, 188, 106902. [Google Scholar] [CrossRef]
- Ghoumrassi-Barr, S.; Aliouche, D. A Rheological Study of Xanthan Polymer for Enhanced Oil Recovery. J. Macromol. Sci. Part B 2016, 55, 793–809. [Google Scholar] [CrossRef]
- Ma, R.; Dai, L.; Sun, D.; Yang, Y.; Tang, C.; Li, L.; He, Z.; Ni, Y. Nanocellulose/scleroglucan-enhanced robust, heat-resistant composite hydrogels for oilfield water plugging. Carbohydr. Polym. 2024, 341, 122320. [Google Scholar] [CrossRef]
- Morrison, A.C.; King, C.; Rodrigue, K. First Use of Novel High Temperature Water-Based Reservoir Drilling Fluid to Access Depleted Deepwater Reserves. In Proceedings of the Abu Dhabi International Petroleum Exhibition & Conference, Abu Dhabi, United Arab Emirates, 15–18 November 2021. [Google Scholar]
- Song, J.; Qiu, Y.; Zhao, R.; Hou, J.; Tu, L.; Nie, Z.; Wang, J.; Zheng, Y.; Wang, M. Transcriptomics and Metabolomics Analysis of Sclerotium rolfsii Fermented with Differential Carbon Sources. Foods 2022, 11, 3706. [Google Scholar] [CrossRef]
- Coviello, T.; Alhaique, F.; Di Meo, C.; Matricardi, P.; Montanari, E.; Zoratto, N.; Grassi, M.; Abrami, M. Scleroglucan and guar gum: The synergistic effects of a new polysaccharide system. Express Polym. Lett. 2022, 16, 410–426. [Google Scholar] [CrossRef]
- Morrison, A.; Biyani, M.; Kadam, S.; Bose, S.; Zhou, B. Development of a New Reservoir Drilling Fluid to Achieve Matrix Injection. In Proceedings of the ADIPEC, Abu Dhabi, United Arab Emirates, 31 October–3 November 2022. [Google Scholar]
- Davison, P.; Mentzer, E. Polymer Flooding in North Sea Reservoirs. Soc. Pet. Eng. J. 1982, 22, 353–362. [Google Scholar] [CrossRef]
- Schmid, J.; Meyer, V.; Sieber, V. Scleroglucan: Biosynthesis, production and application of a versatile hydrocolloid. Appl. Microbiol. Biotechnol. 2011, 91, 937–947. [Google Scholar] [CrossRef]
- Quadri, S.M.; Jiran, L.; Shoaib, M.; Hashmet, M.R.; AlSumaiti, A.M.; Alhassan, S.M. Application of Biopolymer to Improve Oil Recovery in High Temperature High Salinity Carbonate Reservoirs. In Proceedings of the Abu Dhabi International Petroleum Exhibition and Conference, Abu Dhabi, United Arab Emirates, 9–12 November 2015. [Google Scholar]
- Mazzuca, C.; Bocchinfuso, G.; Palleschi, A.; Conflitti, P.; Grassi, M.; Di Meo, C.; Alhaique, F.; Coviello, T. The Influence of pH on the Scleroglucan and Scleroglucan/Borax Systems. Molecules 2017, 22, 435. [Google Scholar] [CrossRef]
- Wang, Z.; Han, X.; Pan, F.; Fan, Y.; Yan, Y.; Zhou, X.; Li, C. Performance evaluation and field test of emulsion polymer for oil displacement. Acta Pet. Sin. 2024, 45, 976–987. [Google Scholar]
- Xia, S.; Zhang, L.; Davletshin, A.; Davletshin, A.; Li, Z.; You, J.; Tan, S. Application of Polysaccharide Biopolymer in Petroleum Recovery. Polymers 2020, 12, 1860. [Google Scholar] [CrossRef]
- Elhossary, D.; Alameri, W.; Al-Shalabi, E.W. Rheology and Injectivity Studies on Scleroglucan Biopolymer for Carbonates under Harsh Conditions. SPE Reserv. Eval. Eng. 2022, 25, 455–471. [Google Scholar] [CrossRef]
- Seright, R.S.; Wavrik, K.E.; Zhang, G.; AlSofi, A.M. Stability and Behavior in Carbonate Cores for New Enhanced-Oil-Recovery Polymers at Elevated Temperatures in Hard Saline Brines. SPE Reserv. Eval. Eng. 2021, 24, 1–18. [Google Scholar] [CrossRef]
- Song, H.; Mohanty, K.K. Transport of Biopolymer Scleroglucan in Cores at HTHS Conditions. In Proceedings of the SPE Improved Oil Recovery Conference, Tulsa, OK, USA, 31 August–4 September 2020. [Google Scholar]
- Xia, W.; Dong, X.; Zhang, Y.; Ma, T. Biopolymer from marine Athelia and its application on heavy oil recovery in heterogeneous reservoir. Carbohydr. Polym. 2018, 195, 53–62. [Google Scholar] [CrossRef]
- Bai, T.; Wang, T.; Li, Y.; Gao, N.; Zhang, L.; Chen, W.; Yin, X. Optimization of scleroglucan production by Sclerotium rolfsii by lowering pH during fermentation via oxalate metabolic pathway manipulation using CRISPR/Cas9. Fungal Biol. Biotechnol. 2021, 8, 1–9. [Google Scholar] [CrossRef]
- Song, J.; Jia, Y.-X.; Su, Y.; Zhang, X.; Tu, L.; Nie, Z.; Zheng, Y.; Wang, M. Initial Analysis on the Characteristics and Synthesis of Exopolysaccharides from Sclerotium rolfsii with Different Sugars as Carbon Sources. Polymers 2020, 12, 348. [Google Scholar] [CrossRef]
- Tan, R.; Lyu, Y.; Zeng, W.; Zhou, J. Enhancing scleroglucan production by Sclerotium rolfsii WSH-G01 through a pH-shift strategy based on kinetic analysis. Bioresour. Technol. 2019, 293, 122098. [Google Scholar] [CrossRef]
- Valdez, A.L.; Babot, J.D.; Schmid, J.; Delgado, O.D.; Fariña, J.I. Scleroglucan Production by Sclerotium rolfsii ATCC 201126 from Amylaceous and Sugarcane Molasses-Based Media: Promising Insights for Sustainable and Ecofriendly Scaling-Up. J. Polym. Environ. 2019, 27, 2804–2818. [Google Scholar] [CrossRef]
- Bakhshi, M.; Ozeiri, M.; Sharif, A.; Aalaie, J. Effect of hydrophobic modification on the structure and rheology of aqueous and brine solutions of scleroglucan polymer. Korean J. Chem. Eng. 2017, 34, 903–912. [Google Scholar] [CrossRef]
- Jeannin, M.; Rezzoug, S.A.; Maache-Rezzoug, Z.; Cohendoz, S.; Allaf, K. Solid-state13C NMR Study of Scleroglucan Polysaccharide. Effect of the Drying Process and Hydration on Scleroglucan Structure and Dynamics. Int. J. Polym. Anal. Charact. 2001, 6, 177–191. [Google Scholar] [CrossRef]
- He, Y.; Zhang, T. Validation of a method for determination of trace protein in polysaccharide samples. Chin. J. Biol. 2018, 31, 1376–1382. (In Chinese) [Google Scholar]
- Pomin, V.H. NMR Chemical Shifts in Structural Biology of Glycosaminoglycans. Anal. Chem. 2013, 86, 65–94. [Google Scholar] [CrossRef]
- Chen, R.; Wang, M.; Keasling, J.D.; Hu, T.; Yin, X. Expanding the structural diversity of terpenes by synthetic biology approaches. Trends Biotechnol. 2024, 42, 699–713. [Google Scholar] [CrossRef]
- Hong, T.; Yin, J.-Y.; Nie, S.-P.; Xie, M. Applications of infrared spectroscopy in polysaccharide structural analysis: Progress, challenge and perspective. Food Chem. X 2021, 12, 100168. [Google Scholar] [CrossRef]
- Pasieczna-Patkowska, S.; Cichy, M.; Flieger, J. Application of Fourier Transform Infrared (FTIR) Spectroscopy in Characterization of Green Synthesized Nanoparticles. Molecules 2025, 30, 684. [Google Scholar] [CrossRef]
- Cerreto, A.; Corrente, F.; Botta, B.; Pacelli, S.; Paolicelli, P.; Mannina, L.; Casadei, M.A. NMR Characterization of Carboxymethyl Scleroglucan. Int. J. Polym. Anal. Charact. 2013, 18, 587–595. [Google Scholar] [CrossRef]
- Rinaudo, M.; Vincendon, M. 13C NMR structural investigation of scleroglucan. Carbohydr. Polym. 1982, 2, 135–144. [Google Scholar] [CrossRef]
- Jiao, G.; Zhu, S.; Ye, Z.; Shu, Z.; Wang, X.; Wang, D. The Effect of Shear on the Properties of an Associated Polymer Solution for Oil Displacement. Polymers 2023, 15, 616. [Google Scholar] [CrossRef]
- Wang, C.-S.; Virgilio, N.; Carreau, P.J.; Heuzey, M.-C. Understanding the Effect of Conformational Rigidity on Rheological Behavior and Formation of Polysaccharide-Based Hybrid Hydrogels. Biomacromolecules 2021, 22, 4016–4026. [Google Scholar] [CrossRef]
- Zhang, Z.; Sun, L.; Chen, F.; Liu, X.; Huo, X.; Pan, X.; Feng, C. Host-guest strategy improves rheological properties, conformational stability and oil displacement efficiency of xanthan gum. Carbohydr. Polym. 2024, 345, 122598. [Google Scholar] [CrossRef]
- Moresi, M.; Lo Presti, S.; Mancini, M. Rheology of scleroglucan dispersions. J. Food Eng. 2001, 50, 235–245. [Google Scholar] [CrossRef]
- Rau, U.; Mller, R.J.; Cordes, K.; Klein, J. Process and molecular data of branched 1,3-β-D-glucans in comparison with Xanthan. Bioprocess Eng. 1990, 5, 89–93. [Google Scholar] [CrossRef]
- Wang, S.; Liu, X.; Wang, S.; Georgiou, T.K. Effect of architecture on the thermo-induced phase transition of methacrylate-based symmetric pentablock terpolymers. Polym. Chem. 2024, 15, 4894–4907. [Google Scholar] [CrossRef]
- Rodriguez Mateus, Z.P.; Angarita, R.C.; Nino Gomez, J.A.; Niño Gómez, J.A.; Corredor, L.M.; Llanos Gallo, S.; Quintero, H.; Castro García, R.H. Biodegradation and toxicity of scleroglucan for enhanced oil recovery. CT&F-Ciencia Tecnologia y Futuro 2022, 12, 5–12. [Google Scholar]
- Ahmed, J. Time-Temperature Superposition Principle and its Application to Biopolymer and Food Rheology. In Advances in Food Rheology and Its Applications; Woodhead Publishing: Cambridge, UK, 2017; pp. 209–241. [Google Scholar]
- Burla, F.; Mulla, Y.; Vos, B.E.; Aufderhorst-Roberts, A.; Koenderink, G.H. From mechanical resilience to active material properties in biopolymer networks. Nat. Rev. Phys. J. Nat. Sci. 2019, 1, 249–263. [Google Scholar] [CrossRef]
- Zhang, X.; Han, M.; Xu, L.; AlSofi, A.M. Long-term stability prediction of polyacrylamide-type polymers at harsh conditions via thermogravimetric analysis. Chem. Phys. Lett. 2022, 795, 139538. [Google Scholar] [CrossRef]
- Clinckspoor, K.J.; Ferreira, V.H.D.S.; Moreno, R.B.Z.L. Bulk rheology characterization of biopolymer solutions and discussions of their potential for enhanced oil recovery applications. CT&F-Ciencia Tecnologia y Futuro 2021, 11, 123–135. [Google Scholar]
- Liu, Y.; Wu, Q.; Wu, X.; Algharib, S.A.; Gong, F.; Hu, J.; Luo, W.; Zhou, M.; Pan, Y.; Yan, Y.; et al. Structure, preparation, modification, and bioactivities of beta-glucan and mannan from yeast cell wall: And bioactivities of beta-glucan and Mannan from yeast cell wall: A review. Int. J. Biol. Macromol. 2021, 173, 445–456. [Google Scholar] [CrossRef]
- Farina, J.I.; Santos, V.E.; Perotti, N.I.; Casas, J.A.; Molina, O.E.; Garcia-Ochoa, F. Influence of the nitrogen source on the production and rheological properties of scleroglucan produced by Sclerotium rolfsii ATCC 201126. World J. Microbiol. Biotechnol. 1999, 15, 309–316. [Google Scholar] [CrossRef]
- Wang, B.Q.; Xu, Z.P.; Liu, N.N. Study on the Gelation Properties of the Glucan from Sclerotium rolfsii. Adv. Mater. Res. 2012, 581–582, 168–171. [Google Scholar] [CrossRef]
- Bhuiyan, F.H.; Li, Y.-S.; Kim, S.H.; Martini, A. Shear-activation of mechanochemical reactions through molecular deformation. Sci. Rep. 2024, 14, 1–12. [Google Scholar] [CrossRef]
- Meneses, A.; Naya, S.; Francisco-Fernandez, M.; López-Beceiro, J.; Gracia-Fernández, C.; Tarrío-Saavedra, J. TTS package: Computational tools for the application of the Time Temperature Superposition principle. Heliyon 2023, 9, e15816. [Google Scholar] [CrossRef]
- Fjelde, I.; Stavland, A. Scleroglucan Gels for Profile Modifications in High-Temperature Reservoirs. SPE Adv. Technol. Ser. 1995, 3, 7–12. [Google Scholar] [CrossRef]


| Chemical Reagent Name | Purity (%) | Brand | City, Country |
|---|---|---|---|
| Glucose | AR (>99%) | Tianjin Chemical Co. | Tianjin, China |
| Yeast Powder | total nitrogen content ≥9.0% | Sinopharm Chemical Reagent Co., Ltd. | Shanghai, China |
| Potassium Dihydrogen Phosphate | AR (>99%) | Tianjin Chemical Co. | Tianjin, China |
| Potassium Chloride | AR (>99%) | Sinopharm Chemical Reagent Co., Ltd. | Shanghai, China |
| Ferrous Sulfate | AR (>99%) | Tianjin Chemical Co. | Tianjin, China |
| Magnesium Sulfate | AR (>99%) | Sinopharm Chemical Reagent Co., Ltd. | Shanghai, China |
| Citric Acid | AR (>99%) | Tianjin Chemical Co. | Tianjin, China |
| Sodium Nitrate | AR (>99%) | Sinopharm Chemical Reagent Co., Ltd. | Shanghai, China |
| Instrument Name | Model | Manufacturer | City, Country |
|---|---|---|---|
| Electronic Balance | BSM/120.4 | Shanghai Zhuojing Electronic Technology Co., Ltd. | Shanghai, China |
| Biochemical Incubator | ZOLY-300N | Shanghai Zhichu Instrument Co., Ltd. | Shanghai, China |
| Super Clean Workstation | SJ-CJ-2FD | Su Jie Medical Instrument Co., Ltd. | Suzhou, China |
| Pipette Controller | F1-ClipTip | Thermo Fisher Scientific | Frankfurt, Germany |
| High-Speed Centrifuge | JLA | Beckman Coulter, Inc. | Brea, CA, USA |
| pH Meter | PHS-3C | Shanghai Yi Electric Science Instrument Co., Ltd. | Shanghai, China |
| Electric Blast Drying Oven | DHG-9013/9053A | Shanghai Yiheng Scientific Instrument Co., Ltd. | Shanghai, China |
| Rotational Rheometer | Haake MARS 60 | Thermo Fisher Scientific | Frankfurt, Germany |
| Cantilever Electric Stirrer | LC-OES-60 | Shanghai Lichen Bangxi Instrument Technology Co., Ltd. | Shanghai, China |
| Composition (g·L−1) | Total Salinity (g·L−1) | ||
|---|---|---|---|
| NaCl | CaCl2 | MgCl2·6H2O | |
| 192.5 | 16.5 | 11 | 220 |
| 70 | 6 | 4 | 80 |
| 5.3 | 0.45 | 0.3 | 6 |
| Element | Measured Value (%) | Theoretical Value (%) |
|---|---|---|
| C | 42.14 | 43.25 |
| H | 6.17 | 6.35 |
| N | 0.06 | / |
| S | 0.04 | / |
| O | 50.82 | 50.40 |
| Solvents | Maximum Absorption Wavelength λmax (nm) | Absorbance A | Analysis |
|---|---|---|---|
| Water solution | 280 | 0.0268 | Trace protein residue |
| Absorption Peak (cm−1) | Intensity | Type of Vibration | Groups | Remarks |
|---|---|---|---|---|
| 3362.46 (br) | Medium | Nu O-H | -OH | Hydroxyl |
| 2936.82 | Medium | Nu C-H | -CH2- | Alkyl (methylene) |
| 1420.00~1200.03 | Medium | Nu C-O | -C-O- | Hydroxyl |
| 1149.13, 1079.06, 1060.86 | Medium | υC-O-C, υC-O-H | C-O-C, C-O-H | Pyranose |
| 888.48 | Medium | Beta-OH | -OH | β-Configurational polysaccharide |
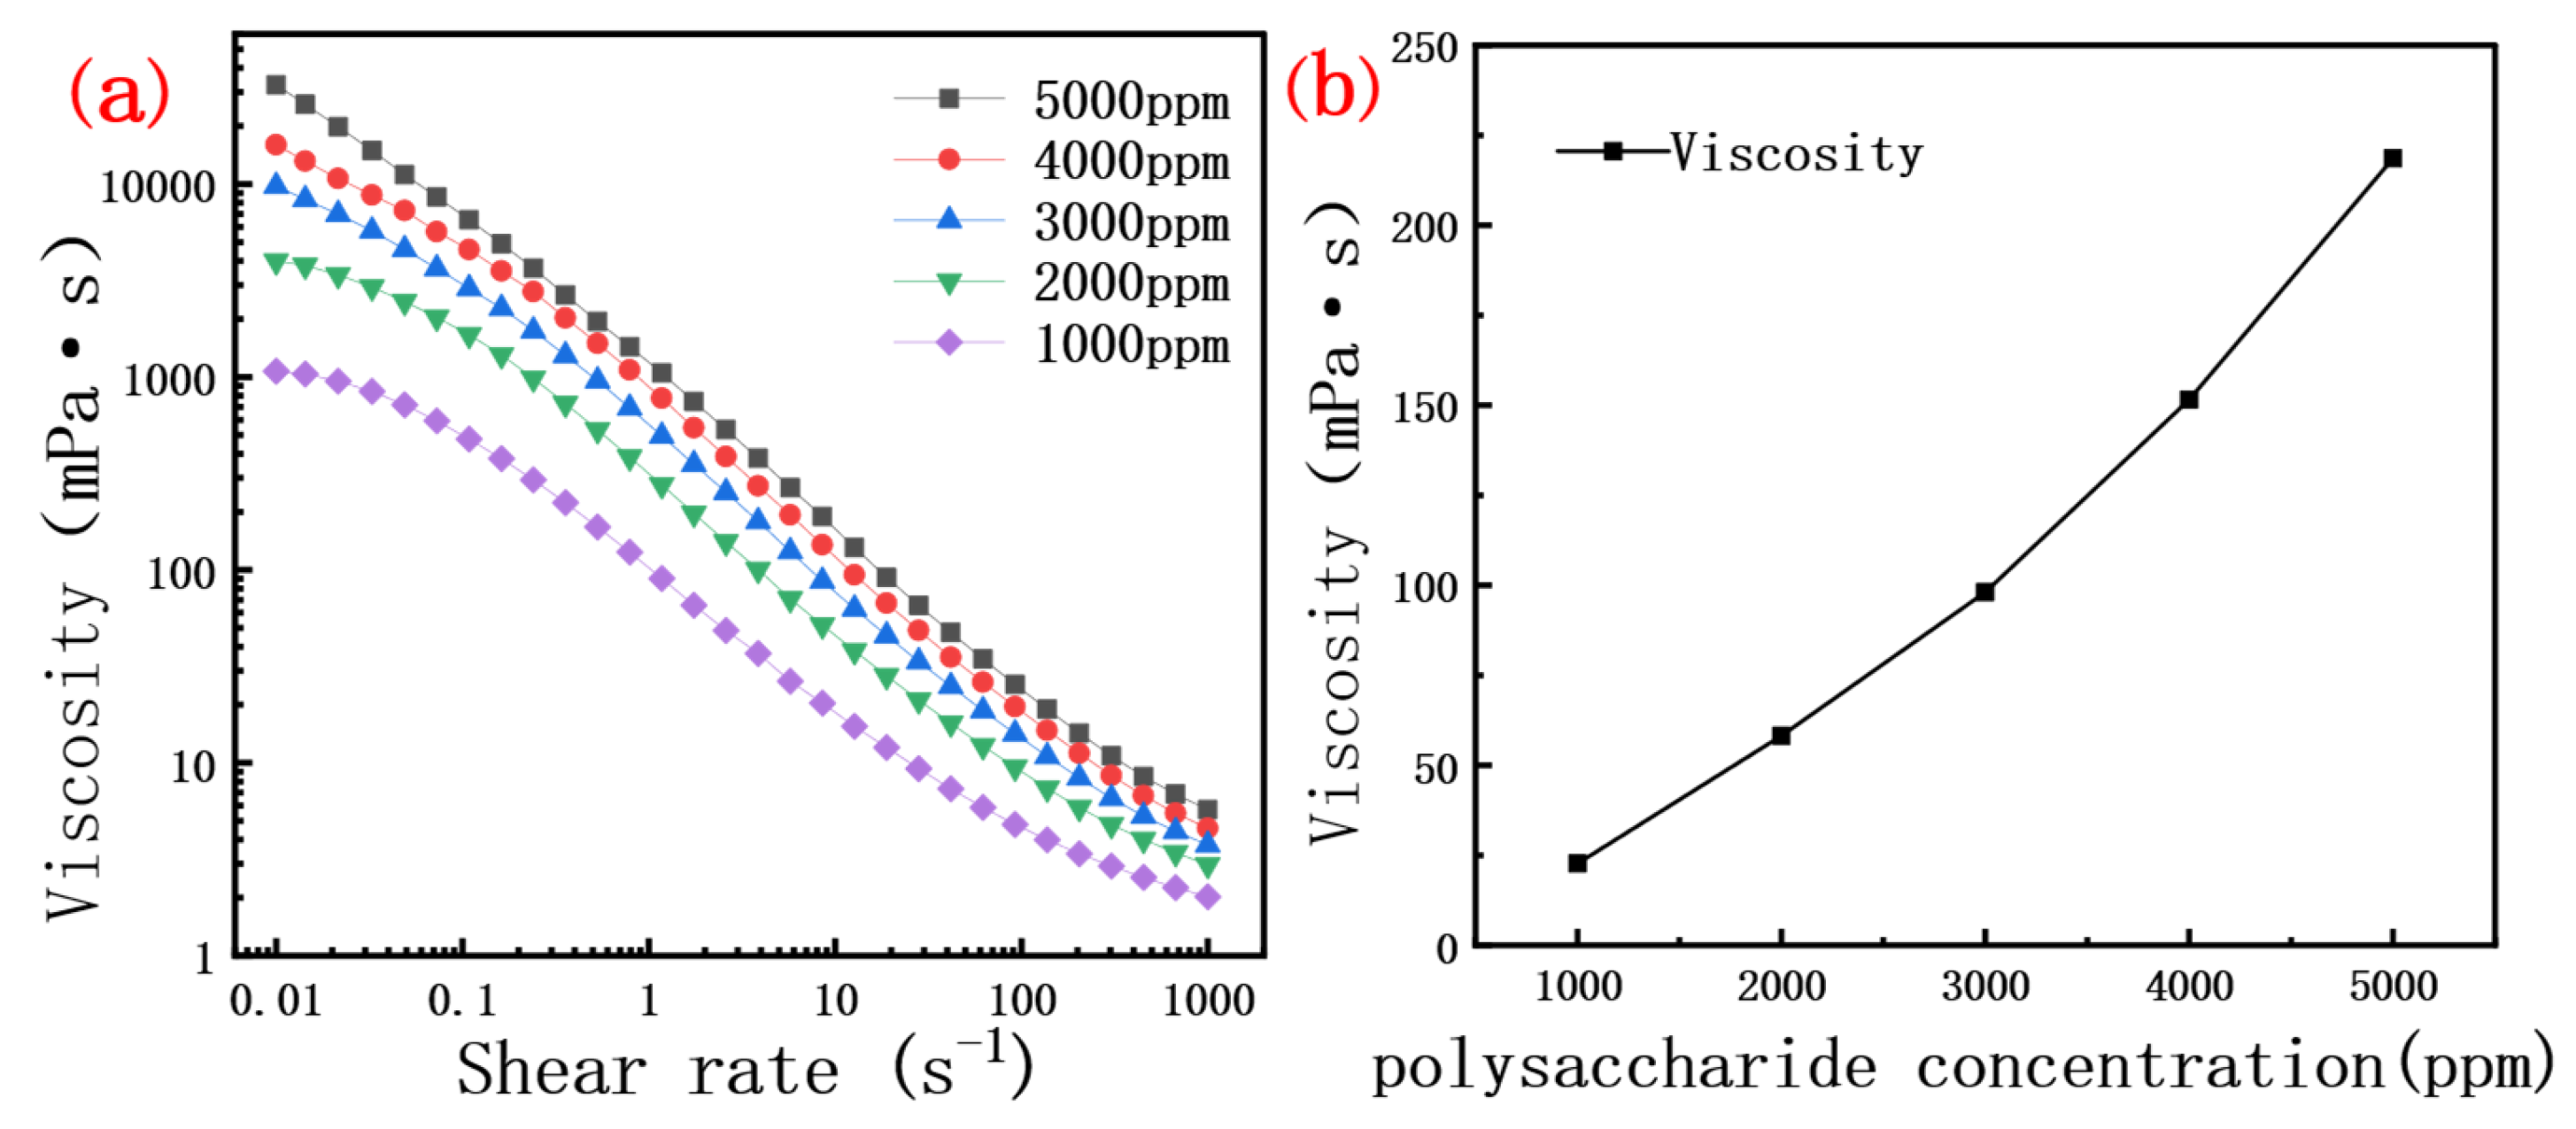
| Polymer Concentration/ppm | k (mPa·sn) | n | R2 | Shear Rate Range (s−1) |
|---|---|---|---|---|
| 1000 | 94.2 | 0.38 | 0.9904 | 0.01 < < 1000Ý |
| 2000 | 268.9 | 0.30 | 0.9925 | 0.01 < < 1000Ý |
| 3000 | 474.7 | 0.26 | 0.9955 | 0.01 < < 1000Ý |
| 4000 | 718.9 | 0.24 | 0.9955 | 0.01 < < 1000Ý |
| 5000 | 1044.5 | 0.21 | 0.9982 | 0.01 < < 1000Ý |
| Biological Polymer | Species | Natural Molecular Structure | Temperature Resistance |
|---|---|---|---|
| Xanthan Gum | Xanthomonas campestris | Double helix | 10–40 °C |
| Dutan Gum | Sphingomonas paucimobilis | Double helix | 100–120 °C |
| Scleroglucan | Athelia rolfsii | triple helix | Below 130 °C |
| Curdlan | Alcaligenes sp. | Double helix | 25–100 °C |
| Gellan Gum | Sphingomonas paucimobilis | Parallel, double helix | 20–90 °C |
| Core Number | Length (cm) | Diameter of Section (cm) | Permeability (mD) | Pore Volume (mL) | Amount of Saturated Oil (mL) | Viscosity of Saturated Oil (cP) |
|---|---|---|---|---|---|---|
| JZ-13-4 | 29.9 | 3.83 | 105.2 | 70.2 | 41.1 | 2.75 |
| JZ-13-3 | 29.6 | 3.81 | 116.8 | 71.5 | 41.6 | 2.75 |
| JZ-13-12 | 30.0 | 3.81 | 118.4 | 70.9 | 41.0 | 2.75 |
| JZ-13-13 | 29.9 | 3.81 | 110.1 | 70.1 | 40.3 | 2.75 |
| Core Number | Biopolymer Viscosity (mPa·s) | Water Drive Recovery (%) | Integrated Recovery Factor (%) | Enhanced Oil Recovery (%) | Resistance Factor (RF) | Residual Resistance Factor (RFF) |
|---|---|---|---|---|---|---|
| JZ-13-4 | 20 | 50.32 | 67.28 | 16.96 | 18.7 | 6.75 |
| JZ-13-3 | 20 | 51.44 | 67.51 | 16.07 | 21.7 | 7.65 |
| JZ-13-12 | 10 | 52.92 | 68.23 | 15.28 | 17.1 | 6.4 |
| JZ-13-13 | 10 | 49.23 | 64.52 | 15.29 | 15.5 | 5.7 |
Disclaimer/Publisher’s Note: The statements, opinions and data contained in all publications are solely those of the individual author(s) and contributor(s) and not of MDPI and/or the editor(s). MDPI and/or the editor(s) disclaim responsibility for any injury to people or property resulting from any ideas, methods, instructions or products referred to in the content. |
© 2025 by the authors. Licensee MDPI, Basel, Switzerland. This article is an open access article distributed under the terms and conditions of the Creative Commons Attribution (CC BY) license (https://creativecommons.org/licenses/by/4.0/).
Share and Cite
Fu, H.; Xiu, J.; Huang, L.; Yi, L.; Ma, Y.; Wang, S. Evaluation of Oil Displacement by Polysaccharide Fermentation Broth of Athelia rolfsii Under Extreme Reservoir Conditions. Molecules 2025, 30, 2861. https://doi.org/10.3390/molecules30132861
Fu H, Xiu J, Huang L, Yi L, Ma Y, Wang S. Evaluation of Oil Displacement by Polysaccharide Fermentation Broth of Athelia rolfsii Under Extreme Reservoir Conditions. Molecules. 2025; 30(13):2861. https://doi.org/10.3390/molecules30132861
Chicago/Turabian StyleFu, Haowei, Jianlong Xiu, Lixin Huang, Lina Yi, Yuandong Ma, and Sicai Wang. 2025. "Evaluation of Oil Displacement by Polysaccharide Fermentation Broth of Athelia rolfsii Under Extreme Reservoir Conditions" Molecules 30, no. 13: 2861. https://doi.org/10.3390/molecules30132861
APA StyleFu, H., Xiu, J., Huang, L., Yi, L., Ma, Y., & Wang, S. (2025). Evaluation of Oil Displacement by Polysaccharide Fermentation Broth of Athelia rolfsii Under Extreme Reservoir Conditions. Molecules, 30(13), 2861. https://doi.org/10.3390/molecules30132861