Article

New Cation Sensors Based on Eugenol-Derived Azo Dyes

by
José R. A. Coelho
1,
Ana Rita F. Pacheco
2,3,
Diogo C. Domingues
1,
Ana Rita O. Rodrigues
2,3,
Akani A. Temitope
1,
Paulo J. G. Coutinho
2,3,
Maria José G. Fernandes
1,
Elisabete M. S. Castanheira
2,3 and
M. Sameiro T. Gonçalves
1,*
1
Chemistry Centre of the University of Minho (CQ-UM), Department of Chemistry, University of Minho, Campus de Gualtar, 4710-057 Braga, Portugal
2
Physics Centre of Minho and Porto Universities (CF-UM-UP), Department of Physics, University of Minho, Campus de Gualtar, 4710-057 Braga, Portugal
3
Associate Laboratory LaPMET, University of Minho, Campus de Gualtar, 4710-057 Braga, Portugal
*
Author to whom correspondence should be addressed.
Molecules 2025, 30(13), 2788; https://doi.org/10.3390/molecules30132788
Submission received: 13 May 2025 / Revised: 24 June 2025 / Accepted: 25 June 2025 / Published: 28 June 2025
(This article belongs to the Section Analytical Chemistry)

Abstract

Eugenol-based azo dyes illustrate how bio-sourced compounds like eugenol can be transformed through synthetic processes into functional and colorful compounds. The main purpose of the present work was to develop new responsive colorimetric sensors for metal cations based on eugenol-derived azo compounds. The incorporation of the azo group into the eugenol framework allows for strong electronic interactions with metal cations, leading to distinct color changes observable to the naked eye. These azo-eugenol dyes exhibit shifts in their UV-Vis absorption spectra upon complexation with metal cations such as copper (Cu2+) and lead (Pb2+), making them effective sensors for environmental and analytical applications. The eugenol-based azo dyes were subjected to photophysical studies to understand selectivity, response time, and stability in relation to metal cations, which will be a starting point for the monitoring of toxic metal contaminants in aqueous environments.

Graphical Abstract

1. Introduction

Azo dyes, known for their diversity of appealing colors and stability, have been widely used in various applications such as textiles, food, and analytical chemistry, due to their ease of synthesis, structural variability, and unique chromogenic tonalities to the naked eye, where reds, oranges, and yellows predominate [1,2,3,4,5,6]. The exact coloration of the respective dyes is based on the existence of a chromophore group (-N=N-), associated with the nature and position of the substituents connected to the aromatic systems, where the amplification of the degree of conjugation of the π system enhances the absorption of light at longer wavelengths [7,8]. These dyes can undergo significant color changes in response to the binding of specific cations, enabling rapid, visual detection of metal ions [9,10,11]. Among these, azo dyes derived from natural sources, like eugenol, may offer a promising eco-friendly alternative to full synthetic dyes, where it is possible to combine the physicochemical and biological properties inherent in phenolic compounds, known to have significant antioxidant activities [12,13].
Eugenol, the major secondary metabolite found in clove oil (Syzygium aromaticum) and present in other essential oils, provides a versatile basis for the synthesis of azo dyes due to its reactive functional groups and aromatic structure. Azo dyes synthesized from eugenol are not only potential environmentally benign, but also possess unique photophysical properties, making them ideal candidates for colorimetric sensing applications [14,15,16]. From a structural perspective, eugenol is a phenolic compound, meaning that the existence of a hydroxyl group makes it a suitable ligand for complexing with metals. Another crucial aspect is the role of the methoxyl group in the orientation of the ligand in relation to the metal center, which positions the donor atom in the metal’s coordination sphere [17]. As a ligand, eugenol can form complexes with important biometals such as Fe2+ and Fe3+ cations. The eugenol moiety has been already reported as a colorimetric probe for iron(III), where it displays complexes that have a blue-green color (λmax = 653 nm) [18]. Thus, eugenol-derived azo dyes present a novel, sustainable, and effective approach for developing selective and sensitive colorimetric sensors for cation detection.
This feature is particularly valuable in environmental monitoring, medical diagnostics, and industrial processes, where detecting toxic or essential cations with high sensitivity and selectivity is crucial. Metals present a dichotomy based on their dose and their biological importance [19]. Some metals are essential in metabolic processes, where excess or deficiency can lead to severe damage. Other metals are real poisons that tend to bioaccumulate in the environment. Copper is a biologically relevant element; however, prominent levels of Cu2+ can contribute to the development of neurodegenerative diseases (such as Alzheimer’s disease, Menkes’ syndrome, or Wilson’s disease), prion disease, hypoglycemia, and dyslexia, and also to the progression of cancer [20,21,22]. On the other hand, lead (Pb2+) is described as a poison that can affect many organs in the human body, damaging the brain, nervous system, blood, digestive system, and also the reproductive system, due to its ability to mimic and, in some cases, inhibit the action of calcium as a regulator of cellular function [23,24].
In recent years, scientific research efforts have been directed toward significant advances in the detection of various metal cations, particularly through the development of chemosensors for Cu2+ and Pb2+ ions, which have recently been described in detail [25,26]. Organic colorimetric chemical sensors, such as thioureas, Schiff bases (imines), pyridines, thiophenes, thiazoles, indoles, calixarenes, porphyrins, crown ethers, and BODIPYs, are promising candidates [27,28,29,30,31]. Furthermore, the valorization of natural products has been an emerging field in the design of new ligands for the detection of metal cations.
Taking these facts into consideration, the present work focuses on broadening the scope of application of eugenol-based azo dyes—including previously reported structures developed for other purposes and applications [14,16]—by evaluating their use in the detection of various metal cations, with promising results in the colorimetric sensing of lead(II) and copper(II) ions.

2. Results and Discussion
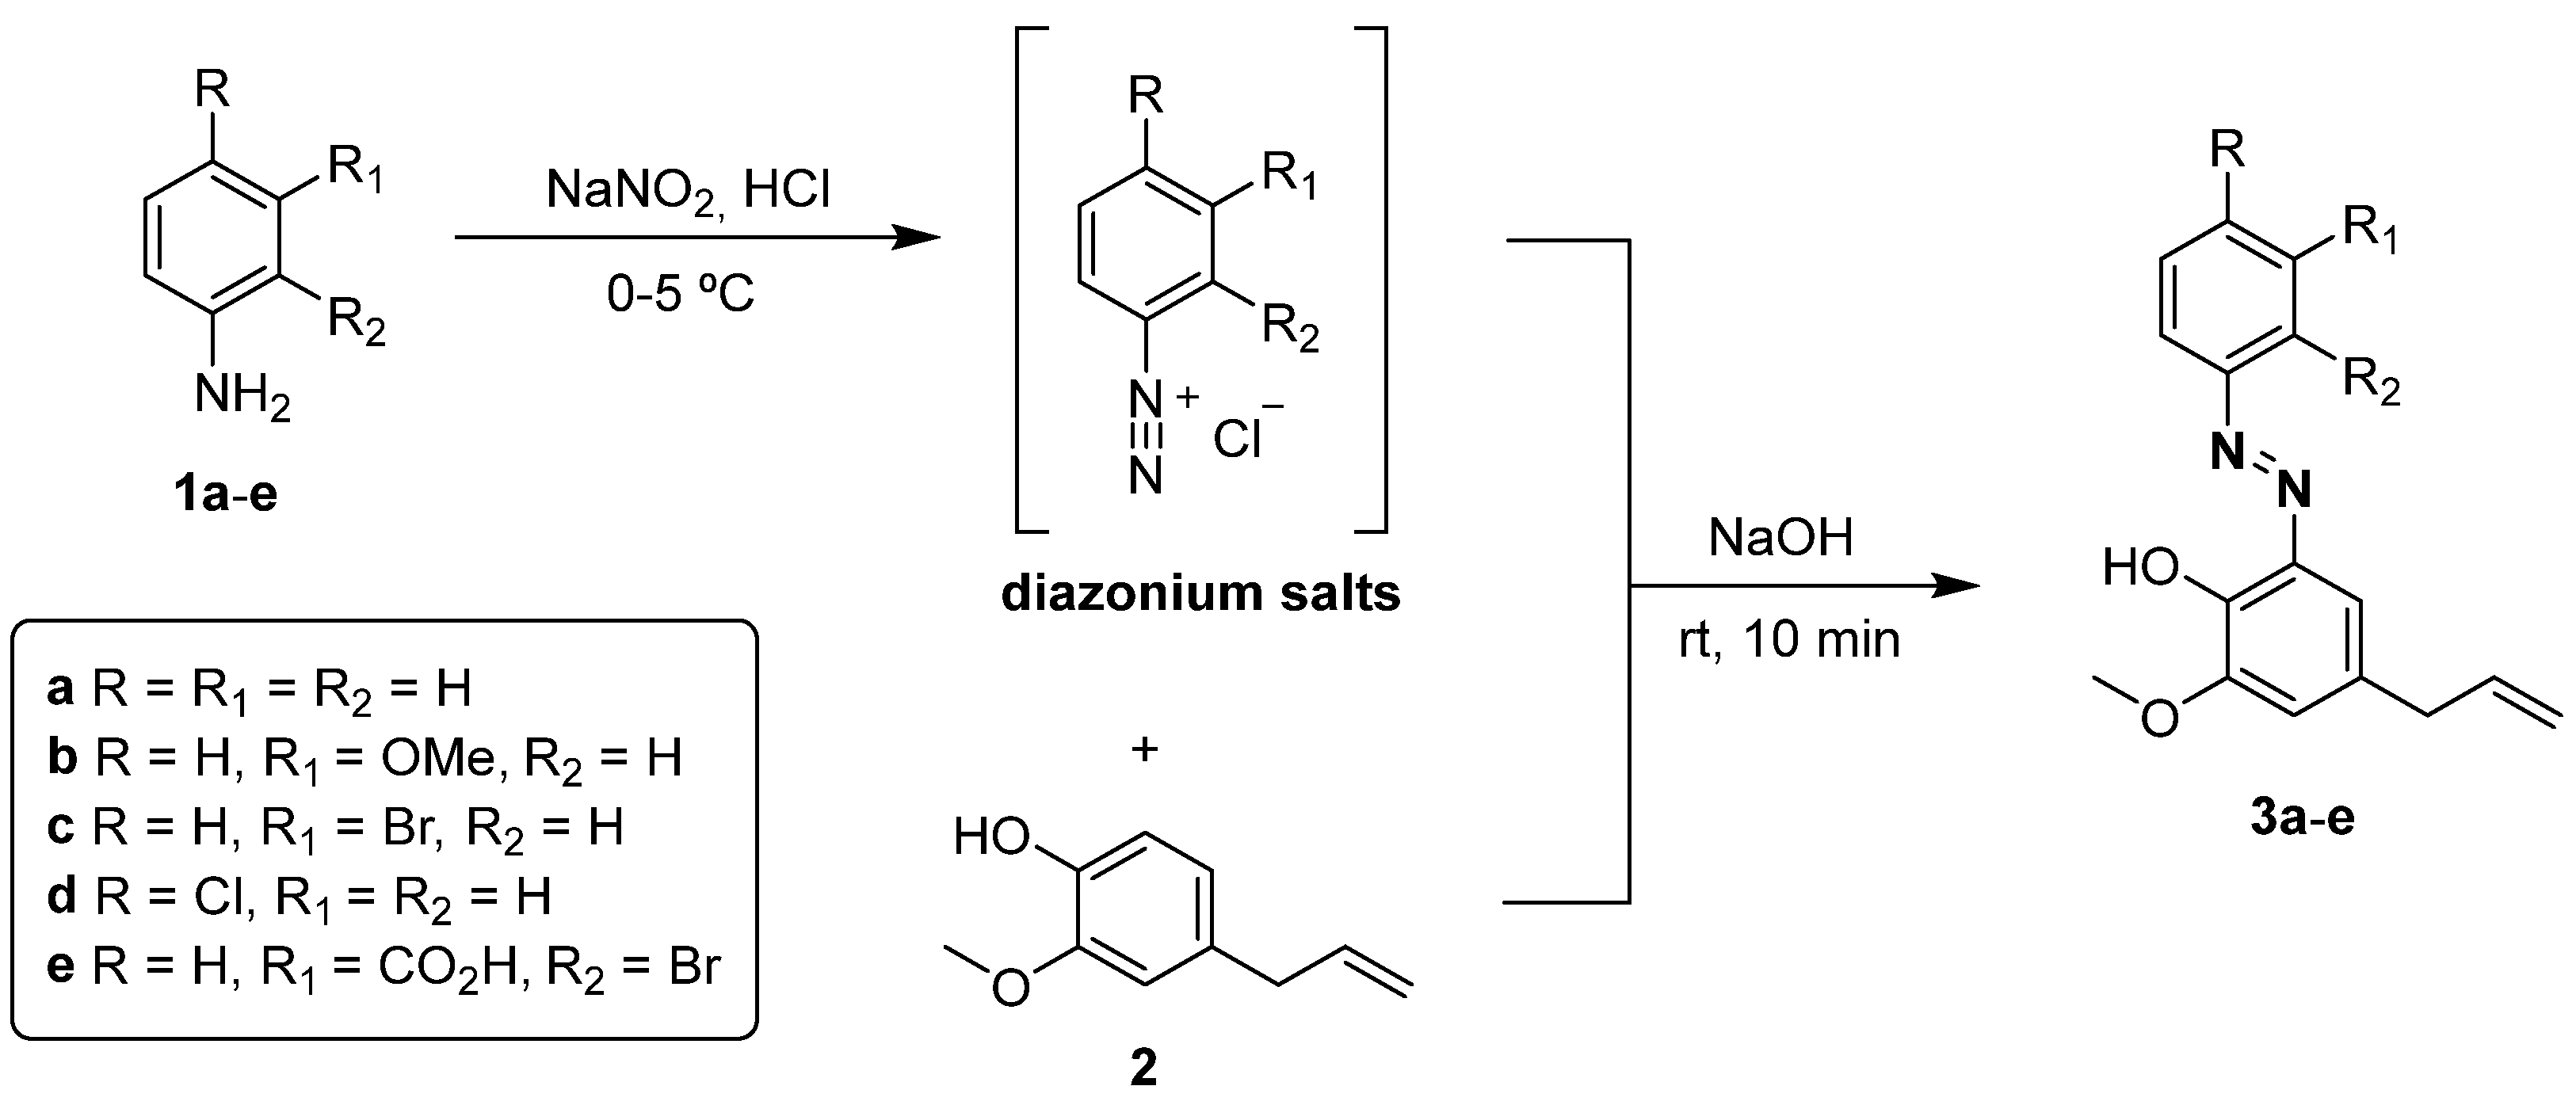
2.1. Synthesis of Eugenol Azo Dyes 3ae

Azo dyes incorporating eugenol (4-allyl-2-methoxyphenol) into their structures have been synthesized following a conventional methodology. In this process, eugenol was coupled with diazonium salts of aniline-based amines to form the azo compounds. Aniline 1a, 3-methoxyaniline 1b, 3-bromoaniline 1c, 4-chloroaniline 1d, and 3-amino-2-bromobenzoic acid 1e were reacted in an acidic medium with sodium nitrite, at low temperature, producing diazonium salts, which were added to eugenol 2 in a basic medium, to yield 4-allyl-2-methoxy-6-(phenyldiazenyl)phenol 3a [14], 4-allyl-2-methoxy-6-((3-methoxyphenyl)diazenyl)phe-nol 3b [16], 4-allyl-2-((3-bromophenyl)diazenyl)-6-methoxyphenol 3c, 4-allyl-2-((4-chlorophenyl)diazenyl)-6-methoxy-phenol 3d [14], and 3-((5-allyl-2-hydroxy-3-methoxyphenyl)diazenyl)-2-bromobenzoic acid 3e (Scheme 1).
Compounds 3ae were obtained as orange and red solids in moderate yields (14–44%). These yields result due to the fact that eugenol has very limited solubility in water, meaning that the reaction tends not to be complete and requires purification of the crude product obtained using chromatographic techniques, which also leads to significant losses. Considering the electronic nature of the substituent groups of eugenol, as well as the possible steric impediments associated with the allyl side chain, the site for azo-functionalization will occur in the ortho position relative to the hydroxyl group. The respective compounds were fully characterized by using the usual analytical techniques: 1H NMR, 13C NMR, FTIR spectroscopy, and HRMS (see Figures S1–S22, Supplementary Materials).
In the 1H NMR spectra, it is possible to distinguish different signals for aliphatic protons, namely, methylenic (δ 3.37–3.43 ppm) and methoxyl (δ 3.84–3.95 ppm) groups, in addition to the expected protons of the eugenol’s double bond as multiplets CH2 (δ 5.06–5.19 ppm) and CH (δ 5.96–6.07 ppm). With the occupation of the most activated position for the occurrence of azo coupling, the respective aromatic signals of eugenol (H-3 and H-4 or H-4 and H-6, in the case of 3e) will correspond to two doublets (J 1.6 or 2.0 Hz) or be included in a multiplet (H-5 in 2b) (δ 6.80–7.47 ppm). For amines, the aromatic protons will appear at specific chemical shifts, depending on the electronic nature and position of the substituents present.
The 13C NMR spectra of all compounds showed signals of the aliphatic carbons from the CH2 (δ 38.81–39.55 ppm) and OCH3 groups (δ 56.14–56.48 ppm), in addition to carbons of the eugenol’s double bond CH2 (δ 116.03–116.28 ppm) and CH (δ 136.96–137.42 ppm). The carbons of the aromatic rings were also shown (δ 112.15–160.38 ppm). For compound 3e, it is possible to assign the carbon in the carbonyl group of the carboxylic acid function at δ 168.04 ppm. The FTIR spectra also confirmed the presence of a CO2H group for compound 3e, showing the corresponding C=O stretching vibration bands at 1695 cm−1.

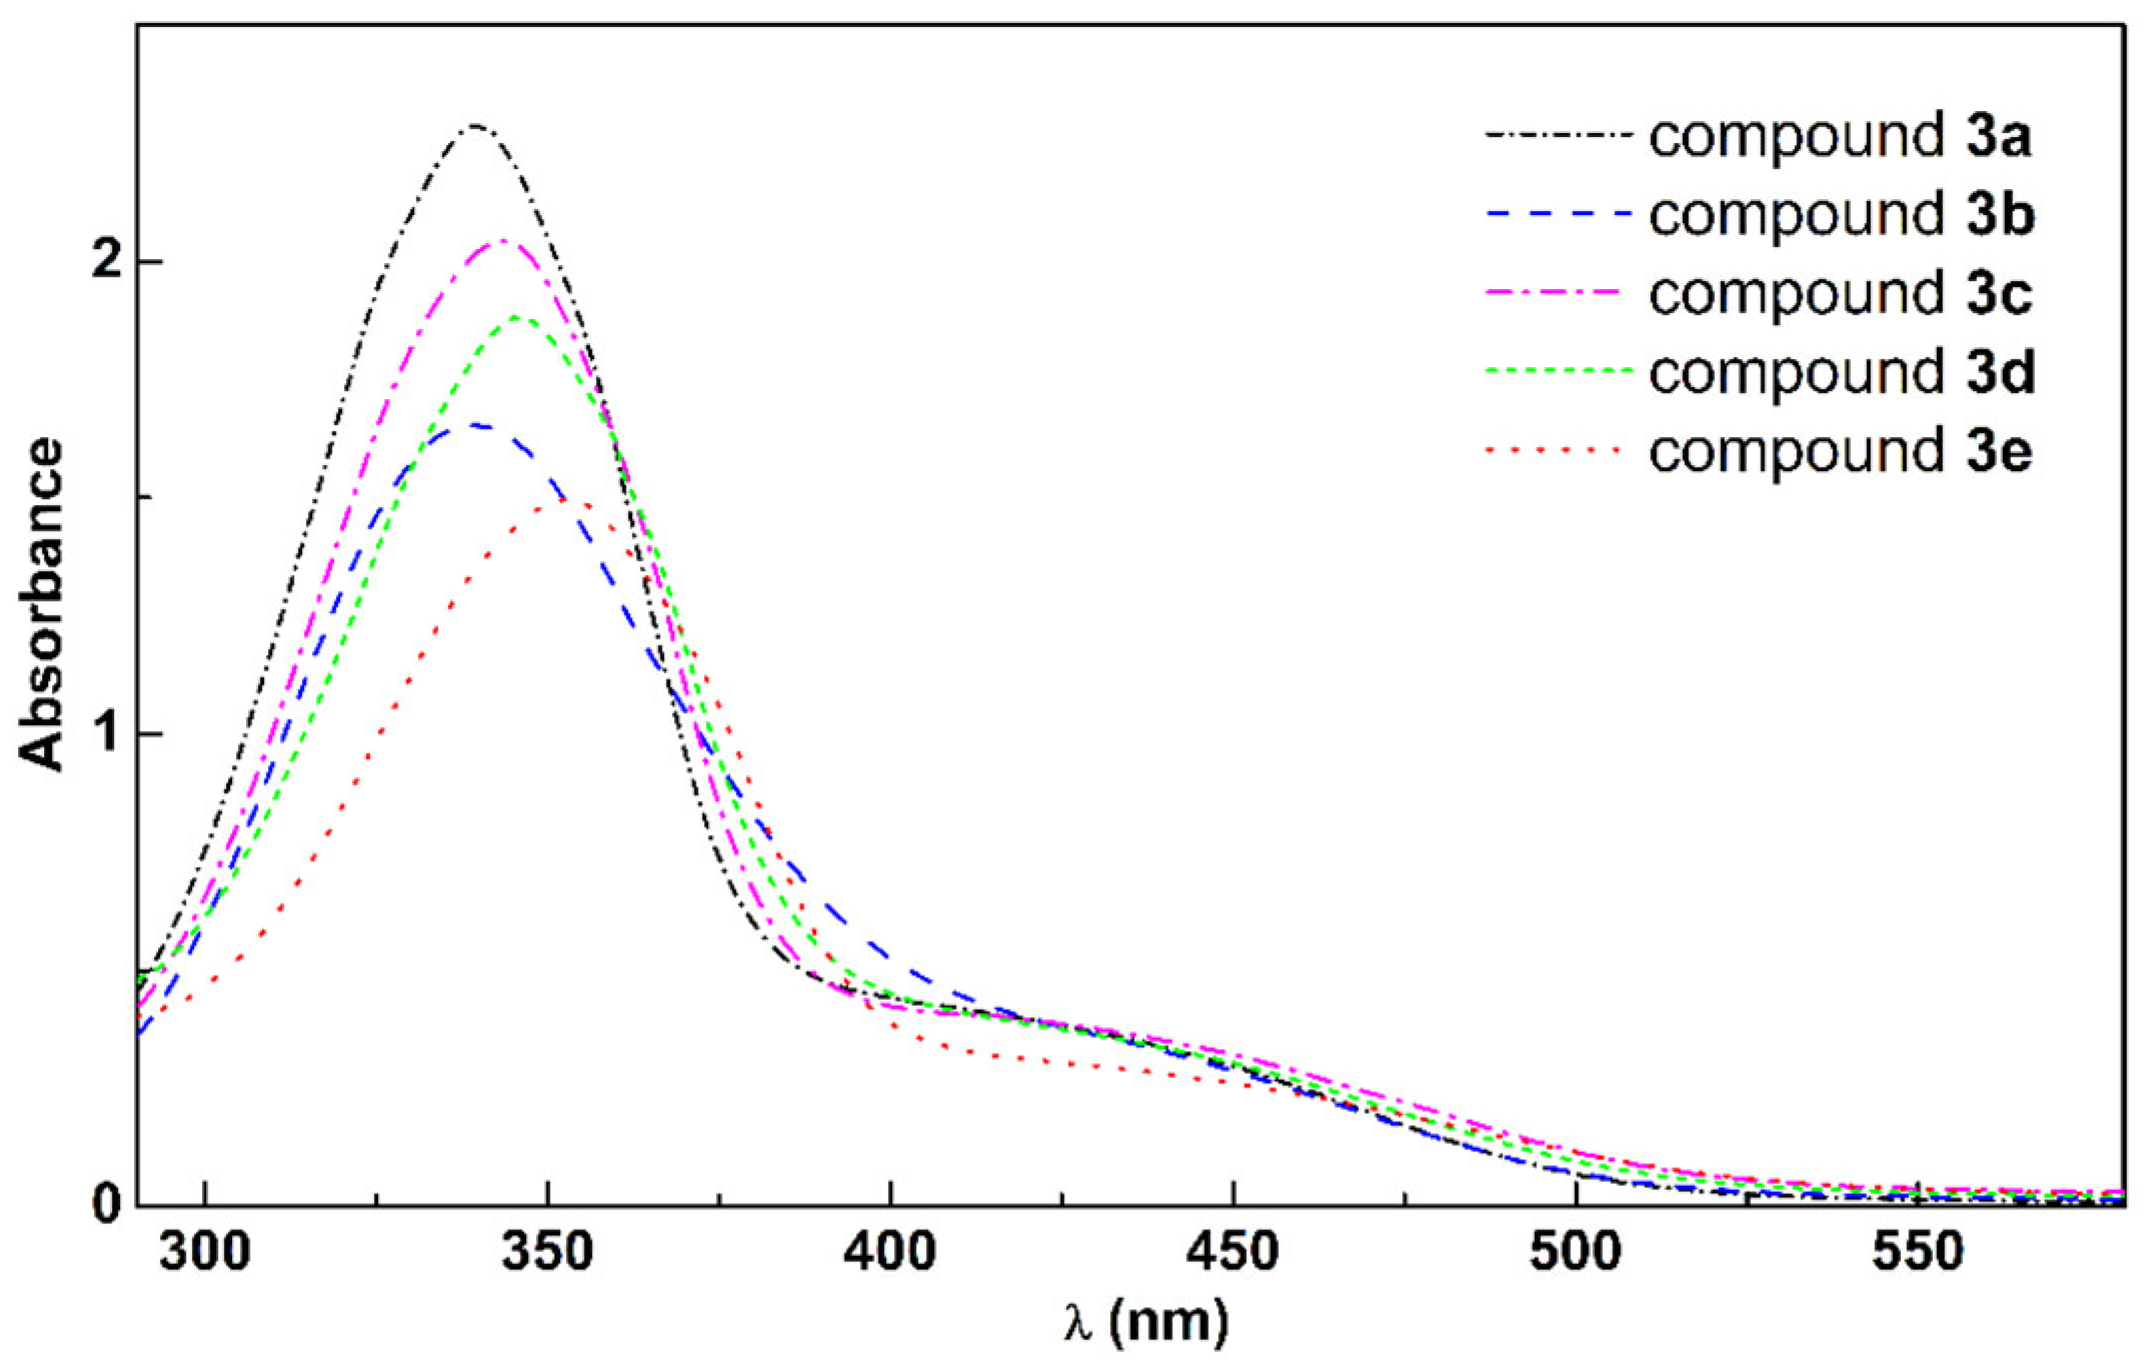
2.2. UV/Vis Absorption of the Eugenol Azo Dyes 3ae

The eugenol derivatives 3ae exhibit absorption in the UV/visible region, and their absorption spectra are illustrated in Figure 1, showing an intense absorption band in the UV range, at around 345 nm, and another band in the blue region, justifying the yellowish color. The strong red shift of the UV band relative to the eugenol UV/Vis absorption spectrum (maximum at ~280 nm) [32] points to an extended conjugation between the aromatic moieties, including the azo group. The band in the visible region is probably due to an n→π* transition involving N atoms.
The compounds were compared, and small variations are detected in the UV band position and intensity, reflecting the influence of the substituents in the phenyl ring linked to the azo moiety. Maximum absorption wavelengths (λmax) and molar absorption coefficients (ε) are indicated in Table 1. Compound 3a, with no substituents in the phenyl ring, display the highest absorption coefficient. Compound 3e, possessing two substituents in this ring (–Br and –COOH groups in the ortho position relative to each other), presents a lower absorption coefficient and a significant bathochromic shift, probably due to the extension of the conjugation of the aromatic ring to the carbonyl group of –COOH.
Ground state equilibrium geometries for cis and trans conformers of compound 3a, as well as its hydrazone tautomer, are shown in Figure 2, together with electron density variation upon excitation to the first excited state (Cartesian coordinates in Table S4 of Supplementary Materials). Vibrational analysis confirmed, through the absence of imaginary frequencies, that no metastable molecular geometries were obtained; this allowed us to place the free energies of the cis conformer and the hydrazone tautomer, respectively, at 19.5 kcal/mol and 1.83 kcal/mol above the trans form of compound 3a. This result predicts that 4.4% of compound 3a exists in its hydrazone form at room temperature (25 °C).
Table 2 shows the obtained transition wavelengths and oscillator strengths for the first eight excited states for both conformers and for the hydrazone tautomer. Considering the low oscillator strength for the first excited state and the electron density variations in Figure 2, it is possible to conclude that, in both cis and trans conformers, the first electronic transition is mainly of the n→π* type, as a decrease occurs along the azo backbone and an increase occurs in the π electron system above the molecular plane. The cis conformer shows higher oscillator strength as non-planarity results in a better overlap between n and π* molecular orbitals. The hydrazone tautomer, which is planar like the azo tautomer, clearly shows a π→π* transition, corresponding to a higher oscillator strength. Comparing the experimental spectrum (Figure 1) in the region above 440 nm with the oscillator strengths in Table 2 (7.4 × 10⁻⁴ for the trans conformer vs. 0.049 and 0.13 for the tautomer), it is possible to conclude that the absorption spectrum mainly corresponds to the trans conformer, as expected from its lower free energy.
Prediction of the absorption spectral shape requires vibrational analysis of both ground and excited states in their equilibrium geometries. The geometry optimization of the first excited state resulted in a very high geometry variation, so that the S0 → S1 energy difference became very small (~1 eV). Thus, a simplified method was used, in which each electronic transition is considered to be a Gaussian function in wavenumber, with a fixed standard deviation corresponding to 0.4 eV (3226 cm−1). In Figure 3, a reasonable accordance is shown between the predicted spectrum and the experimental one, although the molar absorptivity of the S0 → S2 band is lower than the experimental value. The higher absorptivity in that region could be due to the contribution of the hydrazone tautomer that has a significant molar absorptivity in that spectral region.

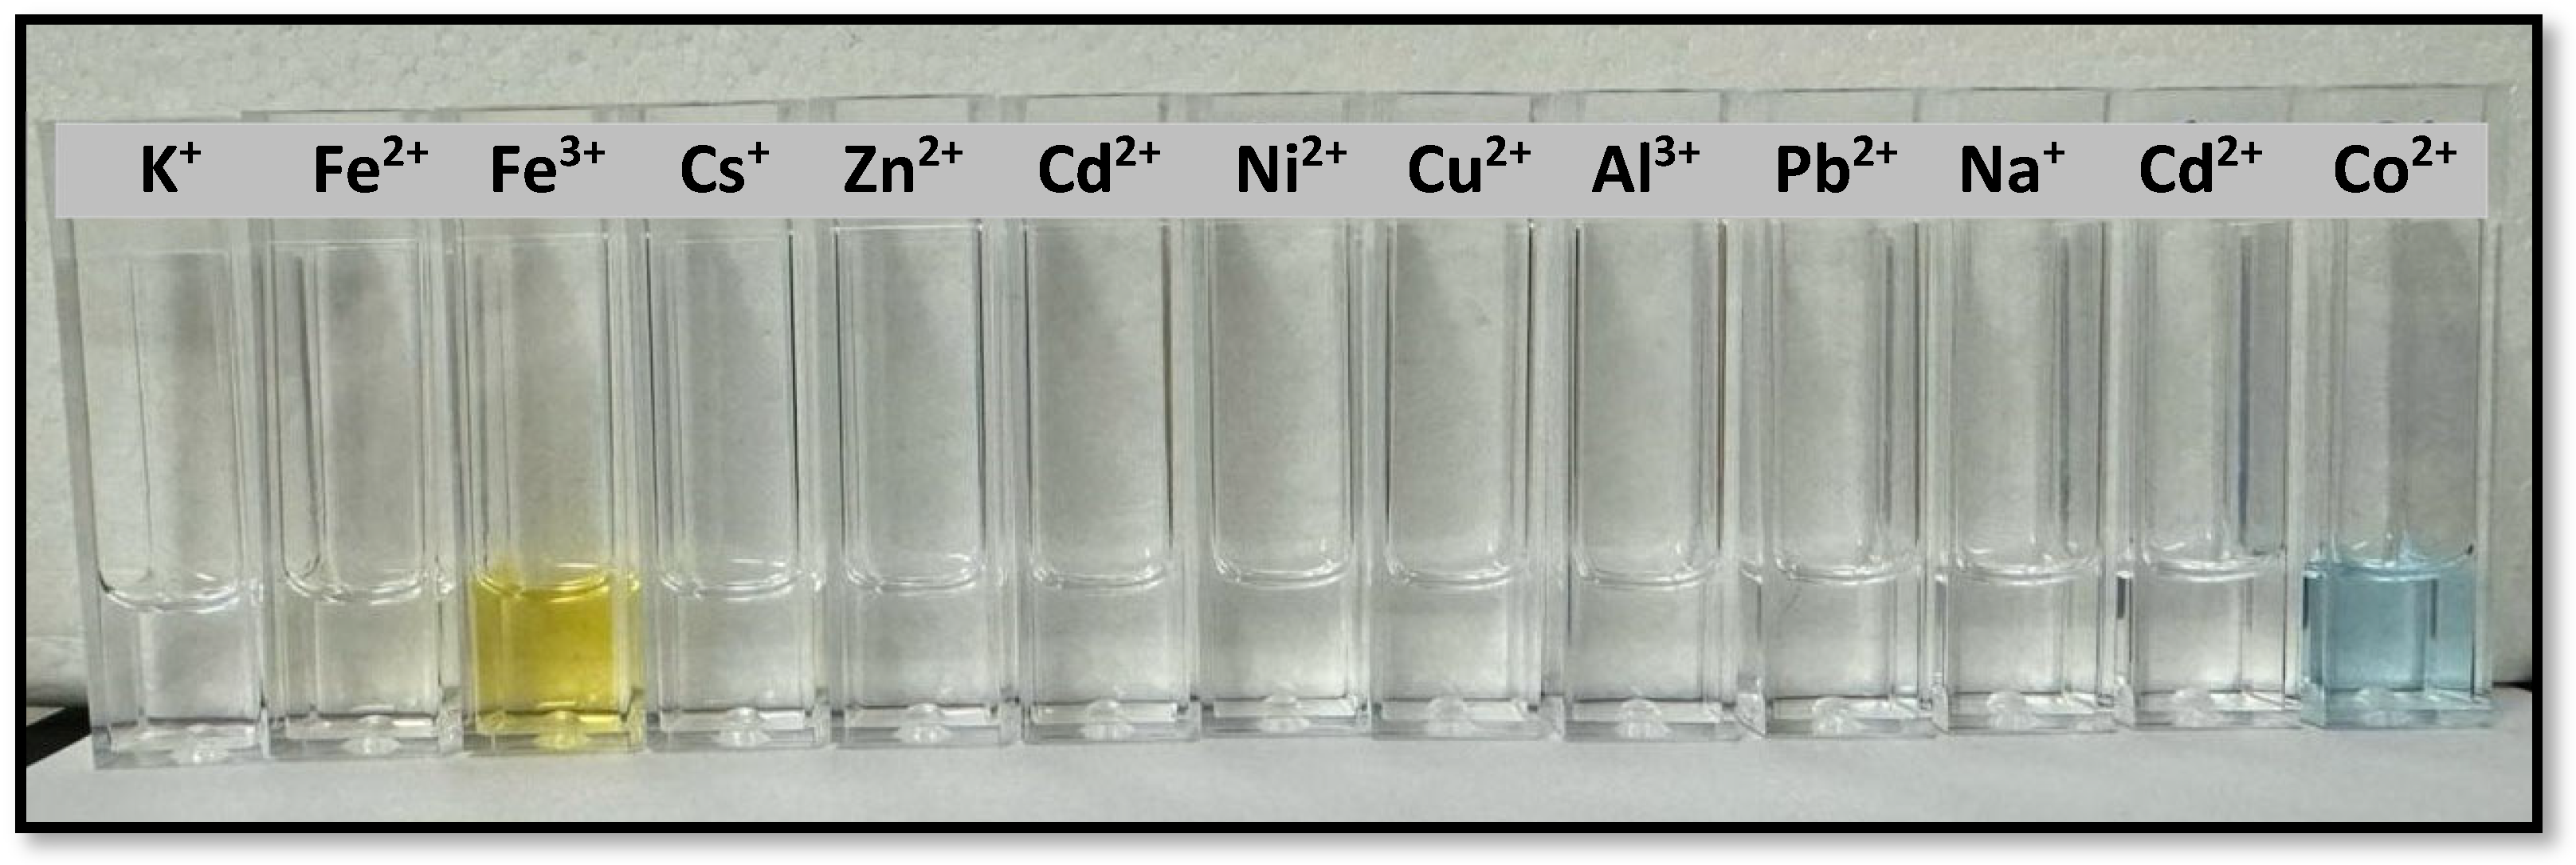
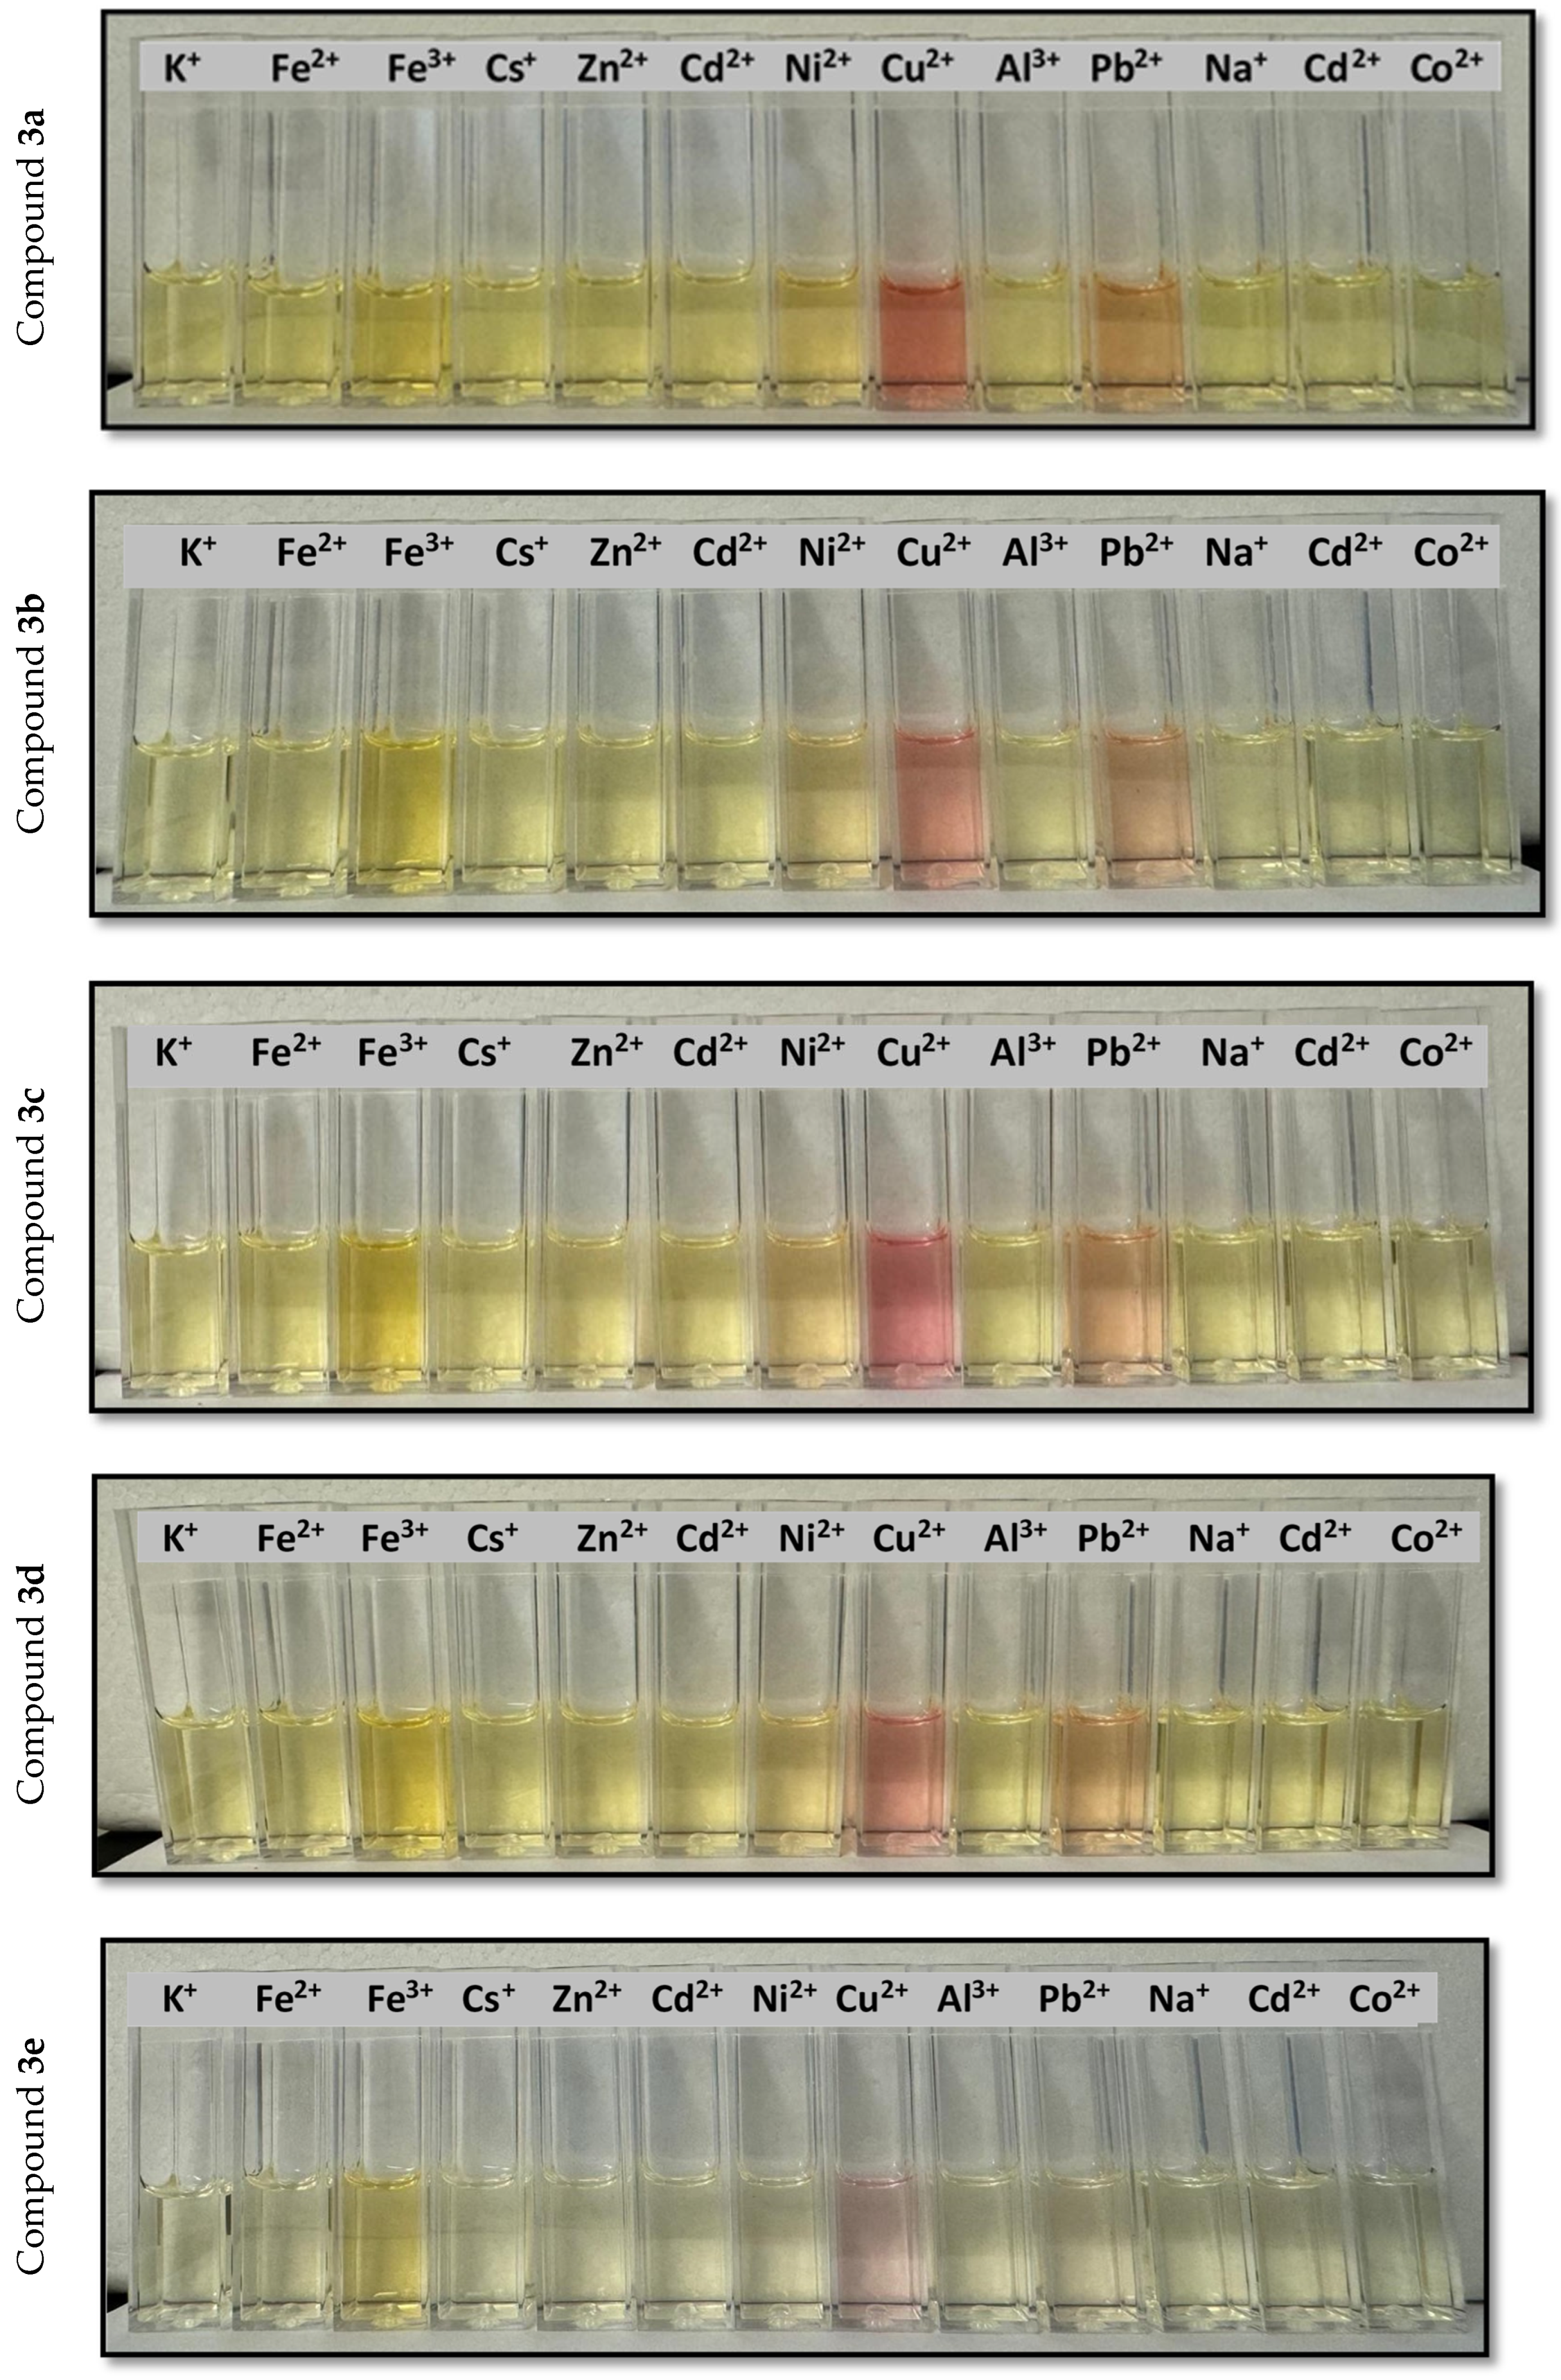
2.3. Colorimetric Assays of Compounds 3ae as Ion Sensors

The compounds 3ae were preliminary tested as sensors for several cations in order to obtain a colorimetric assay, which is especially useful for detecting pollutants and poisoning metals. The cations (15 equiv.) were added to compounds’ solutions, and the colors were compared between the neat cation solutions and the compound/cation solutions (Figure 4 and Figure 5).
Considering the objective of obtaining a colorimetric assay for the detection of cations, we find, in Figure 5, evidence that the compounds can be useful for the detection of copper(II) and lead(II), which display a clear change in color, despite compound 3e seeming not useful for this determination.
Particularly, compound 3c seems to be the most useful for Cu2+, demonstrating a clearly distinguishable and intense pink color in the presence of this cation. This color change can be observed at concentrations as low as 10 µM of cations, while for the other compounds, higher cation concentrations are needed. Here, the possibility of the detection of Pb2+ is especially valuable, because lead is described as a poison that can affect a large number of organs in human body. Therefore, the five compounds’ solutions were titrated with lead(II) cations.

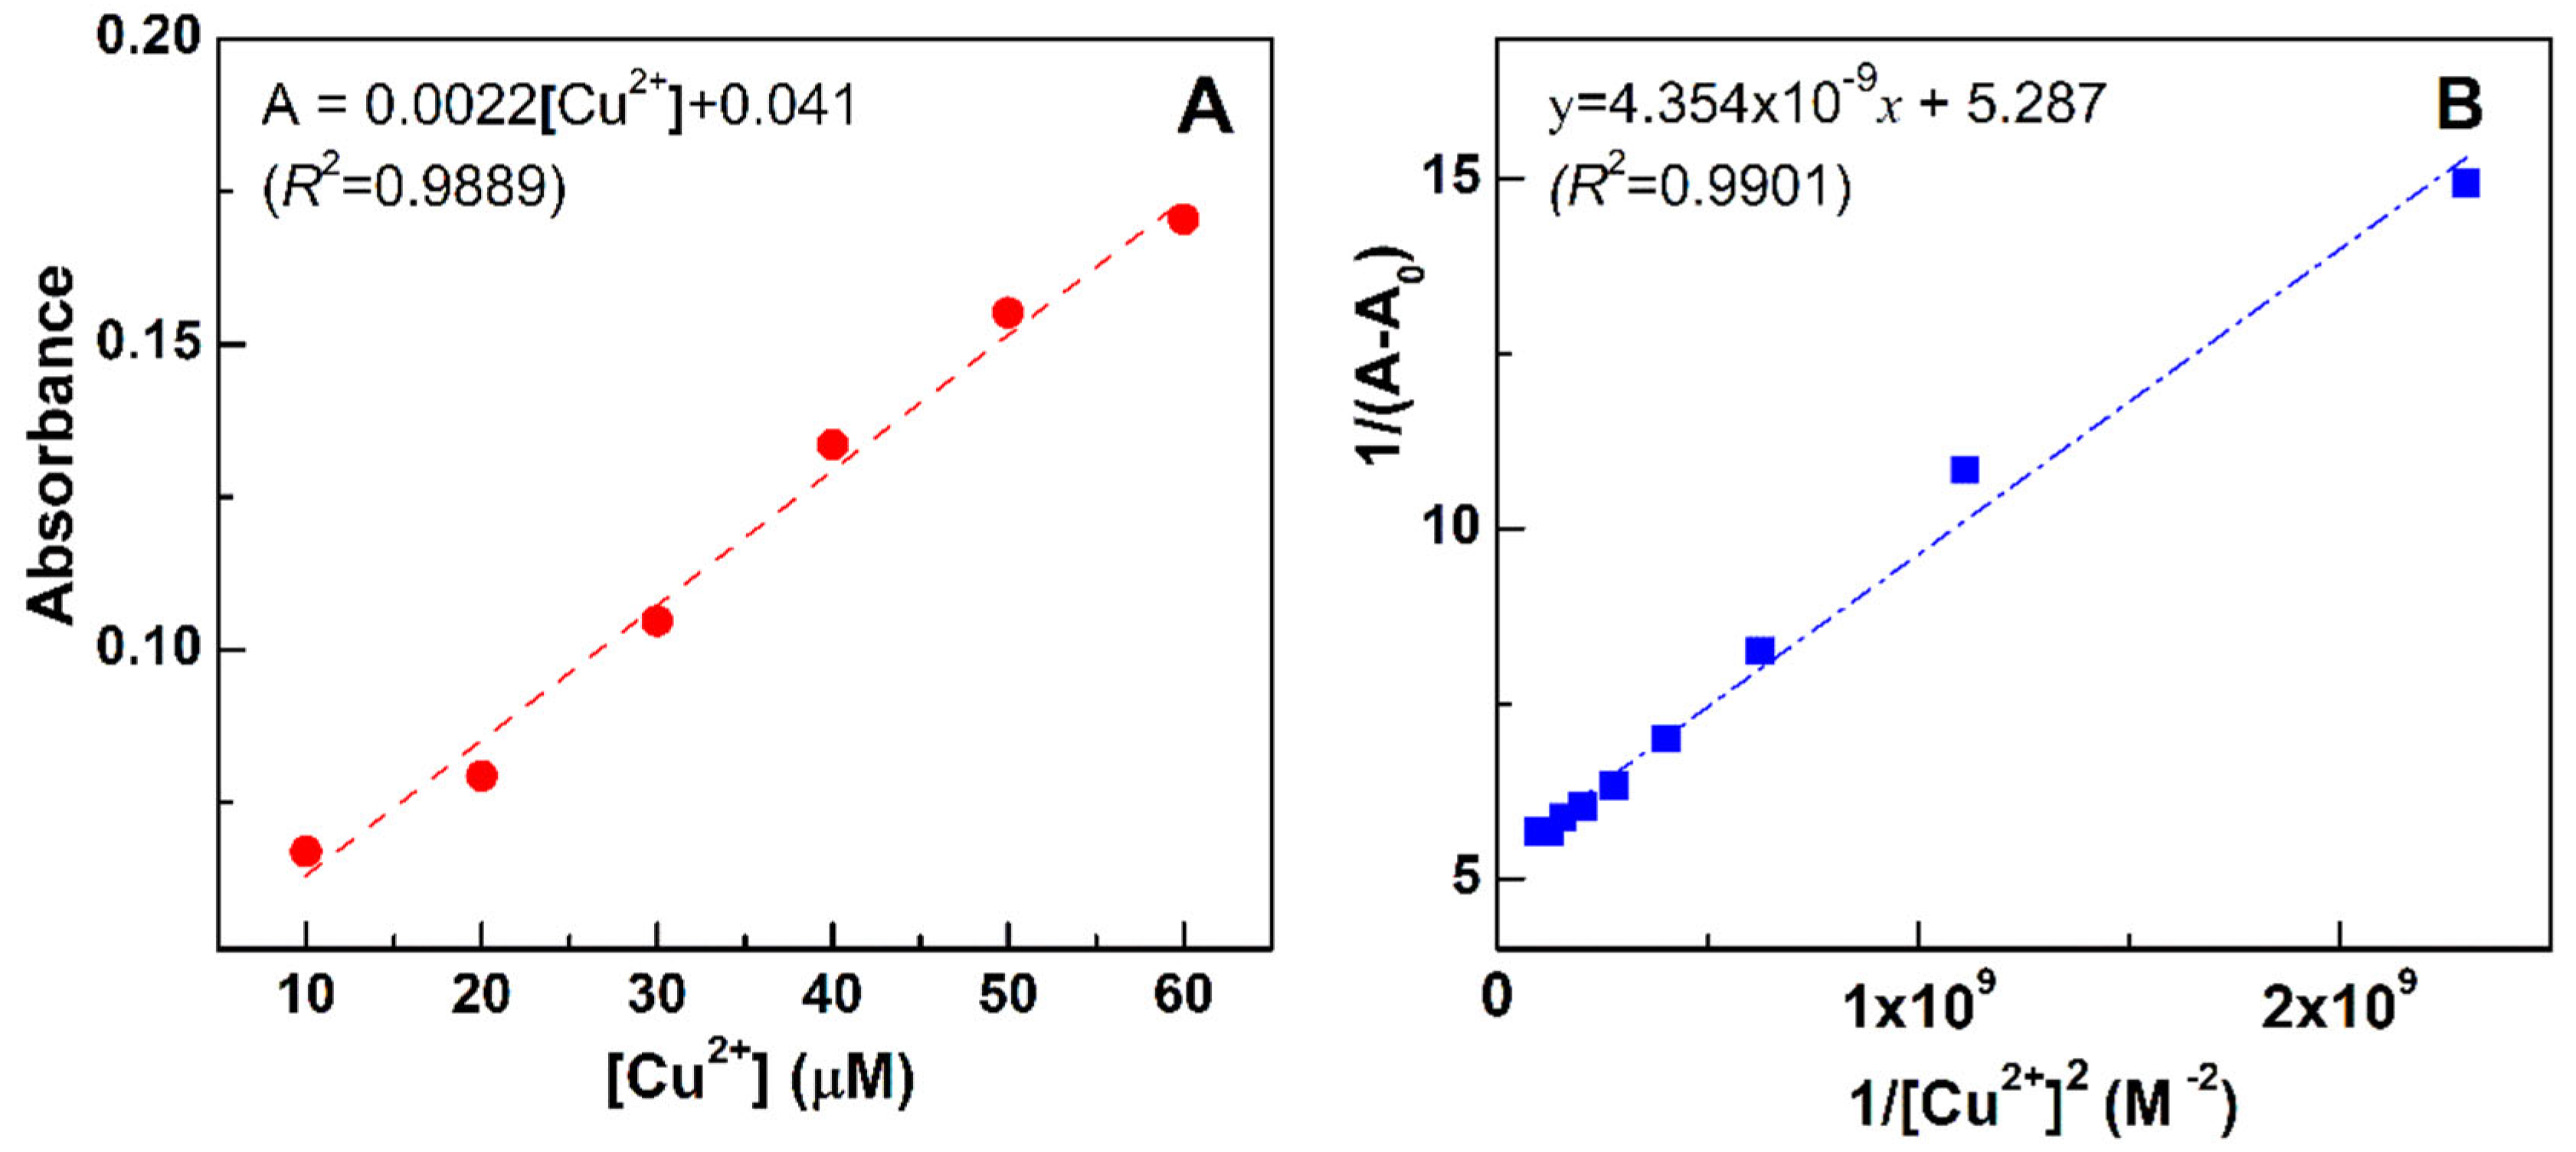
2.4. Titration of Compound 3c with Cu2+
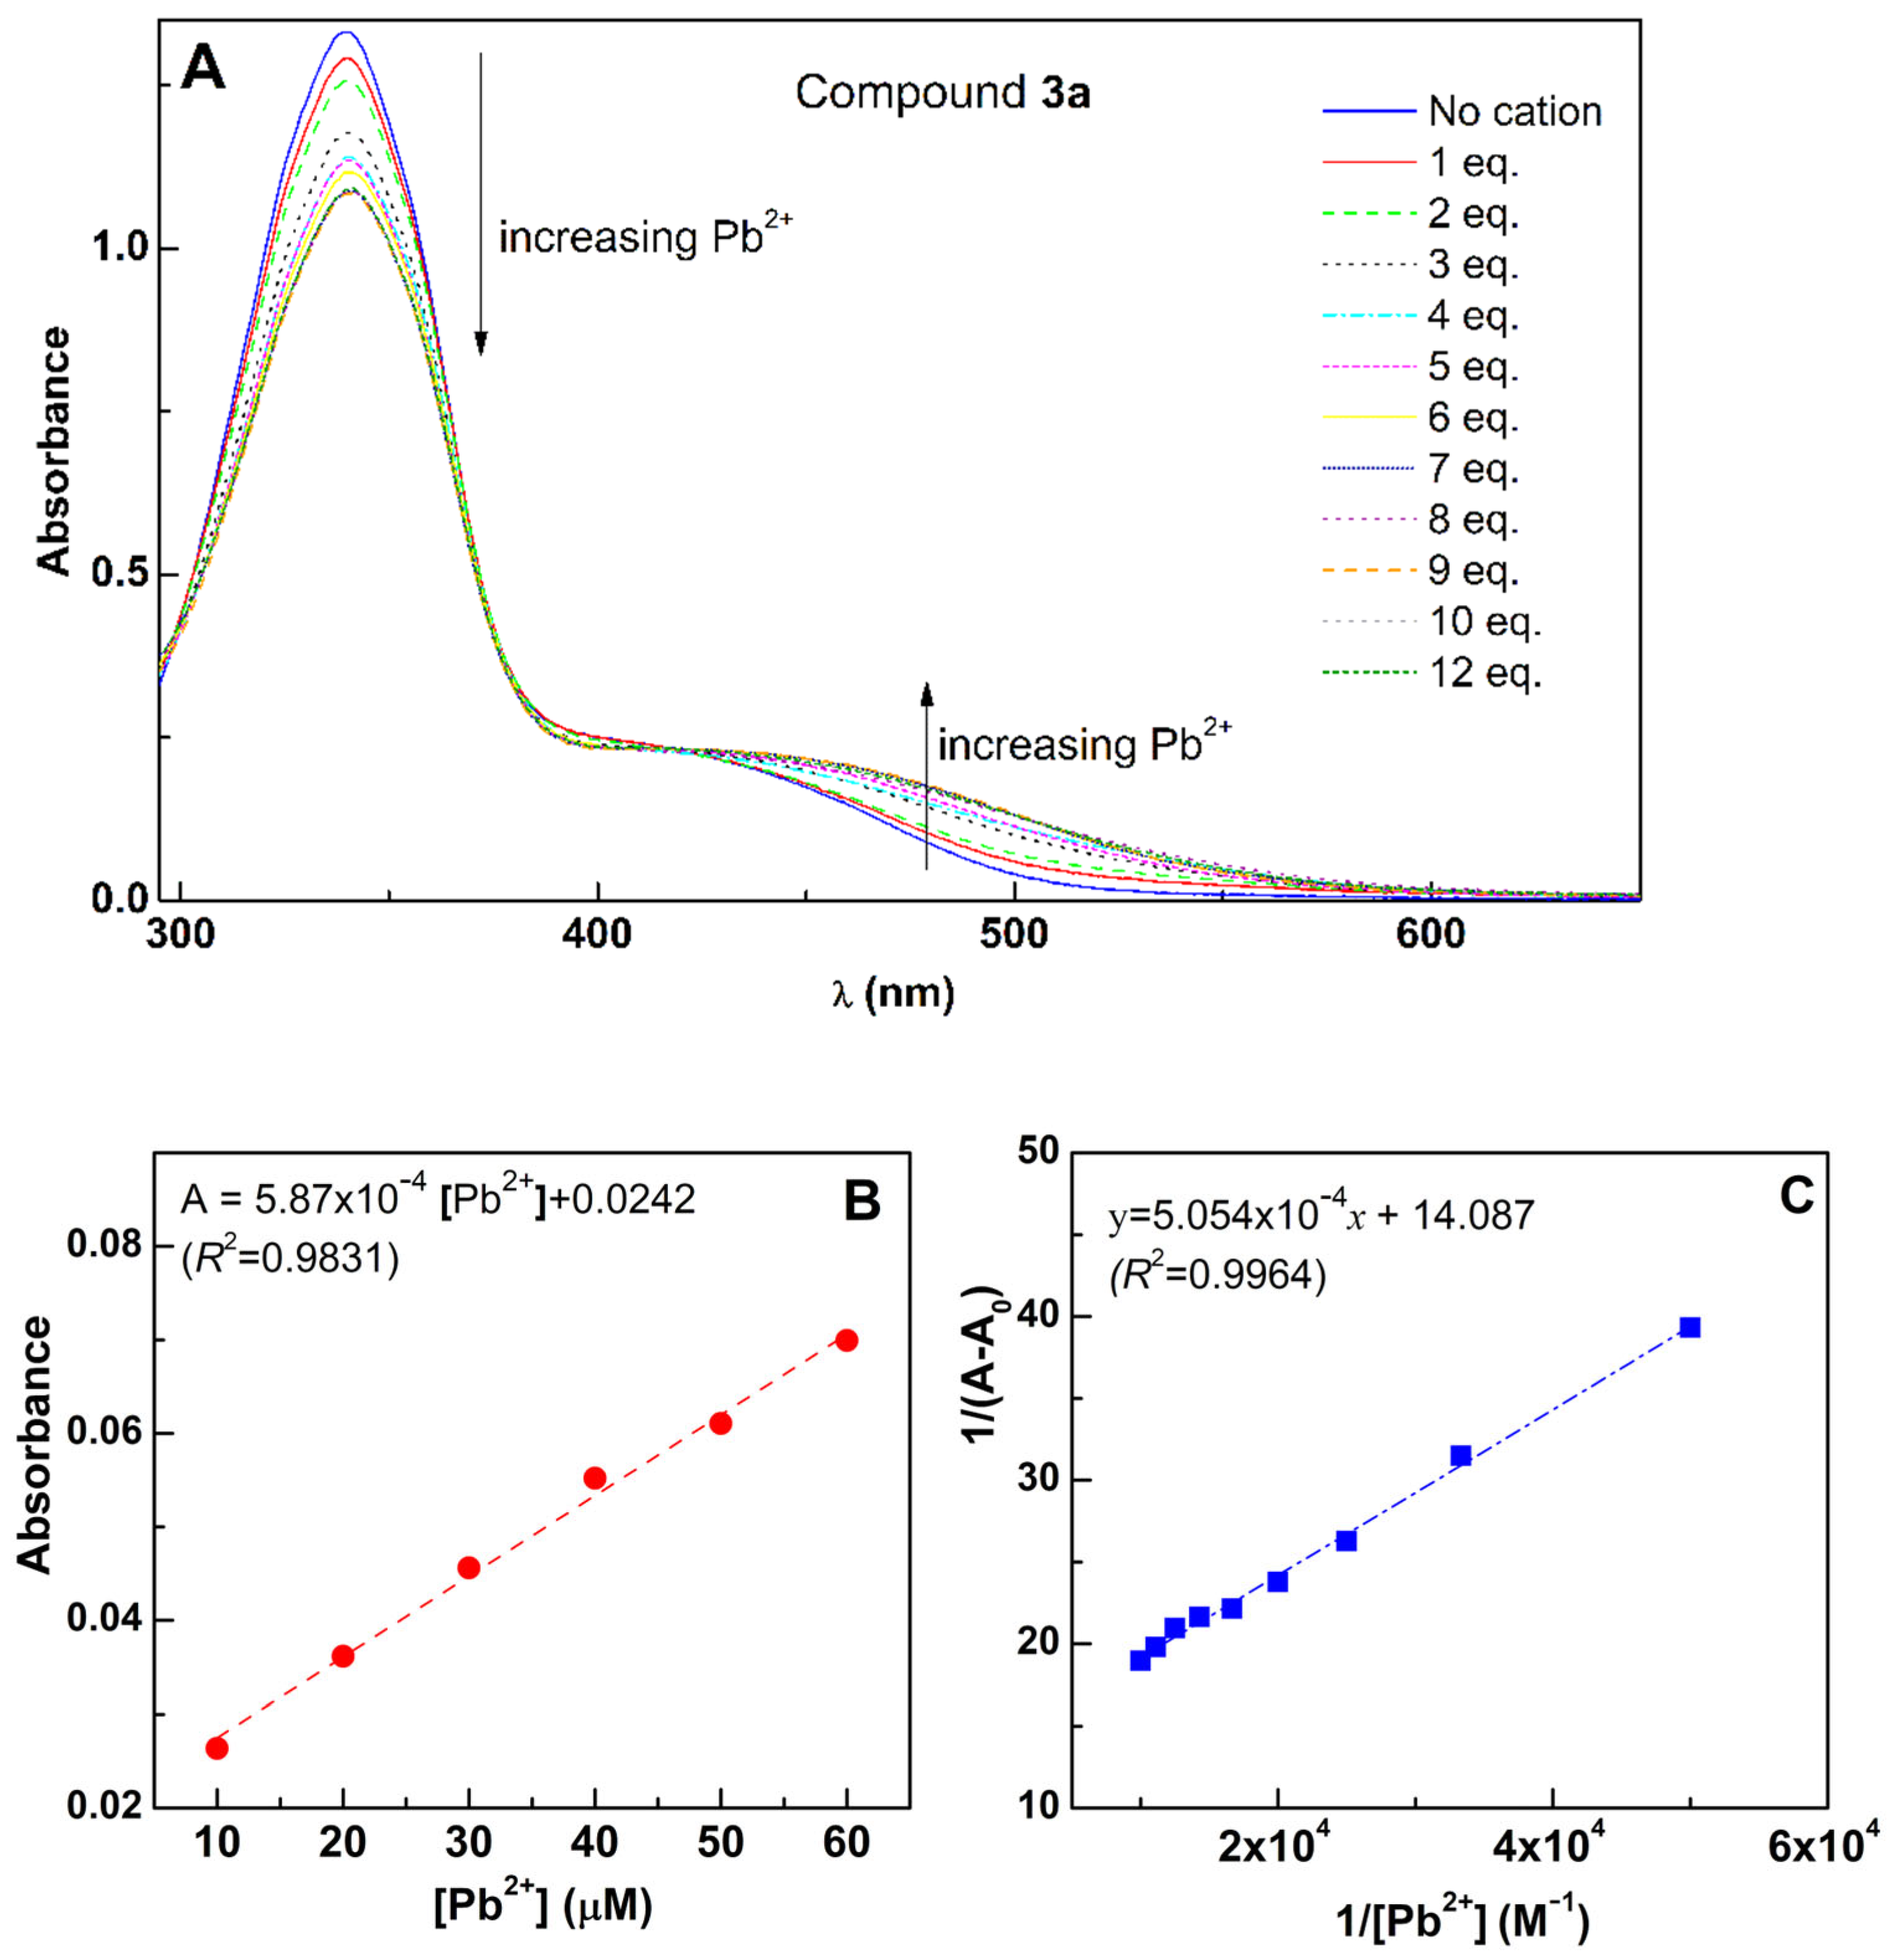
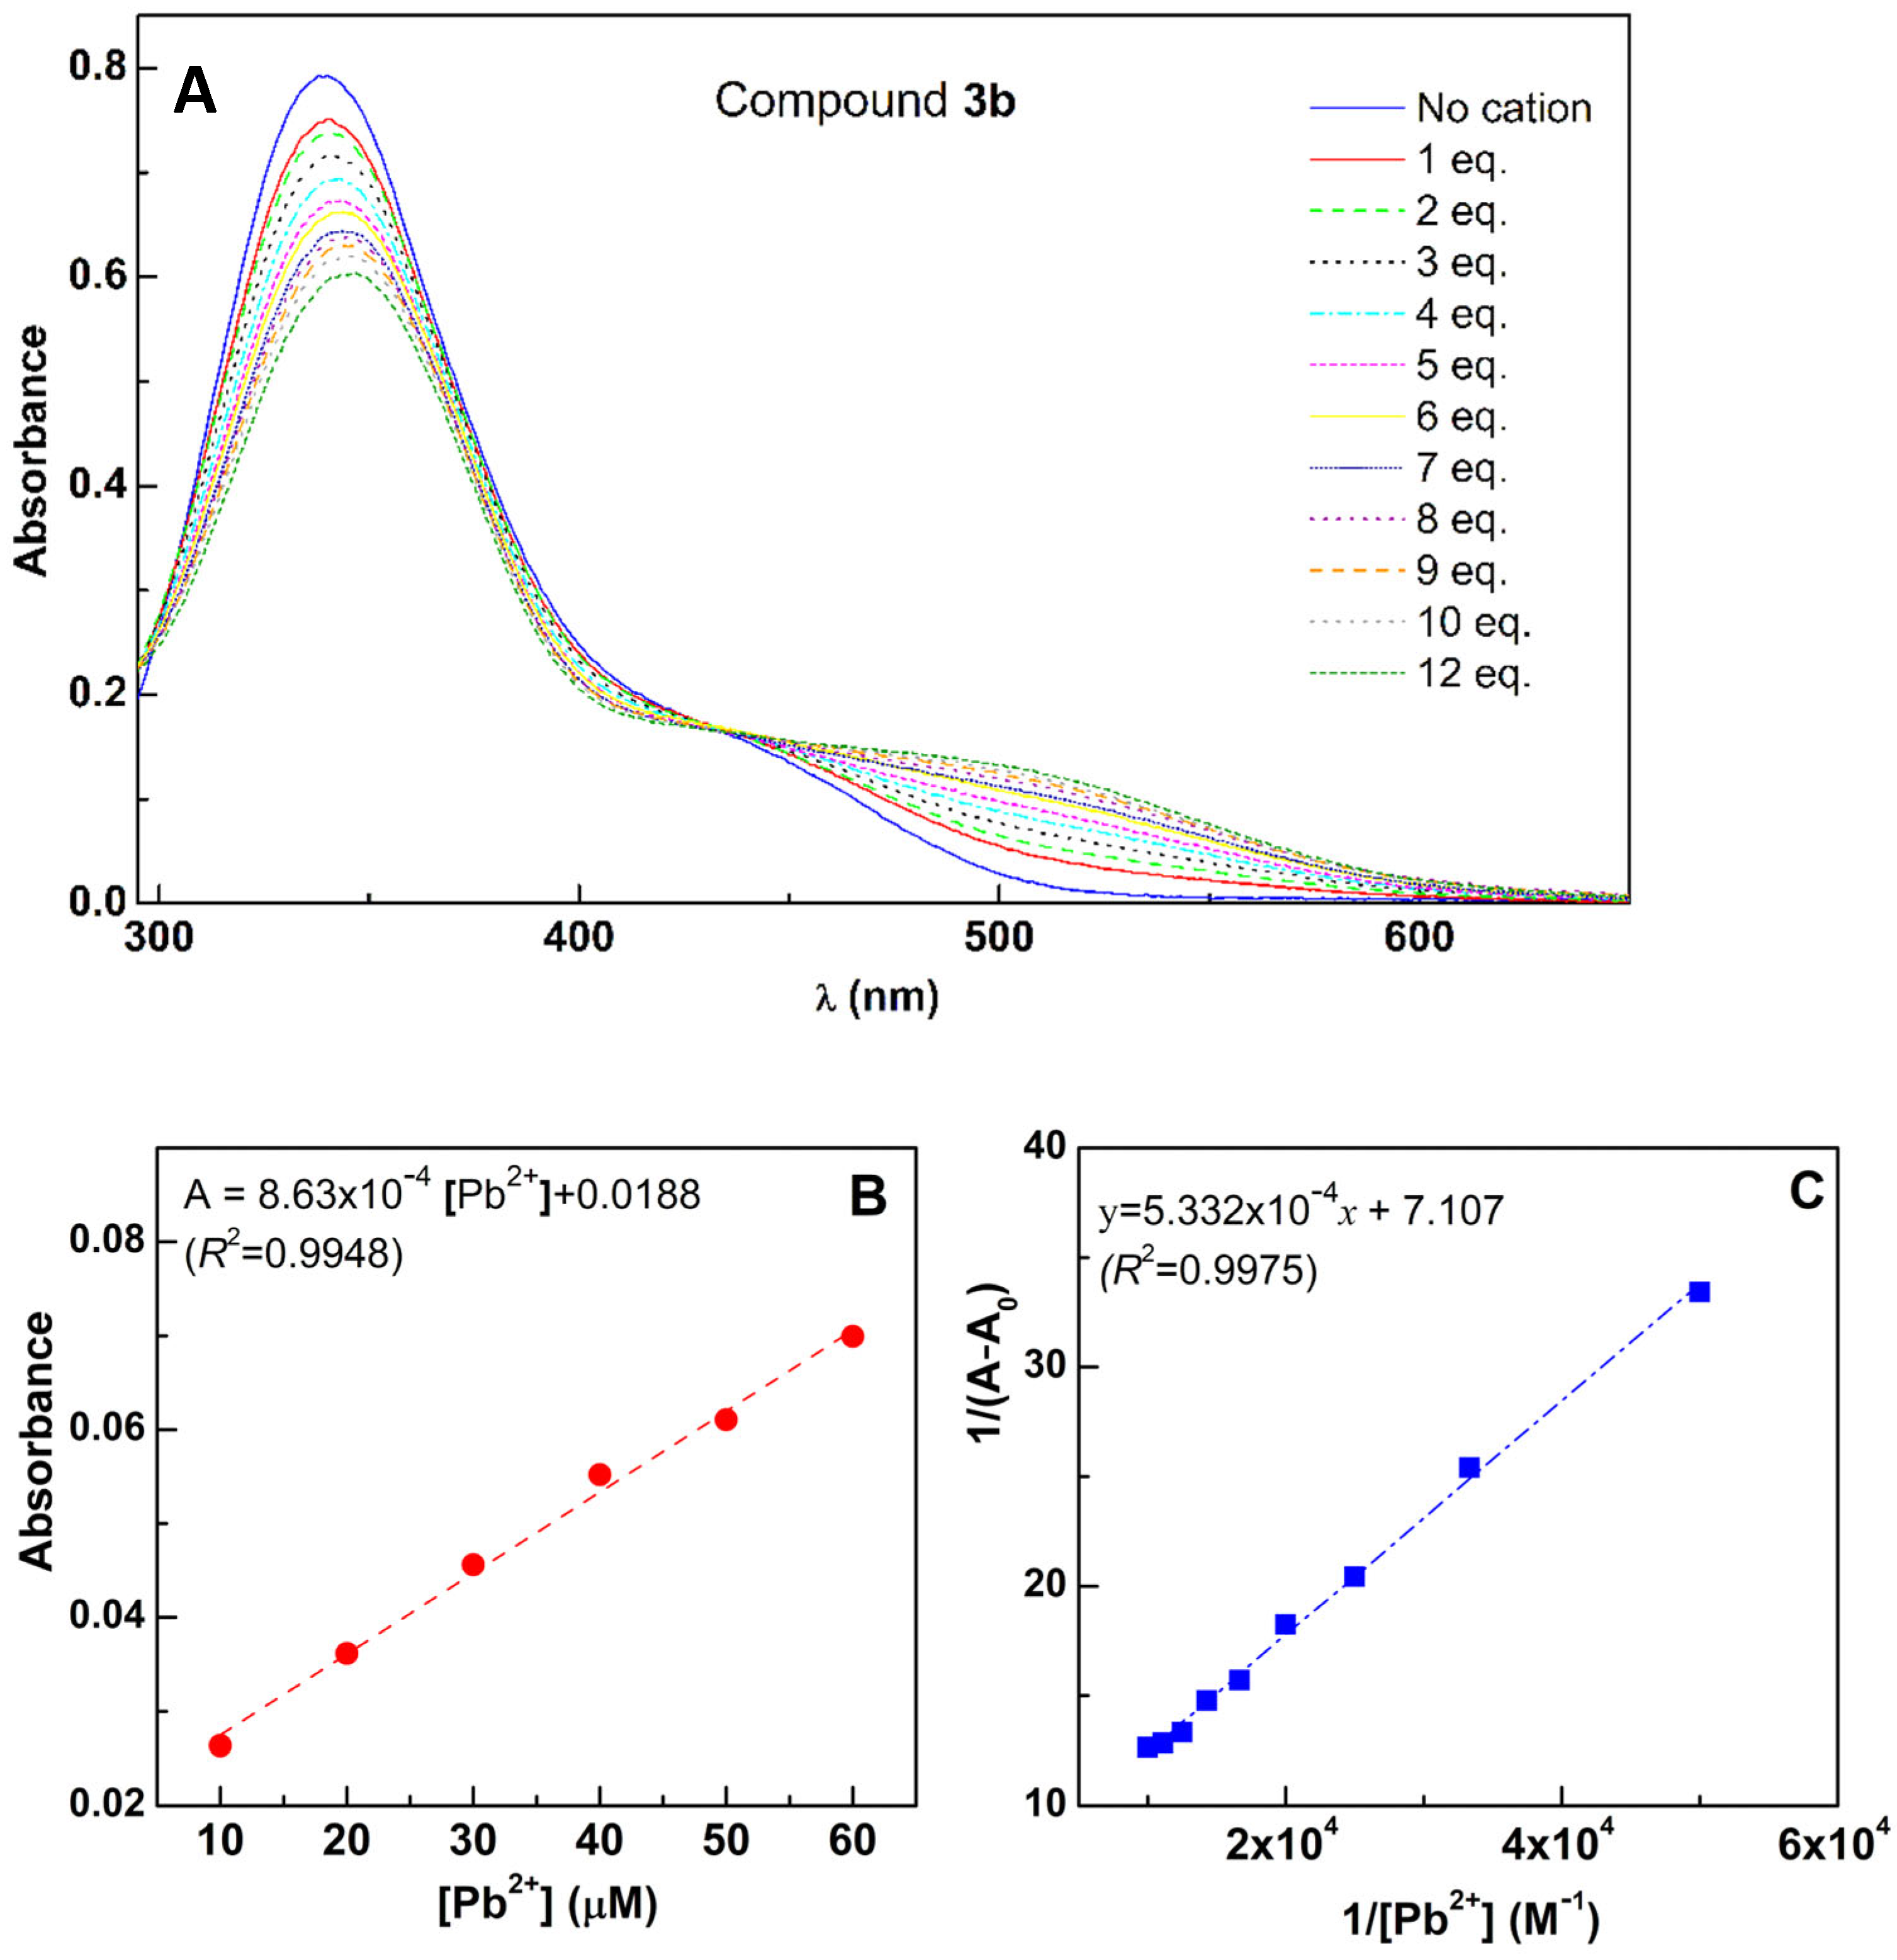
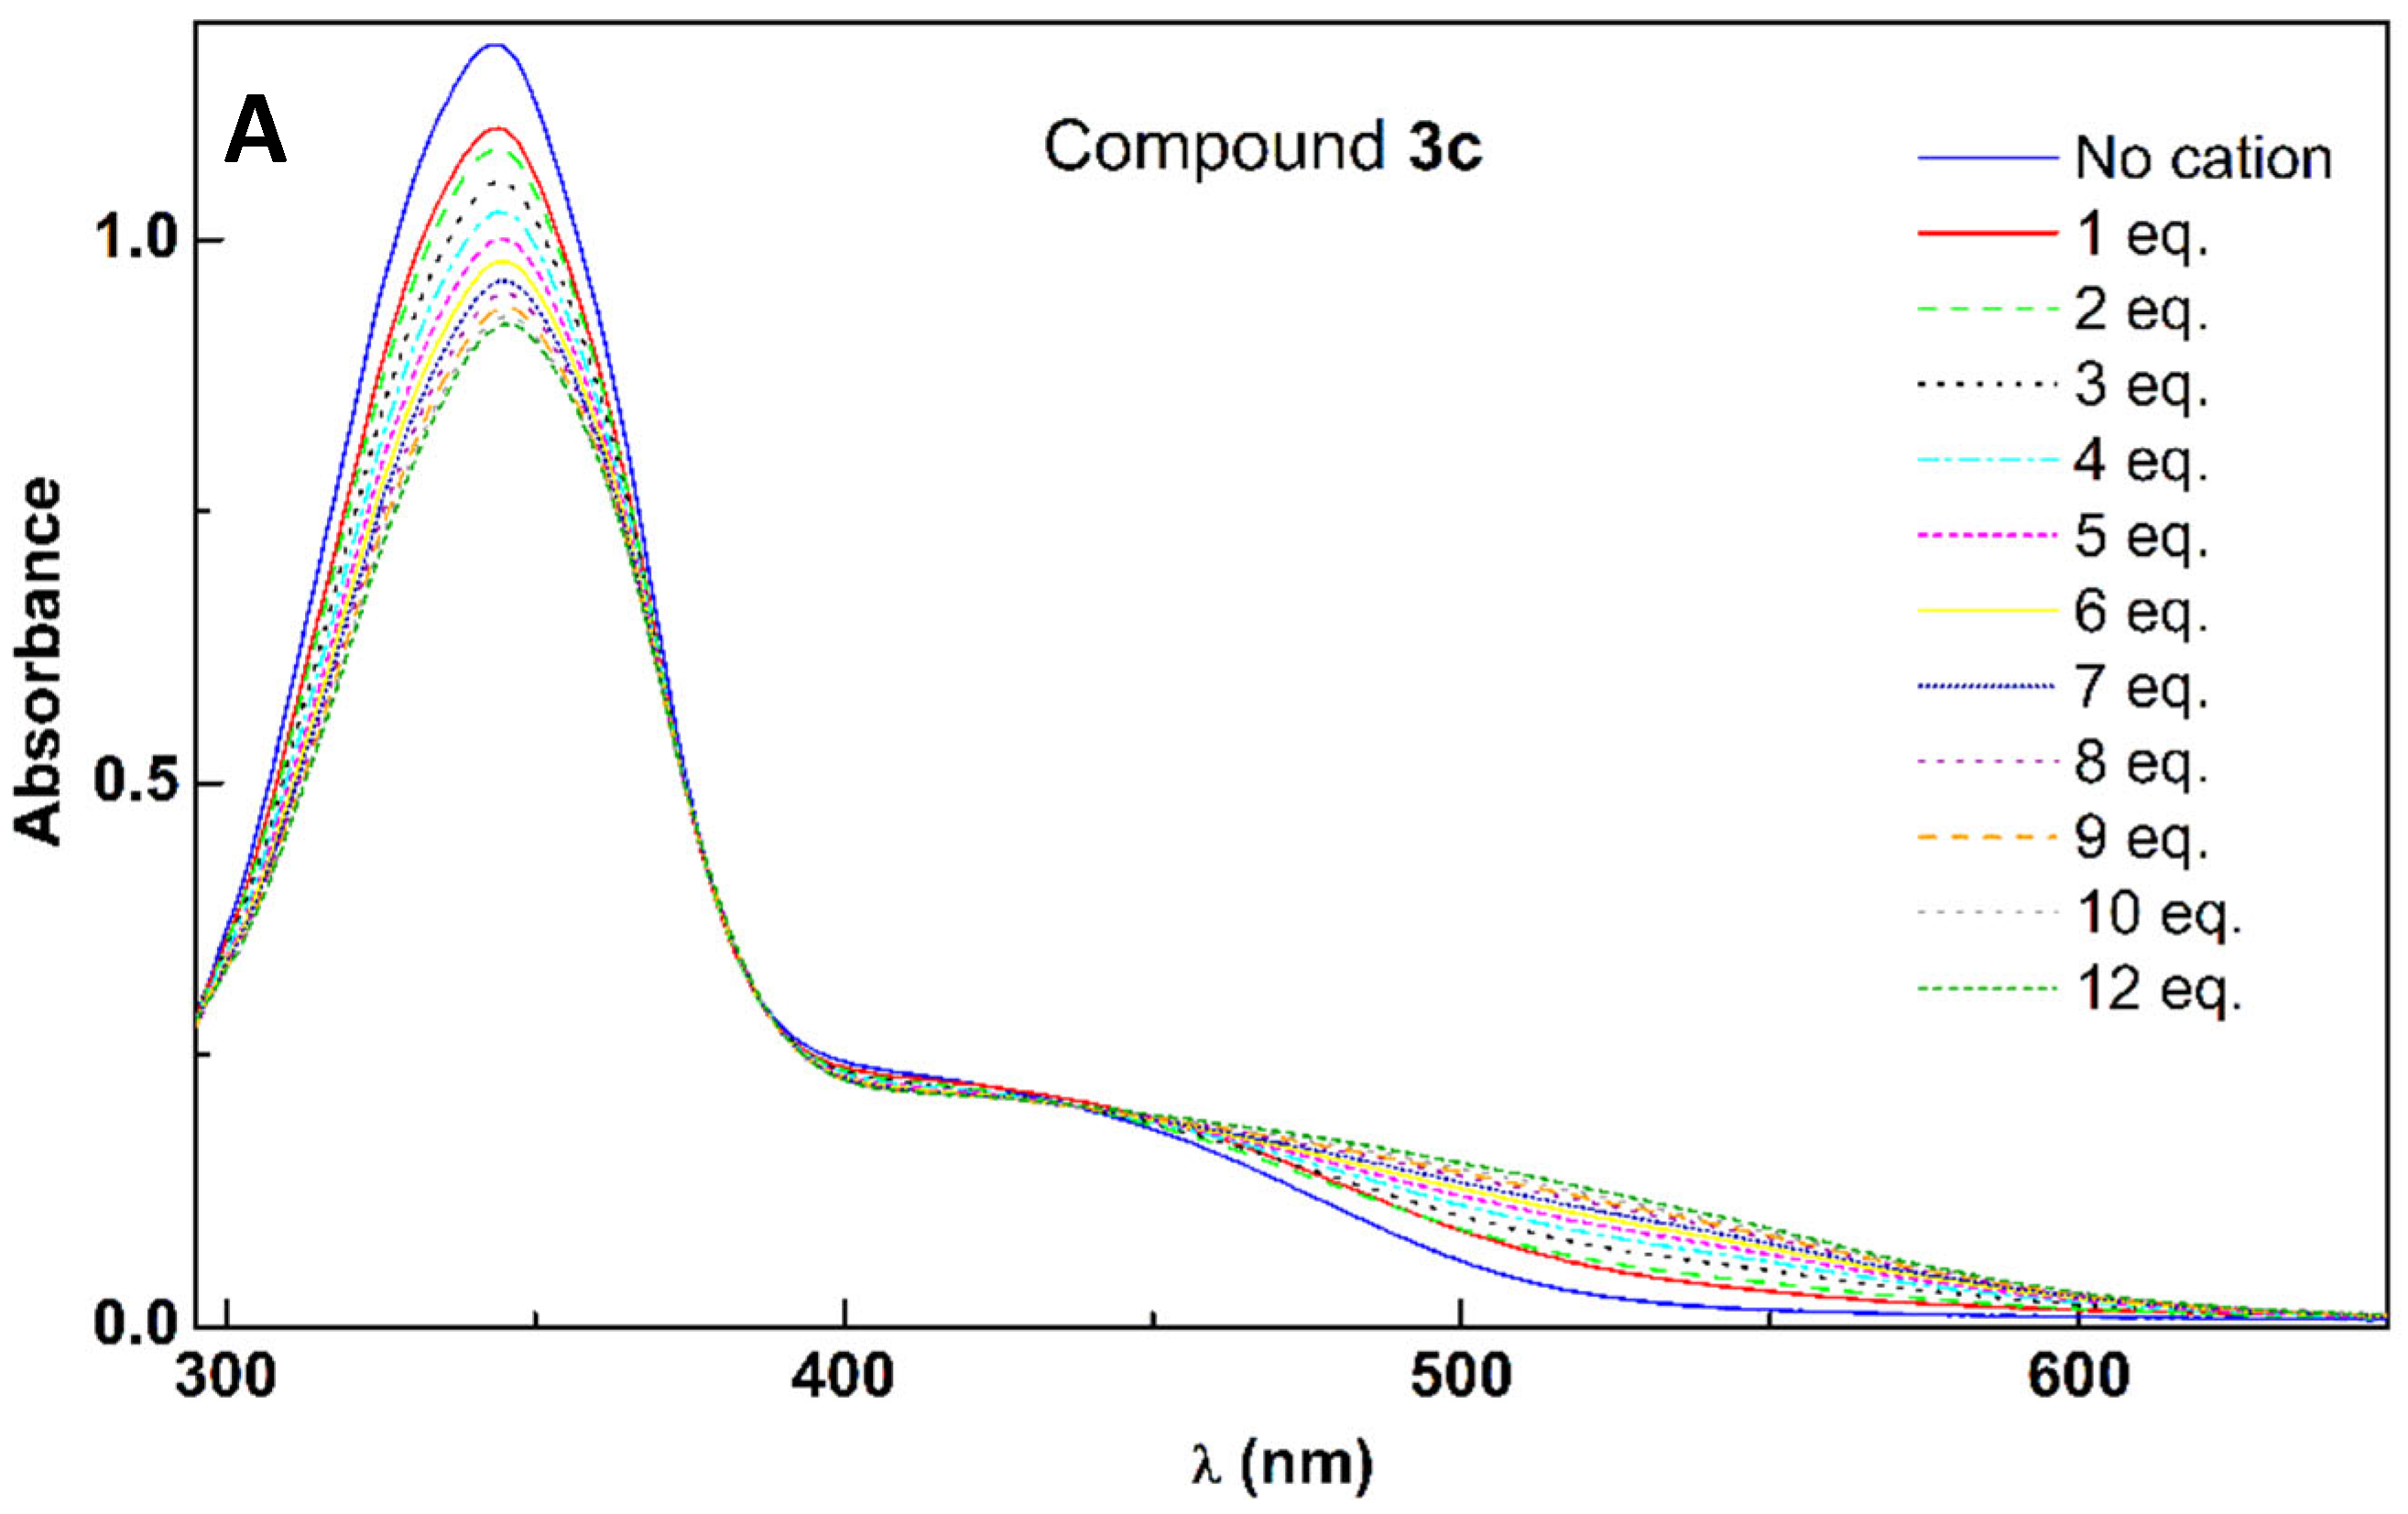
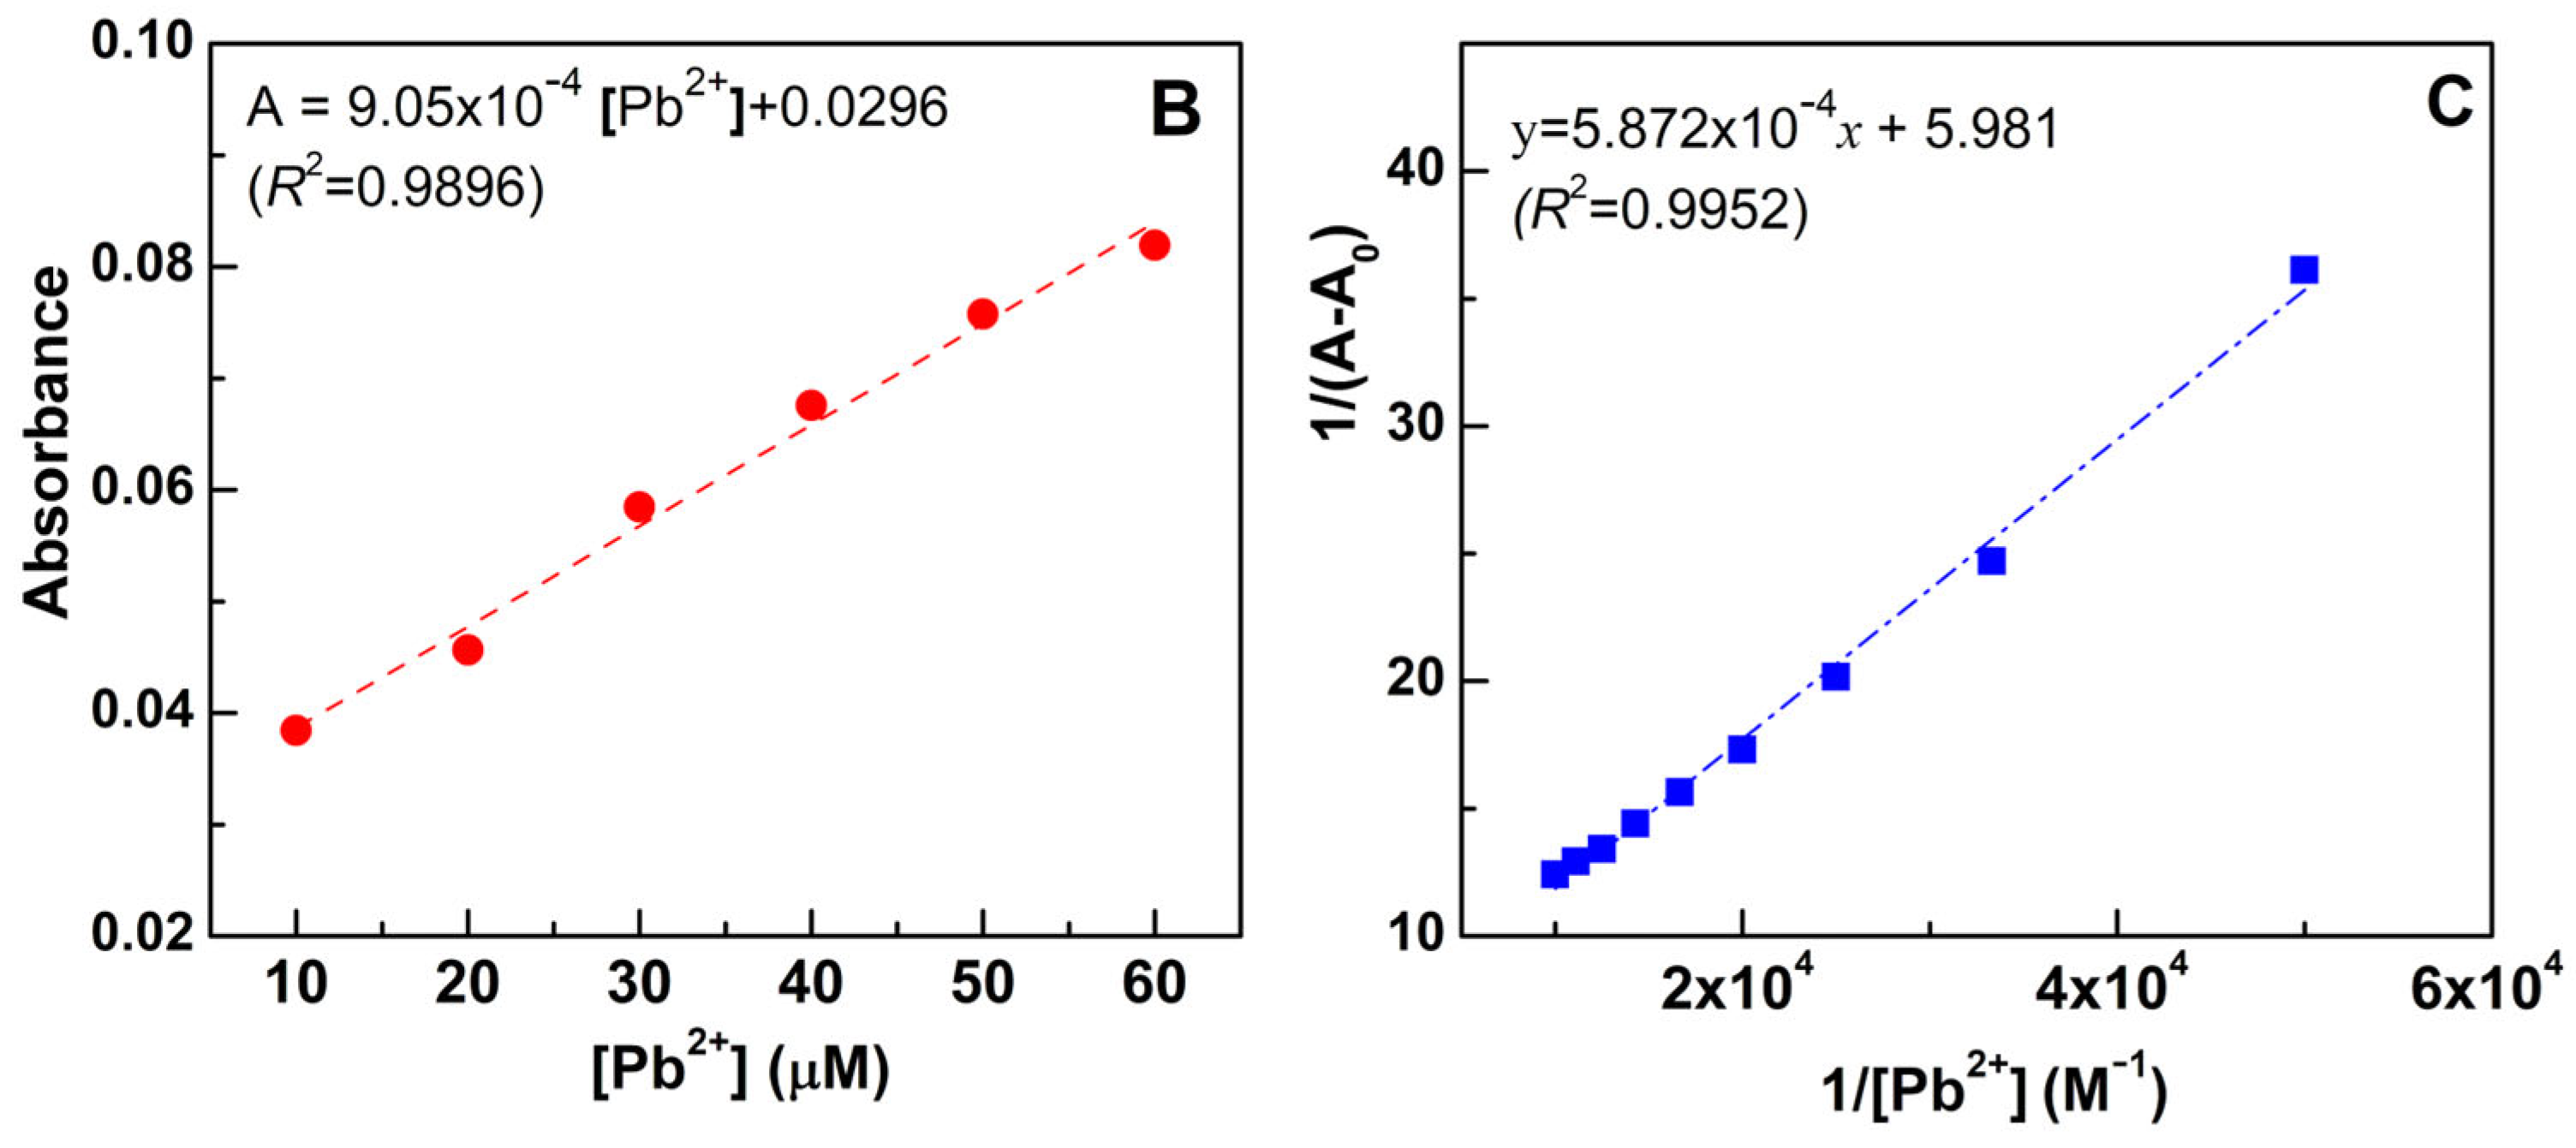
Spectrophotometric titrations in ethanol were performed to further investigate the ability of compound 3c to detect copper(II) ion. Therefore, increasing amounts of the cation were added to the compound solution, and the corresponding absorption spectra were obtained. A new absorption band, centered at around 530 nm, is observed (Figure 6), the maximum absorption of this band being attained at 10 equivalents of the cation, pointing to a high sensitivity. The presence of three clear isosbestic points indicates a complex interaction between the compound and Cu2+.
In these results, a linear relationship between the cation concentration and the absorbance of the new band at 540 nm (where the absorption of the neat compound is negligible) was observed up to 60 µM of cations (Figure 7A). From this plot, a limit of detection (LOD) as low as 0.16 µM was estimated. This value shows that compound 3c can be very useful for the detection of Cu2+ in effluents and other samples, considering that the maximum level of copper in drinking water is 20.5 µM (WHO, 2008 [33]), well above the LOD and in the linear range of the calibration curve (Figure 7A). Moreover, the average concentration of copper in blood should not exceed 15.7–23.6 μM in normal conditions [34], also in the detectable range. This LOD value is lower than the ones reported for other sensors of copper(II) [35,36,37], making compound 3c highly advantageous for this purpose.
To calculate the binding constant, the Benesi–Hildebrand equation was used, the Ka value being determined from the ratio of the intercept to the slope of the Benesi–Hildebrand plot (Figure 7B). A linear relationship was obtained only for n = 2 (while for n = 1, the plot is not linear), indicating a binding stoichiometry of 1:2 between the compound and the copper (II) cation, with a corresponding binding constant of Ka = 1.21 × 10⁹ M−2. Azo dyes based on eugenol (without the substituents R, R1, and R2) incorporated in silicone films have also shown the capability to detect Cu2+ metal ions, represented by a change in color of the film, similarly exhibiting a 1:2 stoichiometry [38].

2.5. Titration of Compounds 3ae with Pb2+

Considering the proof-of-concept obtained with copper(II) cations, having a low LOD value, we explored the possibility of the synthesized compounds acting as lead(II) sensors. For this purpose, each of the compounds 3ae was titrated with lead(II), taking into account the significant harmful environmental and health effects from high concentrations of lead [39]. Lead exposure can have serious consequences for health, especially with children. The WHO has established “International Lead Poisoning Prevention Week” (every year in October) to prevent childhood lead exposure and to stop the use of lead in paint [40].
As predicted by the less prominent variation in color upon Pb2+ addition (comparing with copper), the spectral effects of the presence of the ion are much less pronounced, compound 3e not being sensitive to the presence of Pb2+ in the titration (as inferred from the color invariance in Figure 5). Moreover, the titration of compound 3d also shows very small spectral changes with the addition of lead cations. Therefore, the titration of compounds 3a, 3b, and 3c with Pb2+ were analyzed to determine the binding constants and LOD values (Figure 8, Figure 9 and Figure 10). The parameters for the interaction of each compound, 3a–c, with lead cations are summarized in Table 3. It must be pointed out that for compounds 3a, 3b, and 3c, the Benesi–Hildebrand plots (Figure 8C, Figure 9C and Figure 10C) only display a good correlation for n = 1, indicating a 1:1 stoichiometry for the interaction of lead(II) with the azo compounds. In fact, the spectra for the titration of compounds with lead(II) are completely different from that of compound 3c with copper(II), pointing to a different kind of interaction of the azo dyes with the two cations.
In order to understand the spectral changes upon interaction with Pb2+, ab initio calculations were performed for coupling of the metal ion to the OH group of compound 3a, [Pb(OH)23a]. The results are included in Table 2 and in Figure 2 and Figure 3. From the calculated spectrum, a significant decrease in molar absorptivity near 340 nm and an increase in the 450–550 nm spectral region is detected. This feature is in accordance with the observed variations in absorbance of compound 3a with varying amounts of Pb2+ cations.
The WHO published guidelines on clinical management exposure to lead (2021), recommending that, for individuals with a blood lead concentration equal to or higher than 5 µg/dL (0.24 µM), the source of lead exposure must be identified and actions immediately taken [41]. US CDC (Centers for Disease Control and Prevention) uses a blood lead reference value (BLRV) of 3.5 µg/dL (0.17 µM) for children [42]. Given the high level of lead poisoning, compounds 3ac are promising as colorimetric sensors for determination of lead(II), considering the detectable range and the low LOD values.

3. Materials and Methods

3.1. Chemicals and Reagents

Melting points were determined using a Stuart SMP3 apparatus (Bibby Scientific, Staffordshire ST15 0SA, UK). Thin-layer chromatography (TLC) was performed on 0.20 mm thick precoated silica gel plates (Macherey-Nagel, Düren 52355, Germany). Visualization of the spots was carried out both with the naked eye and under UV light at 365 nm using a CN-15 camera system (Vilber Lourmat, Marne-la-Vallée 77202, France). Column chromatography was conducted on silica gel 60 (particle size 0.035–0.070 mm, Acros Organics, Geel, Belgium).

3.2. Analytical Instruments

FTIR spectra were determined on a Spectrum Two FTIR PerkinElmer spectrophotometer (PerkinElmer Inc., Waltham, MA 01821, USA). UV-Vis-NIR absorption spectra (200–800 nm) were obtained using a Shimadzu UV-3600 Plus spectrophotometer (Shimadzu Europa GmbH, Duisburg 47269, Germany). NMR spectra were recorded on a Bruker Avance III 400 spectrometer (Billerica, MA 01821, USA) operating at 400 MHz for 1H and 100.6 MHz for 13C nuclei, using the solvent residual peak as an internal reference at 25 °C. Chemical shifts (δ) are reported in parts per million (ppm) relative to TMS (δH = 0 ppm), and coupling constants (J) are given in hertz (Hz). Signal assignments were made based on chemical shifts, multiplicities, and J values and further confirmed by spin decoupling (double-resonance) and two-dimensional heteronuclear correlation techniques. Mass spectrometry analyses were carried out at “C.A.C.T.I.—Unidad de Espectrometría de Masas”, University of Vigo, Spain. All commercially available reagents and solvents were used without further purification.

3.3. General Procedure for the Synthesis of Eugenol Azo Dyes 3ae

The corresponding aniline 1ae (3.65 × 10⁻³ mol, 2 equiv.) was added to a solution of 1 M HCl (7.5 mL) and 6 M HCl (0.42 mL). After cooling to 0–5 °C, aqueous NaNO2 (0.251 g, 1 equiv., in 1 mL of water) was added gradually. The resulting suspension was then stirred for 45 min. The diazonium salt solution was added dropwise to a solution of eugenol (0.300 g, 1.82 × 10⁻³ mol, 1 equiv.) in NaOH (0.120 g, 3.00 × 10⁻³ mol, 1.5 equiv.) and water (1–2 mL) and stirred continuously at room temperature for 10 min. The suspension was filtered off, washed with cold water and diethyl ether, and dried under reduced pressure. The crude products were subjected to column chromatography on silica gel, with dichloromethane/petroleum ether, dichloromethane, and dichloromethane/methanol, as mixtures of increasing polarity as eluent, giving the respective azo dyes 3a [14], 3b [16], 3c, 3d [14], and 3e.

3.3.1. 4-Allyl-2-methoxy-6-(phenyldiazenyl)phenol 3a

Starting from aniline 1a (0.333 mL, 3.65 × 10⁻³ mol), the crude product was subjected to column chromatography on silica gel, with dichloromethane/petroleum ether as eluent, giving 4-allyl-2-methoxy-6-(phenyldiazenyl)phenol 3a as an orange solid (0.177 g, 36% yield). Rf = 0.52 (silica; dichloromethane/petroleum ether 1:1), m.p. = 70.1–72.0 °C. IR (υmax.): 3058, 3002, 2972, 2900, 2844, 2065, 1964, 1636, 1599, 1584, 1316, 1192, 1145, 1098, 1019, 999, 966, 882 cm−1. 1H NMR (CDCl3, 400 MHz): δH 3.43 (2H, d, J = 6.8 Hz, CH2Ph), 3.93 (3H, s, OCH3), 5.13–5.19 (2H, m, CH=CH2), 5.98–6.08 (1H, m, CH=CH2), 6.81 (1H, d, J = 1.6 Hz, H-3), 7.42 (1H, d, J = 1.6 Hz, H-5), 7.46–7.53 (3H, m, 3 × Ph-H), 7.86 (2H, dd, J = 7.6 and 1.6 Hz, 2 × Ph-H), 13.14 (1H, s, OH) ppm. 13C NMR (CDCl3, 100.6 MHz): δC 39.45 (CH2Ph), 56.32 (OCH3), 115.43 (C-3), 116.09 (CH=CH2), 122.05 (2 × Ph-C), 123.80 (C-5), 129.22 (2 × Ph-C), 130.53 (C-6), 131.01 (Ph-C), 136.86 (C-4), 137.01 (CH=CH2), 141.55 (C-1), 148.58 (C-2), 150.21 (C-1 Ph) ppm. HRMS m/z (ESI): calc for C16H17N2O2 [M+ + 1] 269.1285; found 269.1275.

3.3.2. 4-Allyl-2-methoxy-6-((3-methoxyphenyl)diazenyl)phenol 3b

Starting from 3-methoxyaniline 1b (0.411 mL, 3.65 × 10⁻³ mol), the crude product was subjected to column chromatography on silica gel, with dichloromethane/petroleum ether as eluent, giving 4-allyl-2-methoxy-6-((3-methoxyphenyl)diazenyl)phenol 3b as an orange solid (0.079 g, 14% yield). Rf = 0.69 (silica; dichloromethane/petroleum ether 1:1), m.p. = 107.7–109.0 °C. IR (υmax.): 3210, 3075, 2975, 2911, 2834, 1638, 1603, 1482, 1452, 1437, 1413, 1379, 1319, 1287, 1195, 1144, 1110, 1076, 1035, 999, 969, 914, 845 cm−1. 1H NMR (CDCl3, 400 MHz): δH 3.41 (2H, d, J = 6.8 Hz, CH2Ph), 3.87 (3H, s, OCH3), 3.92 (3H, s, OCH3), 5.12–5.17 (2H, m, CH=CH2), 5.99–6.05 (1H, m, CH=CH2), 6.80 (1H, d, J = 1.6 Hz, H-3), 7.01–7.04 (1H, m, H-Ph-OCH3), 7.39–7.47 (4H, m, H-5 and 4 × H-Ph-OCH3), 13.10 (1H, s, OH) ppm. 13C NMR (CDCl3, 100.6 MHz): δC 39.43 (CH2Ph), 55.33 (OCH3), 56.30 (OCH3), 104.62 (C-3), 115.47 (C-5), 116.05 (CH=CH2), 116.57 (C-Ph-OCH3), 117.72 (C-Ph-OCH3), 123.78 (C-Ph-OCH3), 129.88 (C-Ph-OCH3), 130.52 (C-6), 136.76 (C-4), 137.00 (CH=CH2), 141.60 (C-1), 148.56 (C-2), 151.38 (C-1 Ph-OCH3), 160.38 (C-3 Ph-OCH3) ppm. HRMS m/z (ESI): calc for C17H19N2O3 [M+ + 1] 299.1390; found 299.1378.

3.3.3. 4-Allyl-2-((3-bromophenyl)diazenyl)-6-methoxyphenol 3c

Starting from 3-bromoaniline 1c (0.398 mL, 3.65 × 10⁻³ mol), the crude product was subjected to column chromatography on silica gel, with dichloromethane as eluent, giving 4-allyl-2-((3-bromophenyl)diazenyl)-6-methoxyphenol 3c as a dark-red solid (0.107 g, 17% yield). Rf = 0.51 (silica; dichloromethane), m.p. = 147.0–149.0 °C. FTIR (υmax.): 2963, 1639, 1571, 1490, 1463, 1411, 1374, 1272, 1259, 1185, 1142, 1107, 1088, 1001, 964, 939, 911, 883, 844 cm−1. 1H NMR (CDCl3, 400 MHz): δH 3.43 (2H, d, J = 6.8 Hz, CH2Ph), 3.94 (3H, s, OCH3), 5.14–5.19 (2H, m, CH=CH2), 5.99–6.06 (1H, m, CH=CH2), 6.84 (1H, d, J = 1.6 Hz, H-3), 7.40 (1H, t, J = 8.0 Hz, H-5 Ph-Br), 7.42 (1H, d, J = 2.0 Hz, H-5), 7.60 (1H, dq, J = 8.0 and 2.0 Hz, H-4 Ph-Br), 7.79 (1H, dq, J = 8.0 and 2.0 Hz, H-6 Ph-Br), 8.01 (1H, t, J = 2.0 Hz, H-2 Ph-Br) ppm. 13C NMR (CDCl3, 100.6 MHz): δC 39.52 (CH2Ph), 56.46 (OCH3), 116.09 (C-3), 116.32 (CH=CH2), 122.20 (C-3 Ph-Br), 122.29 (C-6 Ph-Br), 123.38 (C-6), 123.78 (C-2 Ph-Br), 123.98 (C-5), 130.63 (C-5 Ph-Br), 130.94 (C-4), 133.68 (C-4 Ph-Br), 136.96 (CH=CH2), 141.64 (C-1), 148.68 (C-2), 151.41 (C-1 Ph-Br) ppm. HRMS m/z (ESI): calc for C16H16BrN2O2 [M+ + 1] 347.0390; found 347.0376.

3.3.4. 4-Allyl-2-((4-chlorophenyl)diazenyl)-6-methoxyphenol 3d

Starting from 4-chloroaniline 1d (0.466 g, 3.65 × 10⁻³ mol), the crude product was subjected to column chromatography on silica gel, with dichloromethane as eluent, giving 4-allyl-2-((4-chlorophenyl)diazenyl)-6-methoxyphenol 3d as a red solid (0.245 g, 44% yield). Rf = 0.46 (silica; dichloromethane), m.p. = 136.0–138.0 °C. FTIR (υmax.): 2097, 1640, 1576, 1490, 1422, 1377, 1327, 1264, 1143, 1084, 1001, 965, 912, 841 cm−1. 1H NMR (CDCl3, 400 MHz): δH 3.43 (2H, d, J = 6.4 Hz, CH2Ph), 3.95 (3H, s, OCH3), 5.12–5.19 (2H, m, CH=CH2), 5.97–6.07 (1H, m, CH=CH2), 6.98 (1H, d, J = 1.6 Hz, H-5), 7.40 (1H, d, J = 2.0 Hz, H-3), 7.50 (2H, d, J = 8.8 Hz, H-3 and H-5 Ph-Cl), 7.82 (2H, J = 9.2 Hz, H-2 and H-6 Ph-Cl), 12.83 (1H, broad s, OH) ppm. 13C NMR (CDCl3, 100.6 MHz): δC 39.55 (CH2Ph), 56.48 (OCH3), 115.85 (C-3), 116.28 (CH=CH2), 123.39 (C-2 and C-6 Ph-Cl), 123.86 (C-5), 129.64 (C-3 and C-5 Ph-Cl), 130.88 (C-6), 136.99 (C-4 Ph-Cl), 137.04 (CH=CH2), 137.07 (C-4), 141.54 (C-1), 148.69 (C-2), 148.89 (C-1 Ph-Cl) ppm. HRMS m/z (ESI): calc for C16H16ClN2O2 [M+ + 1] 303.0895; found 303.0882.

3.3.5. 3-((5-Allyl-2-hydroxy-3-methoxyphenyl)diazenyl)-2-bromobenzoic Acid 3e

Starting from 3-amino-2-bromobenzoic acid 1e (0.790 g, 3.65 × 10⁻³ mol), the crude product was subjected to column chromatography on silica gel, giving 3-((5-allyl-2-hydroxy-3-methoxyphenyl)diazenyl)-2-bromobenzoic acid 3e as a dark-red solid (0.298 g, 41% yield). Rf = 0.64 (silica; dichloromethane/methanol 90:10), m.p. = 174.0–175.0 °C. FTIR (υmax.): 3369, 1695, 1644, 1581, 1558, 1545, 1493, 1392, 1255, 1143, 1100, 1030, 1001, 911 cm−1. 1H NMR (DMSO-d6, 400 MHz): δH 3.37 (2H, d, J = 6.8 Hz, CH2Ph), 3.84 (3H, s, OCH3), 5.06–5.15 (2H, m, CH=CH2), 5.96–6.03 (1H, m, CH=CH2), 7.02 (1H, d, J = 2.0 Hz, H-4), 7.26 (1H, d, J = 2.0 Hz, H-6), 7.53 (1H, t, J = 8.0 Hz, H-5 Ph-COOH), 7.66 (1H, d, J = 7.6 and 1.6 Hz, H-6 Ph-COOH), 7.85 (1H, d, J = 8.0 and 1.6 Hz, H-4 Ph-COOH) ppm. 13C NMR (DMSO-d6, 100.6 MHz): δC 38.81 (CH2Ph), 56.14 (OCH3), 116.13 (CH=CH2), 116.67 (C-4), 116.79 (C-6), 118.37 (C-6 Ph-COOH), 121.22 (C-2 Ph-COOH), 128.33 (C-5 Ph-COOH), 130.72 (C-5), 131.29 (C-4 Ph-COOH), 131.50 (C-1 Ph-COOH), 137.42 (CH=CH2), 138.03 (C-1), 142.94 (C-2), 148.29 (C-3 Ph-COOH), 148.97 (C-3), 168.04 (COOH) ppm. HRMS m/z (ESI): calc for C17H16BrN2O4 [M+ + 1] 391.0288; found 391.0272.

3.4. Photophysical Analysis

3.4.1. Preparation of Solutions

Milli-Q-grade ultrapure water and ethanol (spectroscopic grade) were used in all solutions. Stock solutions of several cations, chosen due to their environmental relevance or important biological role, were prepared, at a final concentration of 1 × 10⁻² M. The salts potassium perchlorate, sodium perchlorate, cesium perchlorate, zinc perchlorate hexahydrate, iron(II) perchlorate hydrate, iron(III) perchlorate hydrate, cadmium perchlorate hexahydrate, nickel perchlorate hexahydrate, copper(II) perchlorate hexahydrate, aluminum perchlorate nonahydrate, lead(II) perchlorate trihydrate, cadmium nitrate tetrahydrate, and cobalt chloride hexahydrate were used for these preparations.

3.4.2. Spectrophotometric Titrations

An analysis of the chemosensor capability of compounds 3ae was carried out in neutral ethanolic solution (using absolute ethanol), with a 1 × 10⁻⁵ M compound concentration. A successive addition of each cation was made to 3 mL of each compound solution, and UV/Vis absorption spectra were collected until the absorbance reached a plateau, using a Shimadzu UV-3600 Plus UV-Vis-NIR spectrophotometer and standard quartz cuvettes with a 10.0 mm optical path.
The limit of detection (LOD) for each cation was calculated using the slope of the linear range of absorbance versus ion concentration plot and the standard deviation (s) of five replicates of absorbance measurements of the analyte-free solution, being calculated through Equation (1) [43]:
L O D = 3 s / k
where s is the standard deviation and k is the slope of the calibration curve.
The binding constant was determined using the Benesi–Hildebrand relation (Equation (2)) [44]:
1 A A 0 = 1 K a A m a x A 0 i o n n + 1 A m a x A 0
where A0 is the compound absorbance in the absence of the ion, A is the compound absorbance with different ion concentrations, A m a x is the absorbance of the compound upon complete binding, n is the binding stoichiometry, and Ka is the binding constant.

3.4.3. Ab Initio Molecular Quantum Chemistry Calculations

For compound 3a, the structural and electronic properties were investigated using ab initio molecular quantum chemistry calculations with ORCA software (version 6.0.1) [45], employing a def2-TZVP basis set [46] and using the DFT method with RIJCOSX approximation [47]. def2/J [48] was used as the auxiliary basis. Also, B3LYP functional was employed together with atom-pairwise dispersion correction based on EEQ partial charges (D4) [49] and a conductor-like polarizable continuum model (CPCM) corresponding to ethanol. Excited state calculations were carried out using time-dependent DFT with Tamm–Dancoff approximation (TD-DFT-TDA) [45].

4. Conclusions

A set of azo dyes incorporating eugenol into their structures display absorption spectra in the UV and blue regions, with maximum wavelengths at 350 nm and around 430 nm (smaller band), justifying the yellowish color. The dyes without substituents in the phenyl group and with a bromide or methoxy group in the meta position relative to the azo group were revealed to be promising as sensors for the detection of lead(II) and copper(II), with low detection limits. Moreover, the titrations could be carried out in neutral ethanol, with no need for organic solvents such as acetonitrile, which is very common in these types of assays using organic compounds as sensors.
Accordingly, this work contributes to the identification of new colorimetric sensors for copper(II) and lead(II) detection by integrating a naturally occurring phenol, namely, eugenol, into their structures, together with substituents in the phenyl ring in the meta position relative to the azo group. Some of these structures had been previously synthesized for other purposes, but the present study demonstrates the versatility of these eugenol-derived dyes and broadens their scope of application.

Supplementary Materials

The following supporting information can be downloaded at https://www.mdpi.com/article/10.3390/molecules30132788/s1. 1H and 13C NMR spectra and HRMS and FTIR data of compounds 3ae. Two-dimensional NMR analyses (HSQC and HMBC) of dye 3e. Cartesian coordinates of compound 3a.

Author Contributions

J.R.A.C.: Conceptualization, Investigation, Methodology, Writing—original draft. A.R.F.P.: Investigation, Formal analysis. D.C.D.: Investigation. A.R.O.R.: Supervision, Investigation. A.A.T.: Investigation. P.J.G.C.: Conceptualization, Investigation, Writing—original draft. M.J.G.F.: Supervision, Formal Analysis. E.M.S.C.: Conceptualization, Validation, Writing—original draft, Writing—review and editing. M.S.T.G.: Conceptualization, Formal Analysis, Supervision, Writing—original draft, Writing—review and editing. All authors have read and agreed to the published version of the manuscript.

Funding

This work was supported by the Portuguese Foundation for Science and Technology (FCT) through Strategic Funding UID/00686 to Centro de Química da Universidade do Minho (CQ-UM/UM) and Strategic Funding UID/04650 to Physics Centre of Minho and Porto Universities (CF-UM-UP). The NMR spectrometer Bruker Avance III 400 is housed at National NMR Network (PTNMR) and is partially supported by Infrastructure Project No. 022161 (co-financed by FEDER through COMPETE 2020, POCI, and PORL, and FCT through PIDDAC).

Institutional Review Board Statement

Not applicable.

Informed Consent Statement

Not applicable.

Data Availability Statement

Data are contained within the article and Supplementary Materials.

Conflicts of Interest

The authors declare no conflicts of interest.

References

  1. Alsantali, R.I.; Raja, Q.A.; Alzahrani, A.Y.A.; Sadiq, A.; Naeem, N.; Mughal, E.U.; Al-Rooqi, M.M.; El Guesmi, N.; Ahmed, S.A. Miscellaneous azo dyes: A comprehensive review on recent advancements in biological and industrial applications. Dyes Pigm. 2022, 199, 110050. [Google Scholar] [CrossRef]
  2. Vespignani, L.; Bonanni, M.; Marradi, M.; Pizzo, B.; Bianchini, R.; Goli, G. Naturalized dyes: A new opportunity for the wood colouring. Polym. J. 2023, 15, 3632–3647. [Google Scholar] [CrossRef] [PubMed]
  3. Pizzicato, B.; Pacifico, S.; Cayuela, D.; Mijas, G.; Riba-Moliner, M. Advancements in sustainable natural dyes for textile applications: A review. Molecules 2023, 28, 5954–5975. [Google Scholar] [CrossRef] [PubMed]
  4. Coelho, J.R.A.; Fernandes, M.J.G.; Gonçalves, M.S.T. New azo carboxylic dyes derived from eugenol: Synthesis and preliminary application to polyamide. Chem. Proc. 2023, 14, 56–61. [Google Scholar]
  5. Mezgebe, K.; Mulugeta, E. Synthesis and pharmacological activities of azo dye derivatives incorporating heterocyclic scaffolds: A review. RSC Adv. 2022, 12, 25932–25946. [Google Scholar] [CrossRef]
  6. Ryzhkov, A.I.; Fedor, V.; Drozdov, F.V.; Georgij, V.; Cherkaev, G.V.; Buzin, M.I.; Svidchenko, E.A.; Muzafarov, A.M. Synthesis and properties of new siloxane with terminal azo dyes functions based on eugenol. J. Appl. Polym. Sci. 2022, 139, e52340. [Google Scholar] [CrossRef]
  7. Ghanavatkar, C.W.; Mishra, V.R.; Sekar, N. Review of NLOphoric azo dyes—Developments in hyperpolarizabilities in last two decades. Dyes Pigment. 2021, 191, 109367–109392. [Google Scholar] [CrossRef]
  8. Marinescu, M.; Popa, C.V.; Tănase, M.A.; Soare, A.C.; Tablet, C.; Bala, D.; Cinteza, L.O.; Diţu, L.M.; Gifu, I.C.; Petcu, C. Synthesis, characterization, DFT study and antifungal activities of some novel 2-(phenyldiazenyl)phenol based azo dyes. Materials 2022, 15, 8162–8182. [Google Scholar] [CrossRef]
  9. Khanum, R.; Shoukat Ali, R.A.; Rangaswamy, H.R.; Santhosh Kumar, S.R.; Pashantha, A.G.; Jagadisha, A.S. Recent review on synthesis, spectral studies, versatile applications of azo dyes and its metal complexes. Results Chem. 2023, 5, 100890–100905. [Google Scholar] [CrossRef]
  10. Deghadi, R.G.; Mahmoud, W.H.; Mohamed, G.G. Metal complexes of tetradentate azo-dye ligand derived from 4,4′-oxydianiline: Preparation, structural investigation, biological evaluation and MOE studies. Appl. Organomet. Chem. 2020, 34, e5883. [Google Scholar] [CrossRef]
  11. Al-Gaber, M.A.I.; Abd El-Lateef, H.M.; Khalaf, M.M.; Shaaban, S.; Shawky, M.; Mohamed, G.G.; Abdou, A.; Gouda, M.; Abu-Dief, A.M. Design, synthesis, spectroscopic inspection, DFT and molecular docking study of metal chelates incorporating azo dye ligand for biological evaluation. Materials 2023, 16, 897–919. [Google Scholar] [CrossRef] [PubMed]
  12. Zhu, Z.; Chen, R.; Zhang, L. Simple phenylpropanoids: Recent advances in biological activities, biosynthetic pathways, and microbial production. Nat. Prod. Rep. 2024, 41, 6–24. [Google Scholar] [CrossRef] [PubMed]
  13. Zielińska-Błajet, M.; Feder-Kubis, J. Monoterpenes and their derivatives–recent development in biological and medical applications. Int. J. Mol. Sci. 2020, 21, 7078–7115. [Google Scholar] [CrossRef] [PubMed]
  14. Dandge, S.V.; Nikume, S.R.; Bendre, R.S. An efficient synthesis, characterization, antimicrobial and anticancer activities of azo dyes derived from eugenol. Synth. Commun. 2023, 54, 282–292. [Google Scholar] [CrossRef]
  15. Carradori, S.; Ammazzalorso, A.; Niccolai, S.; Tanini, D.; D’Agostino, I.; Melfi, F.; Capperucci, A.; Grande, R.; Sisto, F. Nature-inspired compounds: Synthesis and antibacterial susceptibility testing of eugenol derivatives against H. pylori strains. Pharmaceuticals 2023, 16, 1317–1335. [Google Scholar] [CrossRef]
  16. Melfi, F.; Fantacuzzi, M.; Carradori, S.; Ammazzalorso, A.; Mencarelli, N.; Gallorini, M.; Spano, M.; Agamennone, M.; Haji Ali, S.; Al-Samydai, A.; et al. Azo derivatives of monoterpenes as anti-Helicobacter pylori agents: From the synthesis to a structure-based target investigation. RSC Med. Chem. 2025, 16, 346–366. [Google Scholar] [CrossRef]
  17. Ferreira, V.R.F.; Militani, I.A.; de Almeida, K.J.; Lunguinho, A.S.; Saczk, A.A.; Ionta, M.; da Silva, G.A.F.; Felix, F.S.; Nelson, D.L.; Cardoso, M.G. Antioxidant and cytotoxic activity of essential oils and their principal components: Spectrophotometric, voltammetric, and theoretical investigation of the chelating effect of eugenol and carvacrol. ACS Food Sci. Technol. 2023, 3, 350–360. [Google Scholar] [CrossRef]
  18. Sadaphal, Y.R.; Gholap, S.S. Eugenol [2-Methoxy-4-allylphenol (MAP)] a colorimetric sensing probe for selective determination of Iron(III). J. Mater. Environ. Sci. 2022, 13, 42–53. [Google Scholar]
  19. Jomova, K.; Valko, M. Advances in metal-induced oxidative stress and human disease. Toxicology 2011, 283, 65–87. [Google Scholar] [CrossRef]
  20. Ruiz, L.M.; Libedinsky, A.; Elorza, A.A. Role of copper on mitochondrial function and metabolism. Front. Mol. Biosci. 2021, 8, 711227. [Google Scholar] [CrossRef]
  21. Gupte, A.; Mumper, R.J. Elevated copper and oxidative stress in cancer cells as a target for cancer treatment. Cancer Treat. Rev. 2009, 35, 32–46. [Google Scholar] [CrossRef] [PubMed]
  22. Kardos, J.; Héja, L.; Simon, A.; Jablonkai, I.; Kovács, R.; Jemnitz, K. Copper signalling: Causes and consequences. Cell Commun. Signal. 2018, 16, 71–92. [Google Scholar] [CrossRef] [PubMed]
  23. Texas Commission on Environmental Quality (TCEQ). Lead Poisoning: What Are the Sources? What Are the Risks? TCEQ Publication GI-069. 2004. Available online: https://www.tceq.texas.gov/downloads/toxicology/publications/lead-poisoning-gi-69.pdf (accessed on 1 March 2025).
  24. Collin, M.S.; Venkatraman, S.K.; Vijayakumar, N.; Kanimozhi, V.; Arbaaz, S.M.; Stacey, R.G.S.; Anusha, J.; Choudhary, R.; Lvov, V.; Tovar, G.I.; et al. Bioaccumulation of lead (Pb) and its effects on human: A review. J. Hazard. Mater. 2022, 7, 100094–100101. [Google Scholar] [CrossRef]
  25. Trevino, M.; Wagner, C.R.; Tamura, E.K.; Garcia, J.; Louie, A.Y. Small molecule sensors for the colorimetric detection of Copper(II): A review of the literature from 2010 to 2022. Dyes Pigment. 2023, 214, 110881. [Google Scholar] [CrossRef]
  26. Chen, S.-Y.; Li, Z.; Li, K.; Yu, X.-Q. Small molecular fluorescent probes for the detection of lead, cadmium and mercury ions. Coord. Chem. Rev. 2021, 429, 213691. [Google Scholar] [CrossRef]
  27. Wang, Y.; Song, H.; Zhang, Y.; Gong, H.; Sun, R.; Mao, W.; Wang, D.; Chen, Y. A colorimetric Pb2+ chemosensor: Rapid naked-eye detection, high selectivity, theoretical insights, and applications. J. Photochem. Photobiol. A Chem. 2018, 355, 101–108. [Google Scholar] [CrossRef]
  28. Zavalishin, M.N.; Gamov, G.A.; Kiselev, A.N.; Nikitin, G.A. A fluorescein conjugate as colorimetric and red-emissive fluorescence chemosensor for selective recognition Cu2+ ions. Opt. Mater. 2024, 153, 115580. [Google Scholar] [CrossRef]
  29. Al-Saidi, H.M. Recent advancements in organic chemosensors for the detection of Pb2+: A review. Chem. Pap. 2023, 77, 4807–4822. [Google Scholar] [CrossRef]
  30. Alyami, A.Y. Recent progress in organic fluorescence and colorimetric chemosensors for Cu2+ detection: A comprehensive review (2018–2023). Dyes Pigment. 2023, 220, 111740. [Google Scholar] [CrossRef]
  31. Mohammed, G.I.; Nassar, S.; Farghaly, T.A. Spectrophotometric method for detecting lead (II) ions using a chemosensor of the thiosemicarbazone-linked phenyl sulphone moiety. Results Chem. 2025, 15, 102174. [Google Scholar] [CrossRef]
  32. Ayoubi, R.; Wali, S.; Singh, G.B. The UV and FTIR fingerprint of ocimum kilimandscharicum guerke essential oil: A eugenol-rich chemo type. Int. J. Innov. Res. Sci. Stud. 2022, 5, 1–9. [Google Scholar] [CrossRef]
  33. World Health Organization. Guidelines for Drinking-Water Quality: Second Addendum, 3rd ed.; World Health Organization: Geneva, Switzerland, 2008; Volume 1. [Google Scholar]
  34. Linder, M.C.; Hazegh-Azam, M. Copper biochemistry and molecular biology. Am. J. Clin. Nutr. 1996, 63, 797S–811S. [Google Scholar] [CrossRef]
  35. Ghule, N.V.; Bhosale, R.S.; Puyad, A.L.; Bhosale, S.V. Naphthalenediimide amphiphile based colorimetric probe for recognition of Cu2+ and Fe3+ ions. Sens. Actuators B Chem. 2016, 227, 17–23. [Google Scholar] [CrossRef]
  36. Wang, J.; Wei, T.; Ma, F.; Li, T.; Niu, Q. A novel fluorescent and colorimetric dual-channel sensor for the fast, reversible and simultaneous detection of Fe3+ and Cu2+ based on terthiophene derivative with high sensitivity and selectivity. J. Photochem. Photobiol. A Chem. 2019, 383, 111982–111990. [Google Scholar] [CrossRef]
  37. Pinto, S.C.S.; Gonçalves, R.C.R.; Costa, S.P.G.; Raposo, M.M.M. Colorimetric chemosensor for Cu2+ and Fe3+ based on a meso-triphenylamine-BODIPY derivative. Sensors 2023, 23, 6995–7007. [Google Scholar] [CrossRef] [PubMed]
  38. Vasilyeva, A.A.; Ryzhkov, A.I.; Cherkaev, G.V.; Drozdov, F.V.; Muzafarov, A.M. Silicone films with azo dyes moieties based on eugenol with response to Cu2+ metal ions. Mater. Chem. Phys. 2024, 318, 129248. [Google Scholar] [CrossRef]
  39. World Health Organization. Exposure to Lead: A Major Public Health Concern: Preventing Disease Through Healthy Environments, 3rd ed.; World Health Organization: Geneva, Switzerland, 2023. [Google Scholar]
  40. Available online: https://www.who.int/campaigns/international-lead-poisoning-prevention-week (accessed on 22 November 2024).
  41. World Health Organization. Guideline for Clinical Management of Exposure to Lead; World Health Organization: Geneva, Switzerland, 2021. [Google Scholar]
  42. Available online: https://www.cdc.gov/lead-prevention/about/ (accessed on 22 November 2024).
  43. Wang, L.; Fang, G.; Cao, D. A novel phenol-based BODIPY chemosensor for selective detection of Fe3+ with colorimetric and fluorometric dual-mode. Sens. Actuators B Chem. 2015, 207, 849–857. [Google Scholar] [CrossRef]
  44. Benesi, H.A.; Hildebrand, J.H. A spectrophotometric investigation of the interaction of iodine with aromatic hydrocarbons. J. Am. Chem. Soc. 1949, 71, 2703–2707. [Google Scholar] [CrossRef]
  45. Neese, F. Software update: The ORCA program system, version 5.0. WIRES Comput. Molec. Sci. 2022, 12, e1606. [Google Scholar] [CrossRef]
  46. Weigend, F.; Ahlrichs, R. Balanced basis sets of split valence, triple zeta valence and quadruple zeta valence quality for H to Rn: Design and assessment of accuracy. Phys. Chem. Chem. Phys. 2005, 7, 3297–3305. [Google Scholar] [CrossRef]
  47. Neese, F. An improvement of the resolution of the identity approximation for the formation of the Coulomb matrix. J. Comp. Chem. 2003, 24, 1740–1747. [Google Scholar] [CrossRef] [PubMed]
  48. Weigend, F. Accurate coulomb-fitting basis sets for H to Rn. Phys. Chem. Chem. Phys. 2006, 8, 1057–1065. [Google Scholar] [CrossRef] [PubMed]
  49. Caldeweyher, E.; Ehlert, S.; Hansen, A.; Neugebauer, H.; Spicher, S.; Bannwarth, C.; Grimme, S. A generally applicable atomic-charge dependent London dispersion correction. J. Chem. Phys. 2019, 150, 154122. [Google Scholar] [CrossRef] [PubMed]
Scheme 1. Synthesis of eugenol azo dyes 3ae.
Molecules 30 02788 sch001
Figure 1. Absorption spectra of compounds 3ae in neutral ethanolic solution (2 × 10⁻⁵ M).
Molecules 30 02788 g001
Figure 2. Ground state equilibrium geometries and electron density variation upon excitation to the first excited state of trans (A) and cis (B) conformers, the hydrazone tautomer (C), and the Pb2+ complex (D). The green and purple areas correspond to decreases and increases in electron density, respectively.
Molecules 30 02788 g002
Figure 3. Calculated absorption spectra (in log scale) of compound 3a (3a calc), its hydrazone tautomer (3a_tautomer calc), and its complex with Pb2+ (3a_Pb calc).
Molecules 30 02788 g003
Figure 4. Solutions of the salts of several cations. Cd2+ was tested as a perchlorate salt (left) and a nitrate salt (right).
Molecules 30 02788 g004
Figure 5. Solutions of compounds 3ae after the addition of 15 equiv. of the salts. Cd2+ was tested as a perchlorate salt (left) and a nitrate salt (right), and no differences were obtained.
Molecules 30 02788 g005
Figure 6. Absorption spectra of compound 3c (1 × 10⁻⁵ M) with the addition of Cu2+. The spectra of 10 and 12 equiv. of Cu2+ are superposed.
Molecules 30 02788 g006
Figure 7. (A) Linear plot of absorbance at 540 nm versus Cu2+ concentration. (B) Benesi–Hildebrand plot for the spectrophotometric titration of compound 3c with Cu2+ at 540 nm.
Molecules 30 02788 g007
Figure 8. (A) Absorption spectra of compound 3a (1 × 10⁻⁵ M) with the addition of Pb2+. (B) Linear plot of absorbance at 540 nm versus Pb2+ concentration. (C) Benesi–Hildebrand plot for the spectrophotometric titration of compound 3a with Pb2+.
Molecules 30 02788 g008
Figure 9. (A) Absorption spectra of compound 3b (1 × 10⁻⁵ M) with the addition of Pb2+. (B) Linear plot of absorbance at 540 nm versus Pb2+ concentration. (C) Benesi–Hildebrand plot for the spectrophotometric titration of compound 3b with Pb2+.
Molecules 30 02788 g009
Figure 10. (A) Absorption spectra of compound 3c (1 × 10⁻⁵ M) with the addition of Pb2+ (B) Linear plot of absorbance at 540 nm versus Pb2+ concentration. (C) Benesi–Hildebrand plot for the spectrophotometric titration of compound 3c with Pb2+.
Molecules 30 02788 g010aMolecules 30 02788 g010b
Table 1. Maximum absorption wavelengths (λmax) and molar absorption coefficients (ε) for compounds 3ae in neutral ethanolic solution.
Compoundλmax (nm)ε (M−1 cm−1)
3a3401.14 × 105
3b3388.27 × 104
3c3431.02 × 105
3d3459.40 × 104
3e3537.48 × 104
Table 2. Results of TD-DFT calculations of compound 3a in its trans and cis conformers, as well as its hydrazone tautomeric form and its complex with Pb2+: differences in energy between electronic states and corresponding oscillator strengths (see Section 3.4.3 for calculation details).
TransitionWavelength (nm)Oscillator Strength (f)
transcisTautomerPb2+ ComplextranscisTautomerPb2+ Complex
S0 → S14484764725377.40 × 10−44.02 × 10−24.94 × 10−22.51 × 10⁻³
S0 → S24173954454688.15 × 10−26.80 × 10−31.29 × 10−11.30 × 10⁻¹
S0 → S33283193483961.062.11 × 10−29.02 × 10−11.05 × 10−2
S0 → S43022883133471.76 × 10−24.96 × 10−34.05 × 10−38.59 × 10⁻²
S0 → S52962803113353.26 × 10−41.32 × 10−11.50 × 10−27.84 × 10⁻⁴
S0 → S62782752873255.96 × 10−25.28 × 10−39.03 × 10−45.03 × 10⁻²
S0 → S72562712783241.97 × 10−31.19 × 10−18.14 × 10−32.99 × 10⁻¹
S0 → S82532582573181.10 × 10−27.25 × 10−38.93 × 10−22.17 × 10⁻¹
Table 3. LOD values and binding constants for the interaction of compounds 3ac with lead(II) cations.
CompoundLOD (µM)Ka (M−1)
3a0.192.80 × 104
3b0.141.33 × 104
3c0.161.02 × 104
Disclaimer/Publisher’s Note: The statements, opinions and data contained in all publications are solely those of the individual author(s) and contributor(s) and not of MDPI and/or the editor(s). MDPI and/or the editor(s) disclaim responsibility for any injury to people or property resulting from any ideas, methods, instructions or products referred to in the content.

