
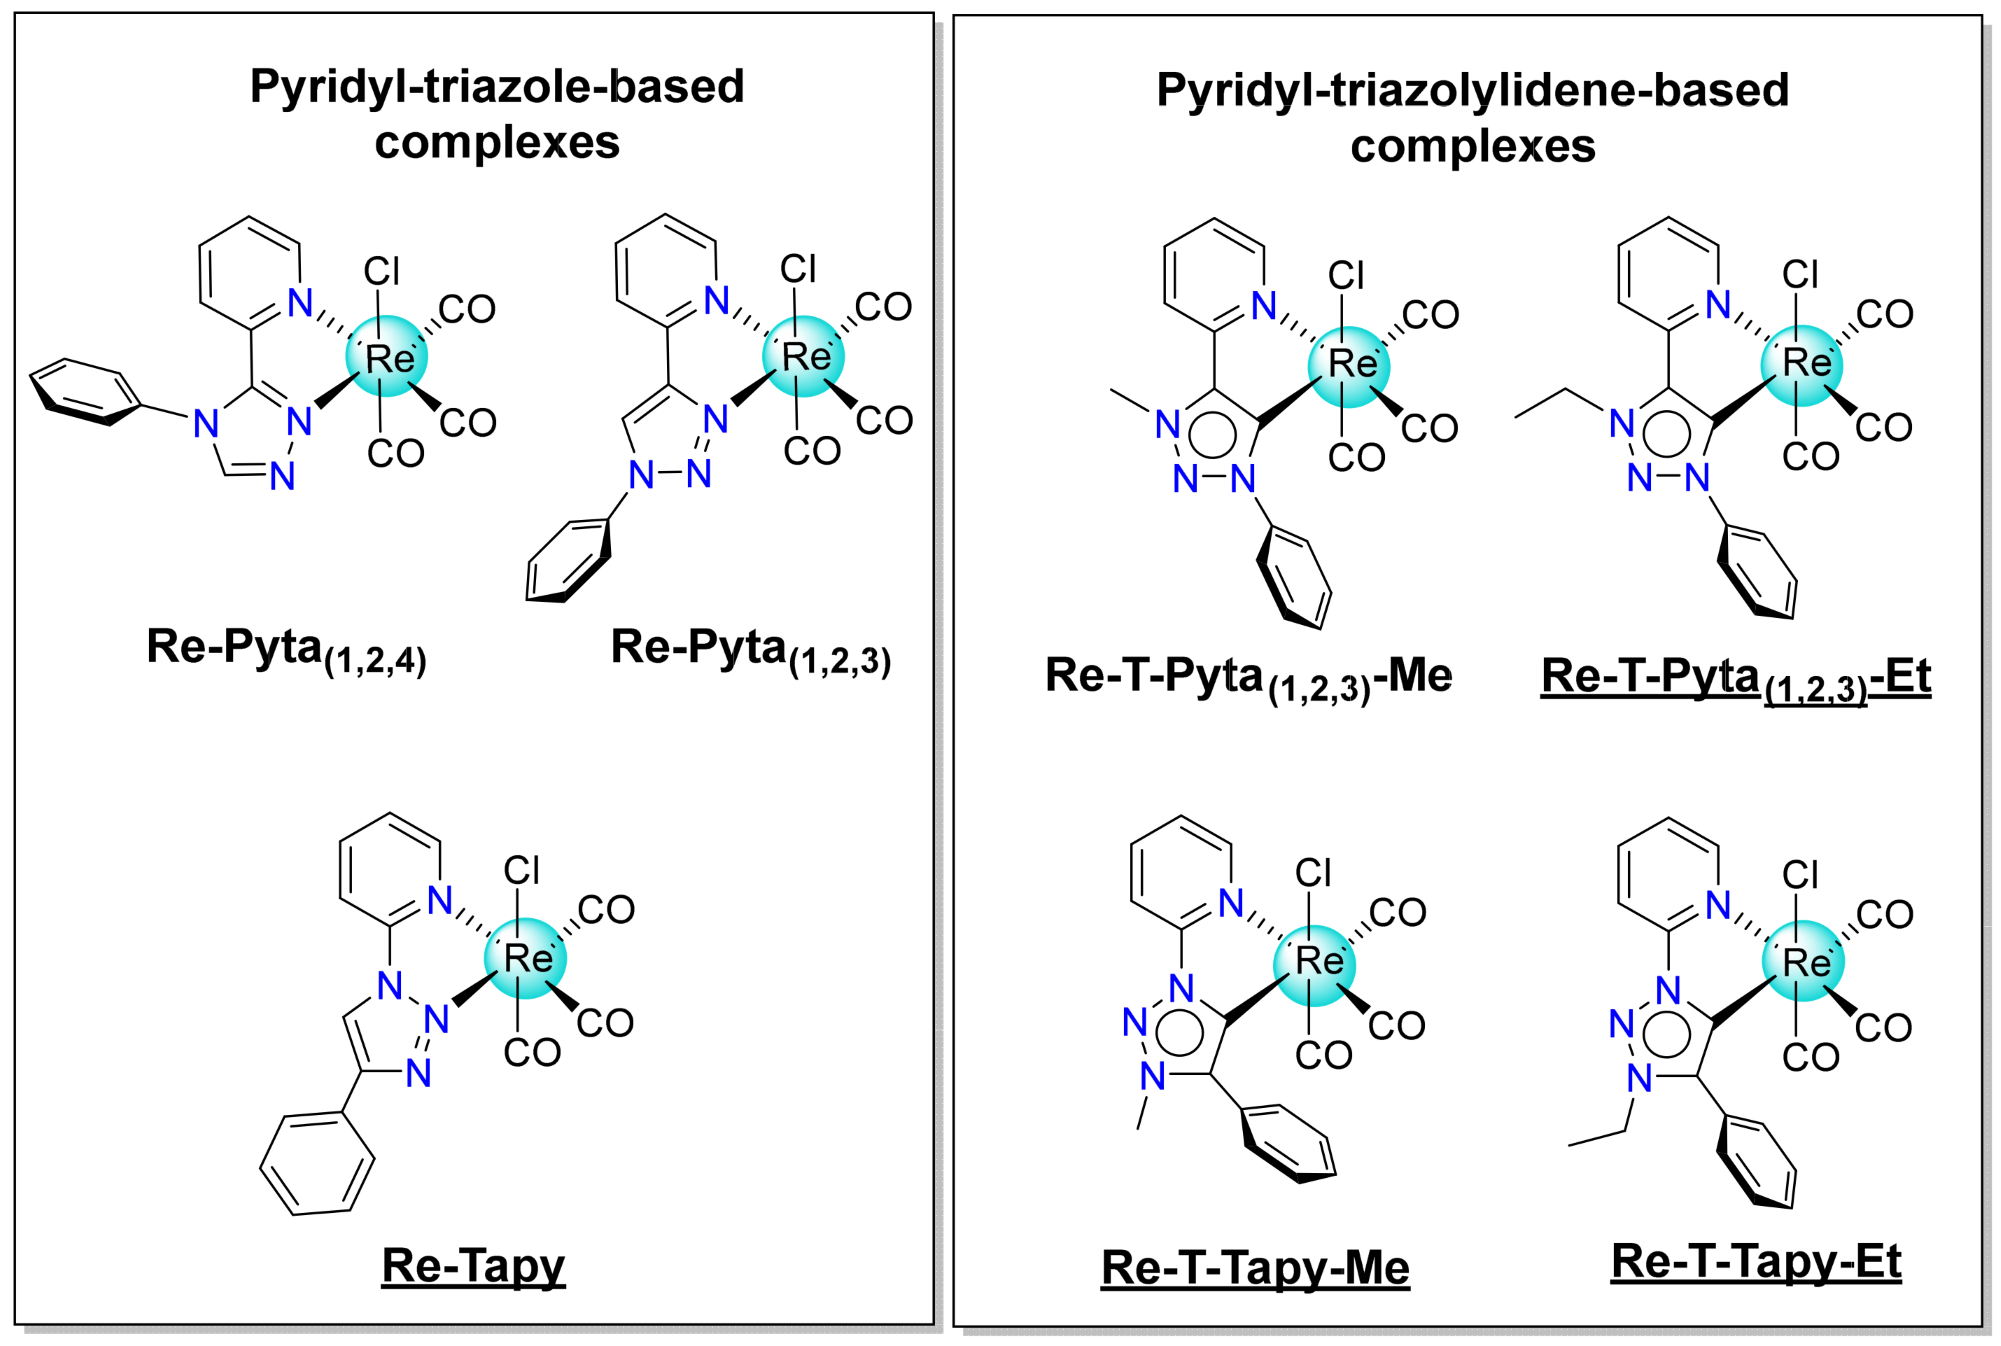
Influence of Ligand Isomerism on the Photophysical Properties of AIPE-Active Rhenium(I) Complexes: Investigations with a 2-(1,2,3-Triazol-1-yl)pyridine (Tapy)-Based Complex and Its Triazolylidene Derivatives

 ,
,  , , , , and
Abstract

1. Introduction
2. Results and Discussion
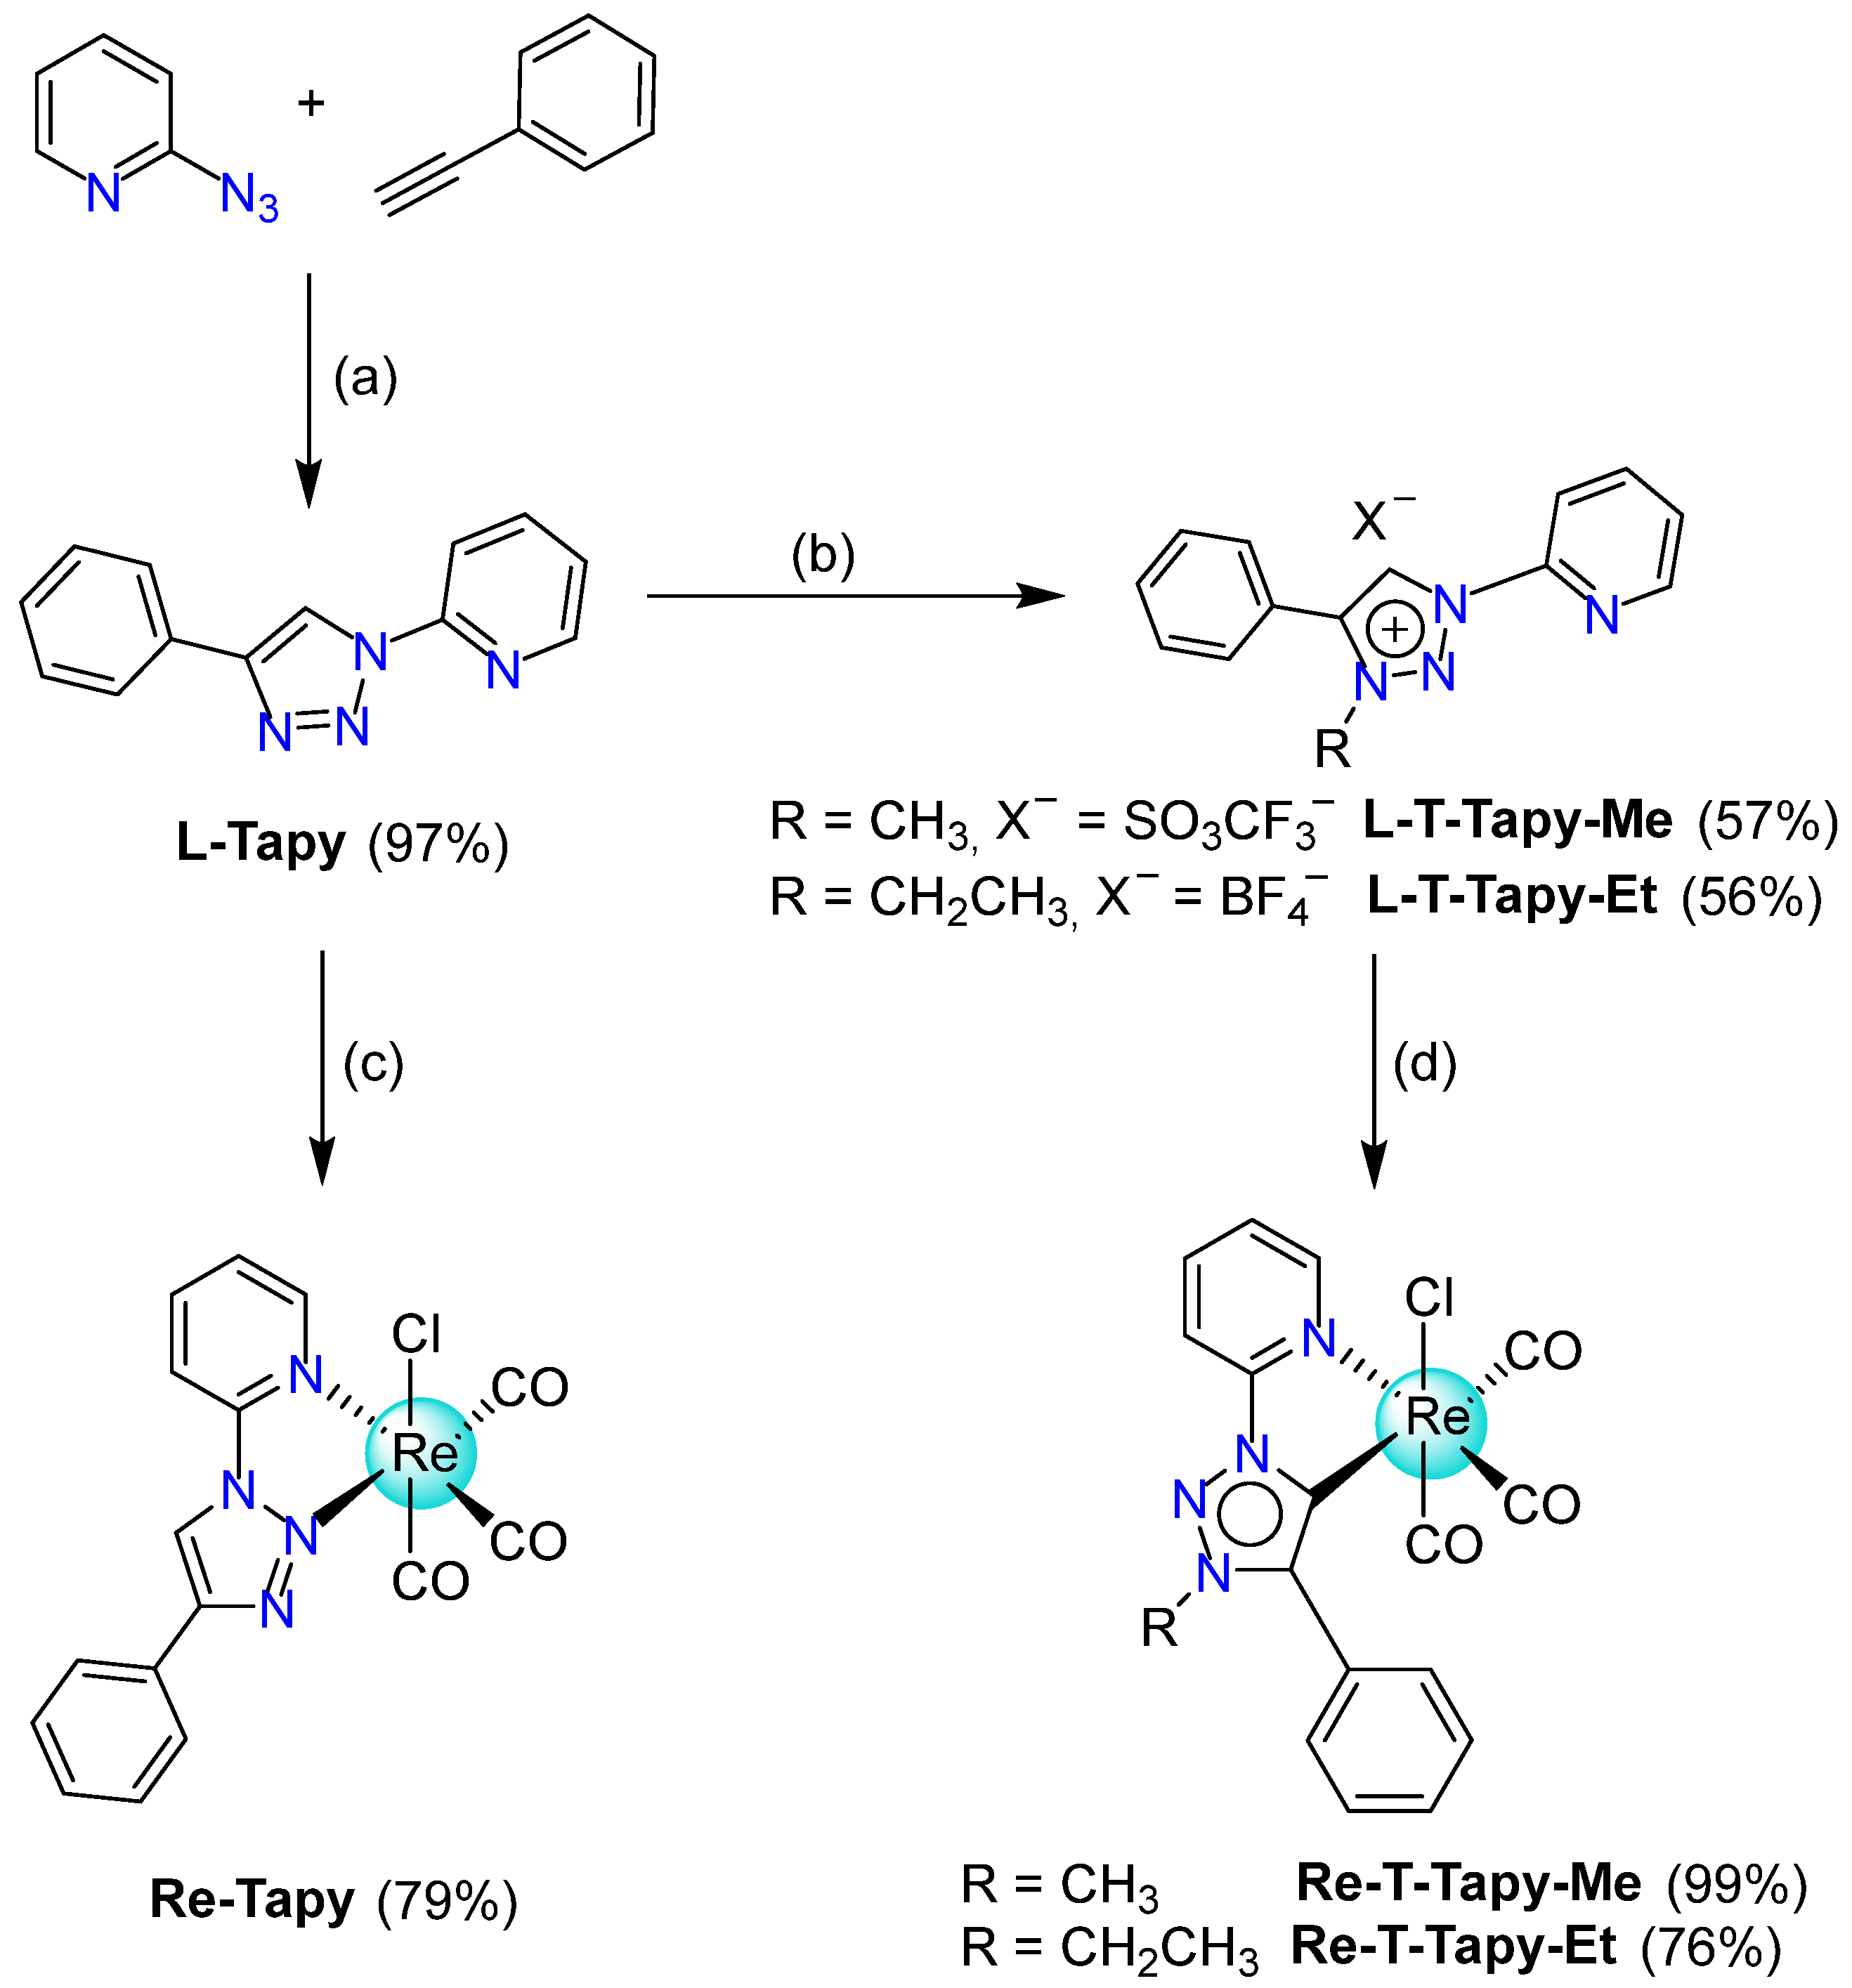
2.1. Synthesis and Characterization
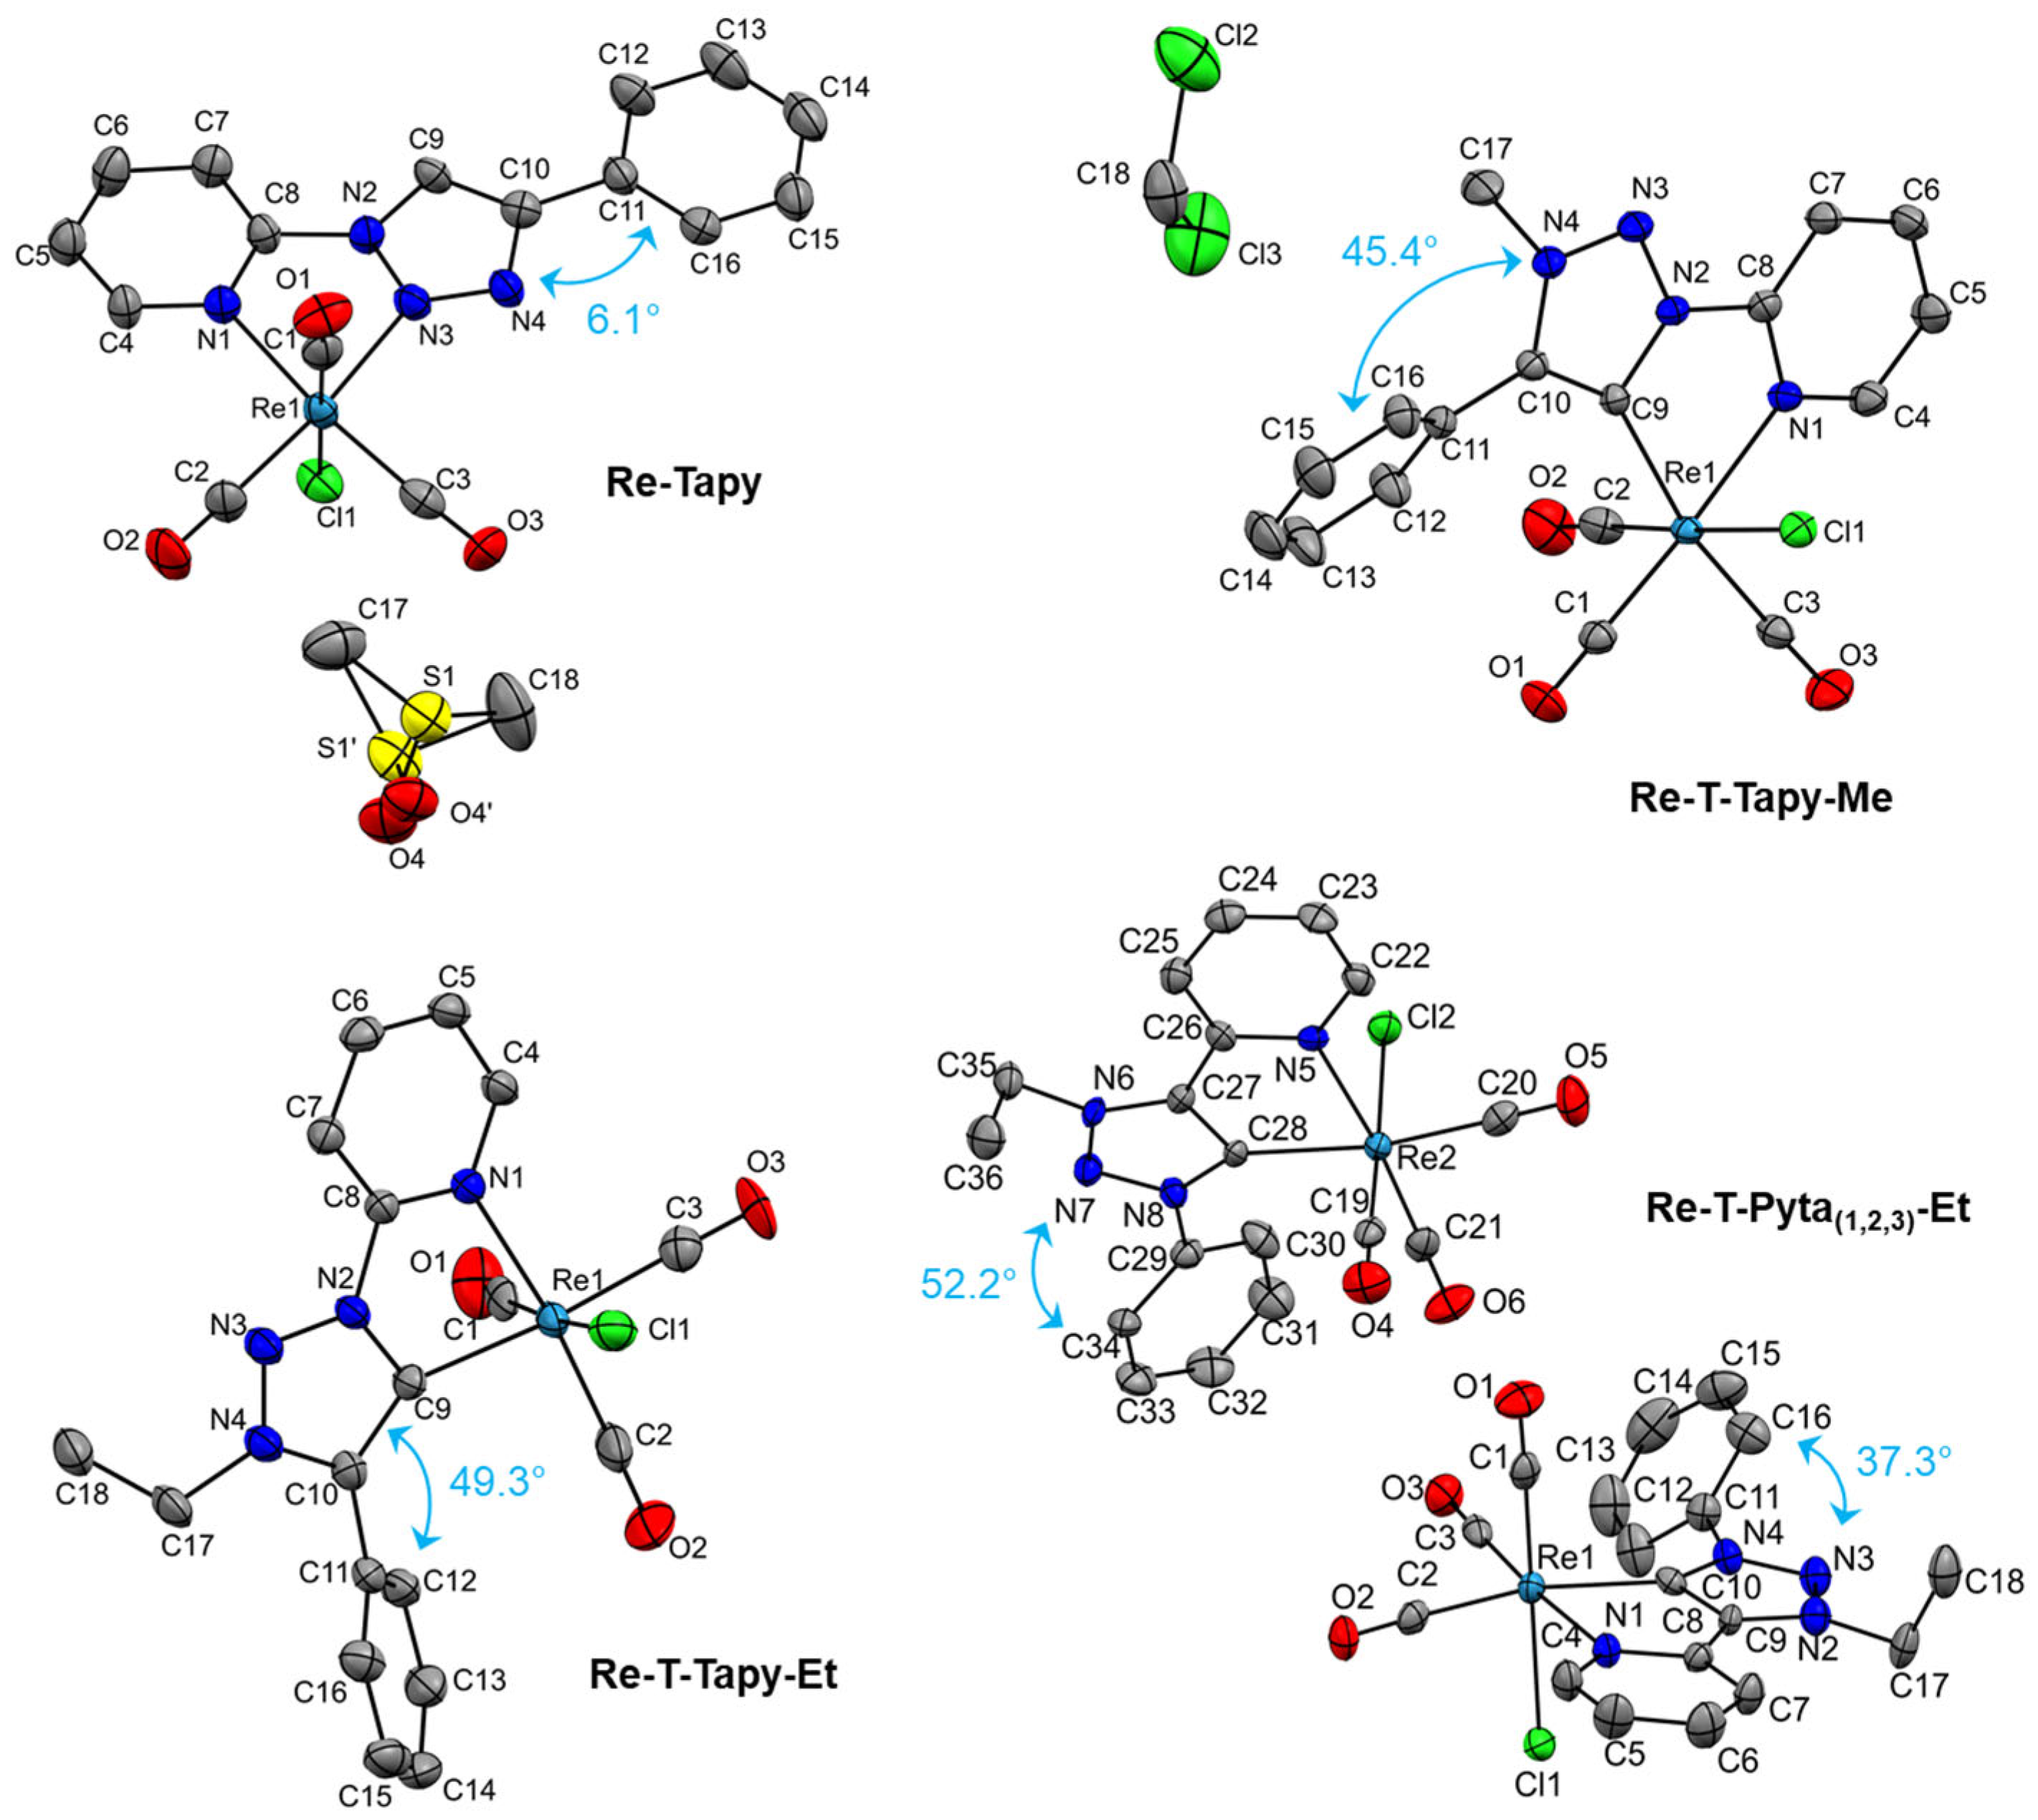
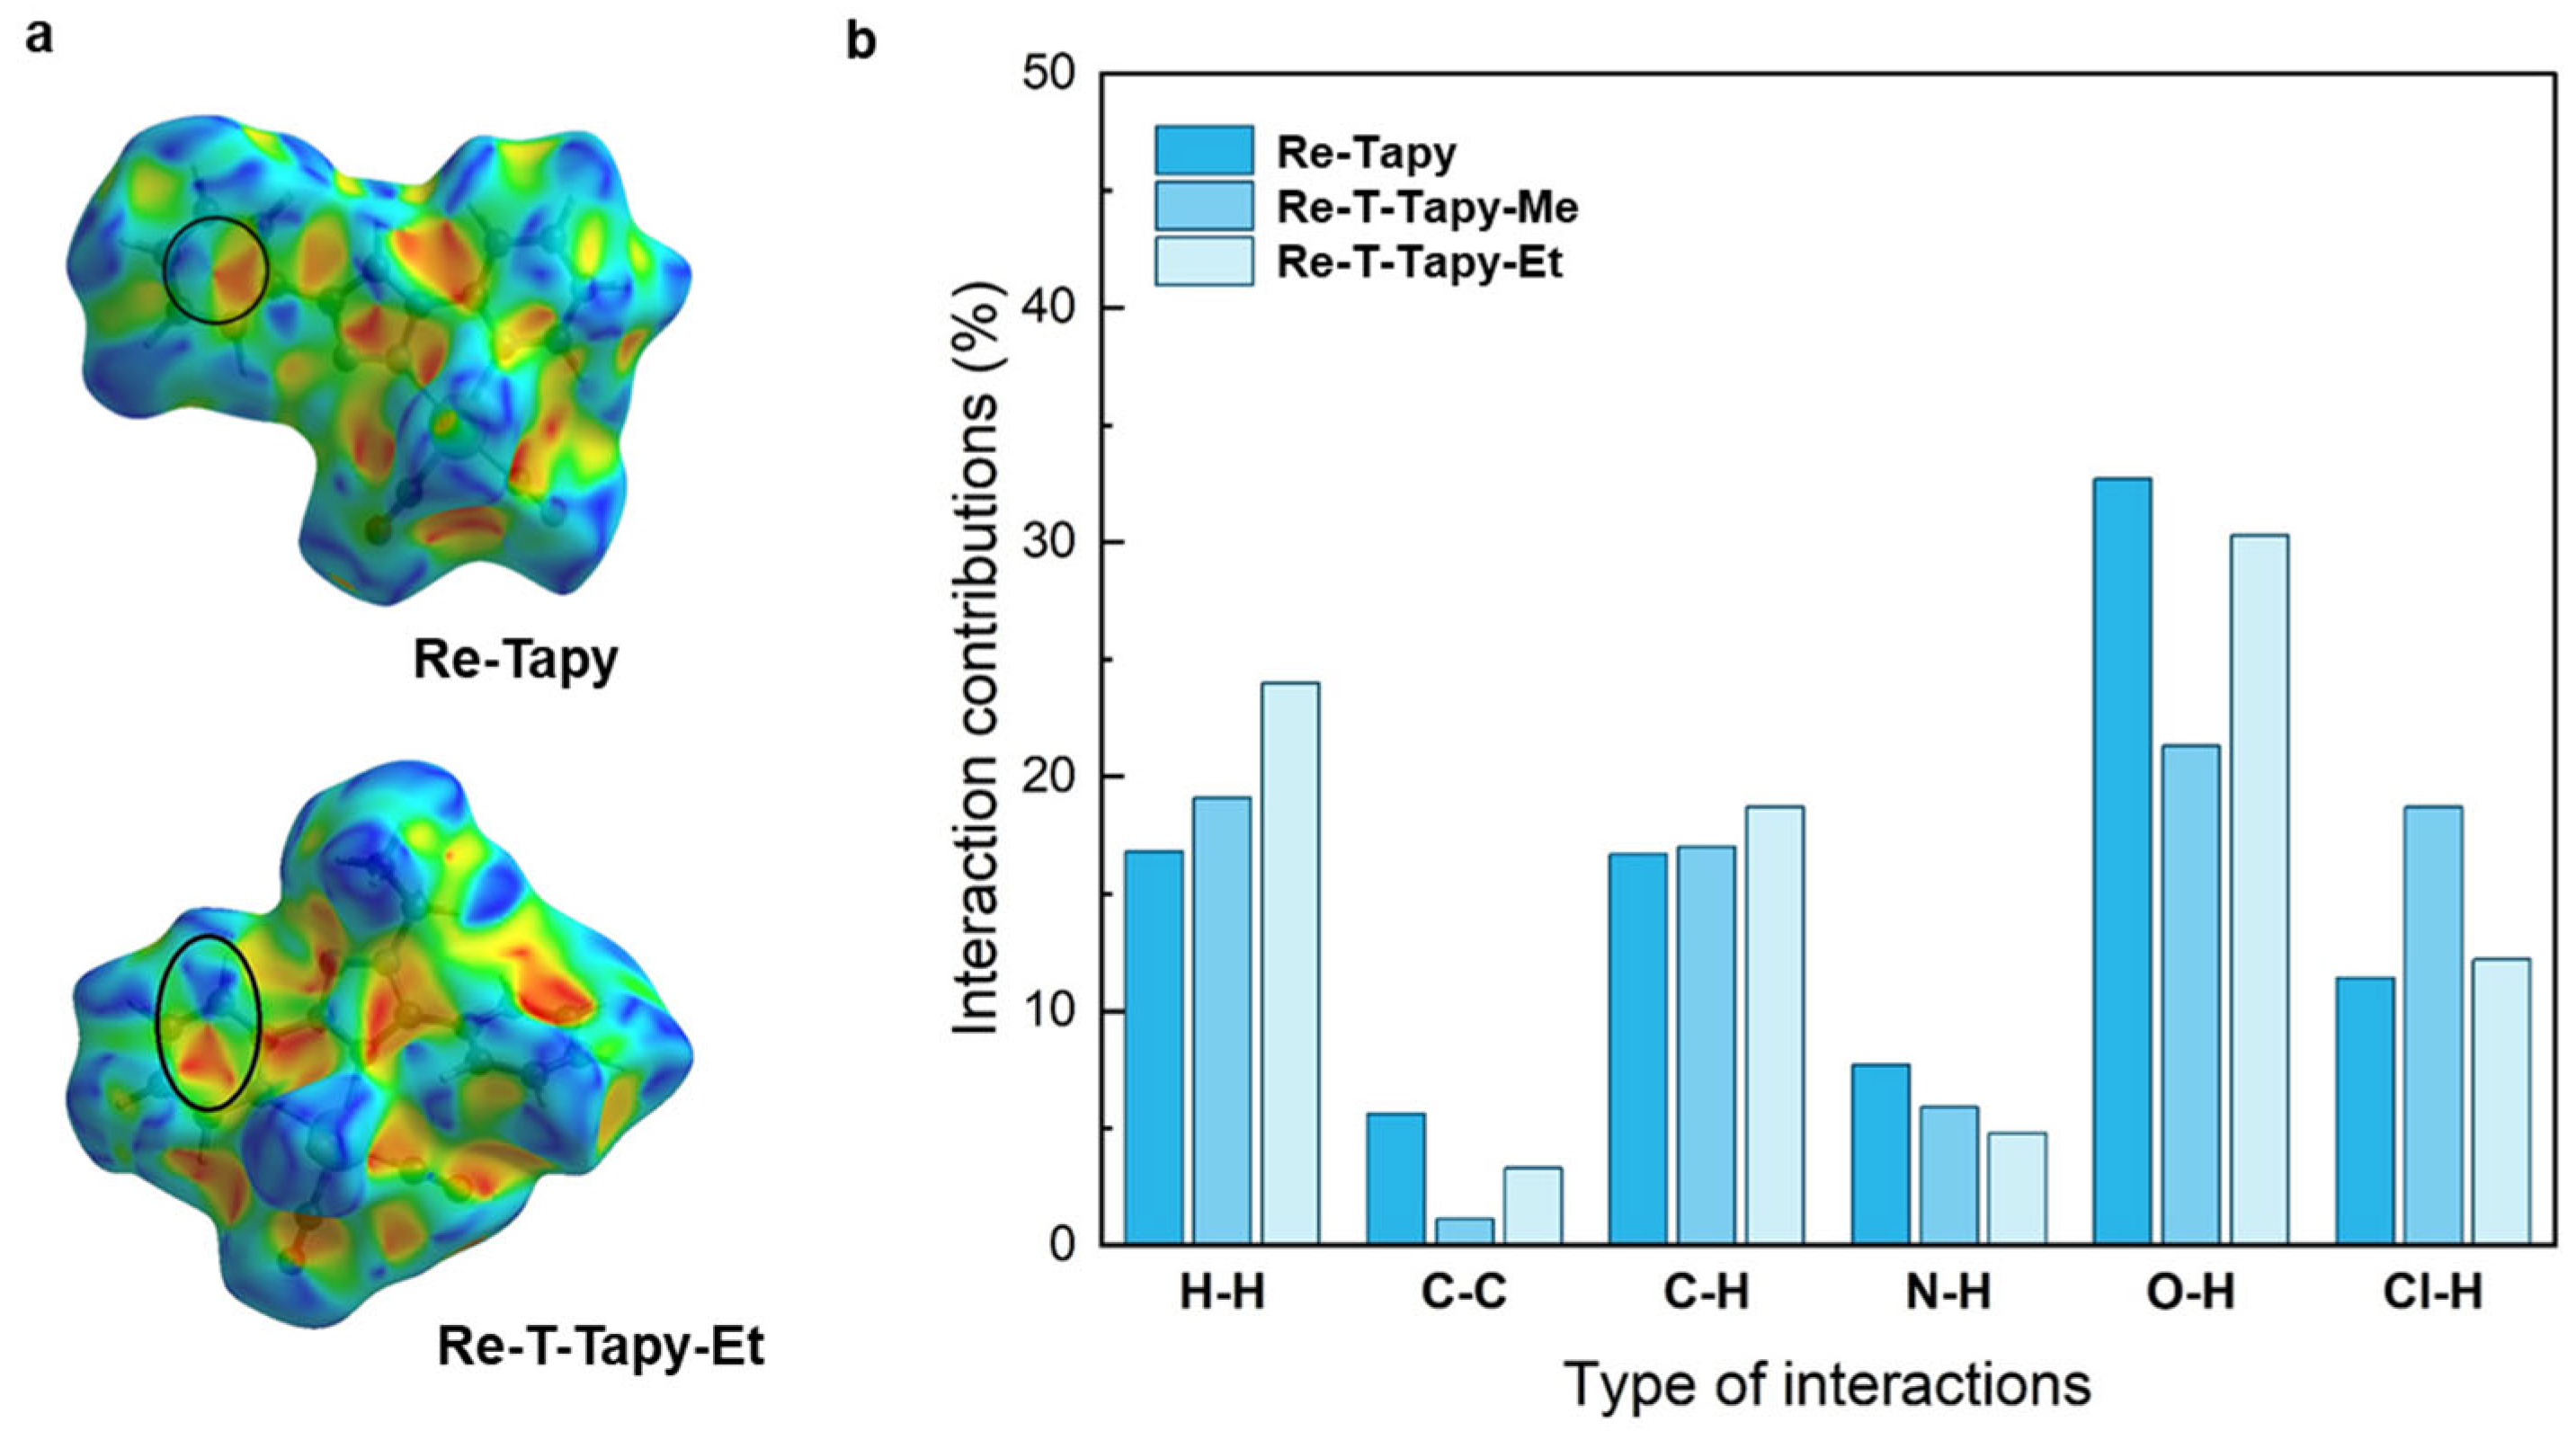
2.2. Crystal Structures
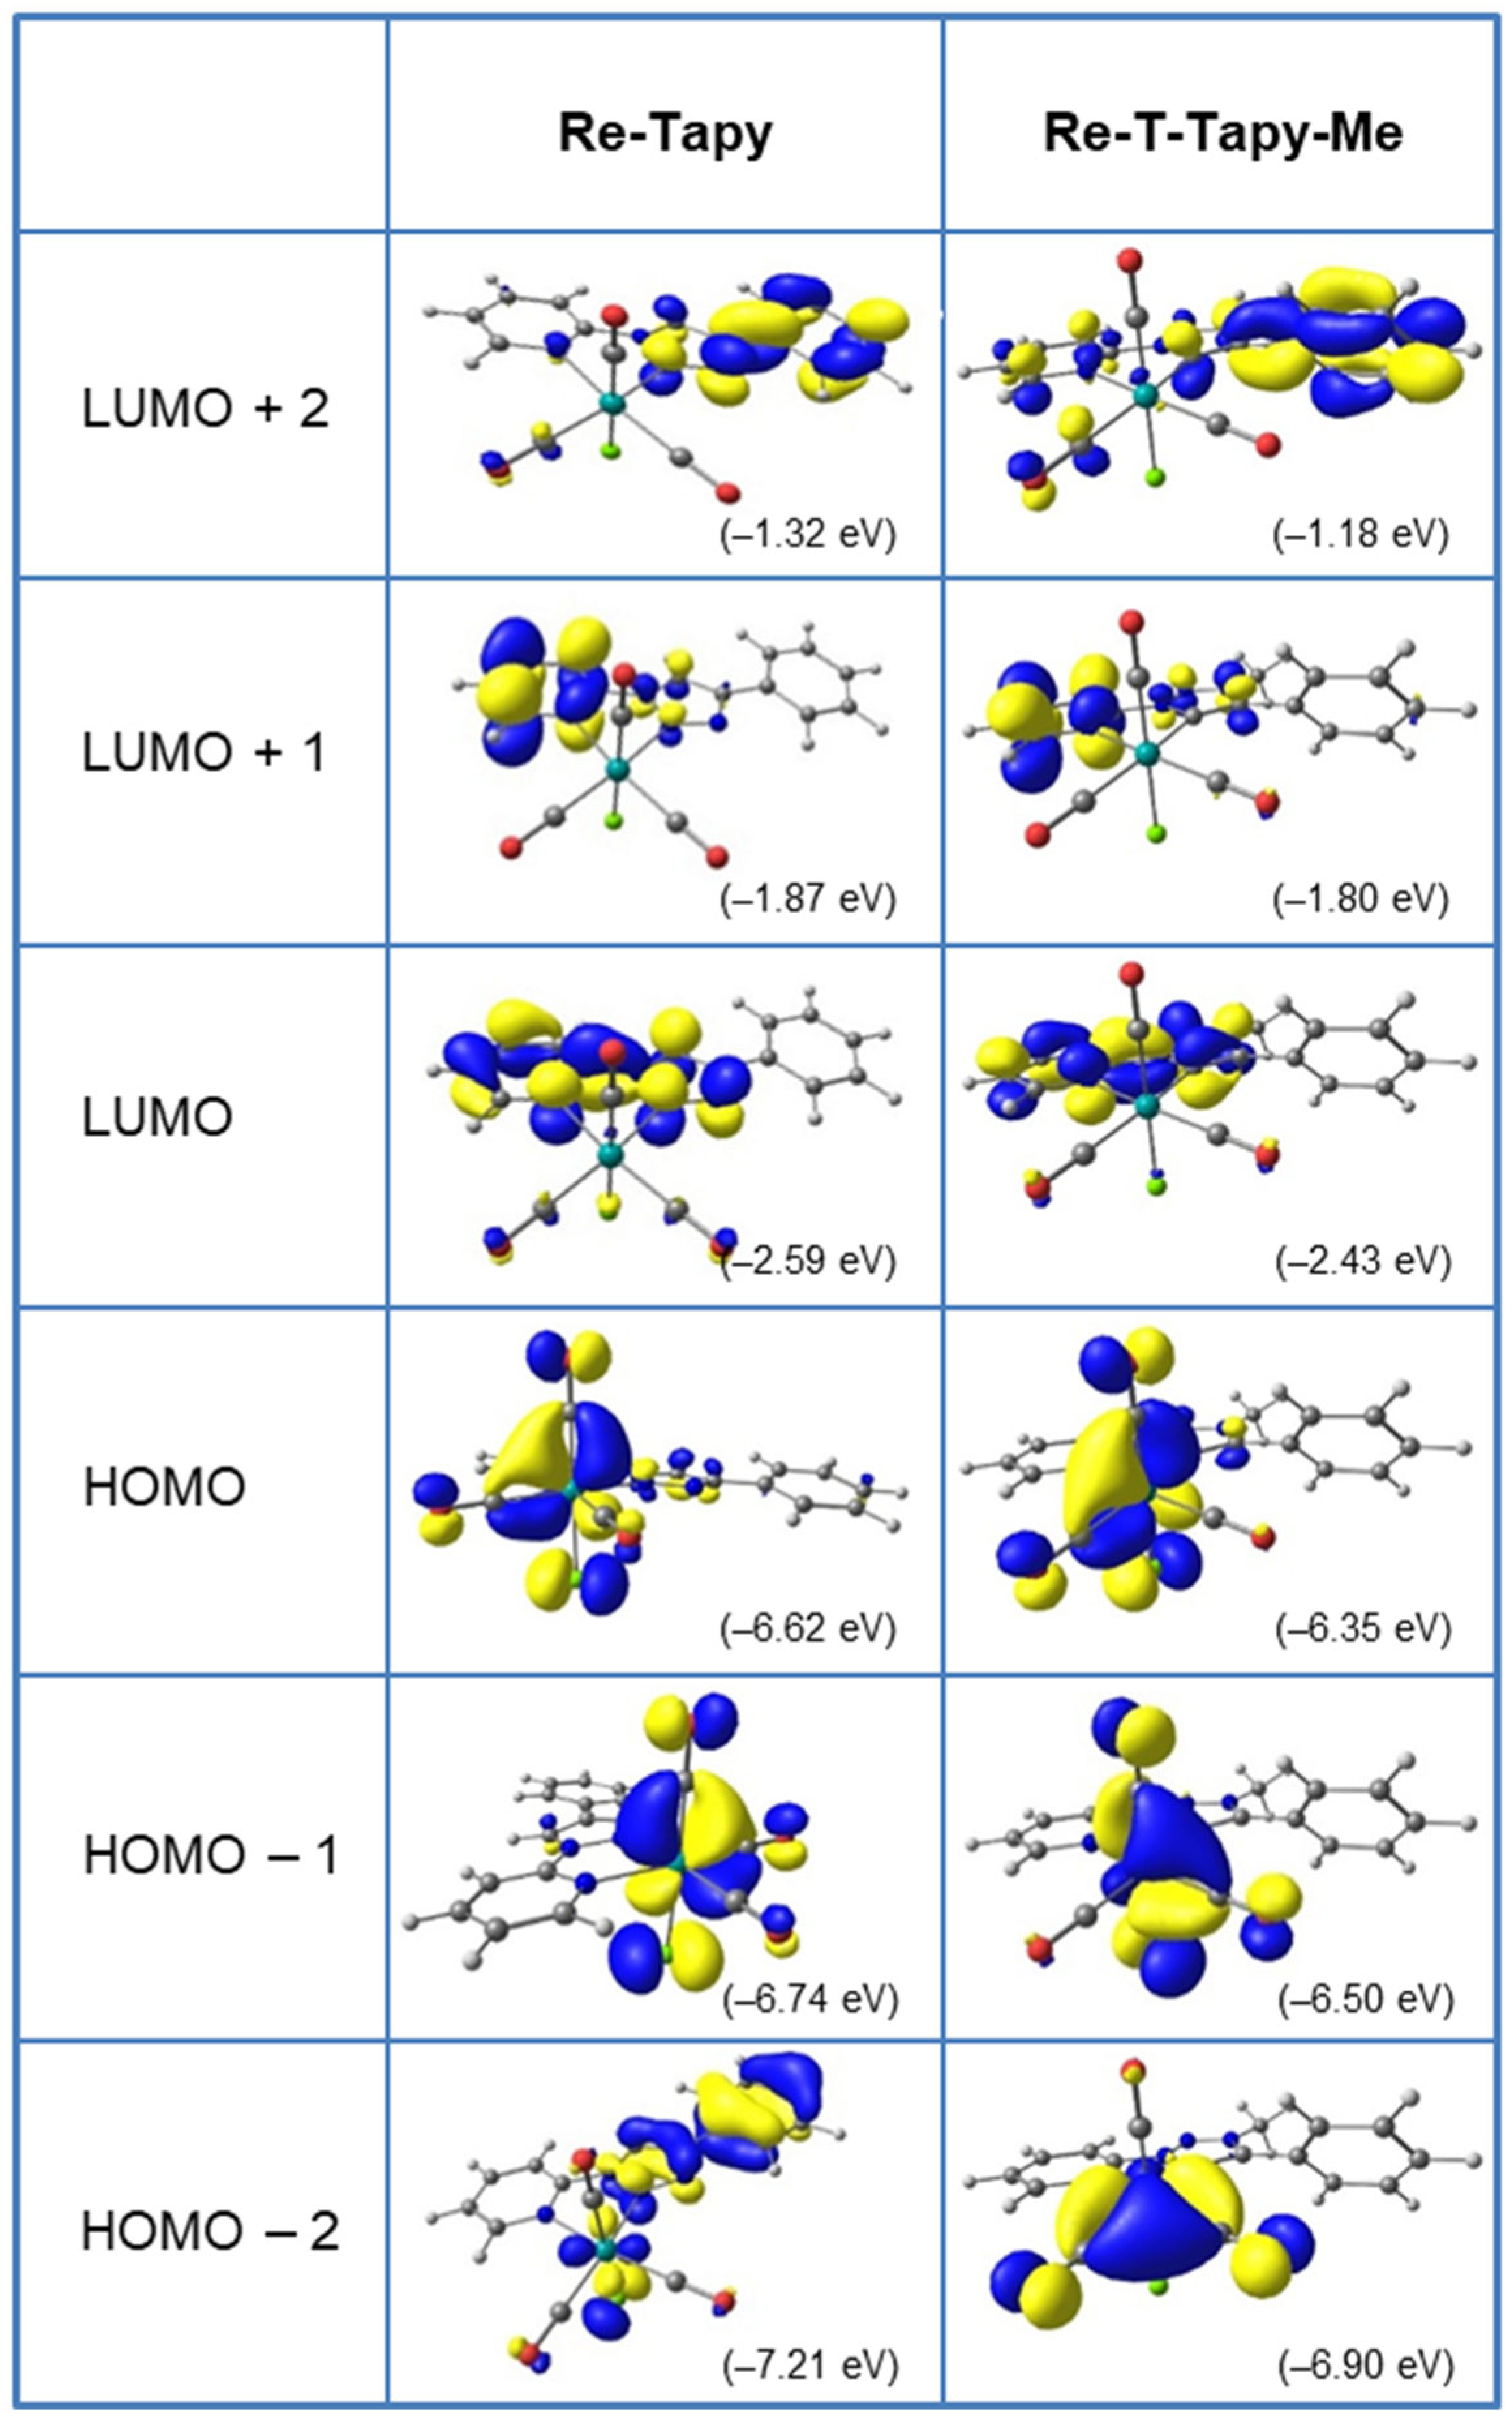
2.3. Electronic Properties
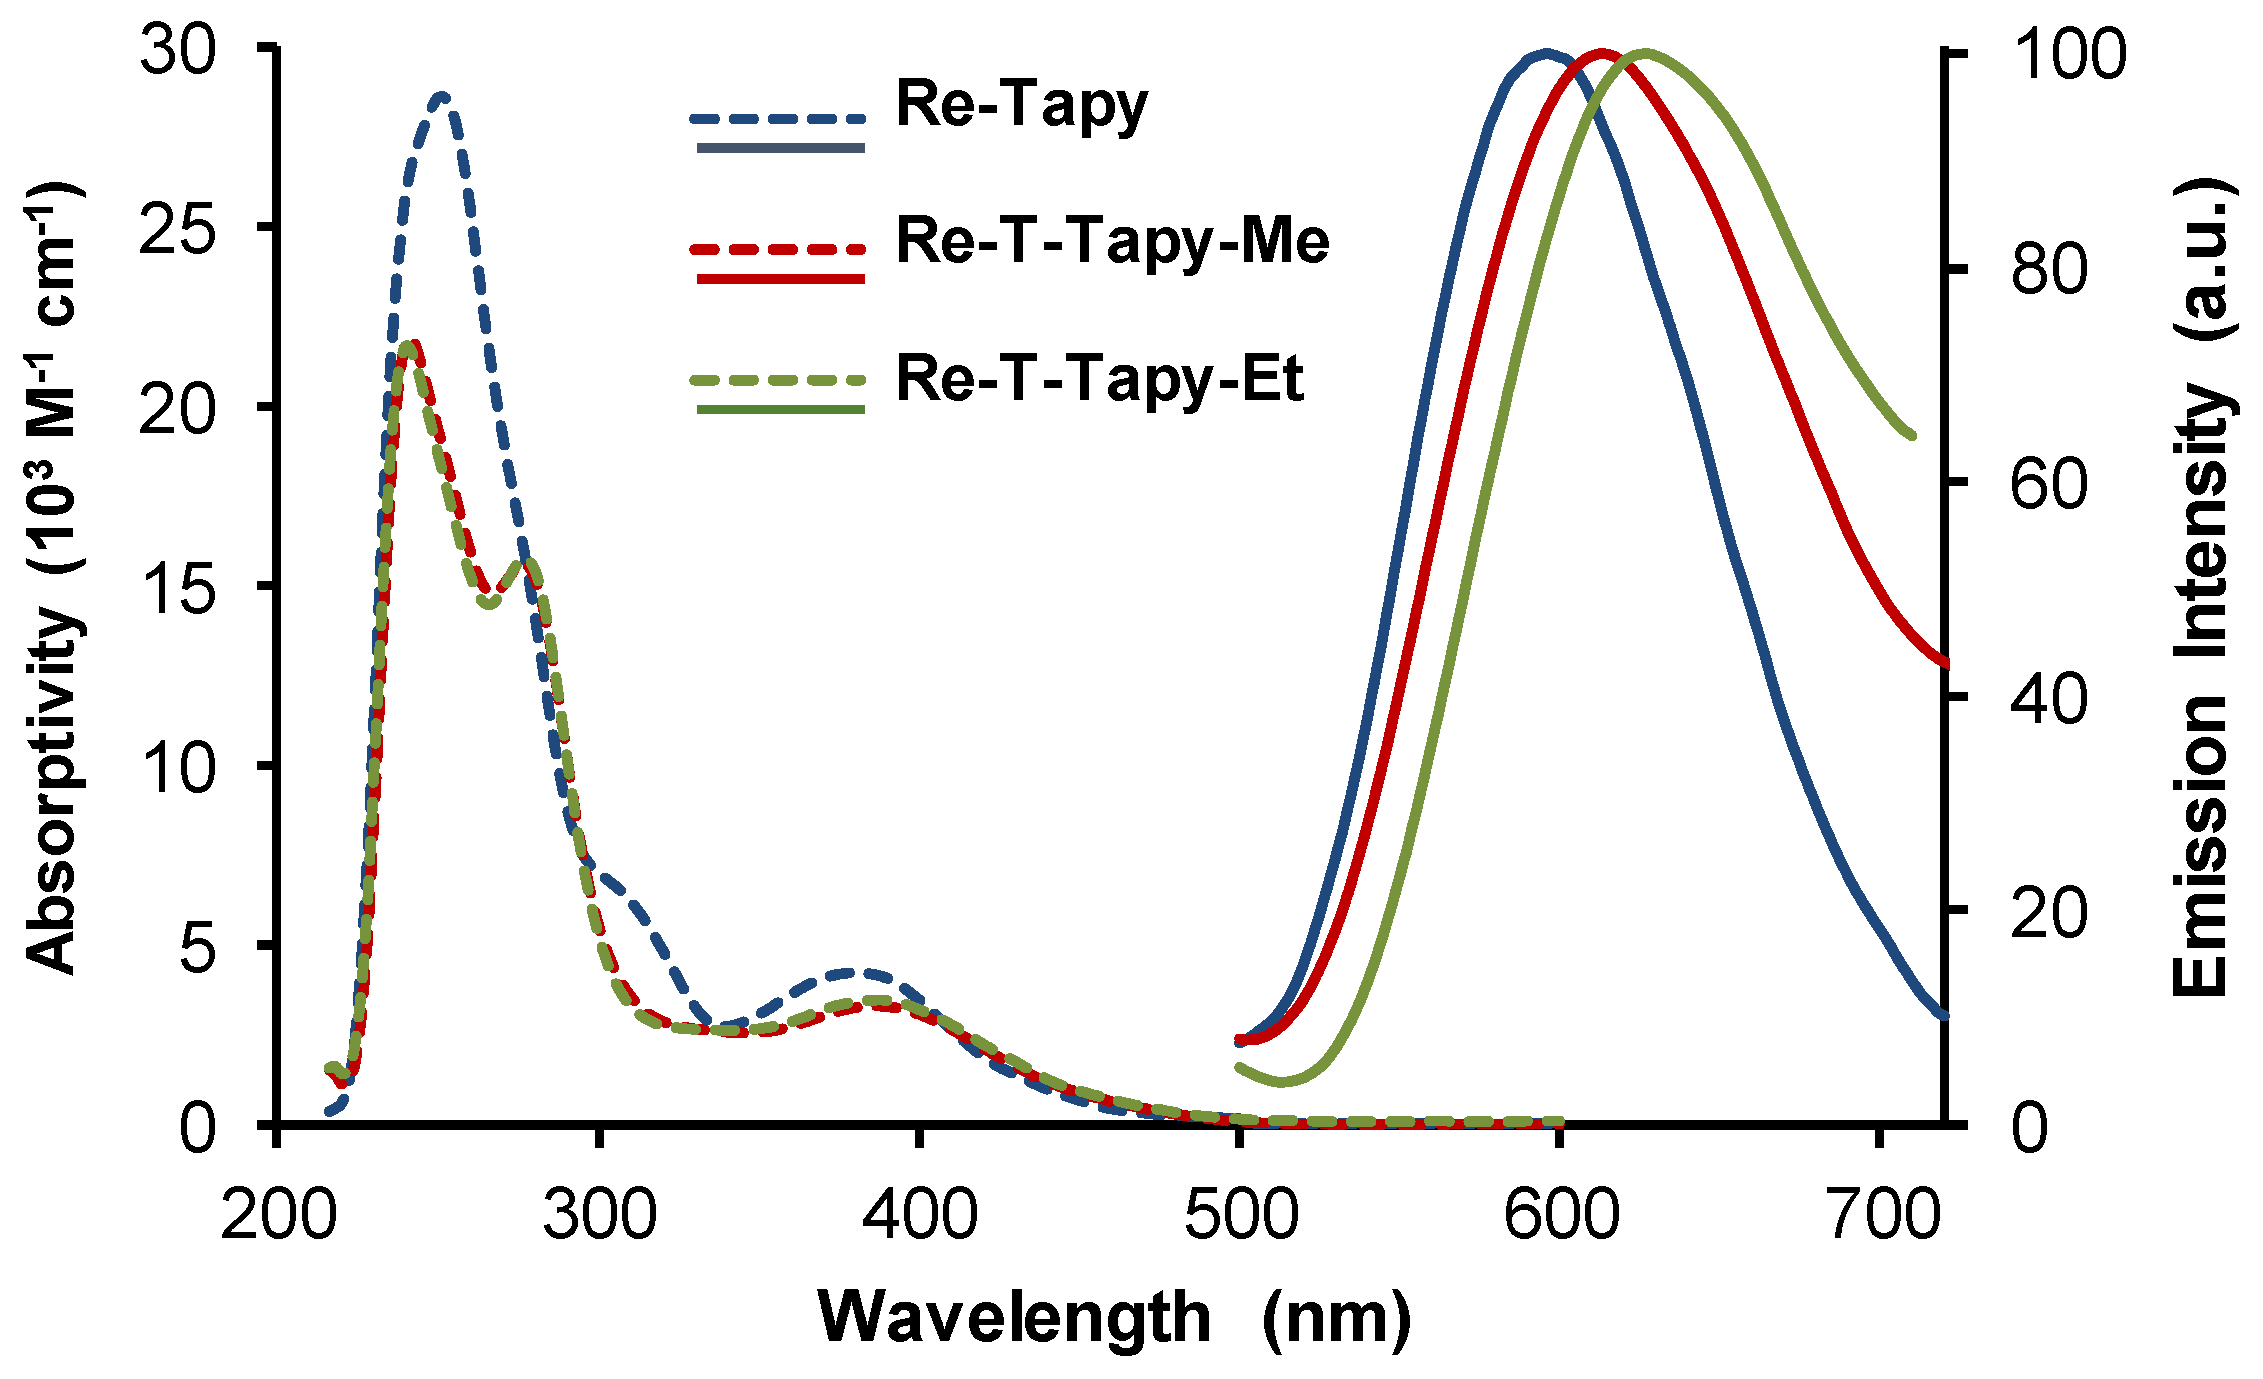
2.4. UV-Visible Absorption and Emission Properties
3. Conclusions
4. Experimental Section
4.1. General Methods
4.2. Synthesis
- 2-(1-phenyl-1H-1,2,3-triazol-4-yl)pyridine-N-oxide, (1)
- 3-Ethyl-1-phenyl-4-(pyridin-2-yl)-1H-1,2,3-triazolium tetrafluoroborate, (L-T-Pyta(1,2,3)-Et)
- Tricarbonylrhenium(I) complex [Re(CO)3(L-T-pyta(1,2,3)-Et)Cl], (Re-T-Pyta(1,2,3)-Et)
- 3-Methyl-4-phenyl-1-(pyridin-2-yl)-1H-1,2,3-triazol-3-ium triflate, (L-T-Tapy-Me)
- 3-Ethyl-4-phenyl-1-(pyridin-2-yl)-1H-1,2,3-triazol-3-ium tetrafluoroborate, (L-T-Tapy-Et)
- Tricarbonylrhenium(I) complex [Re(CO)3(L-T-tapy-Me)Cl], (Re-T-Tapy-Me)
- Tricarbonylrhenium(I) complex [Re(CO)3(L-T-Tapy-Me)Cl], (Re-T-Tapy-Et)
4.3. Crystallography
4.4. Computational Details
4.5. Spectroscopy
Supplementary Materials
Author Contributions
Funding
Data Availability Statement
Acknowledgments
Conflicts of Interest
References
- Gierschner, J.; Shi, J.; Milián-Medina, B.; Roca-Sanjuán, D.; Varghese, S.; Park, S.Y. Luminescence in Crystalline Organic Materials: From Molecules to Molecular Solids. Adv. Opt. Mater. 2021, 9, 2002251. [Google Scholar] [CrossRef]
- Alam, P.; Climent, C.; Alemany, P.; Laskar, I.R. “Aggregation-induced emission” of transition metal compounds: Design, mechanistic insights, and applications. J. Photochem. Photobiol. C Photochem. Rev. 2019, 41, 100317. [Google Scholar] [CrossRef]
- Ravotto, L.; Ceroni, P. Aggregation induced phosphorescence of metal complexes: From principles to applications. Coord. Chem. Rev. 2017, 346, 62–76. [Google Scholar] [CrossRef]
- Sathish, V.; Ramdass, A.; Thanasekaran, P.; Lu, K.-L.; Rajagopal, S. Aggregation-induced phosphorescence enhancement (AIPE) based on transition metal complexes—An overview. J. Photochem. Photobiol. C Photochem. Rev. 2015, 23, 25–44. [Google Scholar] [CrossRef]
- Ma, L.; Wang, Y.; Wang, X.; Zhu, Q.; Wang, Y.; Li, L.; Cheng, H.-B.; Zhang, J.; Liang, X.-J. Transition metal complex-based smart AIEgens explored for cancer diagnosis and theranostics. Coord. Chem. Rev. 2022, 473, 214822. [Google Scholar] [CrossRef]
- Shen, H.; Xu, C.; Sun, F.; Zhao, M.; Wu, Q.; Zhang, J.; Li, S.; Zhang, J.; Lam, J.W.Y.; Tang, B.Z. Metal-Based Aggregation-Induced Emission Theranostic Systems. ChemMedChem 2022, 17, e202100578. [Google Scholar] [CrossRef]
- Mauro, M.; Yang, C.-H.; Shin, C.-Y.; Panigati, M.; Chang, C.-H.; D’Alfonso, G.; De Cola, L. Phosphorescent Organic Light-Emitting Diodes with Outstanding External Quantum Efficiency Using Dinuclear Rhenium Complexes as Dopants. Adv. Mater. 2012, 24, 2054–2059. [Google Scholar] [CrossRef]
- Klemens, T.; Świtlicka-Olszewska, A.; Machura, B.; Grucela, M.; Schab-Balcerzak, E.; Smolarek, K.; Mackowski, S.; Szlapa, A.; Kula, S.; Krompiec, S.; et al. Rhenium(I) terpyridine complexes—Synthesis, photophysical properties and application in organic light emitting devices. Dalton Trans. 2016, 45, 1746–1762. [Google Scholar] [CrossRef]
- Klemens, T.; Świtlicka, A.; Kula, S.; Siwy, M.; Łaba, K.; Grzelak, J.; Szalkowski, M.; Maćkowski, S.; Schab-Balcerzak, E.; Machura, B. The effect of 2-, 3- and 4-pyridyl substituents on photophysics of fac-[ReCl(CO)3(n-pytpy-κ2N)] complexes: Experimental and theoretical insights. J. Lumin. 2019, 209, 346–356. [Google Scholar] [CrossRef]
- Klemens, T.; Świtlicka, A.; Machura, B.; Kula, S.; Krompiec, S.; Łaba, K.; Korzec, M.; Siwy, M.; Janeczek, H.; Schab-Balcerzak, E.; et al. A family of solution processable ligands and their Re(I) complexes towards light emitting applications. Dyes Pigments 2019, 163, 86–101. [Google Scholar] [CrossRef]
- Klemens, T.; Czerwińska, K.; Szlapa-Kula, A.; Kula, S.; Świtlicka, A.; Kotowicz, S.; Siwy, M.; Bednarczyk, K.; Krompiec, S.; Smolarek, K.; et al. Synthesis, spectroscopic, electrochemical and computational studies of rhenium(I) tricarbonyl complexes based on bidentate-coordinated 2,6-di(thiazol-2-yl)pyridine derivatives. Dalton Trans. 2017, 46, 9605–9620. [Google Scholar] [CrossRef] [PubMed]
- Maroń, A.M.; Szlapa-Kula, A.; Matussek, M.; Kruszynski, R.; Siwy, M.; Janeczek, H.; Grzelak, J.; Maćkowski, S.; Schab-Balcerzak, E.; Machura, B. Photoluminescence enhancement of Re(I )carbonyl complexes bearing D–A and D–π–A ligands. Dalton Trans. 2020, 49, 4441–4453. [Google Scholar] [CrossRef] [PubMed]
- Choroba, K.; Maroń, A.; Świtlicka, A.; Szłapa-Kula, A.; Siwy, M.; Grzelak, J.; Maćkowski, S.; Pedzinski, T.; Schab-Balcerzak, E.; Machura, B. Carbazole effect on ground- and excited-state properties of rhenium(I) carbonyl complexes with extended terpy-like ligands. Dalton Trans. 2021, 50, 3943–3958. [Google Scholar] [CrossRef] [PubMed]
- Choroba, K.; Kotowicz, S.; Maroń, A.; Świtlicka, A.; Szłapa-Kula, A.; Siwy, M.; Grzelak, J.; Sulowska, K.; Maćkowski, S.; Schab-Balcerzak, E.; et al. Ground- and excited-state properties of Re(I) carbonyl complexes—Effect of triimine ligand core and appended heteroaromatic groups. Dyes Pigments 2021, 192, 109472. [Google Scholar] [CrossRef]
- Sathish, V.; Babu, E.; Ramdass, A.; Lu, Z.-Z.; Velayudham, M.; Thanasekaran, P.; Lu, K.-L.; Rajagopal, S. Alkoxy bridged binuclear rhenium (I) complexes as a potential sensor for β-amyloid aggregation. Talanta 2014, 130, 274–279. [Google Scholar] [CrossRef]
- Sathish, V.; Ramdass, A.; Lu, Z.-Z.; Velayudham, M.; Thanasekaran, P.; Lu, K.-L.; Rajagopal, S. Sensing of insulin fibrillation using alkoxy-bridged binuclear rhenium(I) complexes. Inorg. Chem. Commun. 2016, 73, 49–51. [Google Scholar] [CrossRef]
- Gabr, M.T.; Pigge, F.C. Rhenium tricarbonyl complexes of AIE active tetraarylethylene ligands: Tuning luminescence properties and HSA-specific binding. Dalton Trans. 2017, 46, 15040–15047. [Google Scholar] [CrossRef]
- Gabr, M.T.; Pigge, F.C. Rhenium Complexes of Bis(benzothiazole)-Based Tetraarylethylenes as Selective Luminescent Probes for Amyloid Fibrils. Chem. Eur. J. 2018, 24, 11729–11737. [Google Scholar] [CrossRef]
- Vanucci-Bacqué, C.; Guilbaud, V.; Deleuzière, M.; Serpentini, C.-L.; Bedos-Belval, F.; Benoist, E.; Fery-Forgues, S. Tricarbonylrhenium(I) complexes with aggregation-induced emission (AIE) properties: Application to the selective detection of heparin and its main contaminant. Spectrochim. Acta Part A Mol. Biomol. Spectrosc. 2025, 334, 125932. [Google Scholar] [CrossRef]
- Ramdass, A.; Sathish, V.; Thanasekaran, P. AIE or AIE(P)E-active transition metal complexes for highly sensitive detection of nitroaromatic explosives. Res. Chem. 2022, 4, 100337. [Google Scholar] [CrossRef]
- Nurnabi, M.; Gurusamy, S.; Wu, J.-Y.; Lee, C.-C.; Sathiyendiran, M.; Huang, S.-M.; Chang, C.-H.; Chao, I.; Lee, G.-H.; Peng, S.-M.; et al. Aggregation-induced emission enhancement (AIEE) of tetrarhenium(I) metallacycles and their application as luminescent sensors for nitroaromatics and antibiotics. Dalton Trans. 2023, 52, 1939–1949. [Google Scholar] [CrossRef] [PubMed]
- Tao, T.; Fang, H.; Peng, Y.-X.; Zhang, M.-D.; Huang, W. Synthesis, aggregation-induced emission and application as chemosensor for explosives of a 1,10-phenanthroline derivative and its rhenium(I) carbonyl complex having triphenylamino and thienyl donors. Inorg. Chem. Commun. 2017, 84, 15–19. [Google Scholar] [CrossRef]
- Calupitan, J.P.; Poirot, A.; Wang, J.; Delavaux-Nicot, B.; Wolff, M.; Jaworska, M.; Métivier, R.; Benoist, E.; Allain, C.; Fery-Forgues, S. Mechanical Modulation of the Solid-State Luminescence of Tricarbonyl Rhenium(I) Complexes through the Interplay between Two Triplet Excited States. Chem. Eur. J. 2021, 27, 4191–4196. [Google Scholar] [CrossRef]
- Poirot, A.; Vanucci-Bacqué, C.; Delavaux-Nicot, B.; Leygue, N.; Saffon-Merceron, N.; Alary, F.; Bedos-Belval, F.; Benoist, E.; Fery-Forgues, S. Phenyl-pyta-tricarbonylrhenium(I) complexes: Combining a simplified structure and steric hindrance to modulate the photoluminescence properties. Dalton Trans. 2021, 50, 13686–13698. [Google Scholar] [CrossRef]
- Poirot, A.; Vanucci-Bacqué, C.; Delavaux-Nicot, B.; Saffon-Merceron, N.; Serpentini, C.-L.; Leygue, N.; Bedos-Belval, F.; Benoist, E.; Fery-Forgues, S. Luminescent fac-[ReX(CO)3(phenyl-pyta)] (X = Cl, Br, I) complexes: Influence of the halide ligand on the electronic properties in solution and in the solid state. Photochem. Photobiol. Sci. 2023, 22, 169–184. [Google Scholar] [CrossRef]
- Poirot, A.; Leygue, N.; Delavaux-Nicot, B.; Saffon-Merceron, N.; Allain, C.; Benoist, E.; Fery-Forgues, S. Tuning the photoluminescence properties of SLE- and MRL-active tricarbonylrhenium(I) complexes through minor structural changes of the organic ligand. J. Photochem. Photobiol. A Chem. 2023, 445, 114982. [Google Scholar] [CrossRef]
- Le Garrec, S.; Martins-Bessa, D.; Wolff, M.; Delavaux-Nicot, B.; Mallet-Ladeira, S.; Serpentini, C.-L.; Benoist, E.; Bedos-Belval, F.; Fery-Forgues, S. Dinuclear tricarbonylrhenium(I) complexes: Impact of regioisomerism on the photoluminescence properties. Dalton Trans. 2024, 53, 16512–16529. [Google Scholar] [CrossRef]
- Wang, X.-Y.; Lv, L.; Sun, L.; Hou, Y.; Hou, Z.; Chen, Z. Recent Advances in Mechanochromism of Metal-Organic Compounds. Front. Chem. 2022, 10, 865198. [Google Scholar] [CrossRef]
- Xue, P.; Ding, J.; Wang, P.; Lu, R. Recent progress in the mechanochromism of phosphorescent organic molecules and metal complexes. J. Mater. Chem. C 2016, 4, 6688–6706. [Google Scholar] [CrossRef]
- Szłapa-Kula, A.; Małecka, M.; Maroń, A.M.; Janeczek, H.; Siwy, M.; Schab-Balcerzak, E.; Szalkowski, M.; Maćkowski, S.; Pedzinski, T.; Erfurt, K.; et al. In-Depth Studies of Ground- and Excited-State Properties of Re(I) Carbonyl Complexes Bearing 2,2′:6′,2″-Terpyridine and 2,6-Bis(pyrazin-2-yl)pyridine Coupled with π-Conjugated Aryl Chromophores. Inorg. Chem. 2021, 60, 18726–18738. [Google Scholar] [CrossRef]
- Wang, J.; Delavaux-Nicot, B.; Wolff, M.; Mallet-Ladeira, S.; Métivier, R.; Benoist, E.; Fery-Forgues, S. The unsuspected influence of the pyridyl-triazole ligand isomerism upon the electronic properties of tricarbonyl rhenium complexes: An experimental and theoretical insight. Dalton Trans. 2018, 47, 8087–8099. [Google Scholar] [CrossRef] [PubMed]
- Vanucci-Bacqué, C.; Wolff, M.; Delavaux-Nicot, B.; Abdallah, A.M.; Mallet-Ladeira, S.; Serpentini, C.-L.; Bedos-Belval, F.; Fong, K.W.; Ng, X.Y.; Low, M.L.; et al. 1,2,3-Triazol-5-ylidene- vs. 1,2,3-triazole-based tricarbonylrhenium(I) complexes: Influence of a mesoionic carbene ligand on the electronic and biological properties. Dalton Trans. 2024, 53, 11276–11294. [Google Scholar] [CrossRef] [PubMed]
- Wang, J.; Poirot, A.; Delavaux-Nicot, B.; Wolff, M.; Mallet-Ladeira, S.; Calupitan, J.P.; Allain, C.; Benoist, E.; Fery-Forgues, S. Optimization of aggregation-induced phosphorescence enhancement in mononuclear tricarbonyl rhenium(I) complexes: The influence of steric hindrance and isomerism. Dalton Trans. 2019, 48, 15906–15916. [Google Scholar] [CrossRef] [PubMed]
- Vorobyeva, S.N.; Bautina, S.A.; Shekhovtsov, N.A.; Nikolaenkova, E.B.; Sukhikh, T.S.; Golubeva, Y.A.; Klyushova, L.S.; Krivopalov, V.P.; Rakhmanova, M.I.; Gourlaouen, C.; et al. N^N^C-Cyclometalated rhodium(iii) complexes with isomeric pyrimidine-based ligands: Unveiling the impact of isomerism on structural motifs, luminescence and cytotoxicity. Dalton Trans. 2024, 53, 8398–8416. [Google Scholar] [CrossRef]
- Li, G.; Yang, T.; Shao, K.; Gao, Y.; Shan, G.; Su, Z.; Wang, X.; Zhu, D. Understanding Mechanochromic Luminescence on Account of Molecular Level Based on Phosphorescent Iridium(III) Complex Isomers. Inorg. Chem. 2021, 60, 3741–3748. [Google Scholar] [CrossRef]
- Maity, R.; Sarkar, B. Chemistry of Compounds Based on 1,2,3-Triazolylidene-Type Mesoionic Carbenes. JACS Au 2022, 2, 22–57. [Google Scholar] [CrossRef]
- Vivancos, Á.; Segarra, C.; Albrecht, M. Mesoionic and Related Less Heteroatom-Stabilized N-Heterocyclic Carbene Complexes: Synthesis, Catalysis, and Other Applications. Chem. Rev. 2018, 118, 9493–9586. [Google Scholar] [CrossRef]
- Guisado-Barrios, G.; Soleilhavoup, M.; Bertrand, G. 1H-1,2,3-Triazol-5-ylidenes: Readily Available Mesoionic Carbenes. Acc. Chem. Res. 2018, 51, 3236–3244. [Google Scholar] [CrossRef]
- Suntrup, L.; Klenk, S.; Klein, J.; Sobottka, S.; Sarkar, B. Gauging Donor/Acceptor Properties and Redox Stability of Chelating Click-Derived Triazoles and Triazolylidenes: A Case Study with Rhenium(I) Complexes. Inorg. Chem. 2017, 56, 5771–5783. [Google Scholar] [CrossRef]
- Suntrup, L.; Stein, F.; Klein, J.; Wilting, A.; Parlane, F.G.L.; Brown, C.M.; Fiedler, J.; Berlinguette, C.P.; Siewert, I.; Sarkar, B. Rhenium Complexes of Pyridyl-Mesoionic Carbenes: Photochemical Properties and Electrocatalytic CO2 Reduction. Inorg. Chem. 2020, 59, 4215–4227. [Google Scholar] [CrossRef]
- Bertrand, H.C.; Clède, S.; Guillot, R.; Lambert, F.; Policar, C. Luminescence Modulations of Rhenium Tricarbonyl Complexes Induced by Structural Variations. Inorg. Chem. 2014, 53, 6204–6223. [Google Scholar] [CrossRef] [PubMed]
- He, M.; Ching, H.Y.V.; Policar, C.; Bertrand, H.C. Rhenium tricarbonyl complexes with arenethiolate axial ligands. New J. Chem. 2018, 42, 11312–11323. [Google Scholar] [CrossRef]
- Lo, W.K.C.; Huff, G.S.; Cubanski, J.R.; Kennedy, A.D.W.; McAdam, C.J.; McMorran, D.A.; Gordon, K.C.; Crowley, J.D. Comparison of Inverse and Regular 2-Pyridyl-1,2,3-triazole “Click” Complexes: Structures, Stability, Electrochemical and Photophysical Properties. Inorg. Chem. 2015, 54, 1572–1587. [Google Scholar] [CrossRef]
- Neumann, T.; Ramu, V.; Bertin, J.; He, M.; Vervisch, C.; Coogan, M.P.; Bertrand, H.C. Rhenium fac-Tricarbonyl Bisimine Chalcogenide Complexes: Synthesis, Photophysical Studies, and Confocal and Time-Resolved Cell Microscopy. Inorg. Chem. 2024, 63, 1197–1213. [Google Scholar] [CrossRef]
- Li, L.; Gomes, C.S.B.; Gomes, P.T.; Duarte, M.T.; Fan, Z. New tetradentate N,N,N,N-chelating α-diimine ligands and their corresponding zinc and nickel complexes: Synthesis, characterisation and testing as olefin polymerisation catalysts. Dalton Trans. 2011, 40, 3365–3380. [Google Scholar] [CrossRef]
- Bolje, A.; Košmrlj, J. A Selective Approach to Pyridine Appended 1,2,3-Triazolium Salts. Org. Lett. 2013, 15, 5084–5087. [Google Scholar] [CrossRef]
- Spackman, M.A.; Jayatilaka, D. Hirshfeld surface analysis. CrystEngComm 2009, 11, 19–32. [Google Scholar] [CrossRef]
- Martin, R.L. Natural Transition Orbitals. J. Chem. Phys. 2003, 118, 4775–4777. [Google Scholar] [CrossRef]
- Vaughan, J.G.; Reid, B.L.; Ramchandani, S.; Wright, P.J.; Muzzioli, S.; Skelton, B.W.; Raiteri, P.; Brown, D.H.; Stagni, S.; Massi, M. The photochemistry of rhenium(I) tricarbonyl N-heterocyclic carbene complexes. Dalton Trans. 2013, 42, 14100–14114. [Google Scholar] [CrossRef]
- Simpson, P.V.; Skelton, B.W.; Raiteria, P.; Massi, M. Photophysical and photochemical studies of tricarbonyl rhenium(I) N-heterocyclic carbine complexes containing azide and triazolate ligands. New J. Chem. 2016, 40, 5797–5807. [Google Scholar] [CrossRef]
- Mukuta, T.; Simpson, P.V.; Vaughan, J.G.; Skelton, B.W.; Stagni, S.; Massi, M.; Koike, K.; Ishitani, O.; Onda, K. Photochemical Processes in a Rhenium(I) Tricarbonyl N-Heterocyclic Carbene Complex Studied by Time-Resolved Measurements. Inorg. Chem. 2017, 56, 3404–3413. [Google Scholar] [CrossRef] [PubMed]
- Baková, R.; Chergui, M.; Daniel, C.; Vlček, A., Jr.; Zálĭs, S. Relativistic effects in spectroscopy and photophysics of heavy-metal complexes illustrated by spin–orbit calculations of [Re(imidazole)(CO)3(phen)]+. Coord. Chem. Rev. 2011, 255, 975–989. [Google Scholar] [CrossRef]
- Baiano, J.A.; Kessler, R.J.; Lumpkin, R.S.; Munlev, M.J.; Murphy, W.R. Nonradiative Decay in Rhenium(I) Monometallic Complexes of 2,3-Di(2-pyridyl)pyrazine and 2,3-Di(2-pyridyl)quinoxaline. J. Phys. Chem. 1995, 99, 17680–17690. [Google Scholar] [CrossRef]
- Worl, L.A.; Duesing, R.; Chen, P.; Della Ciana, L.; Meyer, T.J. Photophysical properties of polypyridyl carbonyl complexes of rhenium(I). J. Chem. Soc. Dalton Trans. 1991, 849–858. [Google Scholar] [CrossRef]
- Hino, J.K.; Della Ciana, L.; Dressick, W.J.; Sullivan, B.P. Substituent Constant Correlations as Predictors of Spectroscopic, Electrochemical, and Photophysical Properties in Ring-Substituted 2,2′-Bipyridine Complexes of Rhenium(I). Inorg. Chem. 1992, 31, 1072–1080. [Google Scholar] [CrossRef]
- Poirot, A.; Vanucci-Bacqué, C.; Delavaux-Nicot, B.; Meslien, C.; Saffon-Merceron, N.; Serpentini, C.-L.; Bedos-Belval, F.; Benoist, E.; Fery-Forgues, S. Using a diphenyl-bi-(1,2,4-triazole) tricarbonylrhenium(I) complex with intramolecular π–π stacking interaction for efficient solid-state luminescence enhancement. Dalton Trans. 2023, 52, 5453–5465. [Google Scholar] [CrossRef]
- Itokazu, M.K.; Polo, A.S.; Murakami Iha, N.Y. Luminescent rigidochromism of fac-[Re(CO)3(phen)(cis-bpe)]+ and its binuclear complex as photosensors. J. Photochem. Photobiol. A Chem. 2003, 160, 27–32. [Google Scholar] [CrossRef]
- Petyuk, M.Y.; Berezin, A.S.; Bagryanskaya, I.Y.; Artyushin, O.I.; Brel, V.K.; Artem’ev, A.V. A dinuclear Re(I) tricarbonyl complex showing thermochromic luminescence. Inorg. Chem. Commun. 2020, 119, 108058. [Google Scholar] [CrossRef]
- Fletcher, J.T.; Bumgarner, B.J.; Engels, N.D.; Skoglund, D.A. Multidentate 1,2,3-Triazole-Containing Chelators from Tandem Deprotection/Click Reactions of (Trimethylsilyl)alkynes and Comparison of Their Ruthenium(II) Complexes. Organometallics 2008, 27, 5430–5433. [Google Scholar] [CrossRef]
- SADABS, User Manual (Area Detector Absorption and Other Corrections) Version 2.03, Bruker Advanced X-Ray Solutions. Available online: https://xray.uky.edu/Resources/manuals/SADABS-manual.pdf (accessed on 1 April 2025).
- Sheldrick, G.M. SHELXT-Integrated space-group and crystal-structure determination. Acta Crystallogr. Sect. A Found. Adv. 2015, 71, 3–8. [Google Scholar] [CrossRef]
- Sheldrick, G.M. Crystal structure refinement with SHELXL. Acta Crystallogr. Sect. C Struct. Chem. 2015, 71, 3–8. [Google Scholar] [CrossRef] [PubMed]
- Spek, A.L. Single-crystal structure validation with the program PLATON. J. Appl. Crystallogr. 2003, 36, 7–13. [Google Scholar] [CrossRef]
- Etter, M.C. Encoding and decoding hydrogen-bond patterns of organic compounds. Acc. Chem. Res. 1990, 23, 120–126. [Google Scholar] [CrossRef]
- Etter, M.C.; MacDonald, J.C.; Bernstein, J. Graph-set analysis of hydrogen-bond patterns in organic crystals. Acta Crystallogr. Sect. B Struct. Sci. Cryst. Eng. Mater. 1990, 46, 256–262. [Google Scholar] [CrossRef]
- Bernstein, J.B.; Davis, R.E.; Shimoni, L.; Chang, N. Patterns in Hydrogen Bonding: Functionality and Graph Set Analysis in Crystals. Angew. Chem. Int. Ed. Engl. 1995, 34, 1555–1573. [Google Scholar] [CrossRef]
- Grell, J.; Bernstein, J.; Tinhofer, G. Graph-set analysis of hydrogen-bond patterns: Some mathematical concepts. Acta Crystallogr. Sect. B Struct. Sci. Cryst. Eng. Mater. 1999, 55, 1030–1043. [Google Scholar] [CrossRef]
- Motherwell, W.D.S.; Shields, G.P.; Allen, F.H. Visualization and characterization of non-covalent networks in molecular crystals: Automated assignment of graph-set descriptors for asymmetric molecules. Acta Crystallogr. Sect. B Struct. Sci. Cryst. Eng. Mater 1999, 55, 1044–1056. [Google Scholar] [CrossRef]
- Spackman, M.A.; McKinnon, J.J. Fingerprinting intermolecular interactions in molecular crystals. CrystEngComm 2002, 4, 378–392. [Google Scholar] [CrossRef]
- Spackman, P.R.; Turner, M.J.; McKinnon, J.J.; Wolff, S.K.; Grimwood, D.J.; Jayatilaka, D.; Spackman, M.A. CrystalExplorer: A program for Hirshfeld surface analysis, visualization and quantitative analysis of molecular crystals. J. Appl. Crystallogr. 2021, 54, 1006–1011. [Google Scholar] [CrossRef]
- Frisch, M.J.; Trucks, G.; Schlegel, H.B.; Scuseria, G.E. Gaussian 16, Revision C.01; Gaussian, Inc.: Wallingford, CT, USA, 2016. [Google Scholar]
- Zhurko, G.; Zhurko, D. ChemCraft 1.8. Available online: https://www.chemcraftprog.com/index.html (accessed on 28 November 2024).
- Perdew, J.P.; Burke, K.; Ernzerhof, M. Generalized Gradient Approximation Made Simple. Phys. Rev. Lett. 1996, 77, 3865–3868. [Google Scholar] [CrossRef]
- Hay, P.J.; Wadt, W.R. Ab initio effective core potentials for molecular calculations. Potentials for the transition metal atoms Sc to Hg. J. Chem. Phys. 1985, 82, 270–283. [Google Scholar] [CrossRef]
- Hay, P.J.; Wadt, W.R. Ab initio effective core potentials for molecular calculations. Potentials for K to Au including the outermost core orbitals. J. Chem. Phys. 1985, 82, 299–310. [Google Scholar] [CrossRef]
- Hehre, W.J.; Radom, L.; Schleyer, P.V.R.; Pople, J.A. Ab Initio Molecular Orbital Theory; John Wiley & Sons, Inc.: New York, NY, USA, 1986. [Google Scholar]
- Barone, V.; Cossi, M. Quantum Calculation of Molecular Energies and Energy Gradients in Solution by a Conductor Solvent Model. J. Phys. Chem. A 1998, 102, 1995–2001. [Google Scholar] [CrossRef]
- Cossi, M.; Rega, N.; Scalmani, G.; Barone, V. Energies, structures, and electronic properties of molecules in solution with the C-PCM solvation model. J. Comput. Chem. 2003, 24, 669–681. [Google Scholar] [CrossRef]
- Tomasi, J.; Mennucci, B.; Cammi, R. Quantum Mechanical Continuum Solvation Models. Chem. Rev. 2005, 105, 2999–3094. [Google Scholar] [CrossRef]
- Velmurugan, G.; Ramamoorthi, B.K.; Venuvanalingam, P. Are Re(I) phenanthroline complexes suitable candidates for OLEDs? Answers from DFT and TD-DFT investigations. Phys. Chem. Chem. Phys. 2014, 16, 21157–21171. [Google Scholar] [CrossRef]
- Suzuki, K.; Kobayashi, A.; Kaneko, S.; Takehira, K.; Yoshihara, T.; Ishida, H.; Shiina, Y.; Oishi, S.; Tobita, S. Reevaluation of absolute luminescence quantum yields of standard solutions using a spectrometer with an integrating sphere and a back-thinned CCD detector. Phys. Chem. Chem. Phys. 2009, 11, 9850–9860. [Google Scholar] [CrossRef]
- Fonin, A.V.; Sulatskaya, A.I.; Kuznetsova, I.M.; Turoverov, K.K. Fluorescence of Dyes in Solutions with High Absorbance. Inner Filter Effect Correction. PLoS ONE 2014, 9, e103878. [Google Scholar] [CrossRef]
- De Mello, J.C.; Wittmann, H.F.; Friend, R.H. An improved experimental determination of external photoluminescence quantum efficiency. Adv. Mater. 1997, 9, 230–232. [Google Scholar] [CrossRef]

| Compound | λabs (nm) | ε (M−1 cm−1) | λP (nm) | ΦP | τ (ns), f (%) [χ2] | <τ> (ns) | kr (s−1) | knr (s−1) |
|---|---|---|---|---|---|---|---|---|
| Re-Tapy | 252 306 (sh) 380 | 28,600 6300 3900 | 600 | 2.2 × 10⁻² | 306 [1.03] | 306 | 7.19 × 10⁴ | 3.19 × 10⁶ |
| Re-T-Tapy-Me | 242 276 386 | 21,800 14,700 3100 | 614 | 7.1 × 10⁻³ | 25 (22.4) 315 (75.1) [1.11] c | 248 | 2.86 × 10⁴ | 4.00 × 10⁶ |
| Re-T-Tapy-Et | 240 278 388 | 21,700 15,200 3100 | 626 | 7.5 × 10⁻³ | 23 (70.4) 272 (21.6) [1.12] c | 91 | 8.24 × 10⁴ | 1.09 × 10⁷ |
| Re-Pyta(1,2,3) a | 242 278 340 | 20,600 18,300 4400 | 546 | 1.7 × 10⁻² | 154 [1.08] | 154 | 1.10 × 10⁵ | 6.38 × 10⁶ |
| Re-T-Pyta(1,2,3)-Me a | 240 288 354 | 20,700 13,700 4400 | 616 | 9.7 × 10⁻³ | 47 [1.70] | 47 | 2.06 × 10⁵ | 2.10 × 10⁷ |
| Re-T-Pyta(1,2,3)-Et | 240 290 366 | 18,700 12,100 3800 | 612 | 1.2 × 10⁻² | 41 (77.6) 393 (17.6) [1.09] c | 101 | 1.18 × 10⁵ | 9.78 × 10⁶ |
| Re-Pyta(1,2,4) b | 240 282 382 | 15,100 11,600 4000 | 626 | 2.0 × 10⁻² | 75 [1.29] | 75 | 2.70 × 10⁵ | 1.31× 10⁷ |
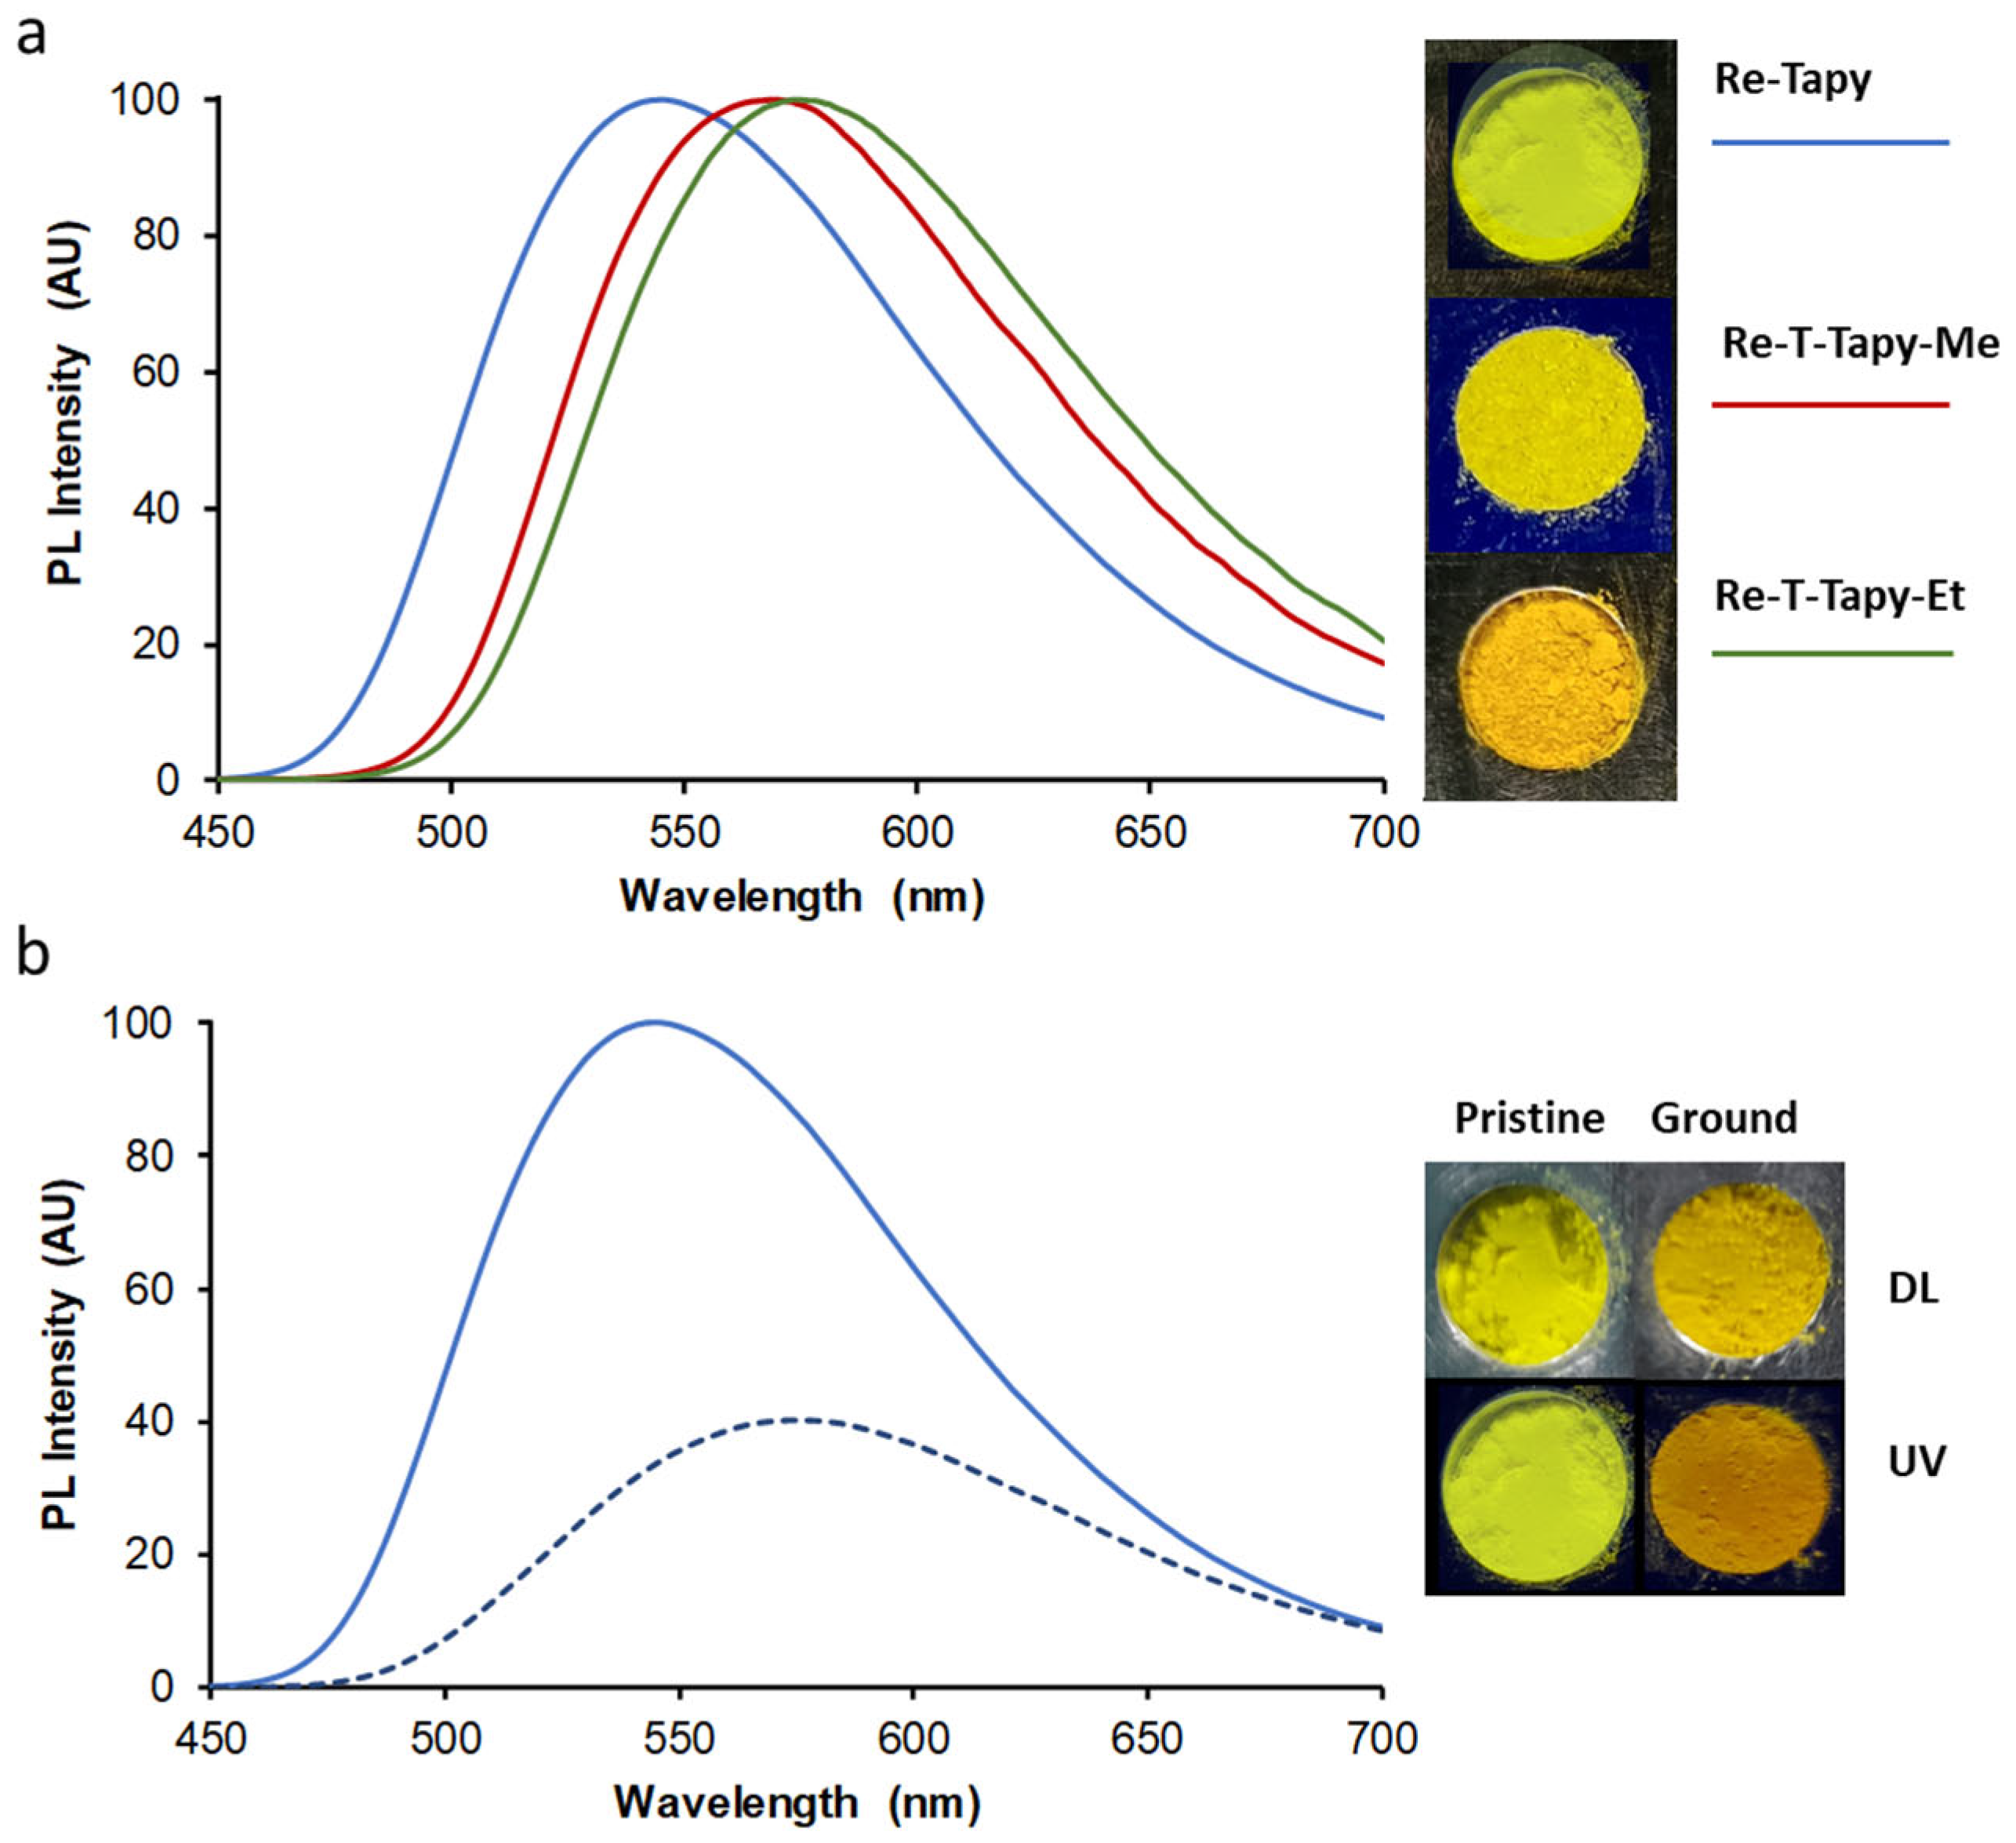
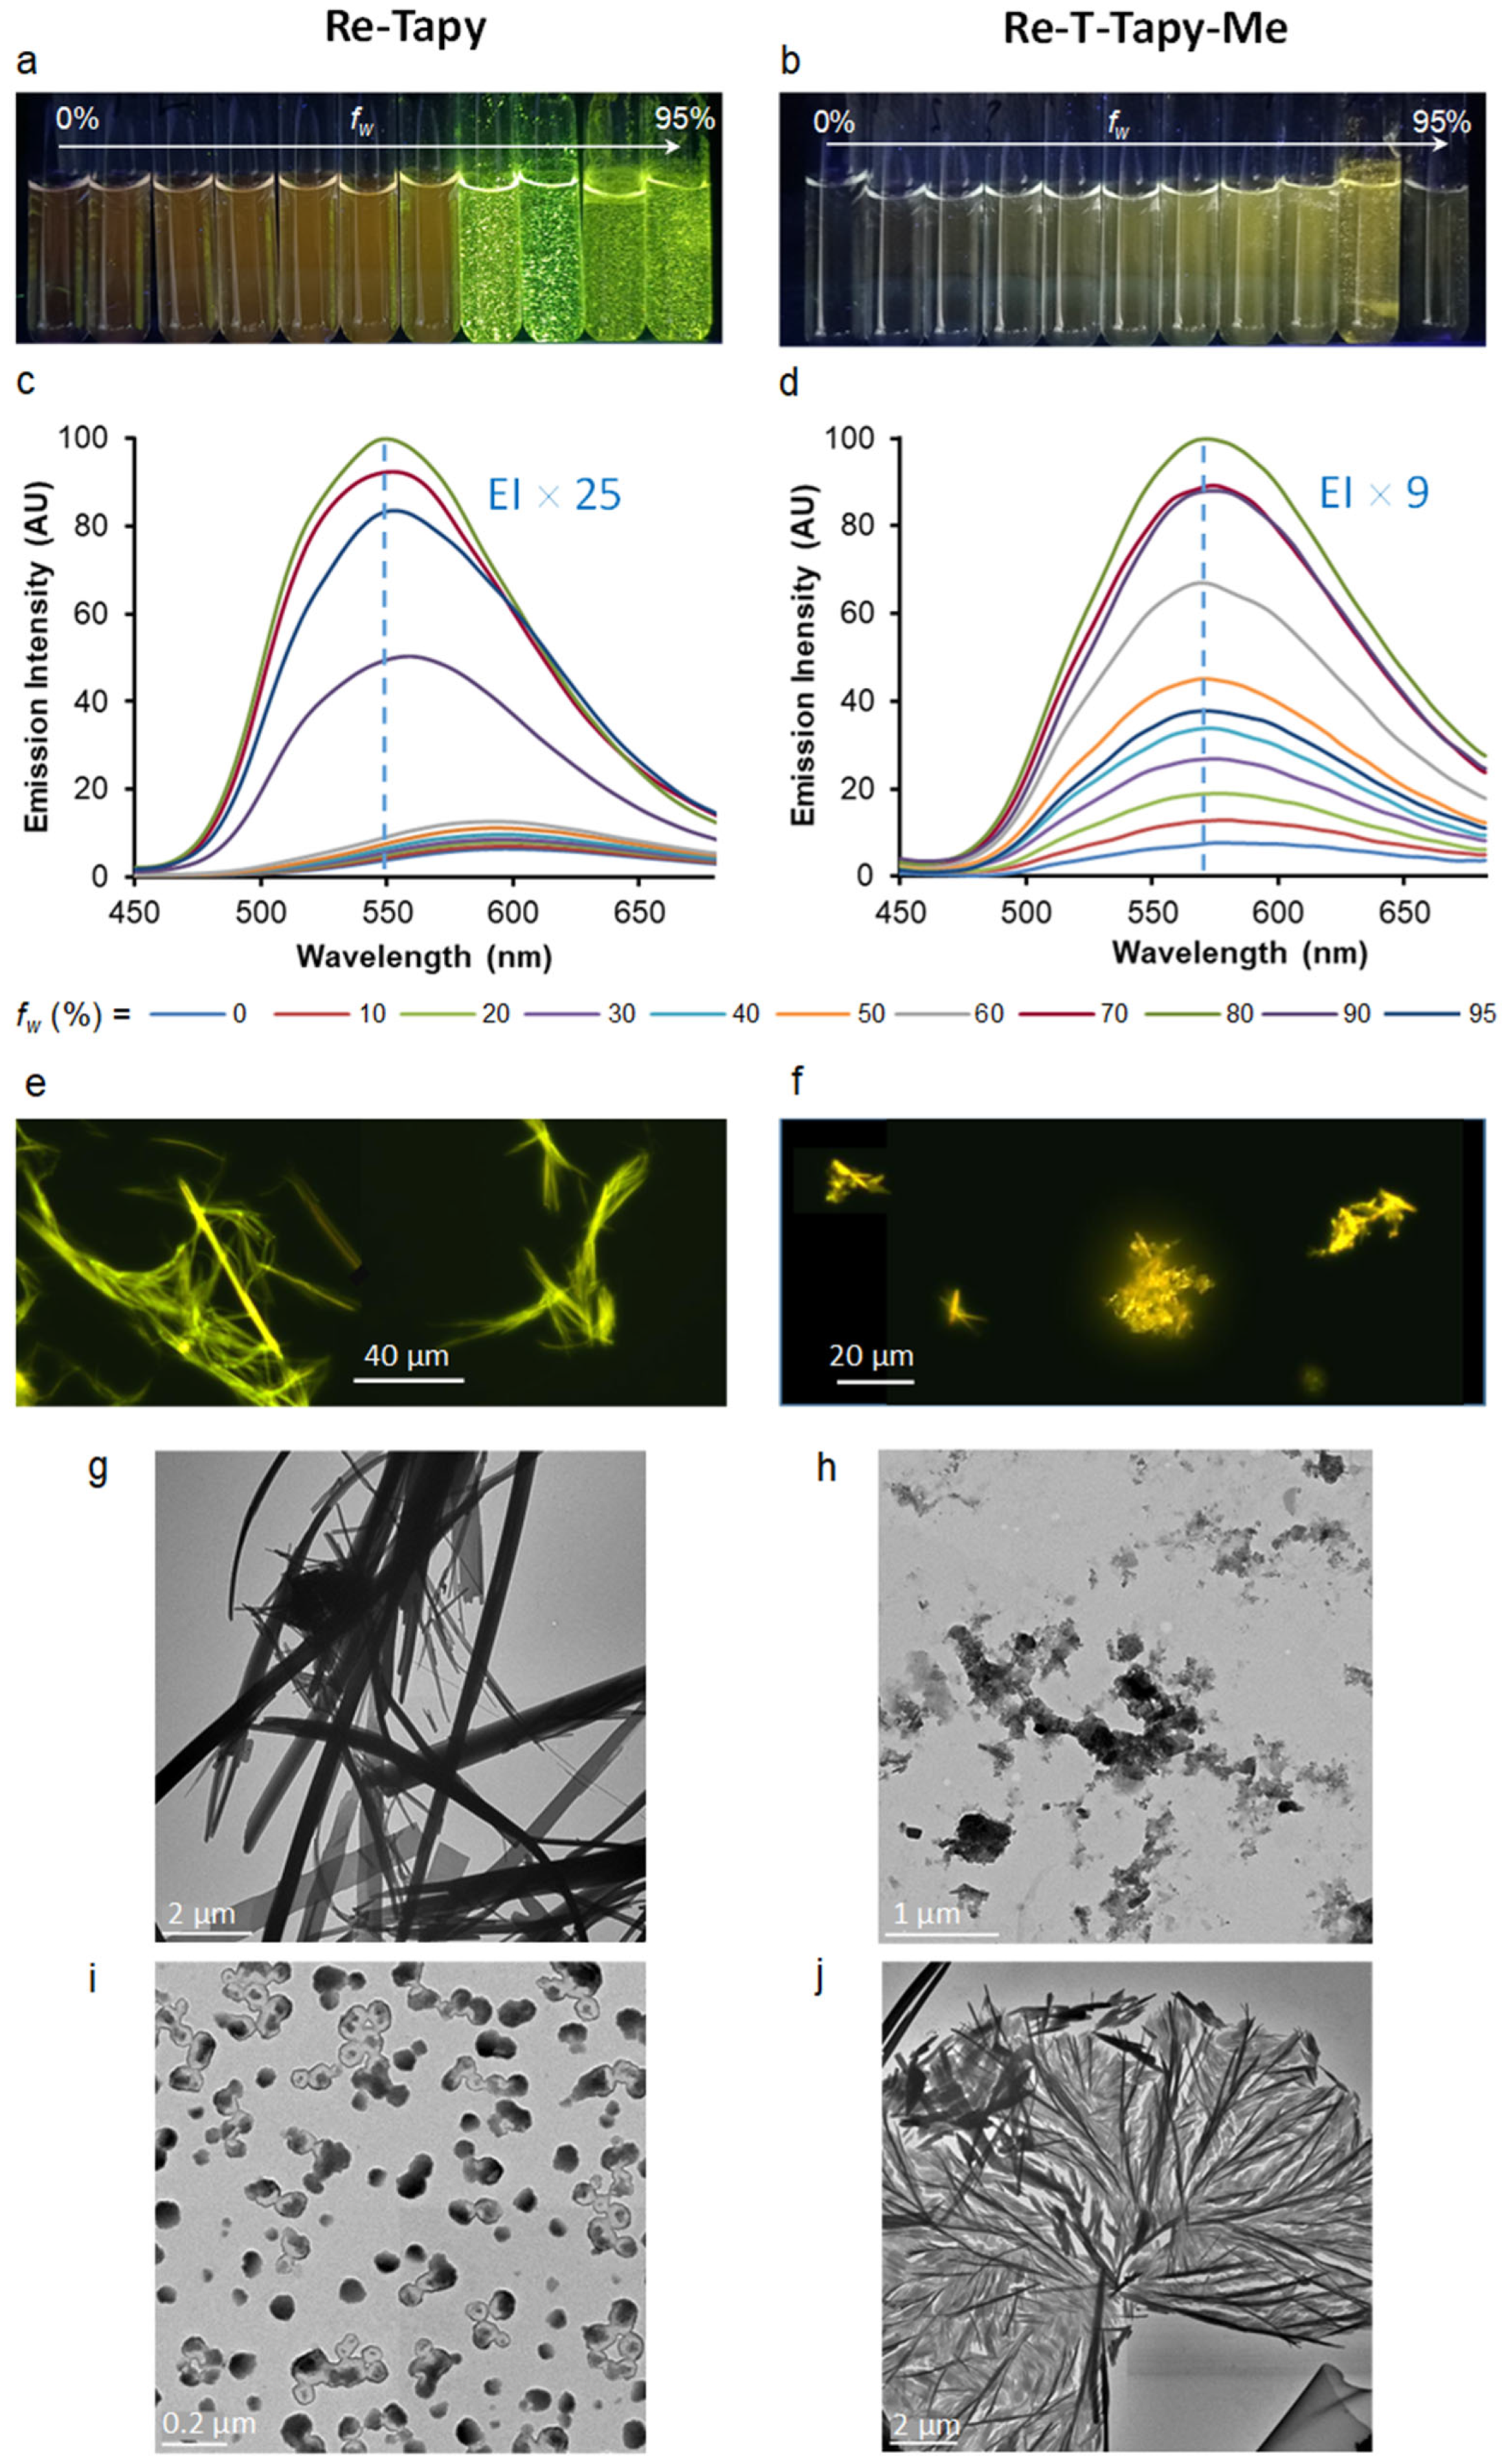
| Complex | Suspensions | Pristine | Ground | |||||||
|---|---|---|---|---|---|---|---|---|---|---|
| λPL (nm) | ΦPL | τPL (ns), f (%) [χ2] | <τ> (ns) | λPL (nm) | ΦPL | τPL (ns), f (%) [χ2] | <τ> (ns) | λPL (nm) | ΦPL | |
| Re-Tapy | 548 | 0.41 | 1.9 (0.9), 115 (3.9) 1198 (95.2) [1.20] | 1145 | 545 | 0.62 | 6.0 (0.6), 252 (9.7) 2728 (89.7) [1.41] | 2471 | 575 | 0.25 |
| Re-T-Tapy-Me | 570 | 0.014 | 2.6 (1.3), 189 (78.0) 662 (20.7) [1.12] | 285 | 569 | 0.10 | 5.0 (0.9), 243 (19.7) 1356 (79.4) [1.39] | 1124 | 576 | 0.059 |
| Re-T-Tapy-Et | --- | --- | --- | --- | 574 | 0.056 | 24.7 (1.6), 305 (19.7) 1625 (78.7) [1.30] | 1340 | 580 | 0.055 |
| Re-Pyta(1,2,3) | 508 a | --- | --- | --- | 510 a | 0.69 a | 0.9 (0.3), 32 (0.6) 1164 (99.1) [1.28] a | 1153 | 513 | 0.50 |
| Re-T-Pyta(1,2,3)-Me | 536 a | --- | --- | --- | 537 a | 0.16 a | 1.3 (0.4), 64 (3.2) 711 (96.4) [1.07] a | 687 | 553 | 0.17 |
| Re-T-Pyta(1,2,3)-Et | --- | --- | --- | --- | 545 | 0.21 | 16.7 (0.7), 301 (14.9) 1371 (84.4) [1.29] | 1202 | 554 | 0.21 |
| Re-Pyta(1,2,4) | 562 b | 0.50 b | 16 (1.3), 363 (98.7) [1.32] b | 358 | 550 c 542 b | 0.42 c | 1.2 (0.2), 60 (2.3) 639 (97.5) [1.07] d | 624 | 560 c | 0.13 c |
| Re-Tapy | Re-T-Tapy-Me | Re-T-Tapy-Et | Re-T-Pyta(1,2,3)-Et | |
|---|---|---|---|---|
| Empirical formula | C16H10ClN4O3Re • C2H6OS | C17H12ClN4O3Re • CH2Cl2 | C18H14ClN4O3Re | C18H14ClN4O3Re |
| Formula weight | 606.06 | 626.88 | 555.98 | 555.98 |
| Crystal system | Monoclinic | Triclinic | Monoclinic | Triclinic |
| Space group | P21 | P21/c | ||
| Unit cell dimensions | ||||
| a (Å) | 6.8027(3) | 7.9671(4) | 8.3767(4) | 9.3125(4) |
| b (Å) | 14.4708(6) | 11.1386(6) | 7.3859(3) | 12.2753(5) |
| c (Å) | 11.1451(5) | 12.6625(7) | 30.3253(13) | 16.5599(6) |
| α (°) | 90 | 89.6778(16) | 90 | 88.7470(10) |
| β (°) | 107.0980(15) | 79.3892(14) | 95.9593(17) | 88.4940(10) |
| γ (°) | 90 | 75.9949(14) | 90 | 79.6560(10) |
| Volume (Å3) | 1048.64(8) | 1070.76(10) | 1866.07(14) | 1861.33(13) |
| Z | 2 | 2 | 4 | 4 |
| Density (calculated) (Mg/m3) | 1.919 | 1.944 | 1.979 | 1.984 |
| Crystal size (mm3) | 0.450 × 0.120 × 0.040 | 0.200 × 0.160 × 0.040 | 0.180 × 0.160 × 0.100 | 0.080 × 0.080 × 0.050 |
| Reflections collected | 24,760 | 37,881 | 47,266 | 60,807 |
| Independent reflections | 4394 Rint = 0.0414 | 5431 Rint = 0.0342 | 3406 Rint = 0.0568 | 9383 Rint = 0.0751 |
| Restraints/parameters | 115/281 | 0/263 | 0/245 | 0/489 |
| Final R1 index I > 2σ(I) | 0.0257 | 0.0151 | 0.0267 | 0.0317 |
| wR2 (all data) | 0.0652 | 0.0354 | 0.0663 | 0.0547 |
| Largest diff. peak and hole (e Å−3) | 0.461 and −1.221 | 0.794 and −0.748 | 0.666 and −1.533 | 0.880 and −0.988 |
| CCDC | 2,454,799 | 2,454,800 | 2,454,801 | 2,454,802 |
Disclaimer/Publisher’s Note: The statements, opinions and data contained in all publications are solely those of the individual author(s) and contributor(s) and not of MDPI and/or the editor(s). MDPI and/or the editor(s) disclaim responsibility for any injury to people or property resulting from any ideas, methods, instructions or products referred to in the content. |
© 2025 by the authors. Licensee MDPI, Basel, Switzerland. This article is an open access article distributed under the terms and conditions of the Creative Commons Attribution (CC BY) license (https://creativecommons.org/licenses/by/4.0/).
Share and Cite
Abdallah, A.M.; Wolff, M.; Leygue, N.; Deleuzière, M.; Saffon-Merceron, N.; Serpentini, C.-L.; Benoist, E.; Fery-Forgues, S. Influence of Ligand Isomerism on the Photophysical Properties of AIPE-Active Rhenium(I) Complexes: Investigations with a 2-(1,2,3-Triazol-1-yl)pyridine (Tapy)-Based Complex and Its Triazolylidene Derivatives. Molecules 2025, 30, 2776. https://doi.org/10.3390/molecules30132776
Abdallah AM, Wolff M, Leygue N, Deleuzière M, Saffon-Merceron N, Serpentini C-L, Benoist E, Fery-Forgues S. Influence of Ligand Isomerism on the Photophysical Properties of AIPE-Active Rhenium(I) Complexes: Investigations with a 2-(1,2,3-Triazol-1-yl)pyridine (Tapy)-Based Complex and Its Triazolylidene Derivatives. Molecules. 2025; 30(13):2776. https://doi.org/10.3390/molecules30132776
Chicago/Turabian StyleAbdallah, Abanoub Mosaad, Mariusz Wolff, Nadine Leygue, Maëlle Deleuzière, Nathalie Saffon-Merceron, Charles-Louis Serpentini, Eric Benoist, and Suzanne Fery-Forgues. 2025. "Influence of Ligand Isomerism on the Photophysical Properties of AIPE-Active Rhenium(I) Complexes: Investigations with a 2-(1,2,3-Triazol-1-yl)pyridine (Tapy)-Based Complex and Its Triazolylidene Derivatives" Molecules 30, no. 13: 2776. https://doi.org/10.3390/molecules30132776
APA StyleAbdallah, A. M., Wolff, M., Leygue, N., Deleuzière, M., Saffon-Merceron, N., Serpentini, C.-L., Benoist, E., & Fery-Forgues, S. (2025). Influence of Ligand Isomerism on the Photophysical Properties of AIPE-Active Rhenium(I) Complexes: Investigations with a 2-(1,2,3-Triazol-1-yl)pyridine (Tapy)-Based Complex and Its Triazolylidene Derivatives. Molecules, 30(13), 2776. https://doi.org/10.3390/molecules30132776