
Peri-Substituted Acyl Pyrrolyl Naphthalenes: Synthesis, Reactions and Photophysical Properties


Abstract

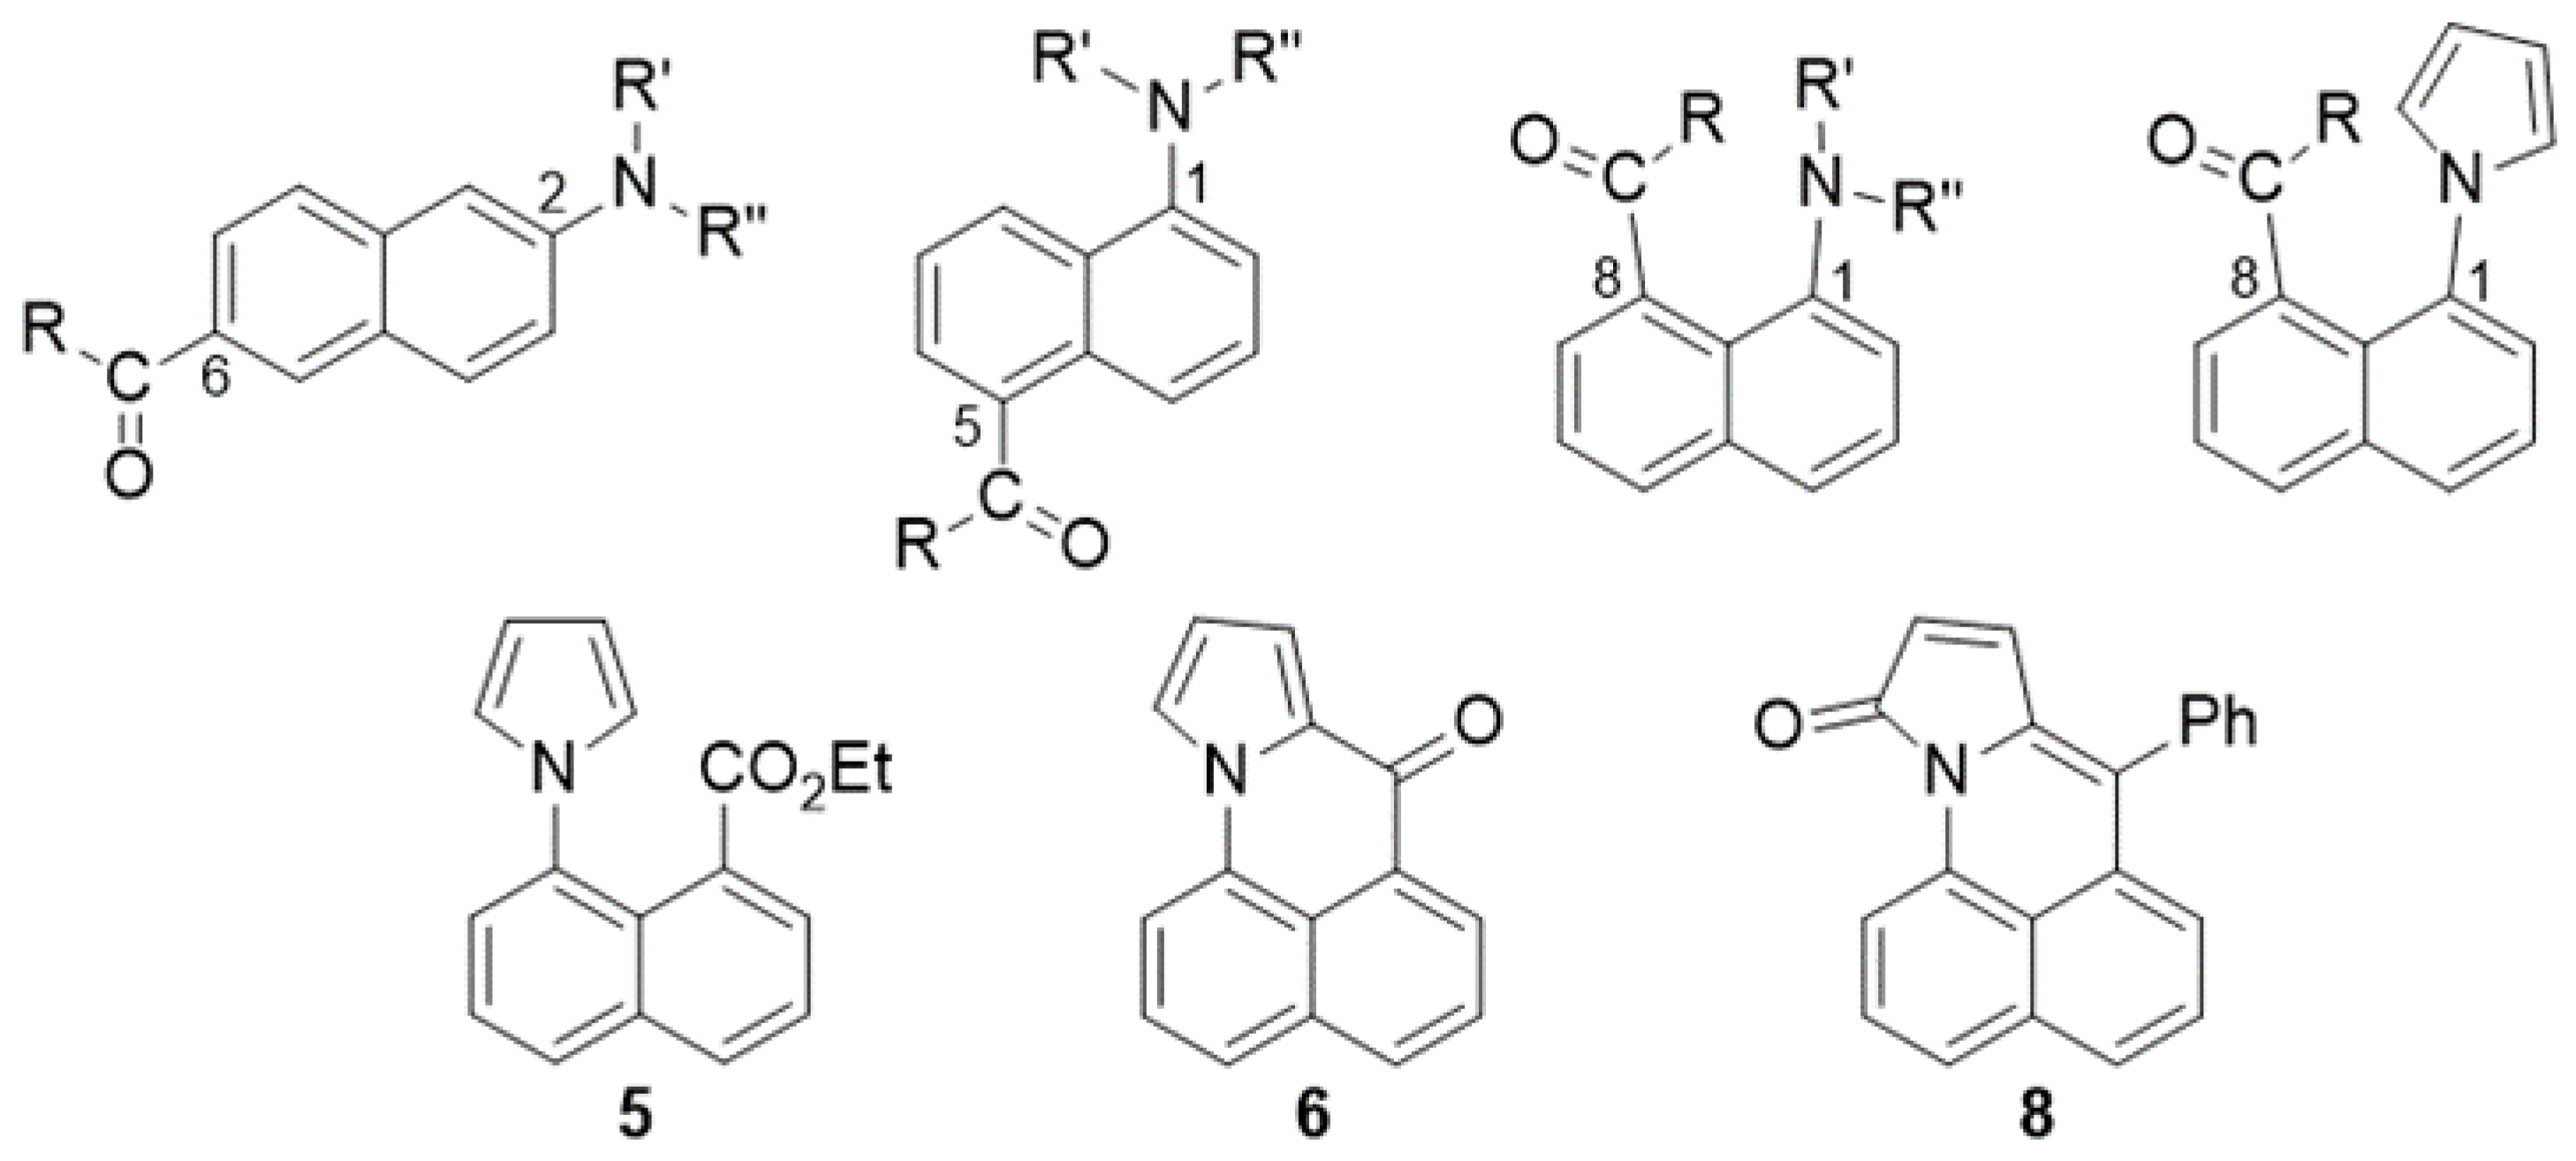
1. Introduction
2. Results and Discussion
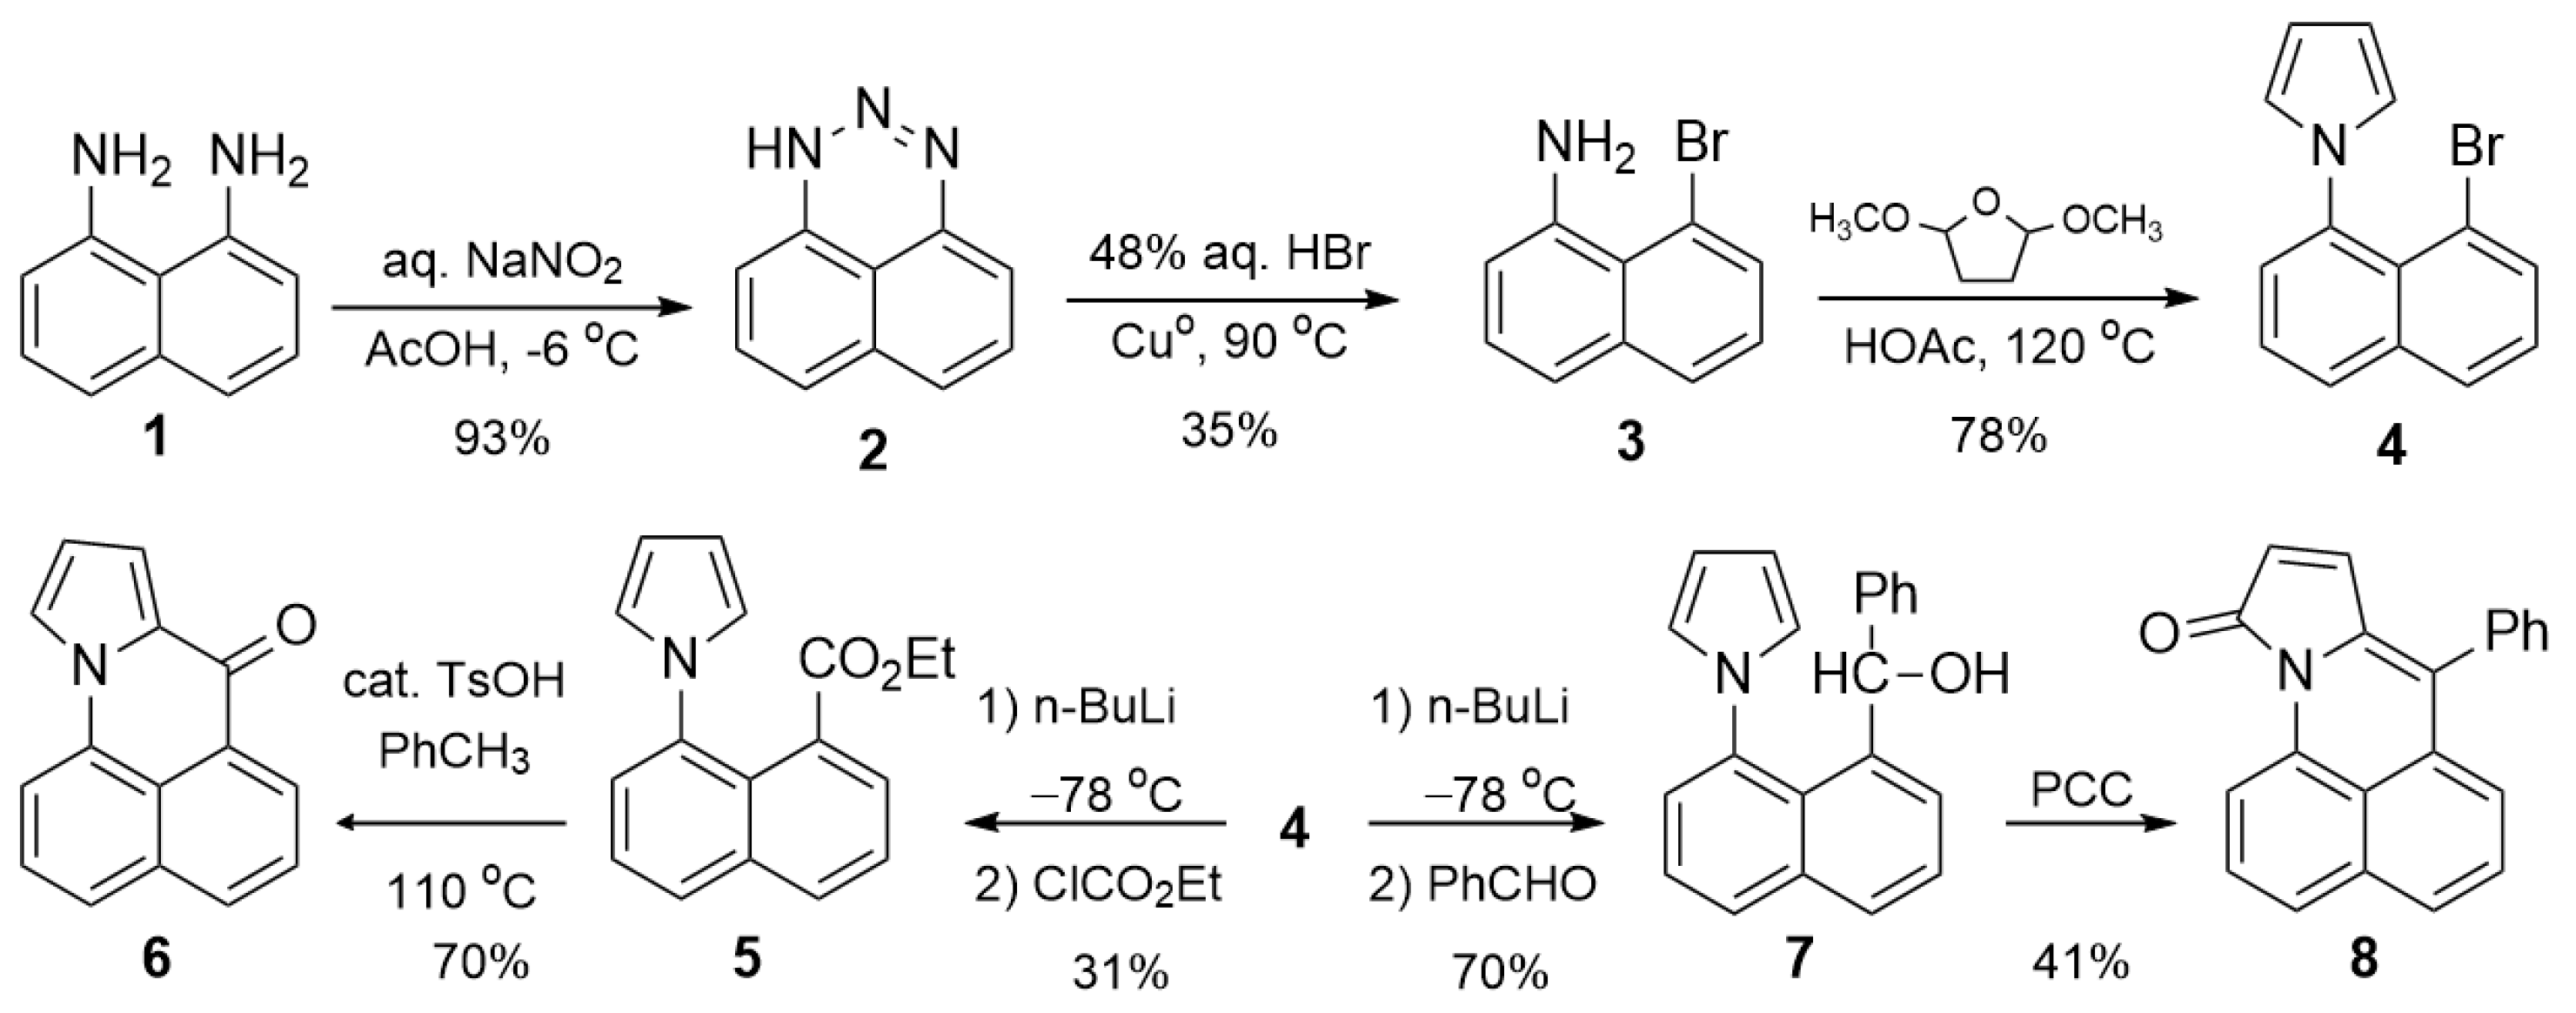
2.1. Synthesis and Characterization of Pyrrole Derivatives
2.1.1. Synthesis of Pyrrole Derivatives
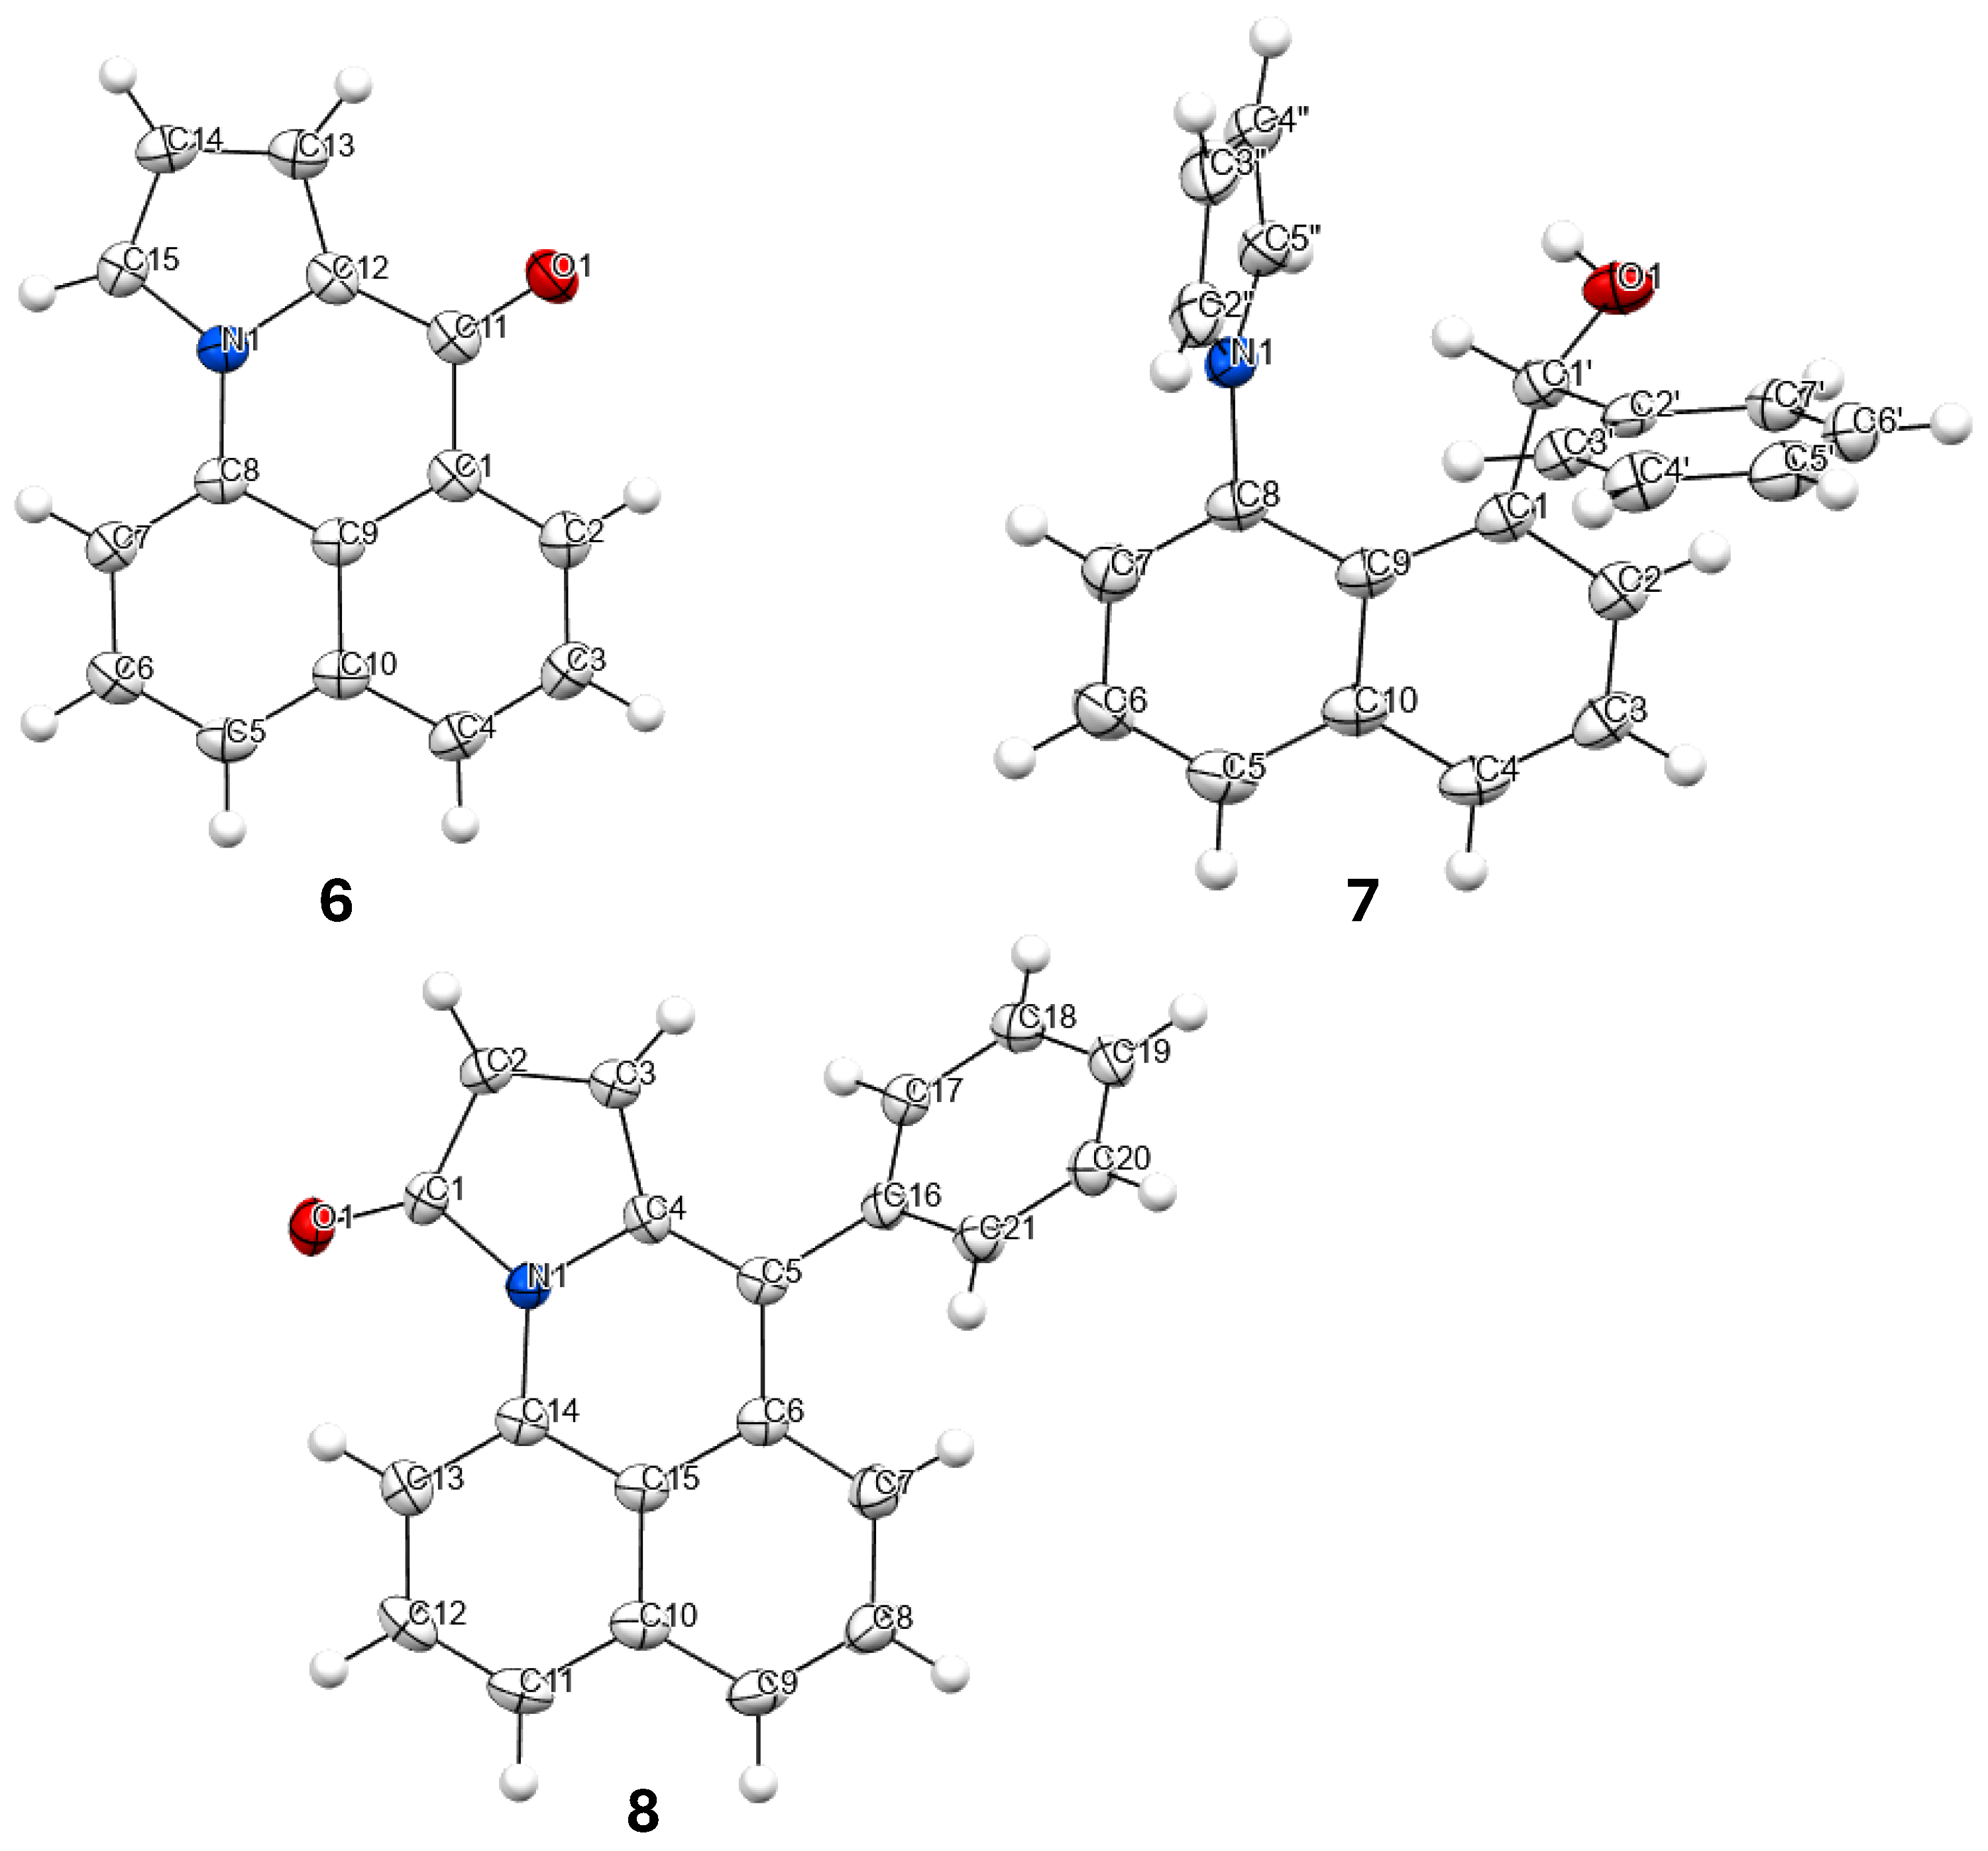
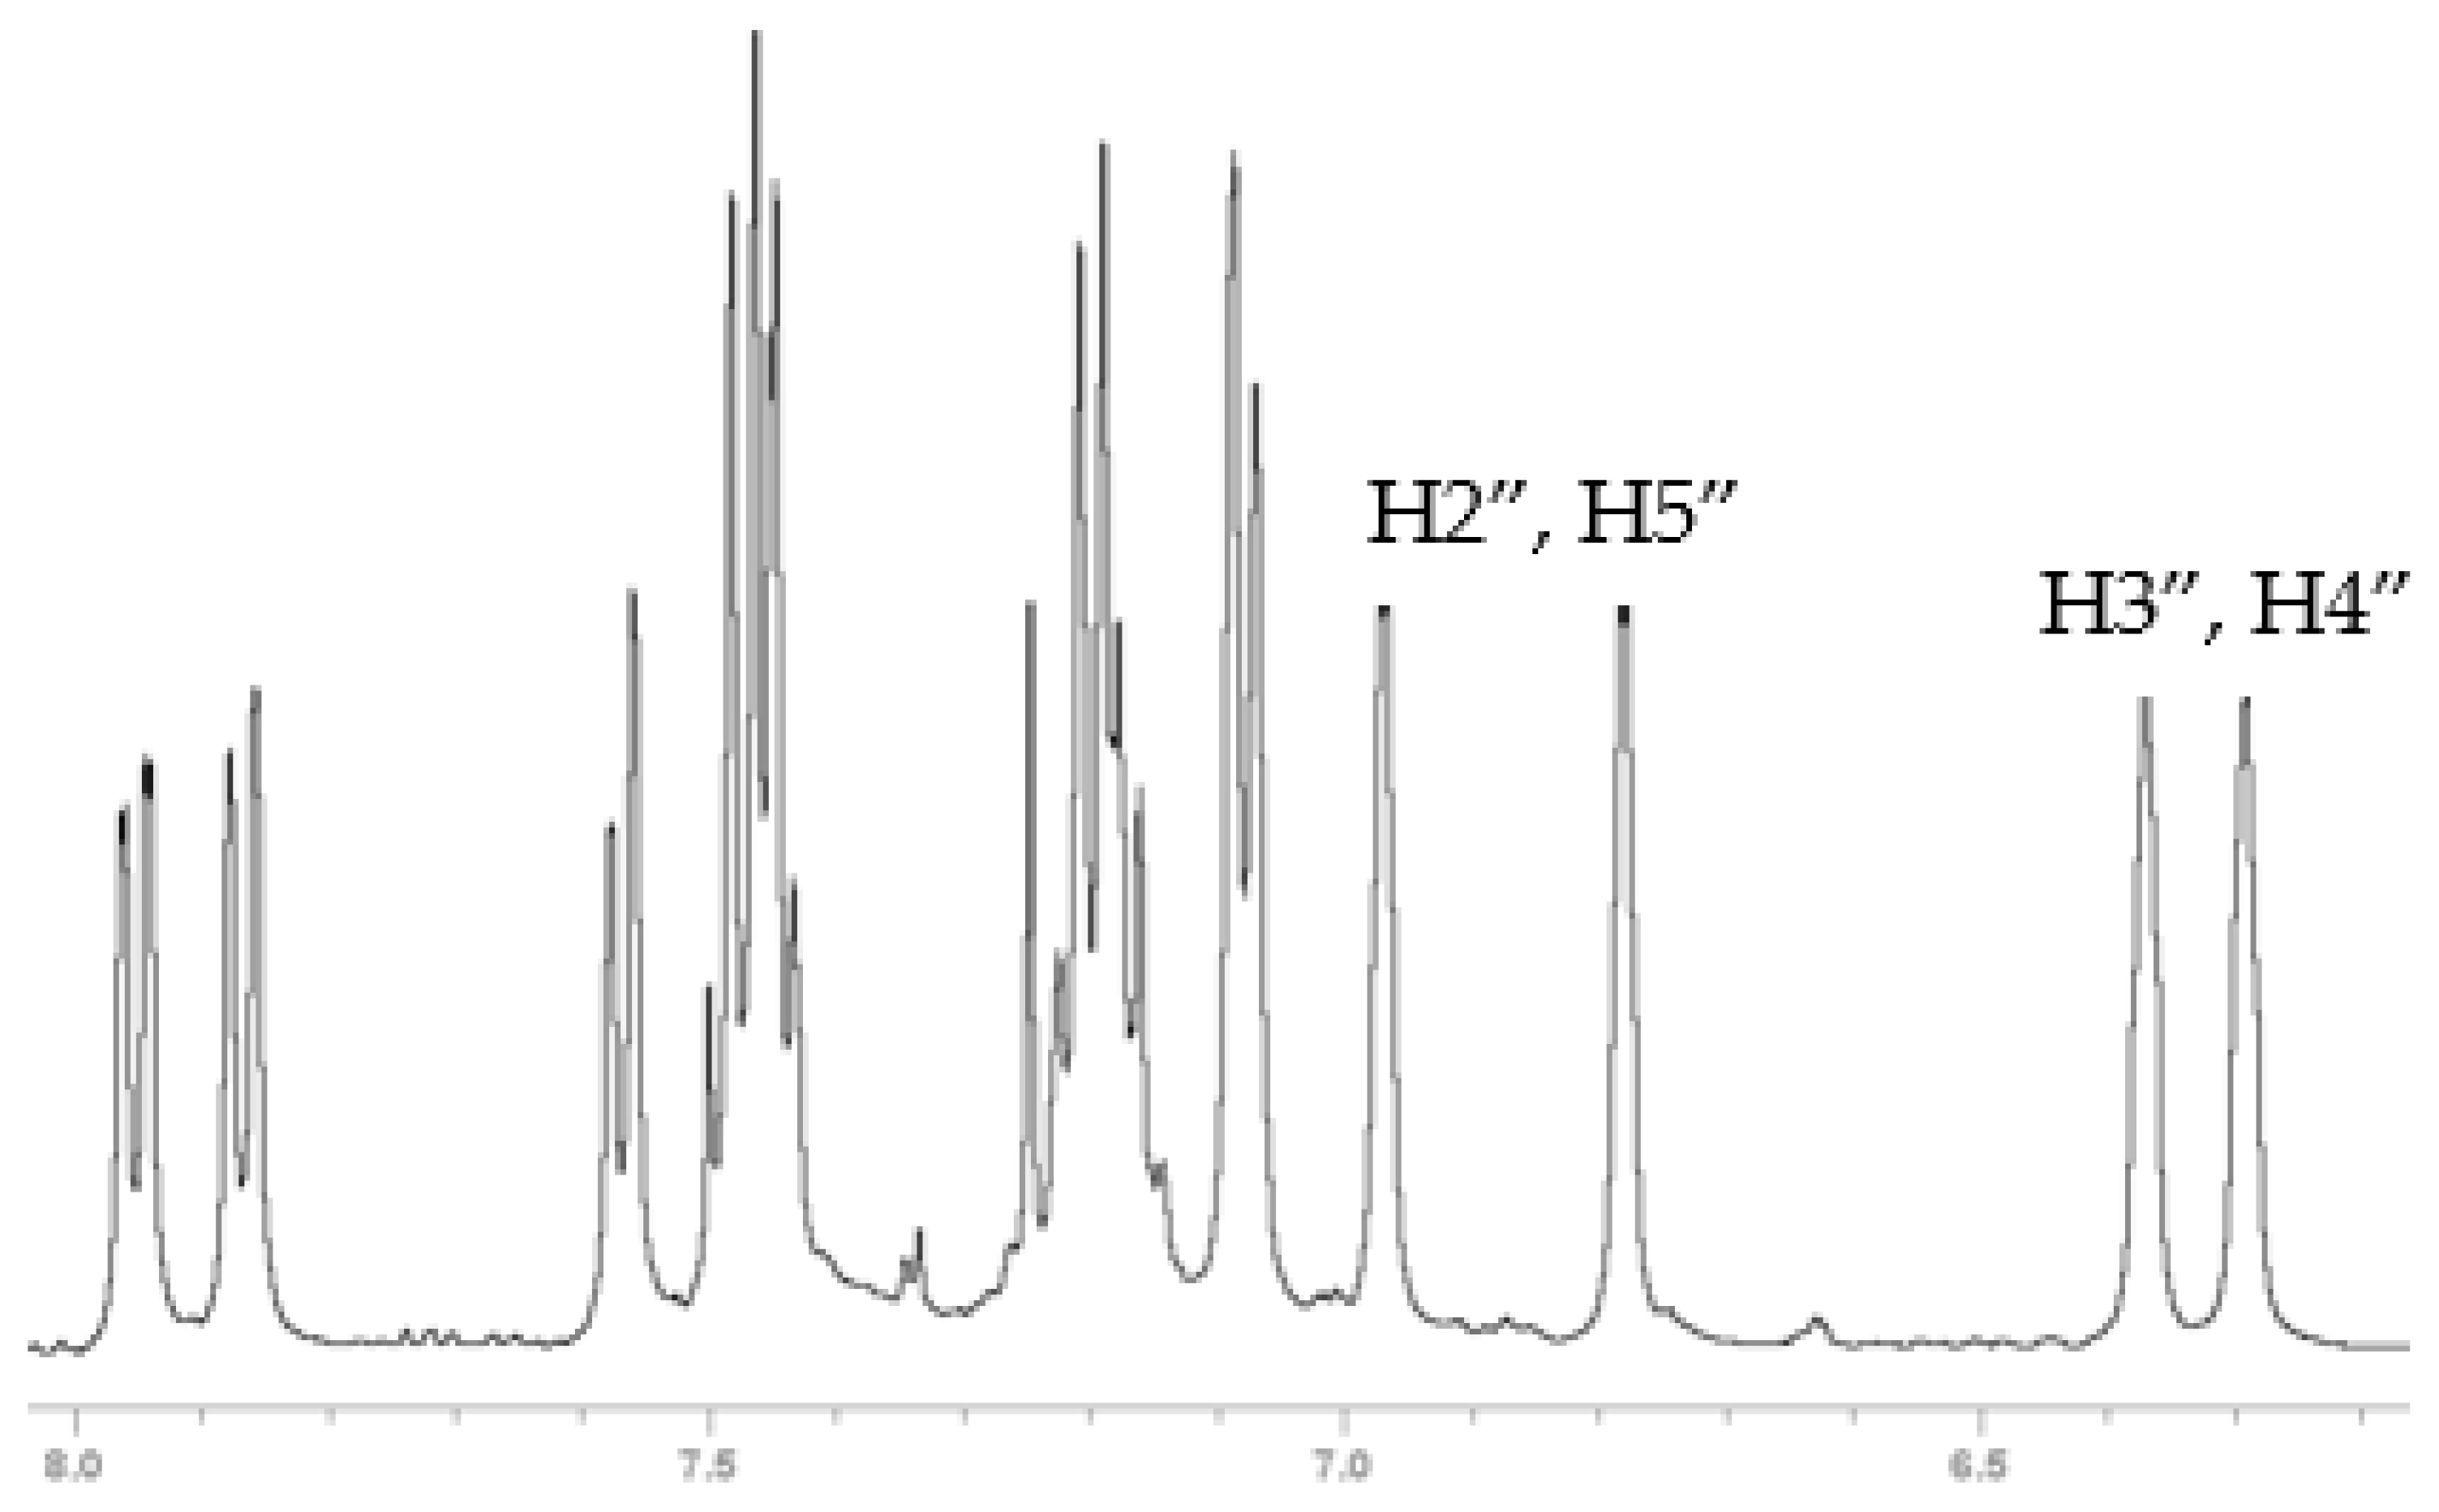
2.1.2. X-Ray Structures and Select NMR Data
2.2. Photophysical Studies
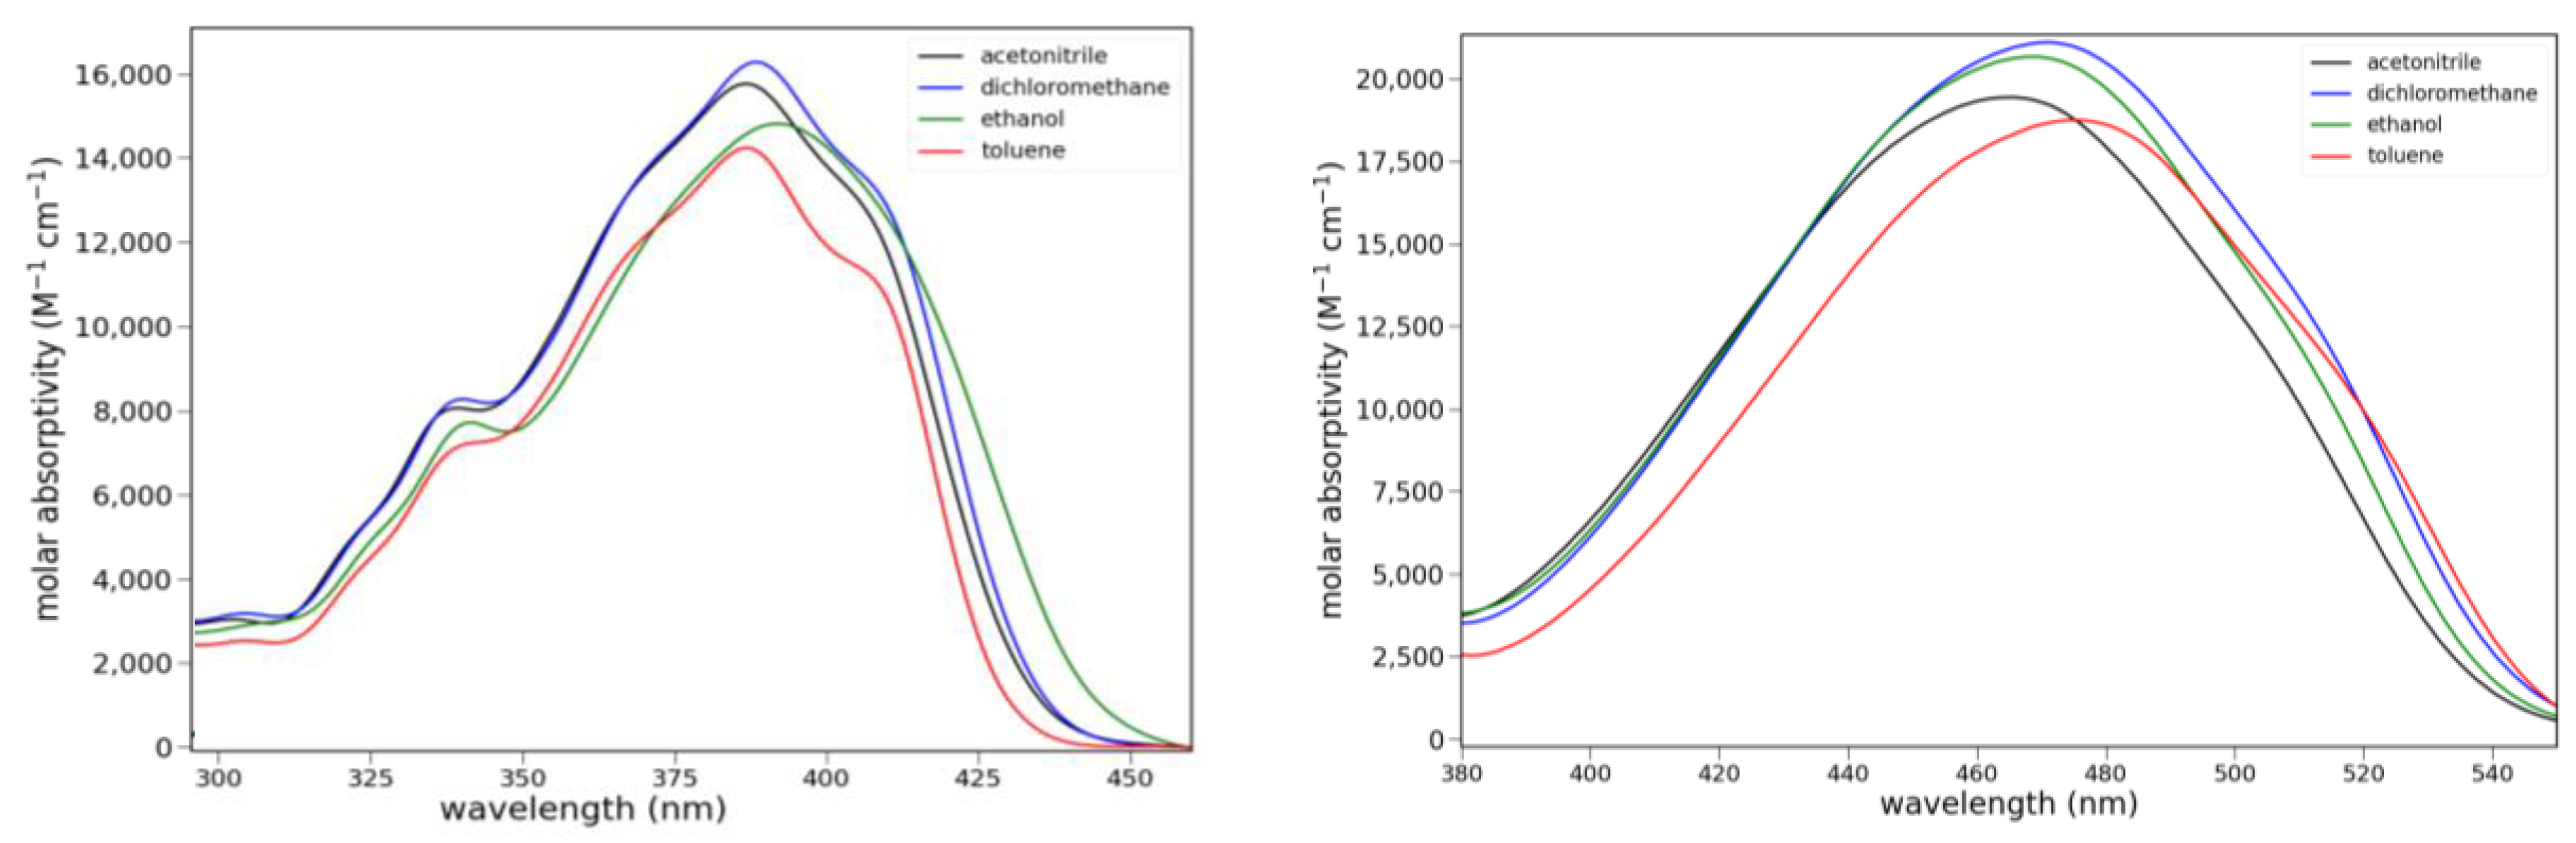
2.2.1. Absorption
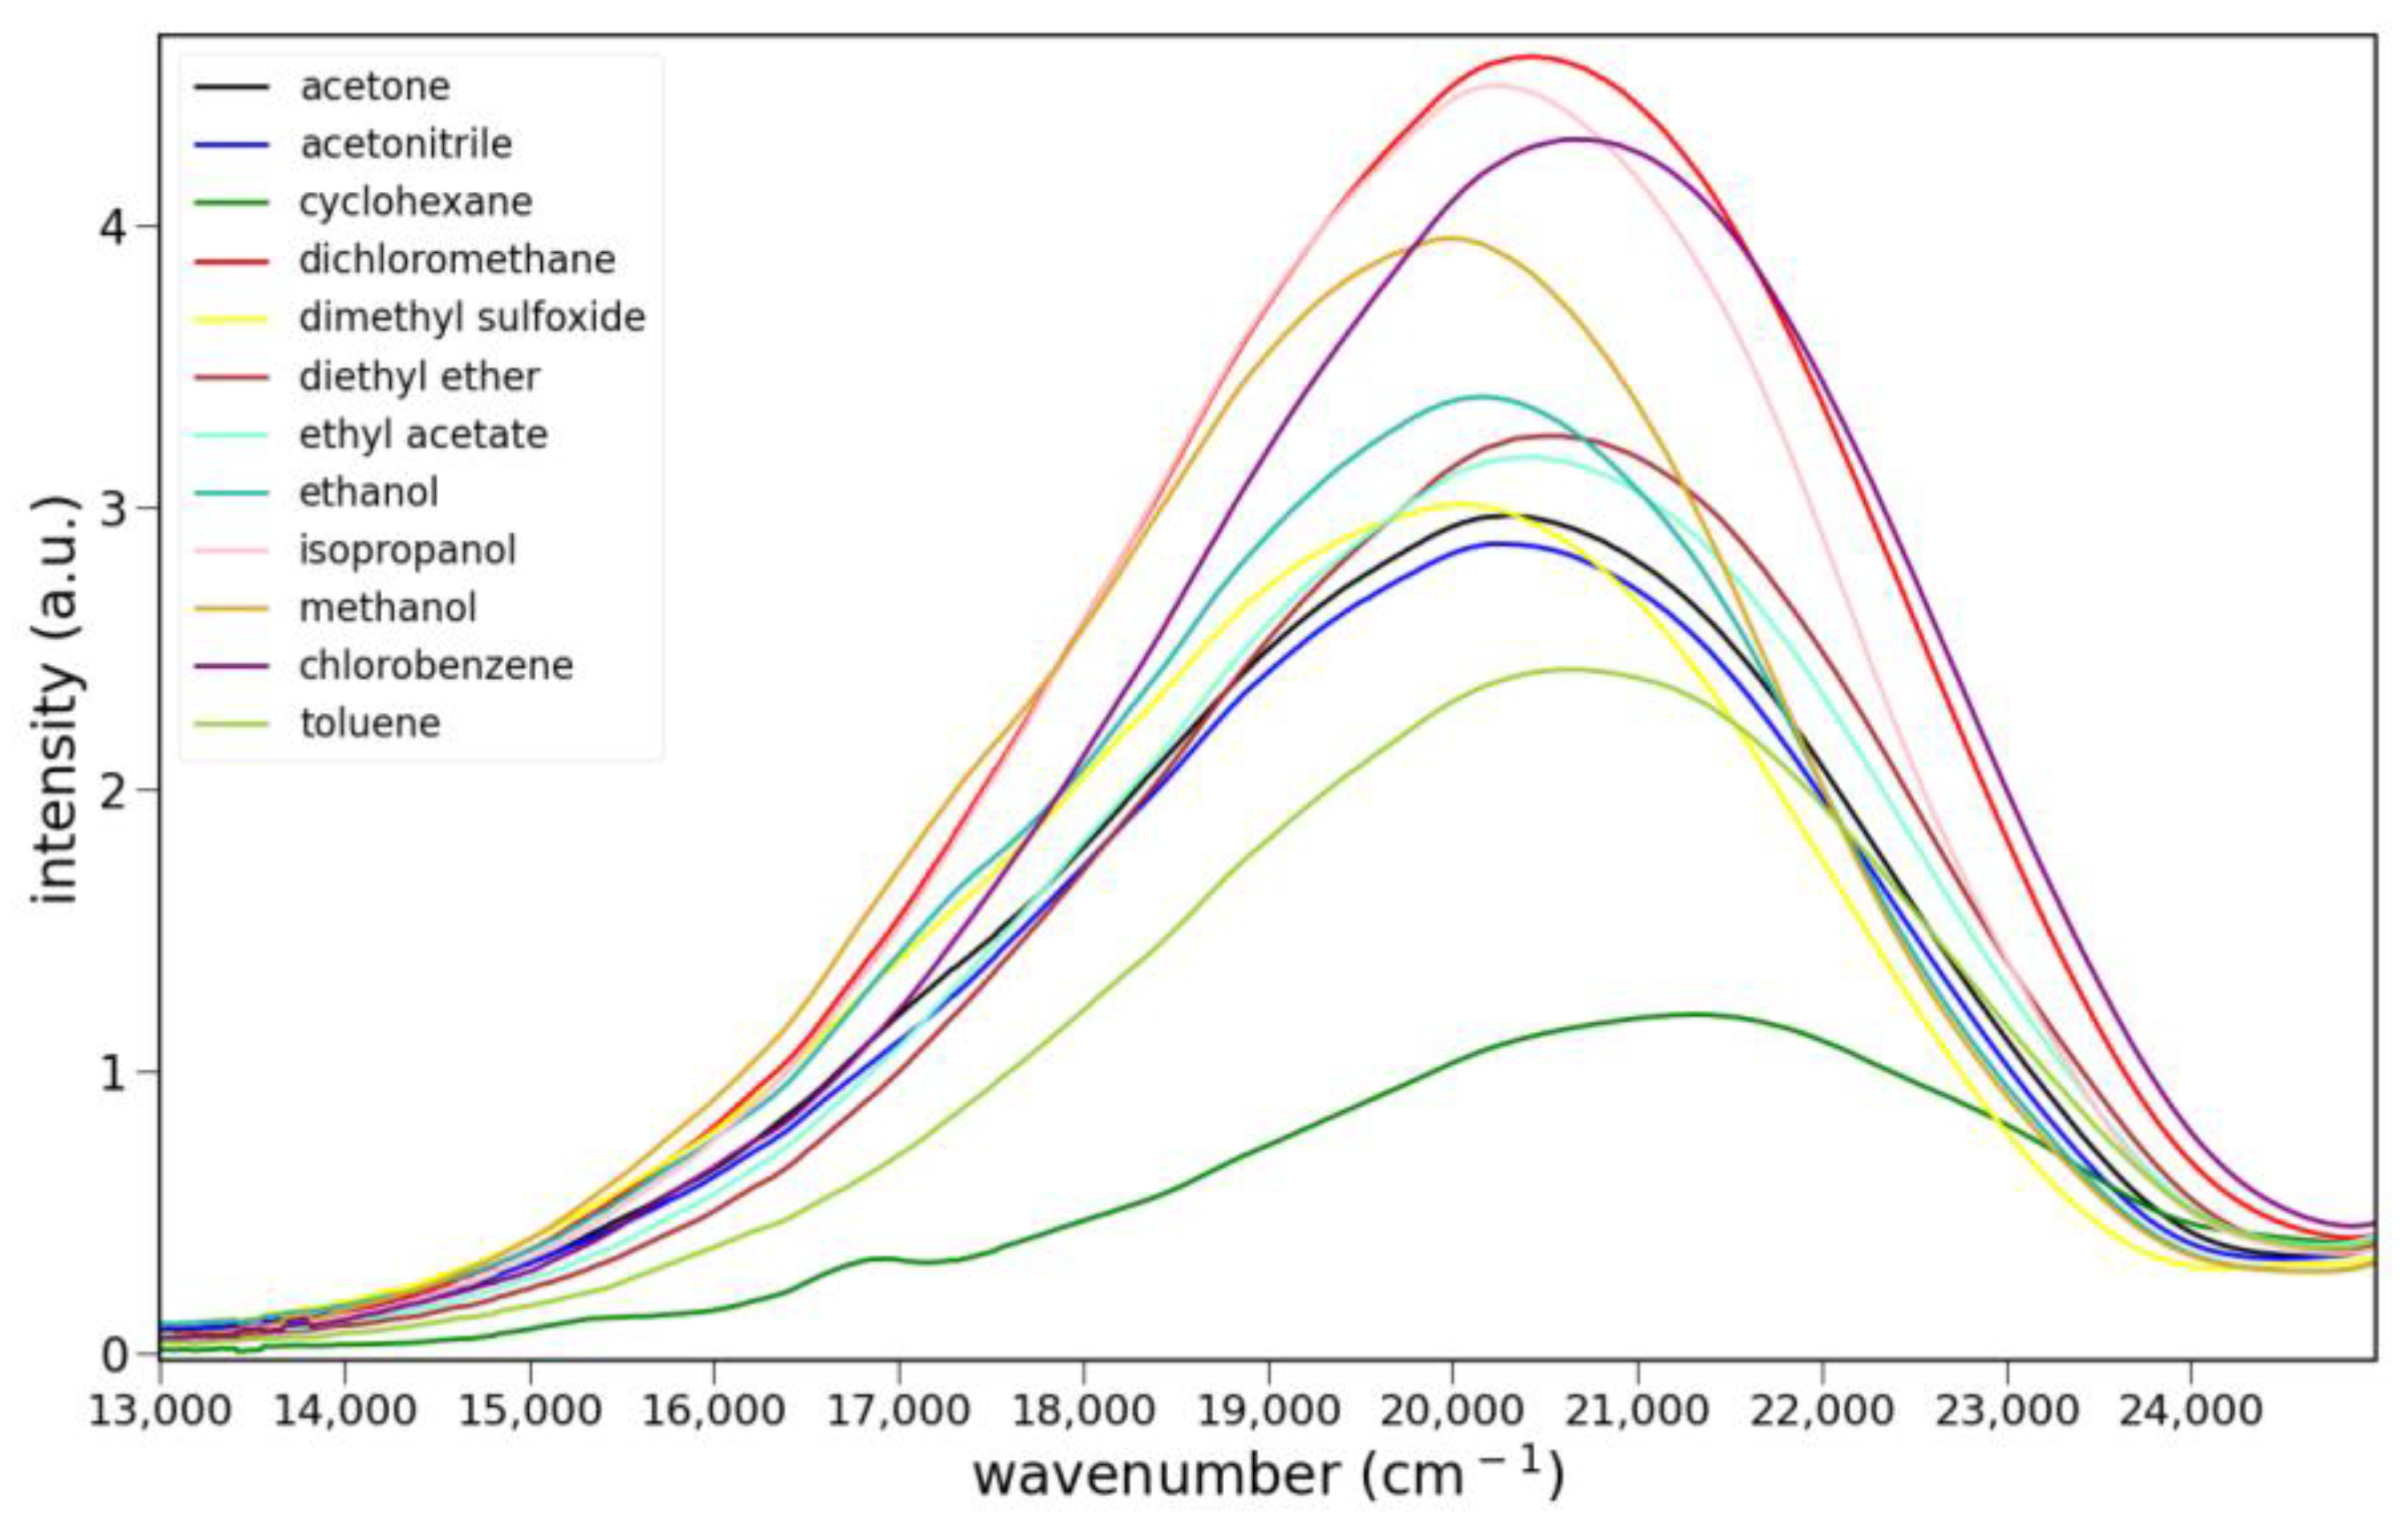
2.2.2. Fluorescence
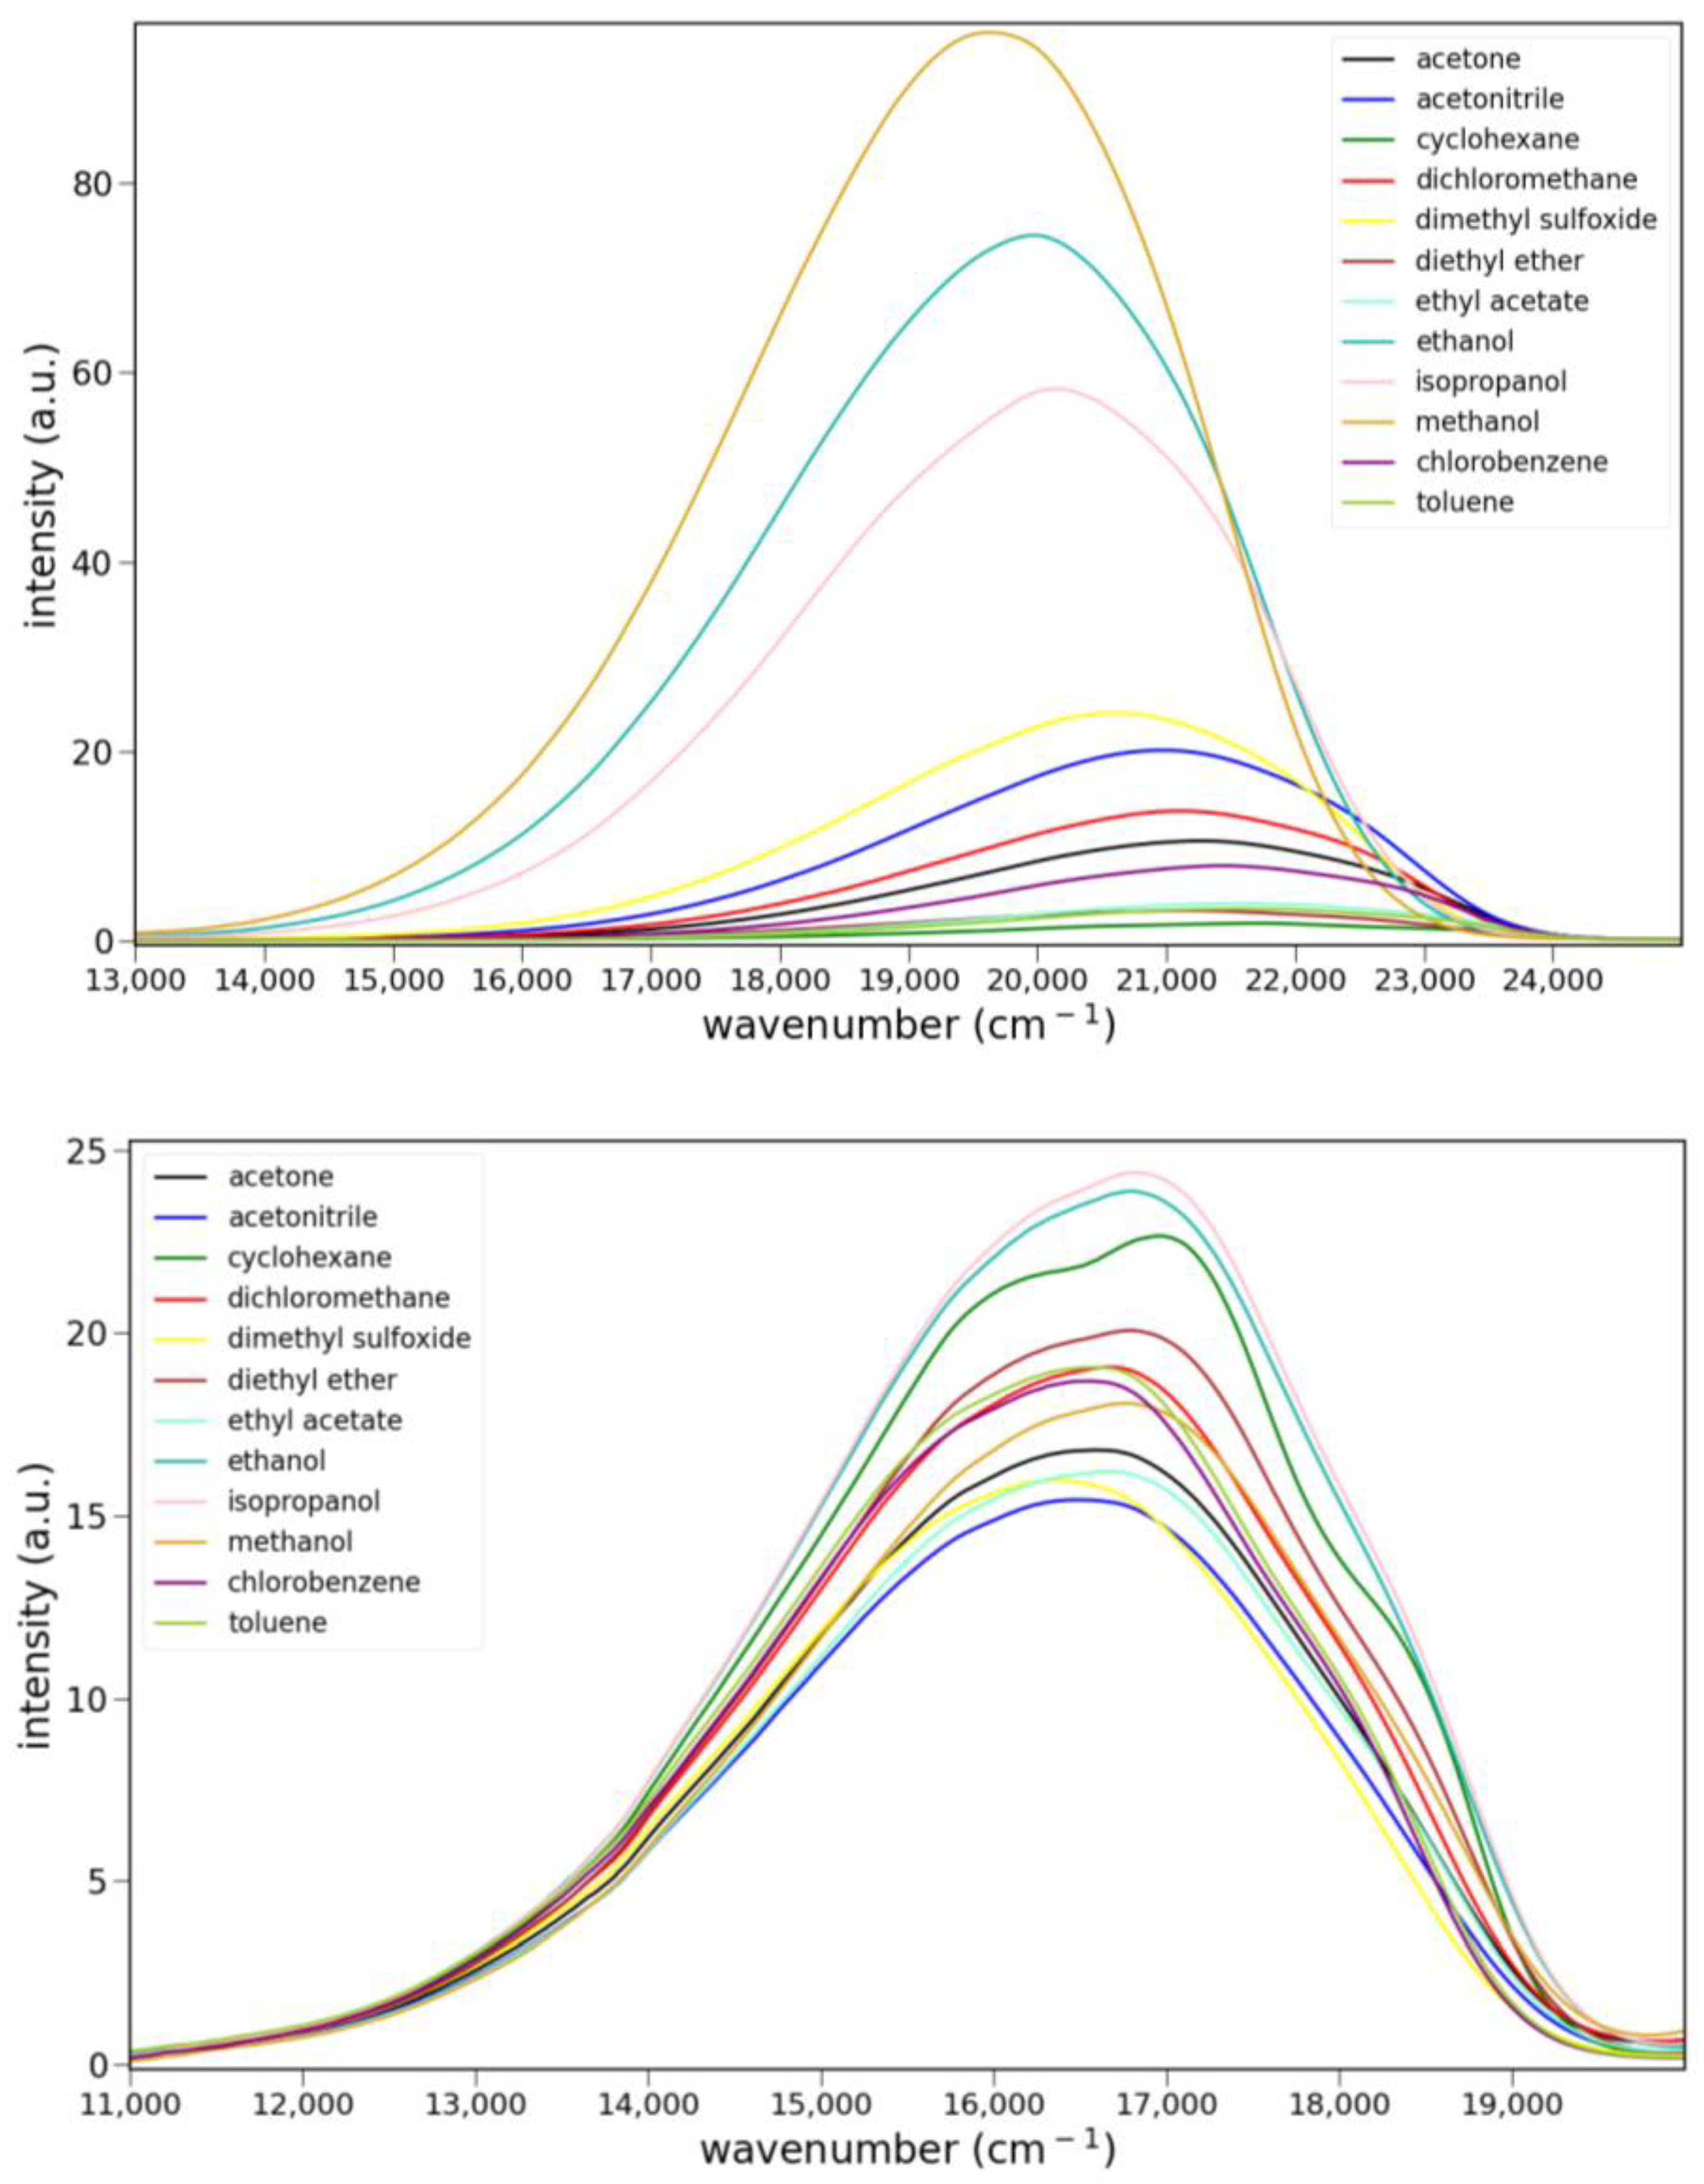
2.2.3. Solvato-Fluorochromism
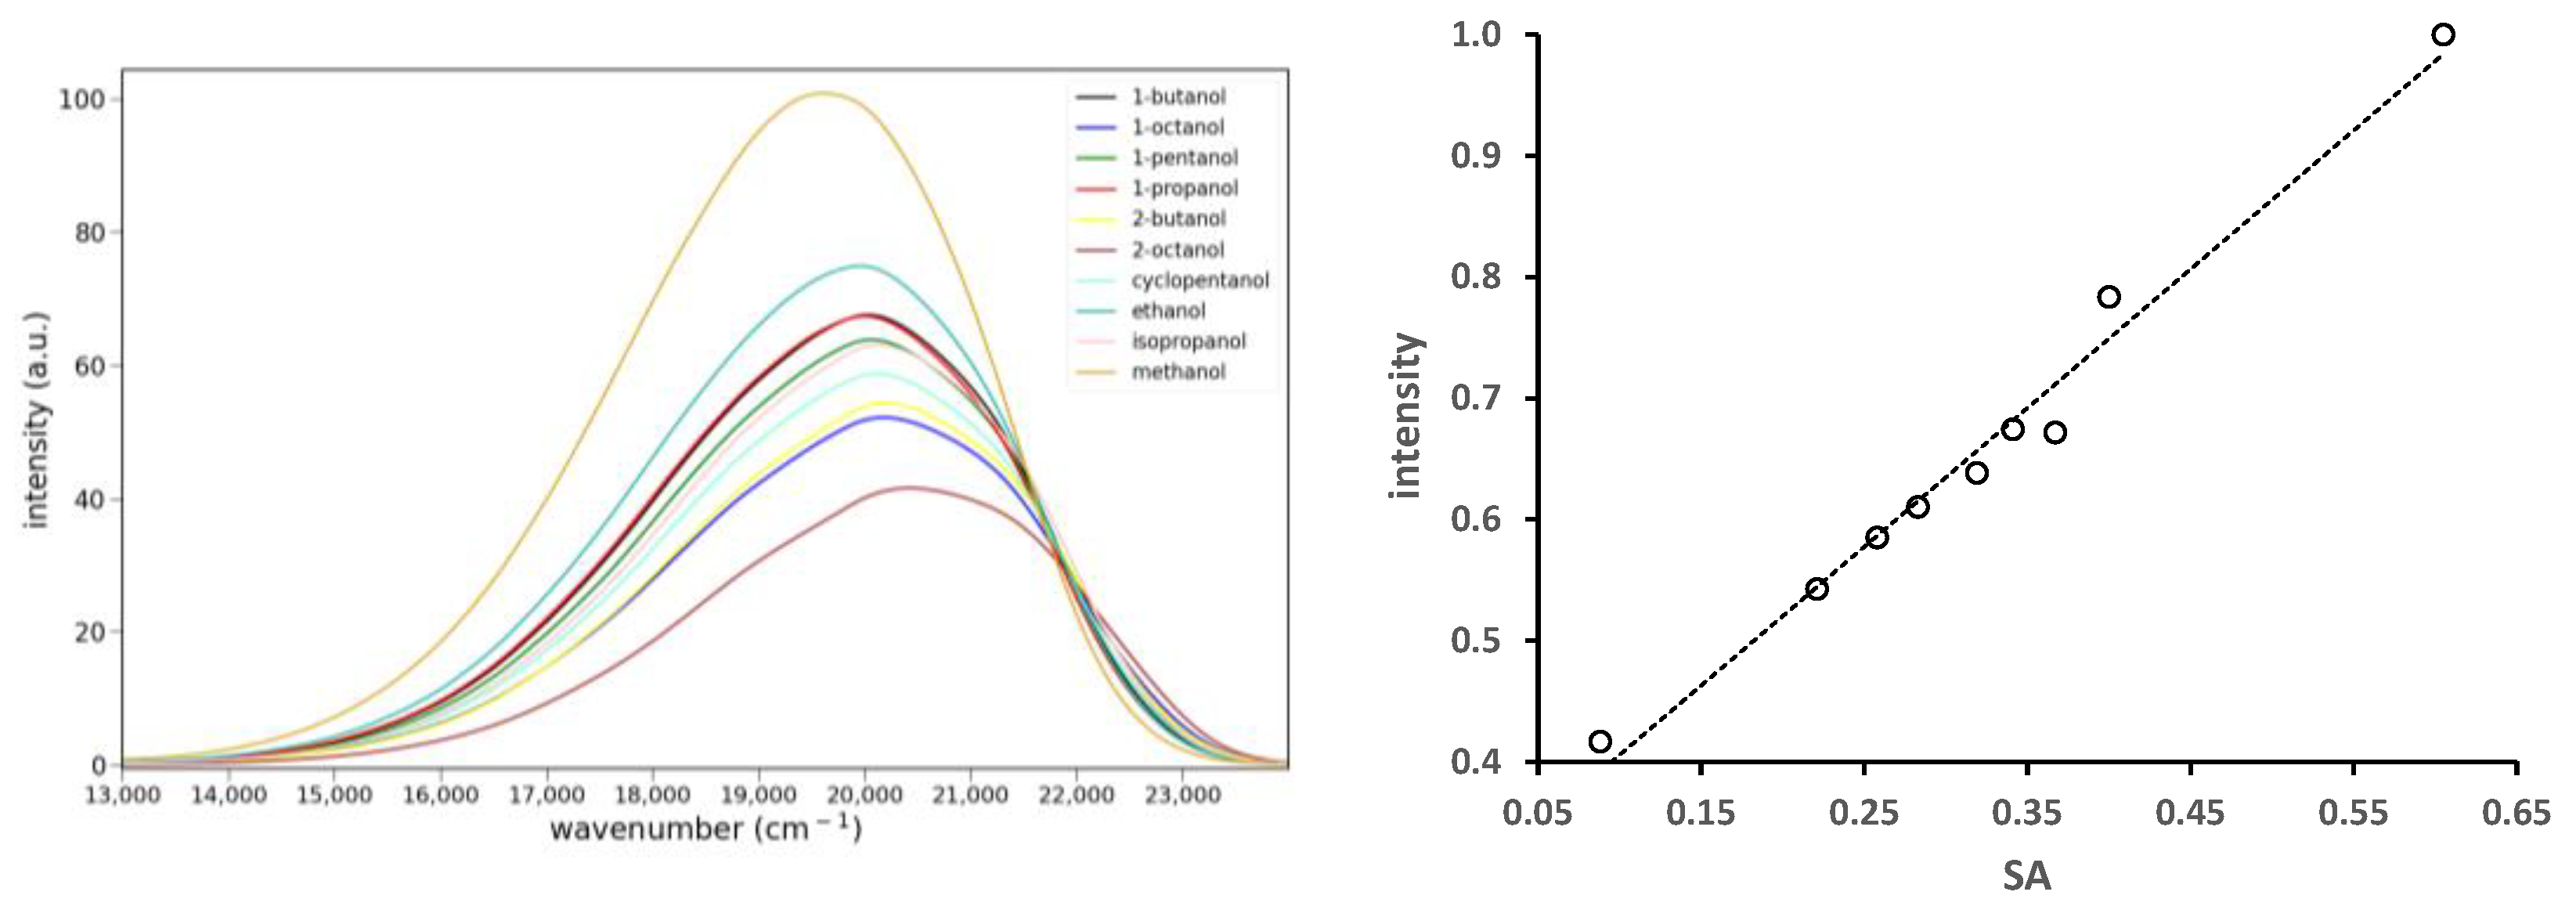
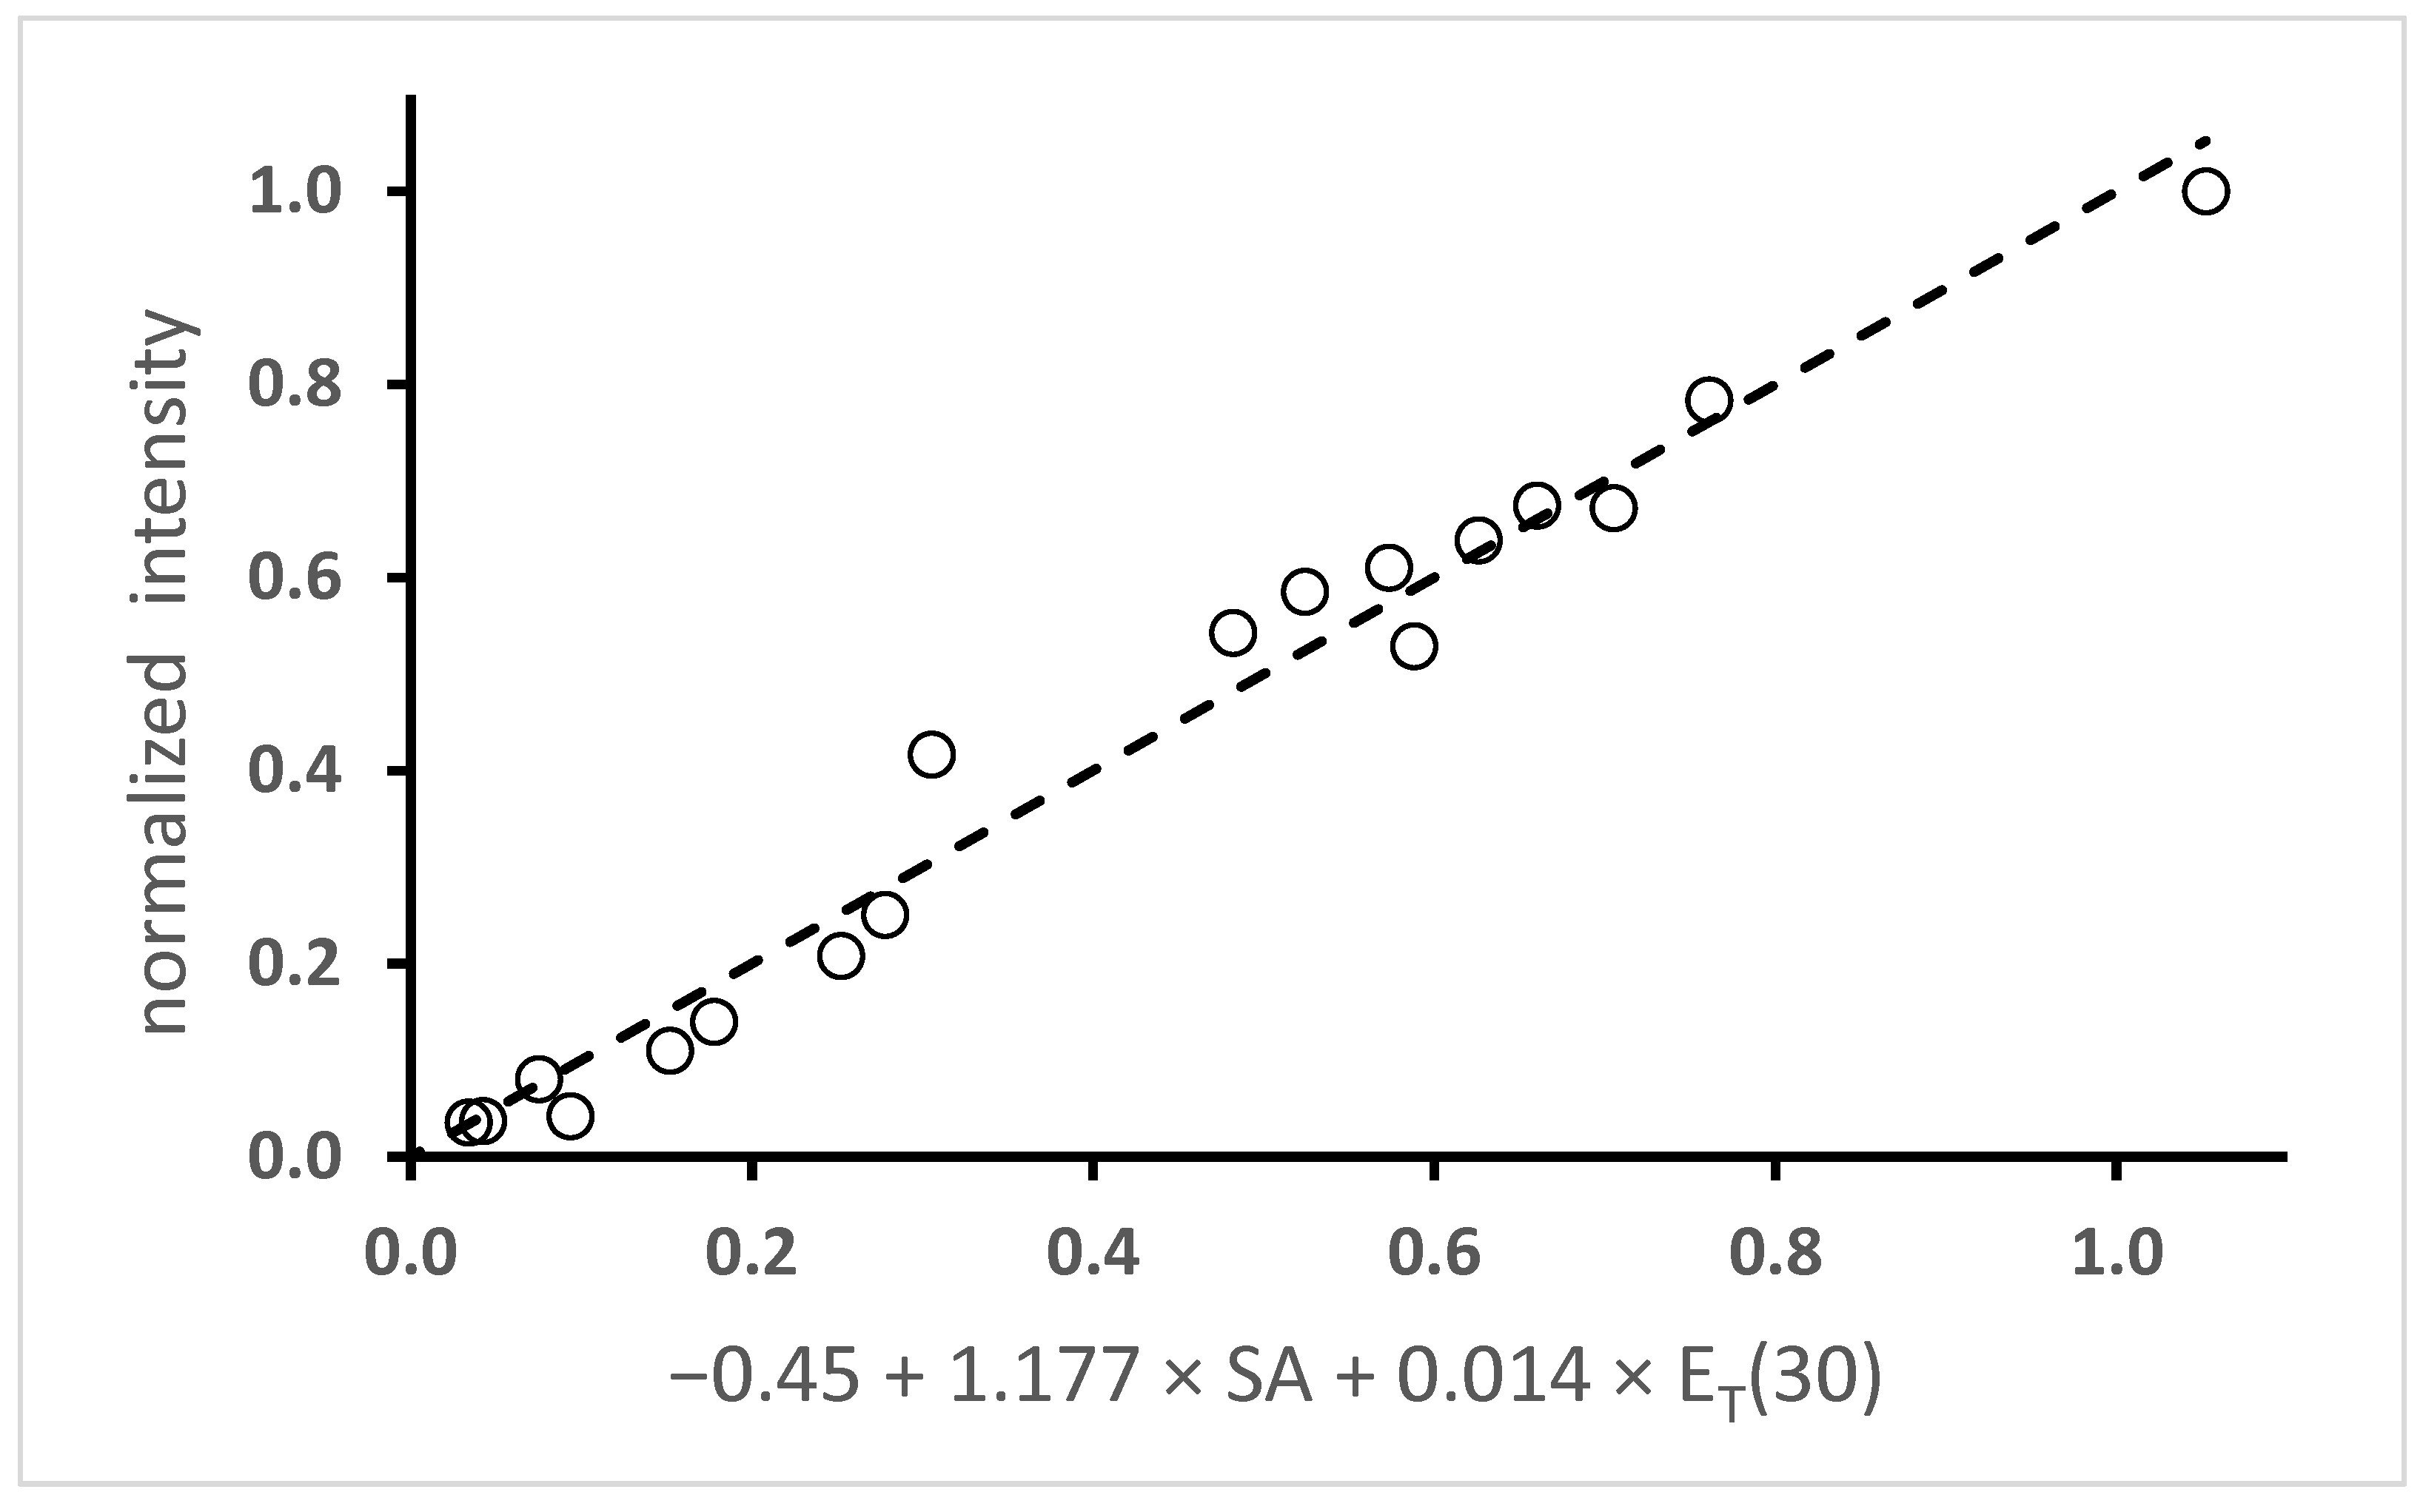
2.2.4. H-Bonding Turn-On Fluorescence
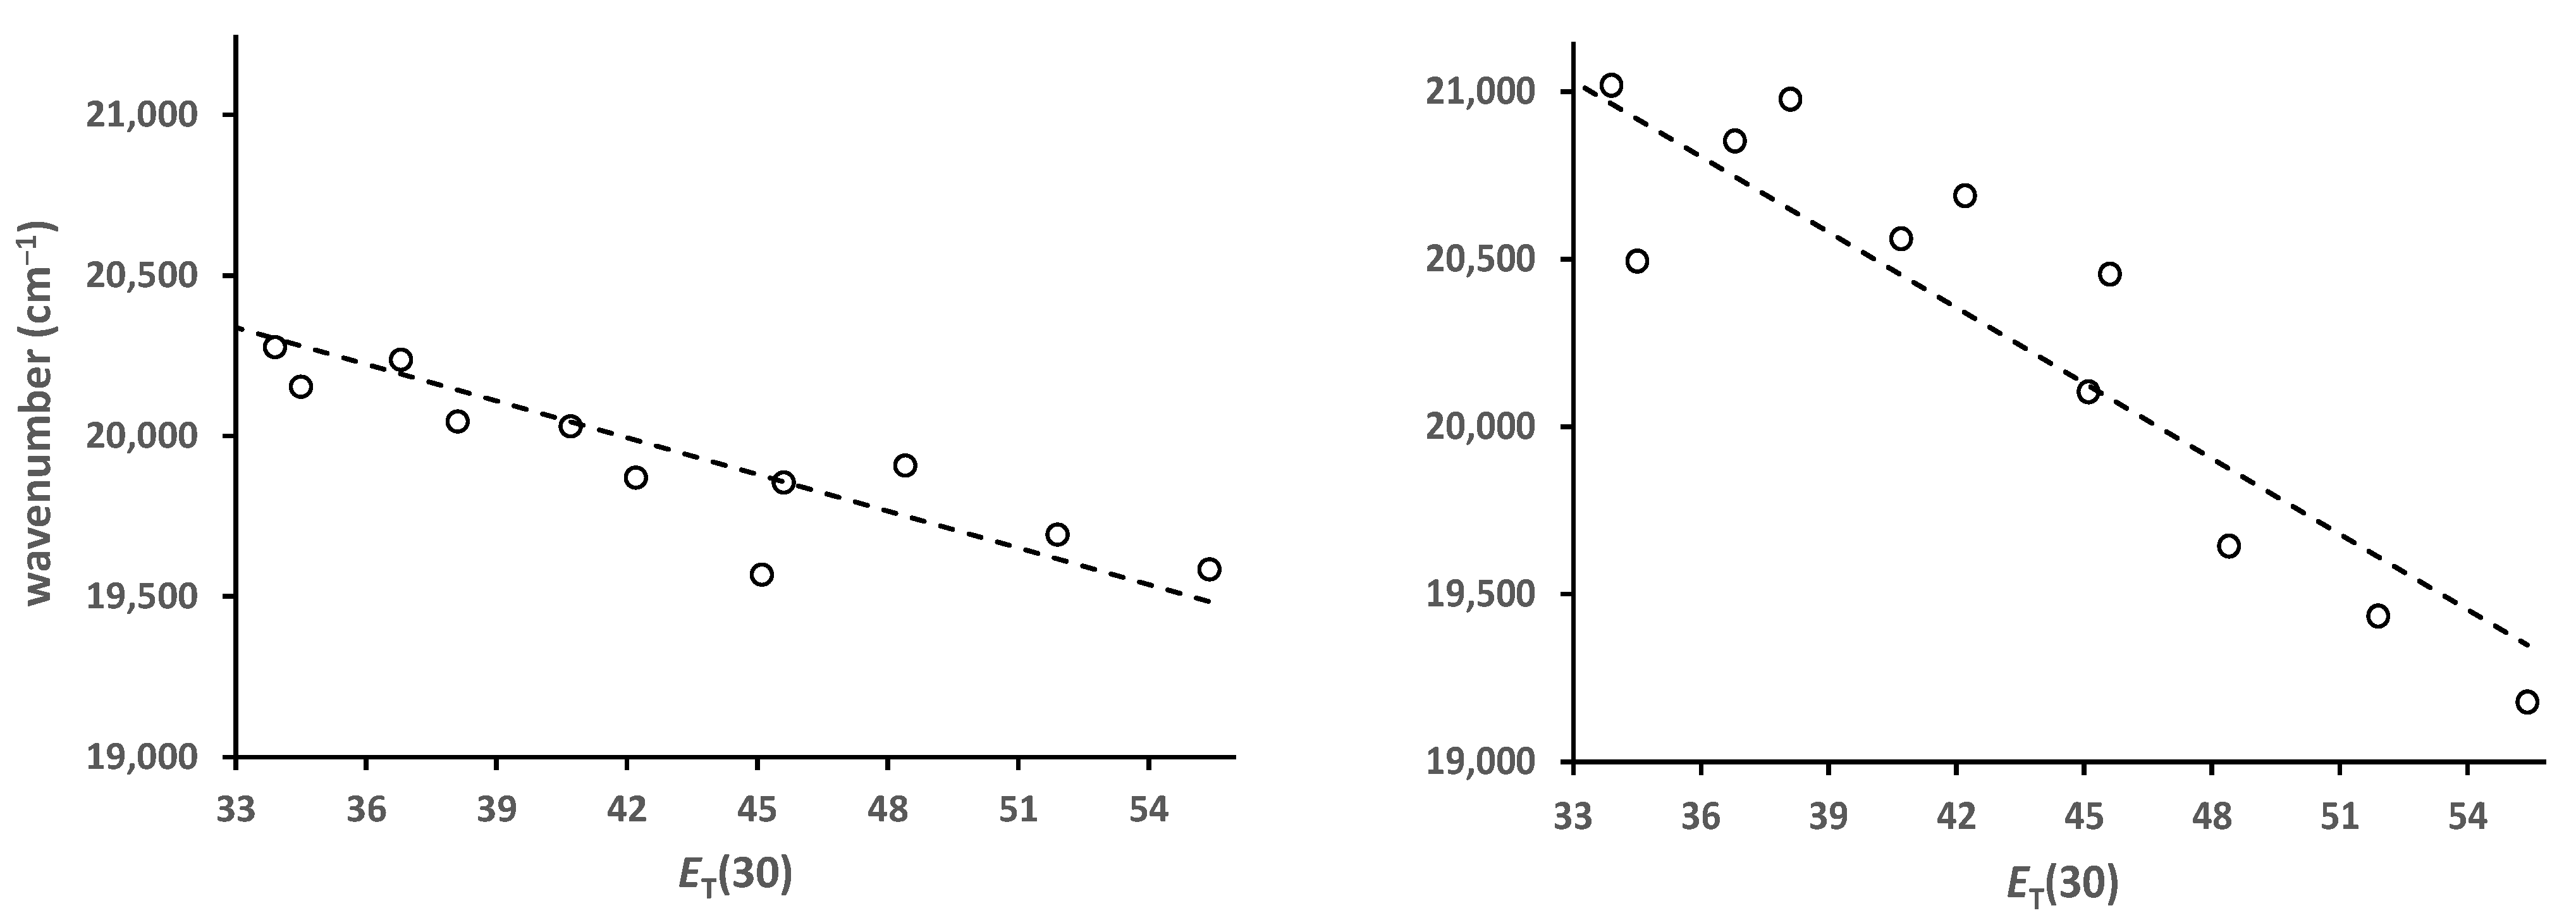
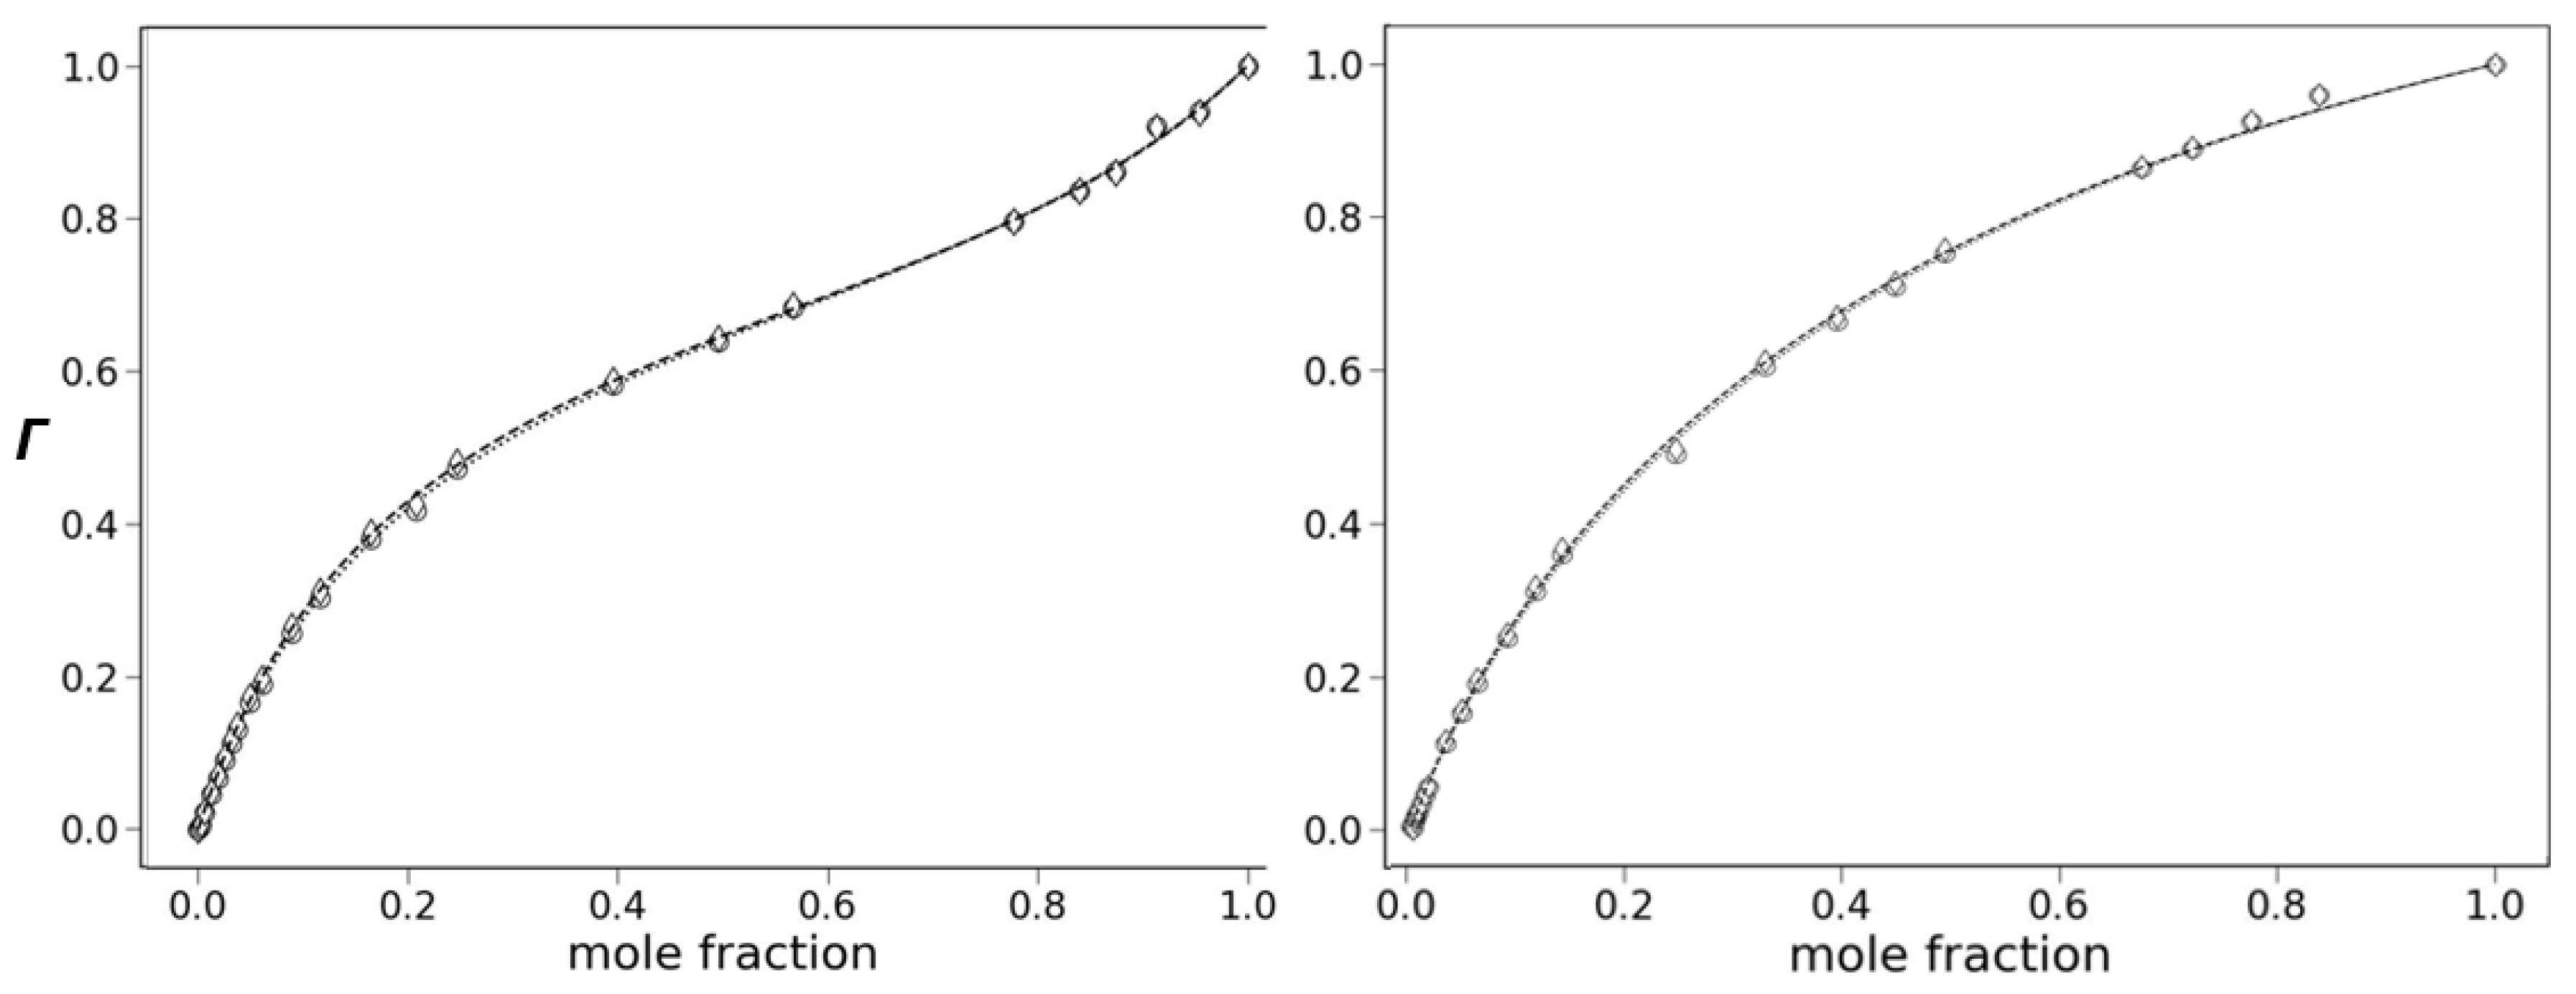
2.2.5. Preferential Solvation
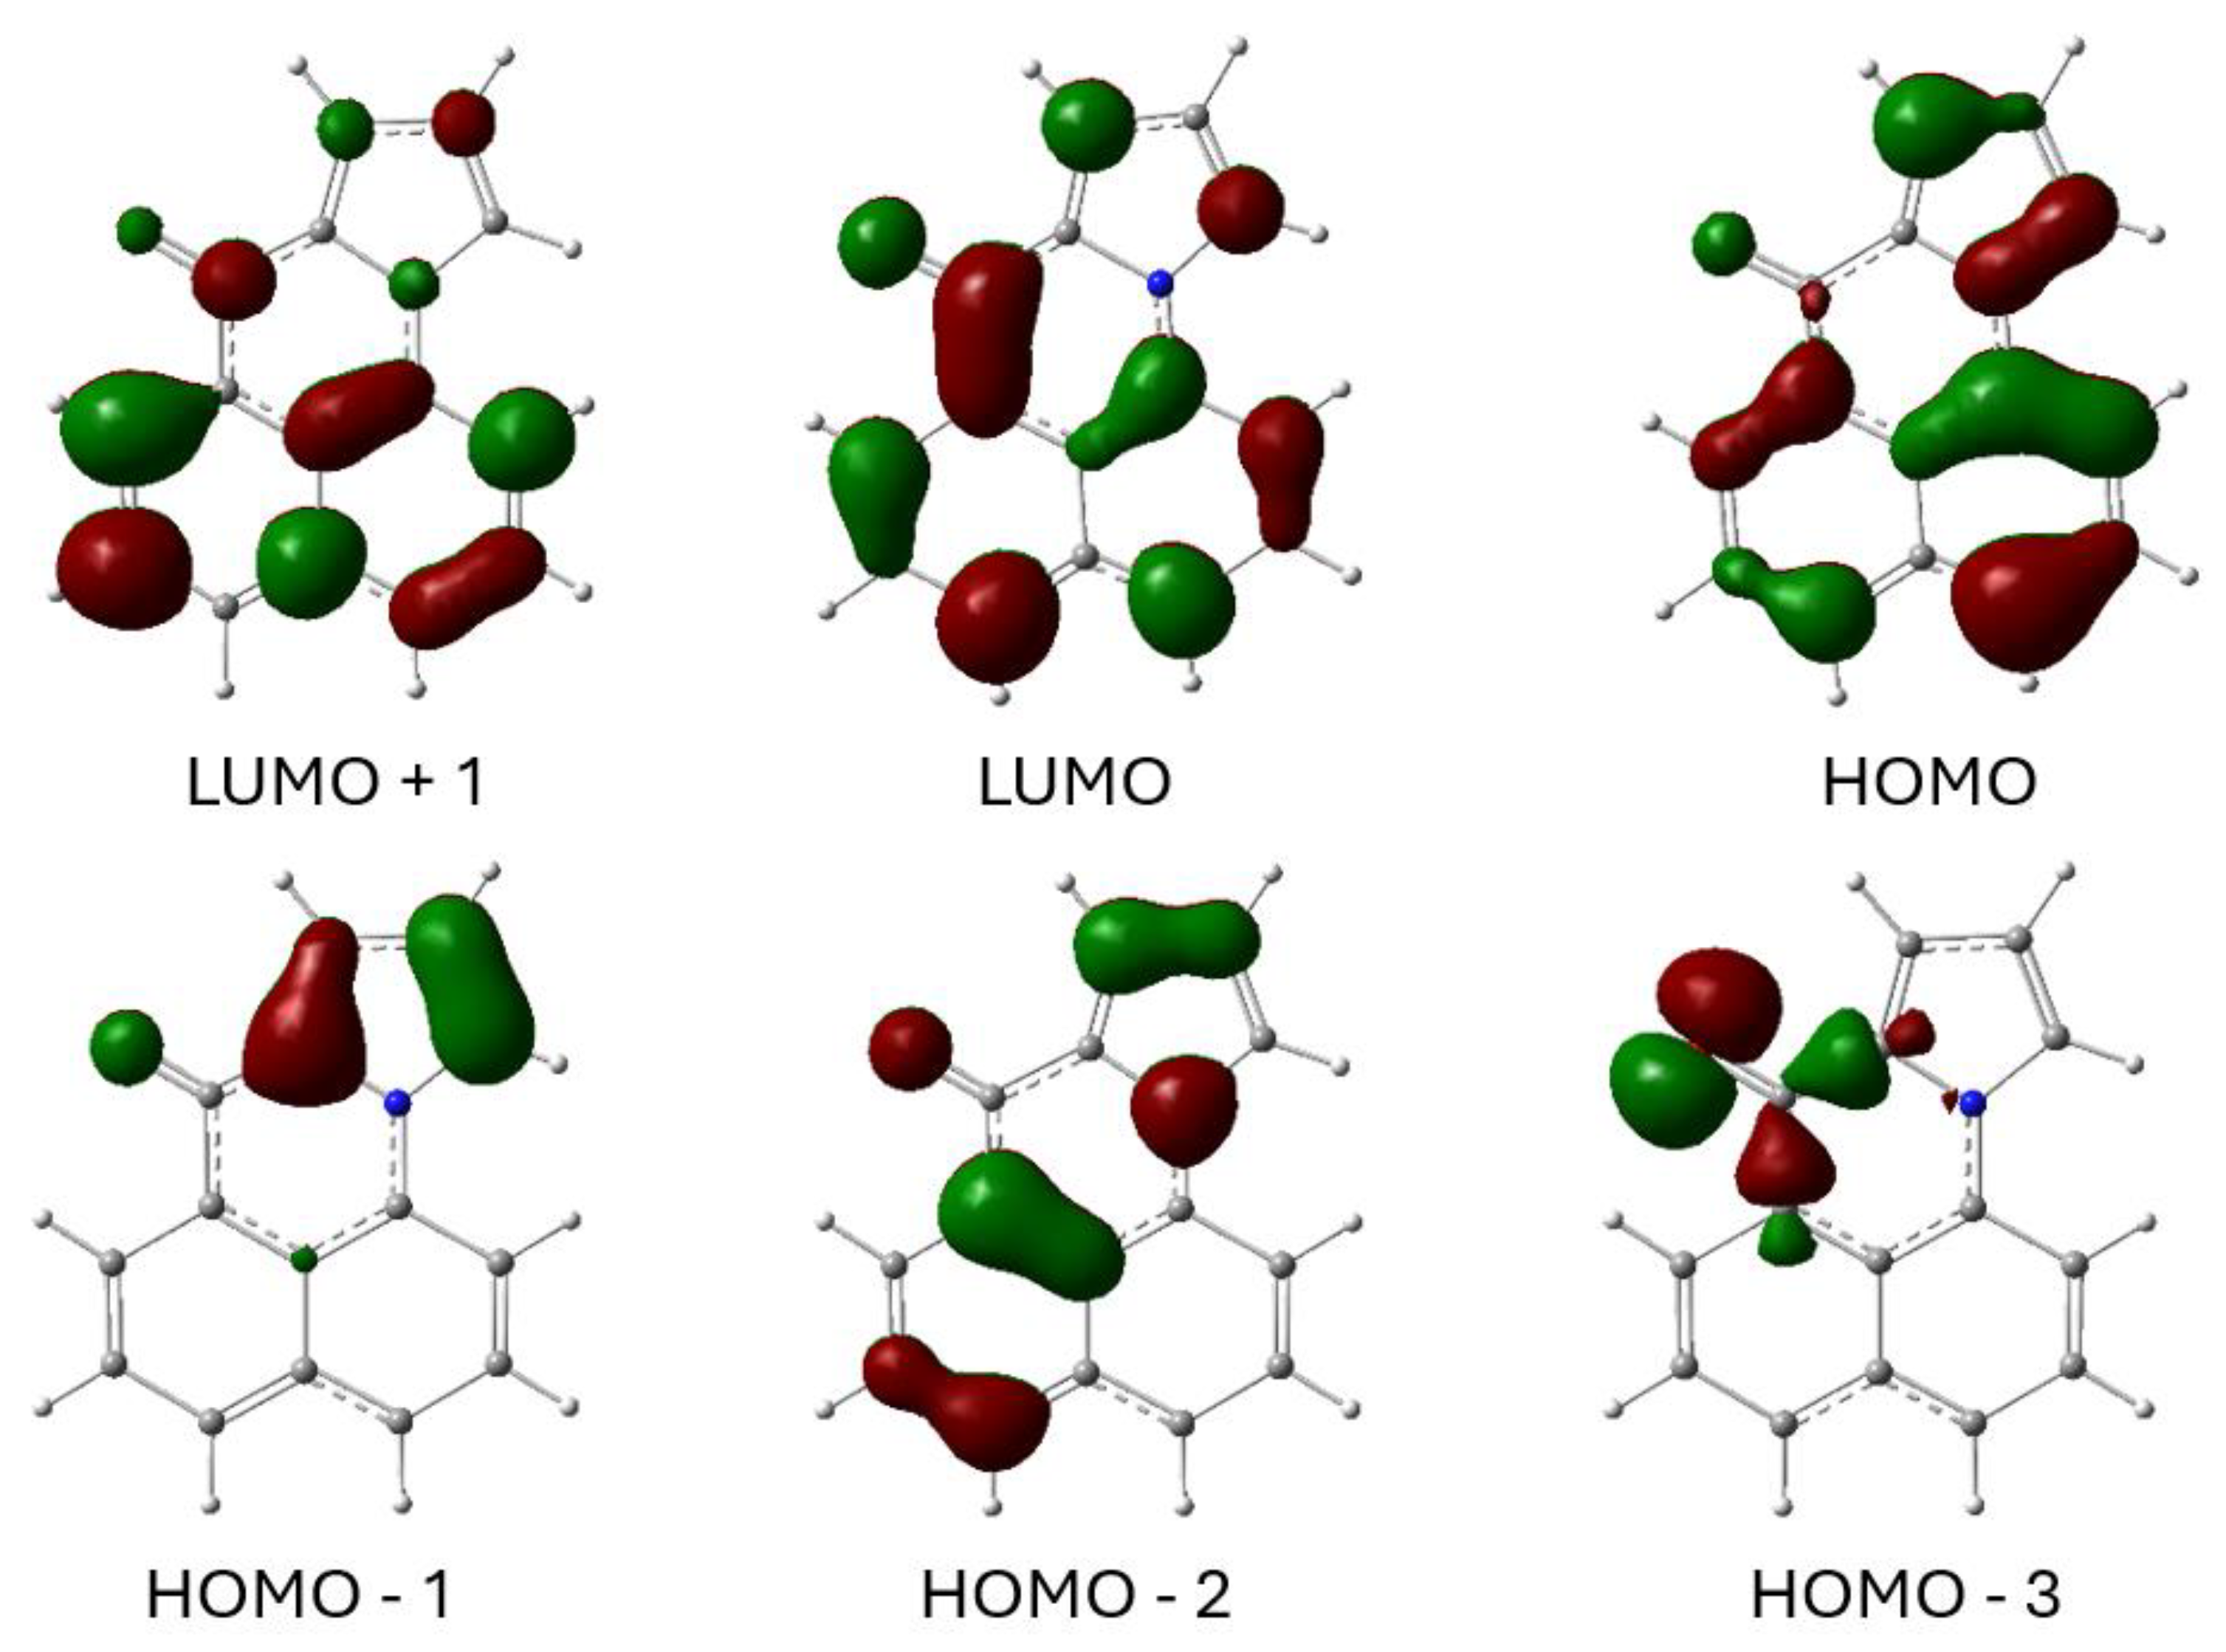
2.3. Computational Studies
3. Materials and Methods
3.1. 1H-Naphtho [1,8-de][1,2,3]triazine (2)
3.2. 8-Bromonaphthalen-1-amine (3)
3.3. 1-(8-Bromonaphthalen-1-yl)-1H-pyrrole (4)
3.4. Ethyl 8-(1H-pyrrol-1-yl)-1-naphthoate (5)
3.5. 7H-benzo[de]pyrrolo[1,2-a]quinolin-7-one (6)
3.6. (8-(1H-pyrrol-1-yl)naphthalen-1-yl)(phenyl)methanol (7)
3.7. 7-Phenyl-10H-benzo[de]pyrrolo [1,2-a]quinolin-10-one (8)
4. Conclusions
Supplementary Materials
Author Contributions
Funding
Data Availability Statement
Acknowledgments
Conflicts of Interest
References
- Weber, G.; Farris, F.J. Synthesis and Spectral Properties of a Hydrophobic Fluorescent Probe: 6-Propionyl-2-(Dimethylamino) Naphthalene. Biochemistry 1979, 18, 3075–3078. [Google Scholar] [CrossRef] [PubMed]
- Lobo, B.C.; Abelt, C.J. Does PRODAN Possess a Planar or Twisted Charge-Transfer Excited State? Photophysical Properties of Two PRODAN Derivatives. J. Phys. Chem. A 2003, 107, 10938–10943. [Google Scholar] [CrossRef]
- Chen, T.; Lee, S.W.; Abelt, C.J. 1,5-Prodan Emits from a Planar Intramolecular Charge-Transfer Excited State. ACS Omega 2018, 3, 4816–4823. [Google Scholar] [CrossRef]
- Abelt, C.; Sweigart, K. Twisted 8-Acyl-1-Dialkyl-Amino-Naphthalenes Emit from a Planar Intramolecular Charge Transfer Excited State. Photochem 2024, 4, 1–13. [Google Scholar] [CrossRef]
- Kiefl, C. Correlated Rotations and Unusual Fluorescence Properties of peri-Substituted, Axially Chiral Naphthyl Ketones. Eur. J. Org. Chem. 2000, 2000, 3279–3286. [Google Scholar] [CrossRef]
- Vomero, S.; Chimenti, F.; Porretta, G.C.; Giuliano, R.; Artico, M. Research on substances with antineoplastic activity. XLVI. Synthesis of derivatives of 11H-benzo(e)-pyrrolo(1,2-a)-indole and 7H-benzo-(d,e)-pyrrolo-(1,2-a)-quinoline. Farm. Sci. 1972, 27, 786–794. [Google Scholar] [PubMed]
- Bulgarevich, S.B.; Ivanova, N.A.; Movshovich, D.Y.; Mannschreck, A.; Kiefl, C. Conformational Investigation of 1,8-Disubstituted Naphthalenes as Solutes by Kerr Effect and Dipole Moment Methods. J. Mol. Struct. 1994, 326, 17–24. [Google Scholar] [CrossRef]
- Abelt, C.; Day, I.; Zhao, J.; Pike, R. Fluorescence of Half-Twisted 10-Acyl-1-Methyltetrahydrobenzoquinolines. Molecules 2024, 29, 3016. [Google Scholar] [CrossRef]
- Fieser, L.F.; Seligman, A.M. Synthetic Routes to Meso Substituted 1,2-Benzanthracene Derivatives. J. Am. Chem. Soc. 1939, 61, 136–142. [Google Scholar] [CrossRef]
- Reichardt, C.; Welton, T. Solvents and Solvent Effects in Organic Chemistry; Wiley-VCH Verlag GmbH: Weinheim, Germany, 2011; ISBN 9783527324736. [Google Scholar]
- Waghorne, W.E. Solvent Acidity and Basicity Scales: Analysis of Catalan’s SB and SA Scales and Gutmann’s Acceptor Number and Comparison with Kamlet and Taft’s β and α Solvent Scales, Gutmann’s Donor Number and Abraham’s B and A Solute Scales. J. Sol. Chem. 2024, 53, 747–760. [Google Scholar] [CrossRef]
- Catalán, J. Toward a Generalized Treatment of the Solvent Effect Based on Four Empirical Scales: Dipolarity (SdP, a New Scale), Polarizability (SP), Acidity (SA), and Basicity (SB) of the Medium. J. Phys. Chem. B 2009, 113, 5951–5960. [Google Scholar] [CrossRef] [PubMed]
- Anderson, R.S.; Nagirimadugu, N.V.; Abelt, C.J. Fluorescence Quenching of Carbonyl-Twisted 5-Acyl-1-Dimethylaminonaphthalenes by Alcohols. ACS Omega 2019, 4, 14067–14073. [Google Scholar] [CrossRef]
- Naldrett, H.J.; Abelt, C.J. Turn-on Fluorescence of a 6-Acyl-1-Benzoindole by Alcohols. J. Photochem. Photobiol. A Chem. 2022, 432, 114121. [Google Scholar] [CrossRef]
- Rosés, M.; Ràfols, C.; Ortega, J.; Bosch, E. Solute–Solvent and Solvent–Solvent Interactions in Binary Solvent Mixtures. Part 1. A Comparison of Several Preferential Solvation Models for Describing ET(30) Polarity of Bipolar Hydrogen Bond Acceptor-Cosolvent Mixtures. J. Chem. Soc. Perkin Trans. 2 1995, 1995, 1607–1615. [Google Scholar] [CrossRef]
- Bosch, E.; Roses, M.; Herodes, K.; Koppel, I.; Leito, I.; Koppel, I.; Taal, V. Solute-solvent and Solvent-solvent Interactions in Binary Solvent Mixtures. 2. Effect of Temperature on the ET(30) Polarity Parameter of Dipolar Hydrogen Bond Acceptor-hydrogen Bond Donor Mixtures. J. Phys. Org. Chem. 1996, 9, 403–410. [Google Scholar] [CrossRef]
- Ortega, J.; Ràfols, C.; Bosch, E.; Rosés, M. Solute–Solvent and Solvent–Solvent Interactions in Binary Solvent Mixtures. Part 3. The ET(30) Polarity of Binary Mixtures of Hydroxylic Solvents. J. Chem. Soc. Perkin Trans. 2 1996, 1996, 1497–1503. [Google Scholar] [CrossRef]
- Bosch, E.; Rived, F.; Rosés, M. Solute–Solvent and Solvent–Solvent Interactions in Binary Solvent Mixtures. Part 4. Preferential Solvation of Solvatochromic Indicators in Mixtures of 2-Methylpropan-2-ol with Hexane, Benzene, Propan-2-ol, Ethanol and Methanol. J. Chem. Soc. Perkin Trans. 2 1996, 1996, 2177–2184. [Google Scholar] [CrossRef]
- Ràfols, C.; Rosés, M.; Bosch, E. Solute–Solvent and Solvent–Solvent Interactions in Binary Solvent Mixtures. Part 5. Preferential Solvation of Solvatochromic Indicators in Mixtures of Propan-2-ol with Hexane, Benzene, Ethanol and Methanol. J. Chem. Soc. Perkin Trans. 2 1997, 1997, 243–248. [Google Scholar] [CrossRef]
- Rosés, M.; Buhvestov, U.; Ràfols, C.; Rived, F.; Bosch, E. Solute–Solvent and Solvent–Solvent Interactions in Binary Solvent Mixtures. Part 6. A Quantitative Measurement of the Enhancement of the Water Structure in 2-Methylpropan-2-ol–Water and Propan-2-ol–Water Mixtures by Solvatochromic Indicators. J. Chem. Soc. Perkin Trans. 2 1997, 1997, 1341–1348. [Google Scholar] [CrossRef]
- Buhvestov, U.; Rived, F.; Ràfols, C.; Bosch, E.; Rosés, M. Solute–Solvent and Solvent–Solvent Interactions in Binary Solvent Mixtures. Part 7. Comparison of the Enhancement of the Water Structure in Alcohol–Water Mixtures Measured by Solvatochromic Indicators. J. Phys. Org. Chem. 1998, 11, 185–192. [Google Scholar] [CrossRef]
- Herodes, K.; Leito, I.; Koppel, I.; Rosés, M. Solute–Solvent and Solvent–Solvent Interactions in Binary Solvent Mixtures. Part 8. The ET(30) Polarity of Binary Mixtures of Formamides with Hydroxylic Solvents. J. Phys. Org. Chem. 1999, 12, 109–115. [Google Scholar] [CrossRef]
- Nikitina, Y.Y.; Iqbal, E.S.; Yoon, H.J.; Abelt, C.J. Preferential Solvation in Carbonyl-Twisted PRODAN Derivatives. J. Phys. Chem. A 2013, 117, 9189–9195. [Google Scholar] [CrossRef] [PubMed]
- Frisch, M.J.; Trucks, G.W.; Schlegel, H.B.; Scuseria, G.E.; Robb, M.A.; Cheeseman, J.R.; Scalmani, G.; Barone, V.; Petersson, G.A.; Nakatsuji, H.; et al. Gaussian 16, Version 1.1; Gaussian, Inc.: Wallingford, CT, USA, 2016. [Google Scholar]
- Lakowicz, J.R. Principles of Fluorescence Spectroscopy; Springer: Boston, MA, USA, 1999; ISBN 978-1-4757-3063-0. [Google Scholar]
- Bhowmik, S.; Dutta, A.; Sen, P. Ultrafast Intersystem Crossing in Benzanthrone: Effect of Hydrogen Bonding and Viscosity. J. Phys. Chem. A 2024, 128, 6864–6878. [Google Scholar] [CrossRef] [PubMed]
- Dalton, J.C.; Montgomery, F.C. Solvent Effects on Thioxanthone Fluorescence. J. Am. Chem. Soc. 1974, 96, 6230–6232. [Google Scholar] [CrossRef]
- Villnow, T.; Ryseck, G.; Rai-Constapel, V.; Marian, C.M.; Gilch, P. Chimeric Behavior of Excited Thioxanthone in Protic Solvents: I. Experiments. J. Phys. Chem. A 2014, 118, 11696–11707. [Google Scholar] [CrossRef]
- Rai-Constapel, V.; Villnow, T.; Ryseck, G.; Gilch, P.; Marian, C.M. Chimeric Behavior of Excited Thioxanthone in Protic Solvents: II. Theory. J. Phys. Chem. A 2014, 118, 11708–11717. [Google Scholar] [CrossRef]
- Turro, N.J.; Ramamurthy, V.; Scaiano, J.C.; Ramamurthy, V. Modern Molecular Photochemistry of Organic Molecules; University Science Books: Sausalito, CA, USA, 2010; ISBN 978-1-891389-25-2. [Google Scholar]

| SA | ET(30) | SA | SdP | SA | ET(30) | SdP | |
|---|---|---|---|---|---|---|---|
| coef. | 1.177 | 0.014 | 1.598 | 0.093 | 0.917 | 0.025 | −0.181 |
| std error | 0.132 | 0.004 | 0.090 | 0.065 | 0.153 | 0.005 | 0.071 |
| log10p | −6.9 | −3.0 | −11.2 | −0.8 | −4.6 | −3.6 | −1.7 |
| F-value | 337 | 186 | 305 | ||||
| RH | Toluene | Acetonitrile | ||
|---|---|---|---|---|
| Γ1 | Γ2 | Γ1 | Γ2 | |
| r | 0.65 | 0.66 | 0.26 | 0.26 |
| f1/0 | 6.2 | 6.5 | 14.5 | 13.5 |
| f2/0 | 1.6 | 1.6 | 29.2 | 29.2 |
| Φ1 | 0.66 | 0.67 | 0.41 | 0.43 |
| Φ0 | 0.03 | 0.20 | ||
| Vacuum | Toluene | Toluene Methanol c | Acetonitrile | |||||
|---|---|---|---|---|---|---|---|---|
| So→S1 a | 84.0 | 81.3 | d | 80.3 | ||||
| So←S1 a | 56.9 | 53.4 | 51.9 | 49.2 | ||||
| So→Tnπ* b | 74.2 | 80.9 | d | 80.2 | ||||
| HO-3→LU | 0.63 | HO-3→LU | 0.42 | HO-3→LU | 0.42 | |||
| HO-3→LU+3 | −0.25 | HO-2→LU | 0.34 | HO-2→LU | 0.37 | |||
| HO→LU+4 | −0.23 | |||||||
| So←Tnπ* b | 62.2 | 67.7 | 62.4 | 72.0 | ||||
| HO-3→LU | −0.47 | HO-3→LU | 0.65 | HO-3→LU | 0.49 | HO-3→LU | 0.65 | |
| HO-1→LU | −0.29 | HO→LU+3 | −0.24 | |||||
| HO→LU+2 | 0.25 | |||||||
| S1-Tnπ* (→) | 9.8 | 0.4 | 0.4 | 0.1 | ||||
| S1-Tnπ* (←) | −5.3 | −14.3 | −10.5 | −22.8 |
| Toluene | Acetonitrile | |||||
|---|---|---|---|---|---|---|
| abs | em | em a | abs | em | ||
| calculated | λmax (nm) | 352 | 536 | 550 | 356 | 582 |
| Stokes shift (cm−1) | 9800 | 10,200 | 10,900 | |||
| μ (D) | 3.8 | 5.4 | 7.3 | 6.8 | 7.3 | |
| O | −0.57 | −0.60 | −0.67 | −0.62 | −0.65 | |
| N | 0.12 | 0.16 | 0.17 | 0.11 | 0.16 | |
| exp. | λmax (nm) | 387 | 476 | 479 | 386 | 489 |
| Stokes shift (cm−1) | 4800 | 5000 | 5400 | |||
| ET(30) | SA | ET(30) | SA | ET(30) | SdP | |
|---|---|---|---|---|---|---|
| coef. | −83 | −3100 | −42 | −1700 | −104 | 850 |
| std error | 8 | 300 | 13 | 500 | 8.0 | 230 |
| log p | −7.7 | −8.0 | −2.1 | −2.5 | −8.8 | −2.7 |
| F-value | 97 | 107 | 85 | 92 | ||
Disclaimer/Publisher’s Note: The statements, opinions and data contained in all publications are solely those of the individual author(s) and contributor(s) and not of MDPI and/or the editor(s). MDPI and/or the editor(s) disclaim responsibility for any injury to people or property resulting from any ideas, methods, instructions or products referred to in the content. |
© 2025 by the authors. Licensee MDPI, Basel, Switzerland. This article is an open access article distributed under the terms and conditions of the Creative Commons Attribution (CC BY) license (https://creativecommons.org/licenses/by/4.0/).
Share and Cite
Zhao, J.; Pike, R.; Abelt, C. Peri-Substituted Acyl Pyrrolyl Naphthalenes: Synthesis, Reactions and Photophysical Properties. Molecules 2025, 30, 1429. https://doi.org/10.3390/molecules30071429
Zhao J, Pike R, Abelt C. Peri-Substituted Acyl Pyrrolyl Naphthalenes: Synthesis, Reactions and Photophysical Properties. Molecules. 2025; 30(7):1429. https://doi.org/10.3390/molecules30071429
Chicago/Turabian StyleZhao, Junkai, Robert Pike, and Christopher Abelt. 2025. "Peri-Substituted Acyl Pyrrolyl Naphthalenes: Synthesis, Reactions and Photophysical Properties" Molecules 30, no. 7: 1429. https://doi.org/10.3390/molecules30071429
APA StyleZhao, J., Pike, R., & Abelt, C. (2025). Peri-Substituted Acyl Pyrrolyl Naphthalenes: Synthesis, Reactions and Photophysical Properties. Molecules, 30(7), 1429. https://doi.org/10.3390/molecules30071429