Article

An Investigation of WO3/V2O5/TiO2 Catalysts: Effects of WO3 on Morphology, Thermal Stability, and Activity for the Catalytic Oxidation of Dimethyl Sulfide

by
Gaytri Sharma
1,
Endalkachew Sahle-Demessie
2 and
Catherine B. Almquist
1,*
1
Chemical, Paper, Biomedical Engineering Department, Miami University, Oxford, OH 45056, USA
2
US Environmental Protection Agency, Cincinnati, OH 45220, USA
*
Author to whom correspondence should be addressed.
Molecules 2025, 30(11), 2436; https://doi.org/10.3390/molecules30112436
Submission received: 25 April 2025 / Revised: 20 May 2025 / Accepted: 29 May 2025 / Published: 2 June 2025
(This article belongs to the Special Issue Research on Heterogeneous Catalysis—2nd Edition)

Abstract

:
WO3/V2O5/TiO2 (WxV5TiO2) catalysts were prepared via a wet incipient method with a V/Ti mass ratio = 0.05 and a W/Ti mass ratio varying from 0 to 0.10. The catalysts were calcined in air for 24 h at temperatures of 400 °C, 500 °C, 550 °C, and 600 °C. The presence of WO3 on WxV5TiO2 catalysts inhibits morphological and crystal structure transformations as the calcination temperature increases from 400 °C to 600 °C. The results of this study give evidence that the active component of the catalyst is V on anatase TiO2. Therefore, the incorporation of WO3 onto an anatase TiO2 support widens the temperature range at which the WO3/V2O5/TiO2 catalyst maintains the anatase crystal structure and, hence, the performance of the catalyst. The catalytic oxidation of dimethyl sulfide (DMS) was used as a probe reaction to evaluate catalytic activity. The results indicate that WO3/V2O5/TiO2 catalysts are capable of effectively oxidizing DMS at relatively low reaction temperatures (250 °C), even under conditions of an elevated DMS concentration in air (1.6 vol%).

Graphical Abstract

1. Introduction

Catalytic oxidation is a widely applied technique for the abatement of volatile organic compounds (VOCs) from gaseous emissions streams, particularly in industry and environmental applications. This process involves the use of heterogeneous catalysts to facilitate the oxidation of VOCs at significantly lower temperatures than conventional thermal incineration, thereby reducing overall energy consumption and operational costs. Among its key advantages are high destruction efficiencies, minimal formation of secondary pollutants, and improved control over reaction conditions.
However, a primary limitation of catalytic oxidation is the potential for catalyst deactivation, which can compromise long-term process efficiency and reliability. Catalyst deactivation may result from exposure to elevated temperatures [1,2,3,4], which can lead to sintering or structural degradation of the active catalytic phase. In addition, the presence of compounds such as sulfur-containing species [3,5,6,7], chlorine, phosphorus, and alkali metals [8,9,10,11] can deactivate catalysts. These interactions can block active sites or alter the catalyst’s chemical composition, thereby reducing its catalytic activity and selectivity.
To maintain sustained catalytic performance, strategies such as catalyst regeneration, protective pretreatment of gas streams, and the development of more robust catalyst formulations are actively being investigated [12,13,14,15]. The selection of catalyst support materials and promoters also plays a critical role in enhancing resistance to poisoning and thermal degradation, thus extending catalyst lifespan under harsh operating conditions.
In the present study, the effects of the WO3 concentration on the thermal stability, morphology, and catalytic activity of WO3/V2O5/TiO2 catalysts were investigated for the oxidation of dimethyl sulfide (DMS). WO3/V2O5/TiO2 catalysts have been used commercially as a selective catalytic reduction (SCR) catalyst for de-NOx applications [16,17] and have been investigated extensively [12,14,15,16,17,18]. However, these catalysts have also been found to be active for the oxidation of VOCs [18,19,20,21,22,23,24,25,26,27,28,29,30,31,32,33], including dioxins and chlorinated hydrocarbons [21,22], aromatics [23,24,25,26,27], and methanol [28,29,30,31,32,33]. Based upon a review of the literature, the vanadium species in these catalysts are active for both de-NOx applications and for the oxidation of VOCs [16,17,18]. The addition of WO3 to the catalysts makes them less prone to thermal deactivation, and it inhibits the oxidation of SO2, making the catalysts more resistant to fouling by sulfur and alkali metals [16,17].
This paper makes two contributions to the scientific literature regarding this catalyst system: (1) it presents clear morphological changes in the catalyst in SEM images, with changes in the calcination temperature and W loading on WO3/V2O5/TiO2 catalysts; and (2) the coverage of vanadia species per unit surface area on anatase TiO2 significantly contributes to the active catalyst, whereas the surface area and WO3 have relatively minor roles in the catalytic activity of WO3/V2O5/TiO2 catalysts for the oxidation of dimethyl sulfide.
The motivation behind this study was to investigate the feasibility of using WO3/V2O5/TiO2 catalysts for treating non-condensable gases at their point of generation in a Kraft pulp and paper mill for either emission control or waste-to-value-added products. This motivation is shared by other researchers as well [34,35,36,37], who have researched methods to utilize and/or treat the waste gases from pulp and paper mills. Non-condensable gases often contain up to 5 vol% reduced sulfur compounds, with the predominant ones being dimethyl sulfide and methyl mercaptan [38]. Dimethyl sulfide (DMS) concentrations in pulp mill emissions can vary significantly based on the specific process stage, the equipment used, and whether emission control systems are in place. For instance, at evaporator vents prior to the scrubber, DMS concentrations can reach approximately 48,000 ppm (4.8%). However, the implementation of wet scrubbers can reduce this concentration to around 2500 ppm (0.25%) [39,40]. Currently, non-condensable gases are often directed over long distances through (sometimes miles of) piping to the mill’s recovery boiler, where the gases are burned, and the pulping chemicals are recovered. This practice is energy intensive, and it often burdens and/or limits the capacity of the recovery boiler at the mill.
The oxidation of dimethyl sulfide has been investigated by several researchers, in the atmosphere [41], with ozone and ozone-enhanced catalysis [42,43,44,45,46], with oxygen and catalysts [47,48], and with photocatalysts [49,50,51]. The predominant by-products of dimethyl sulfide (DMS) oxidation include dimethyl sulfoxide (DMSO), dimethyl sulfone (DMSO2), methane sulfinic acid, and methane sulfonic acid. In addition, complete mineralization products of sulfur have been observed, including SO2 and H2SO4. Possible mechanisms for vapor-phase oxidation of dimethyl sulfide are cited in the literature [41,42,48,49,50,51]. Sulfur-containing oxidation products of DMS are shown in Figure 1.
The goals of this study were to investigate the relative activities of the V/TiO2 catalysts as functions of WO3 loading and the calcination temperature. We used DMS as a probe molecule for this purpose. While a thorough investigation on industry-relevant conditions is recommended for future studies, these data were not acquired in this study.

2. Results

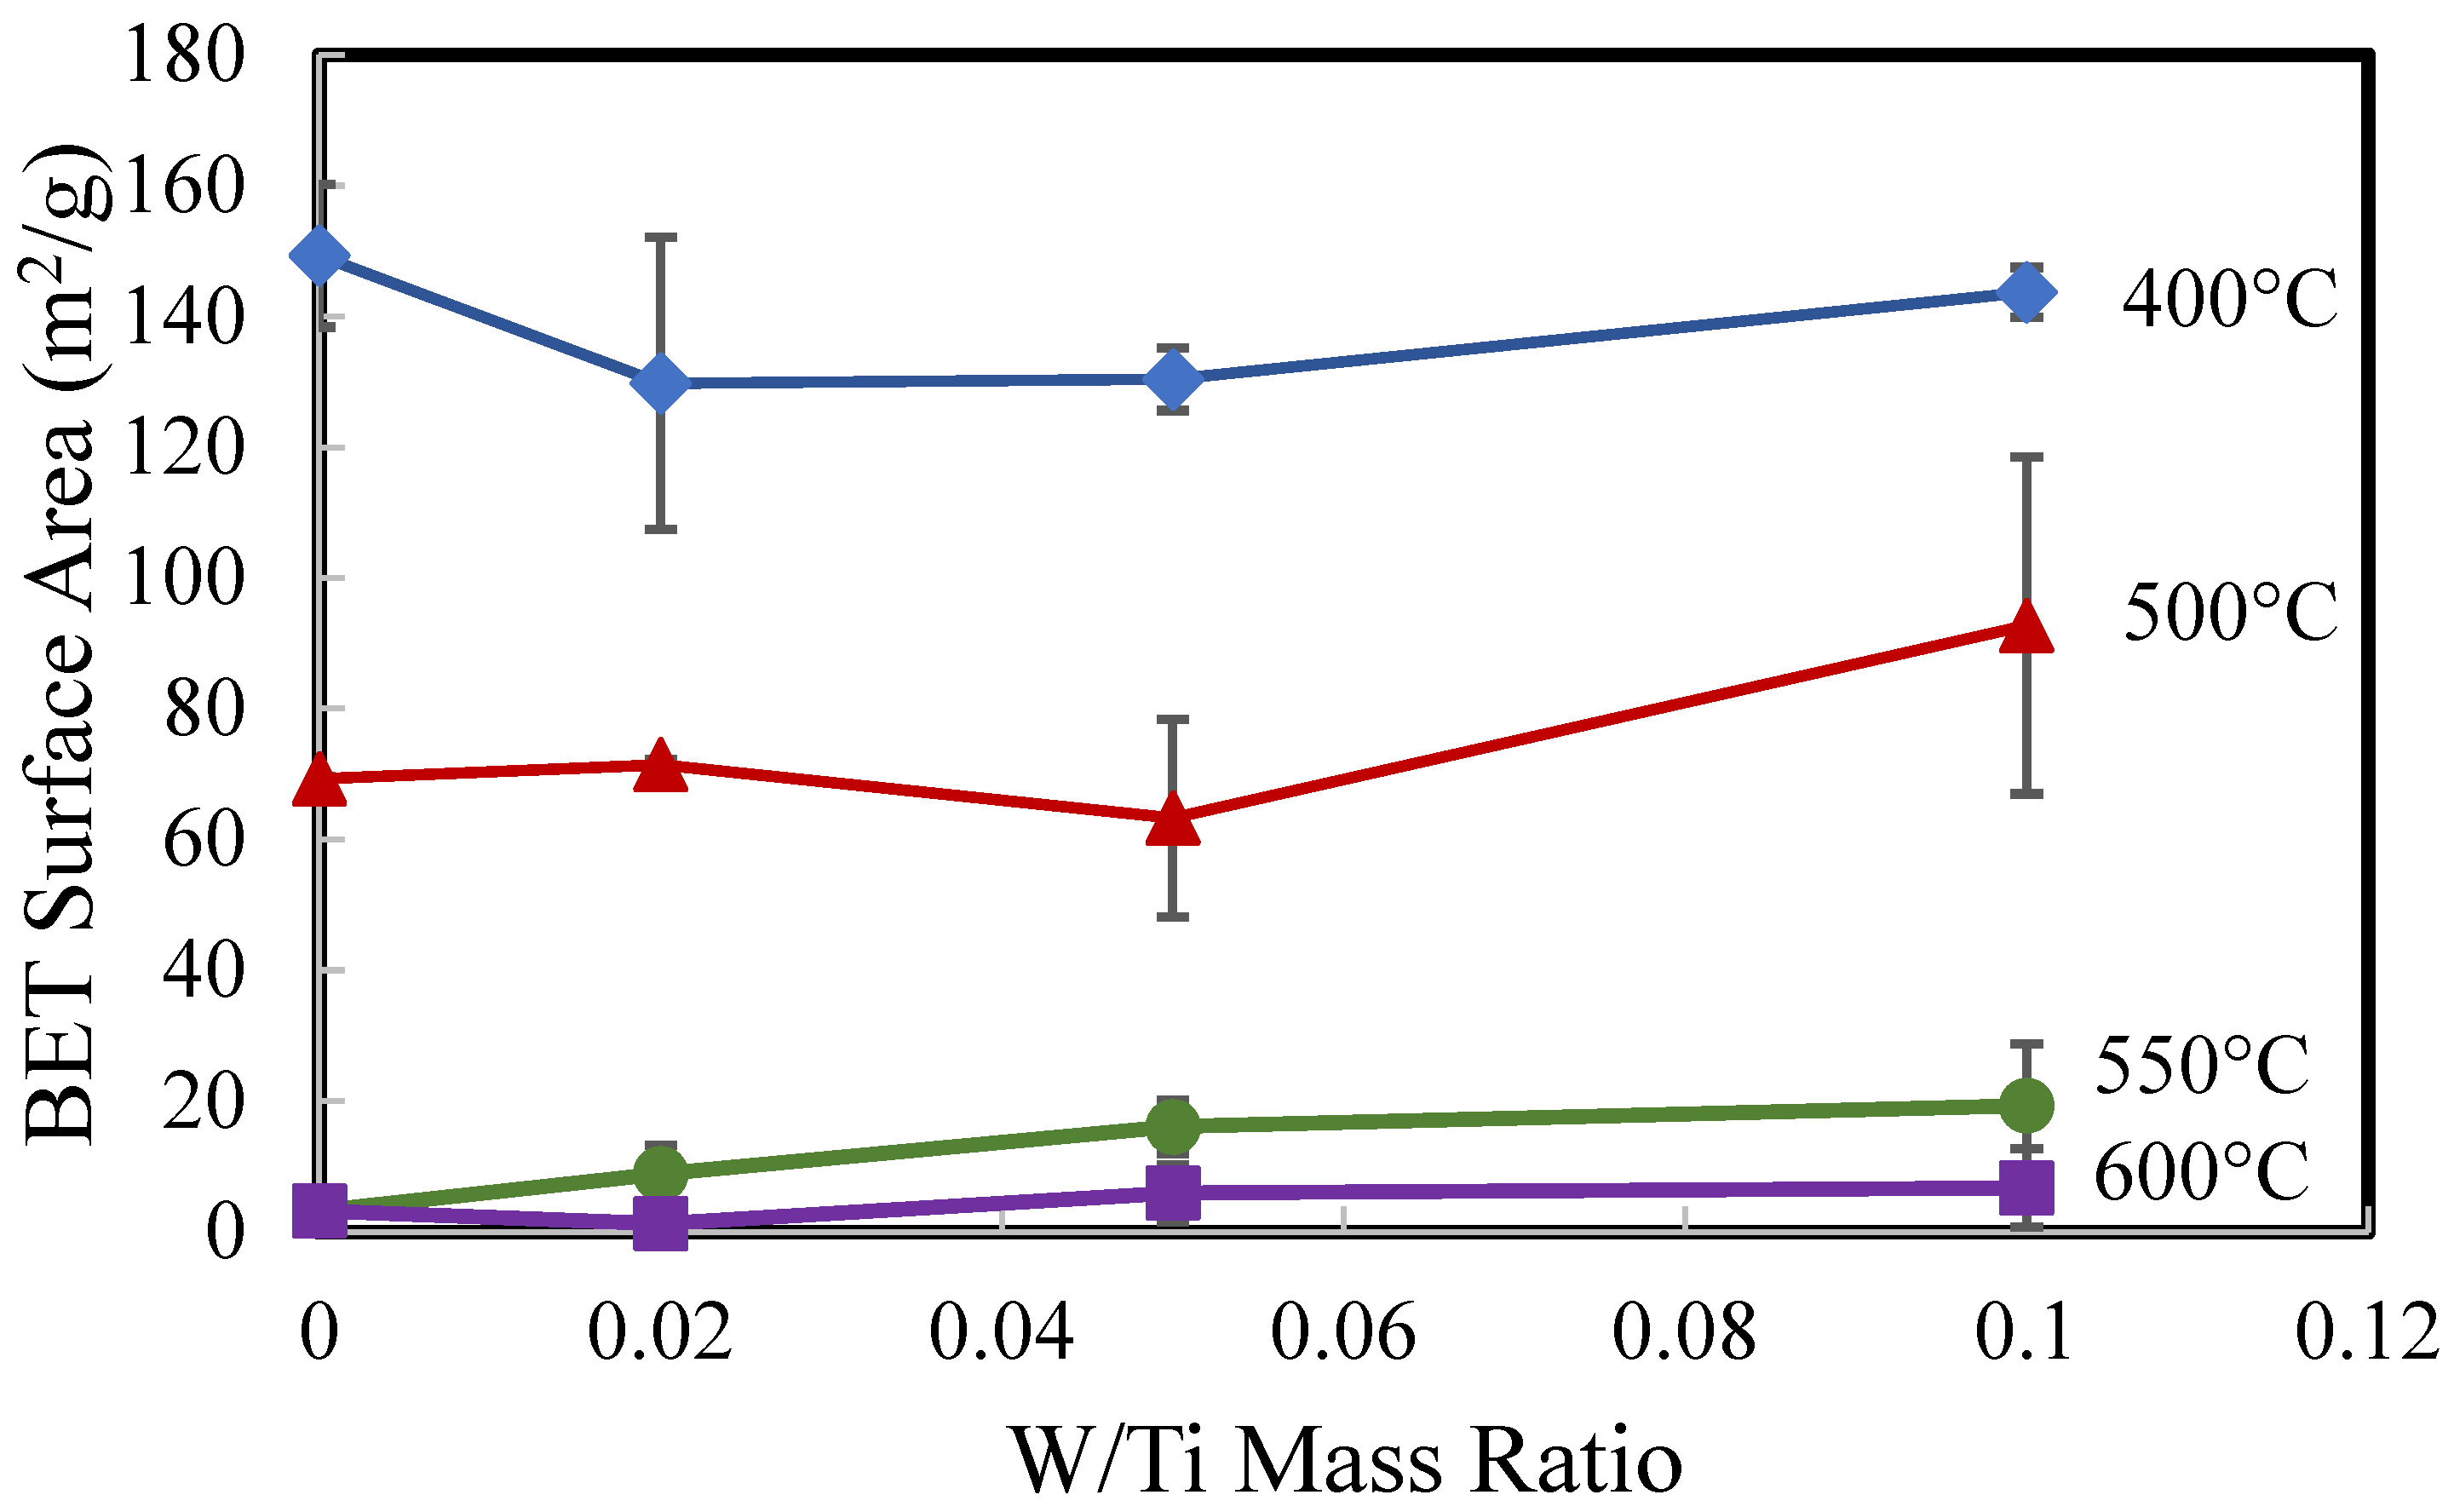
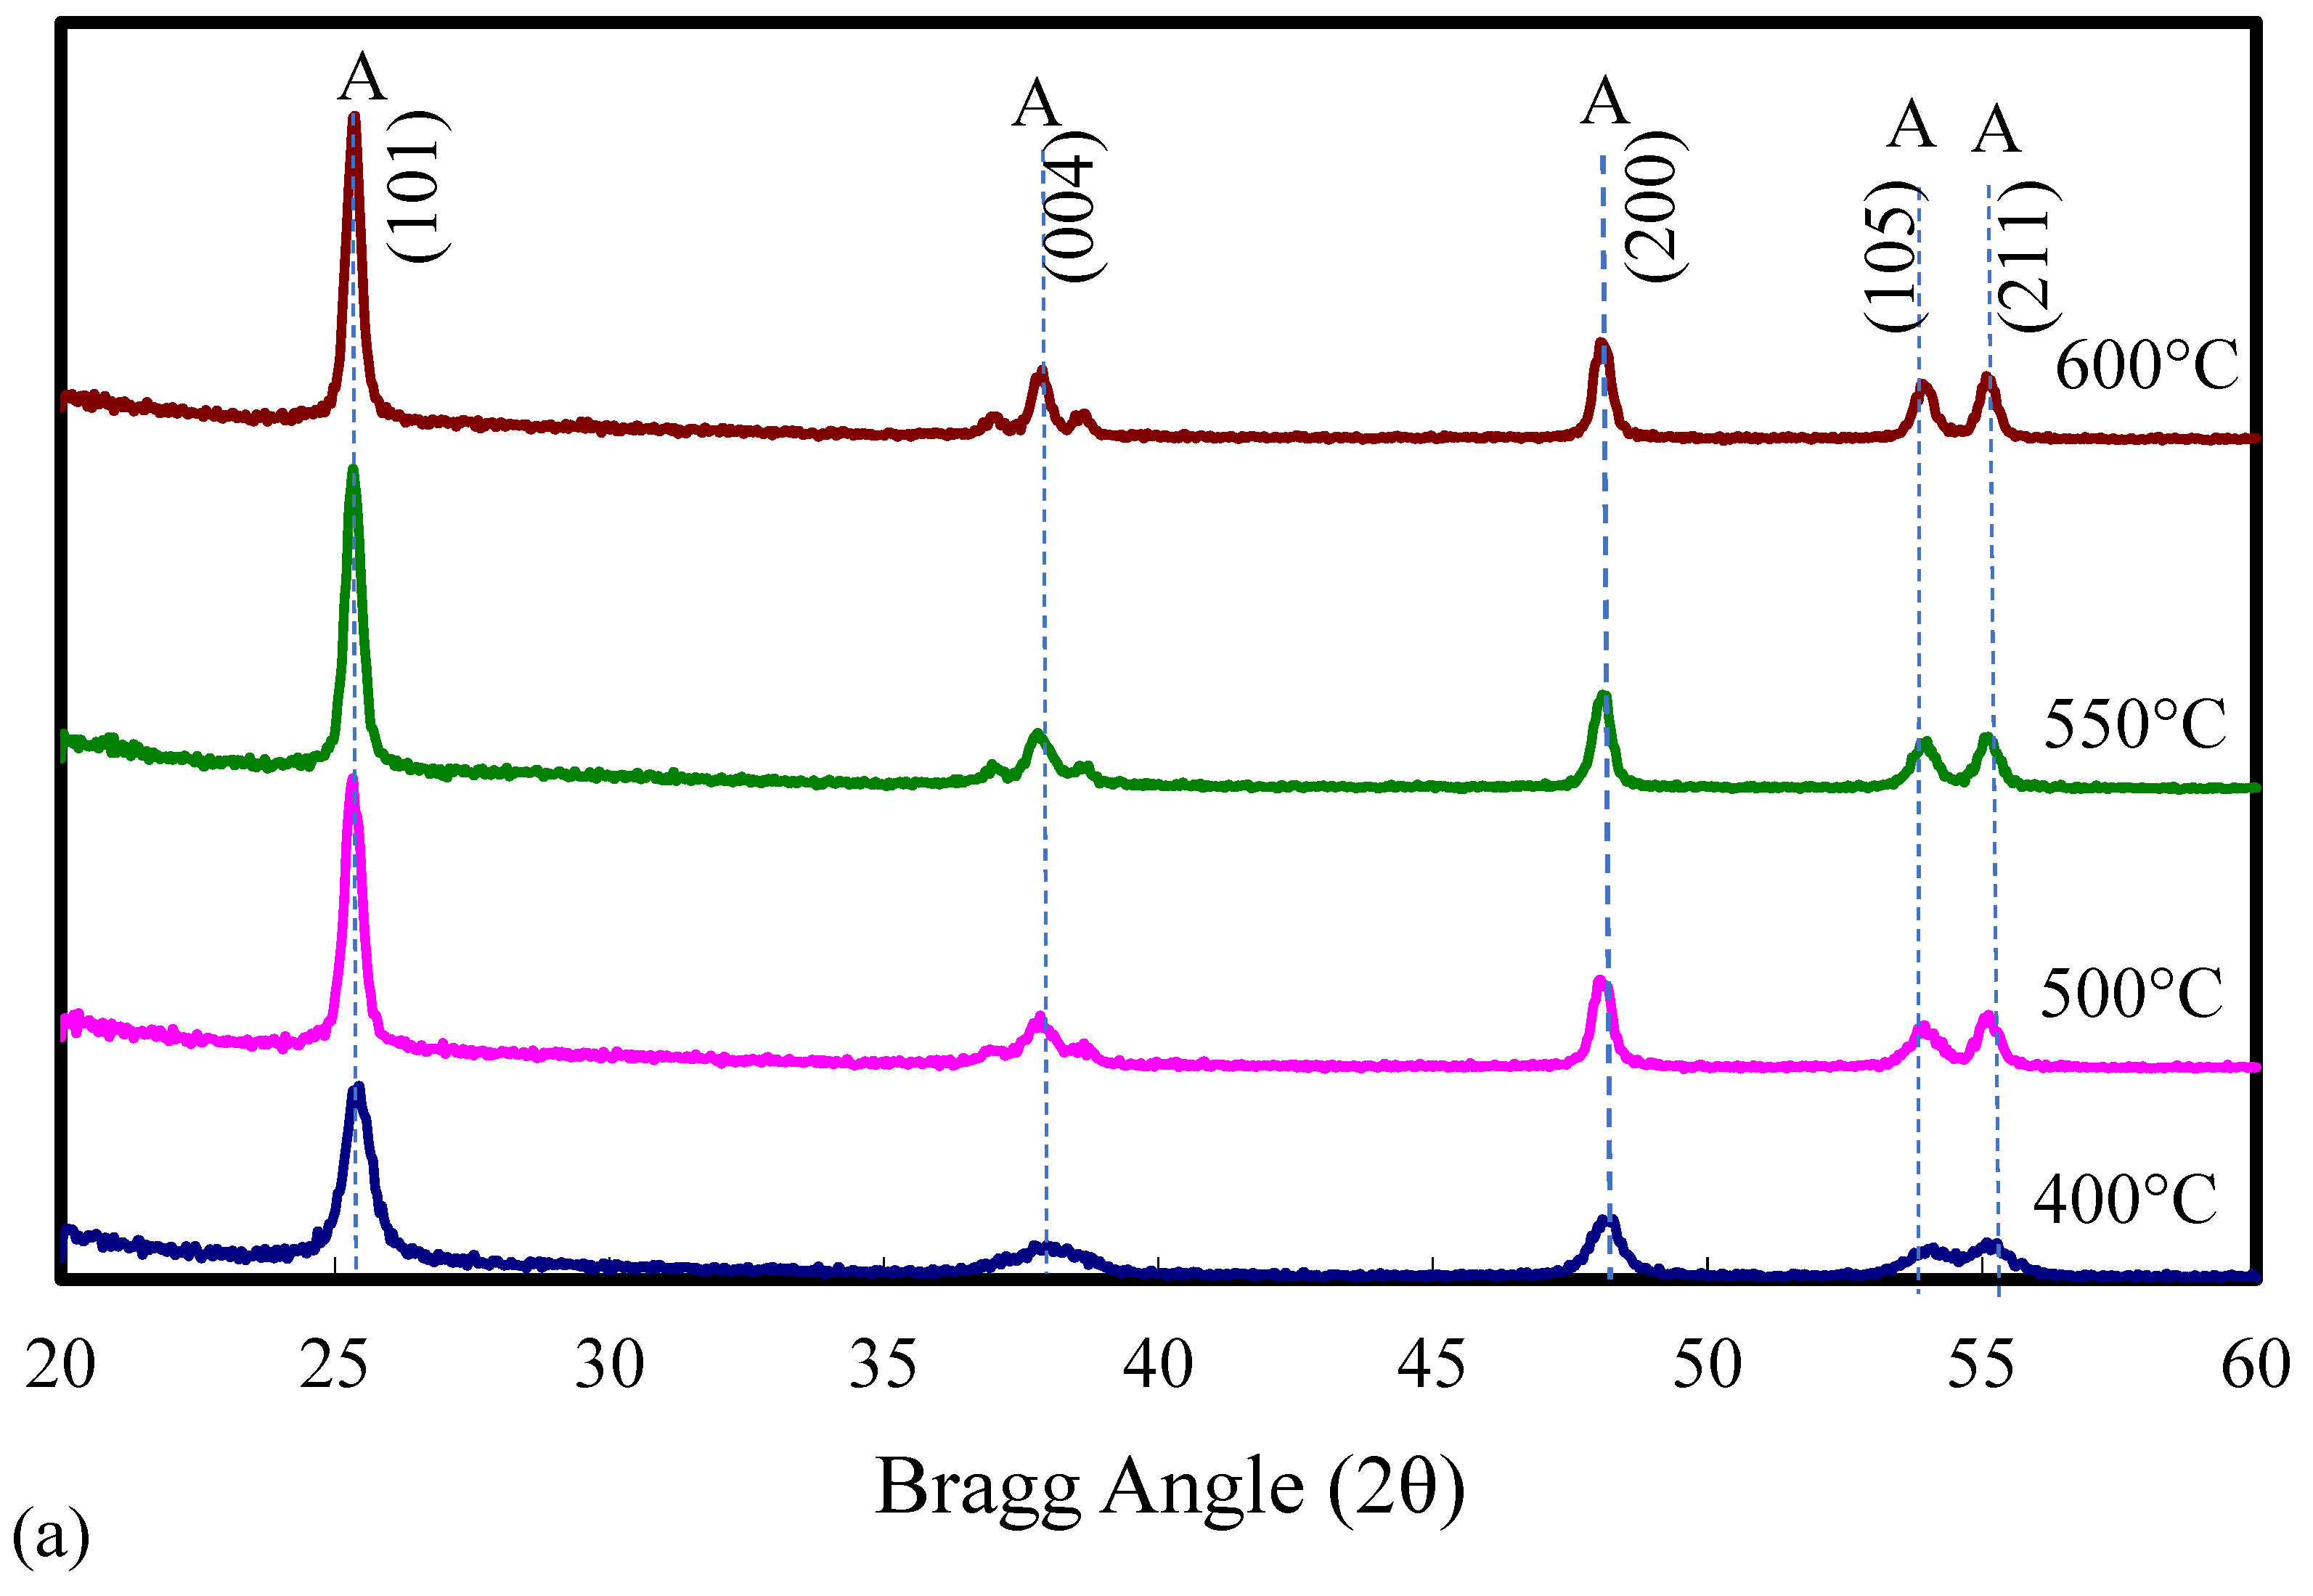
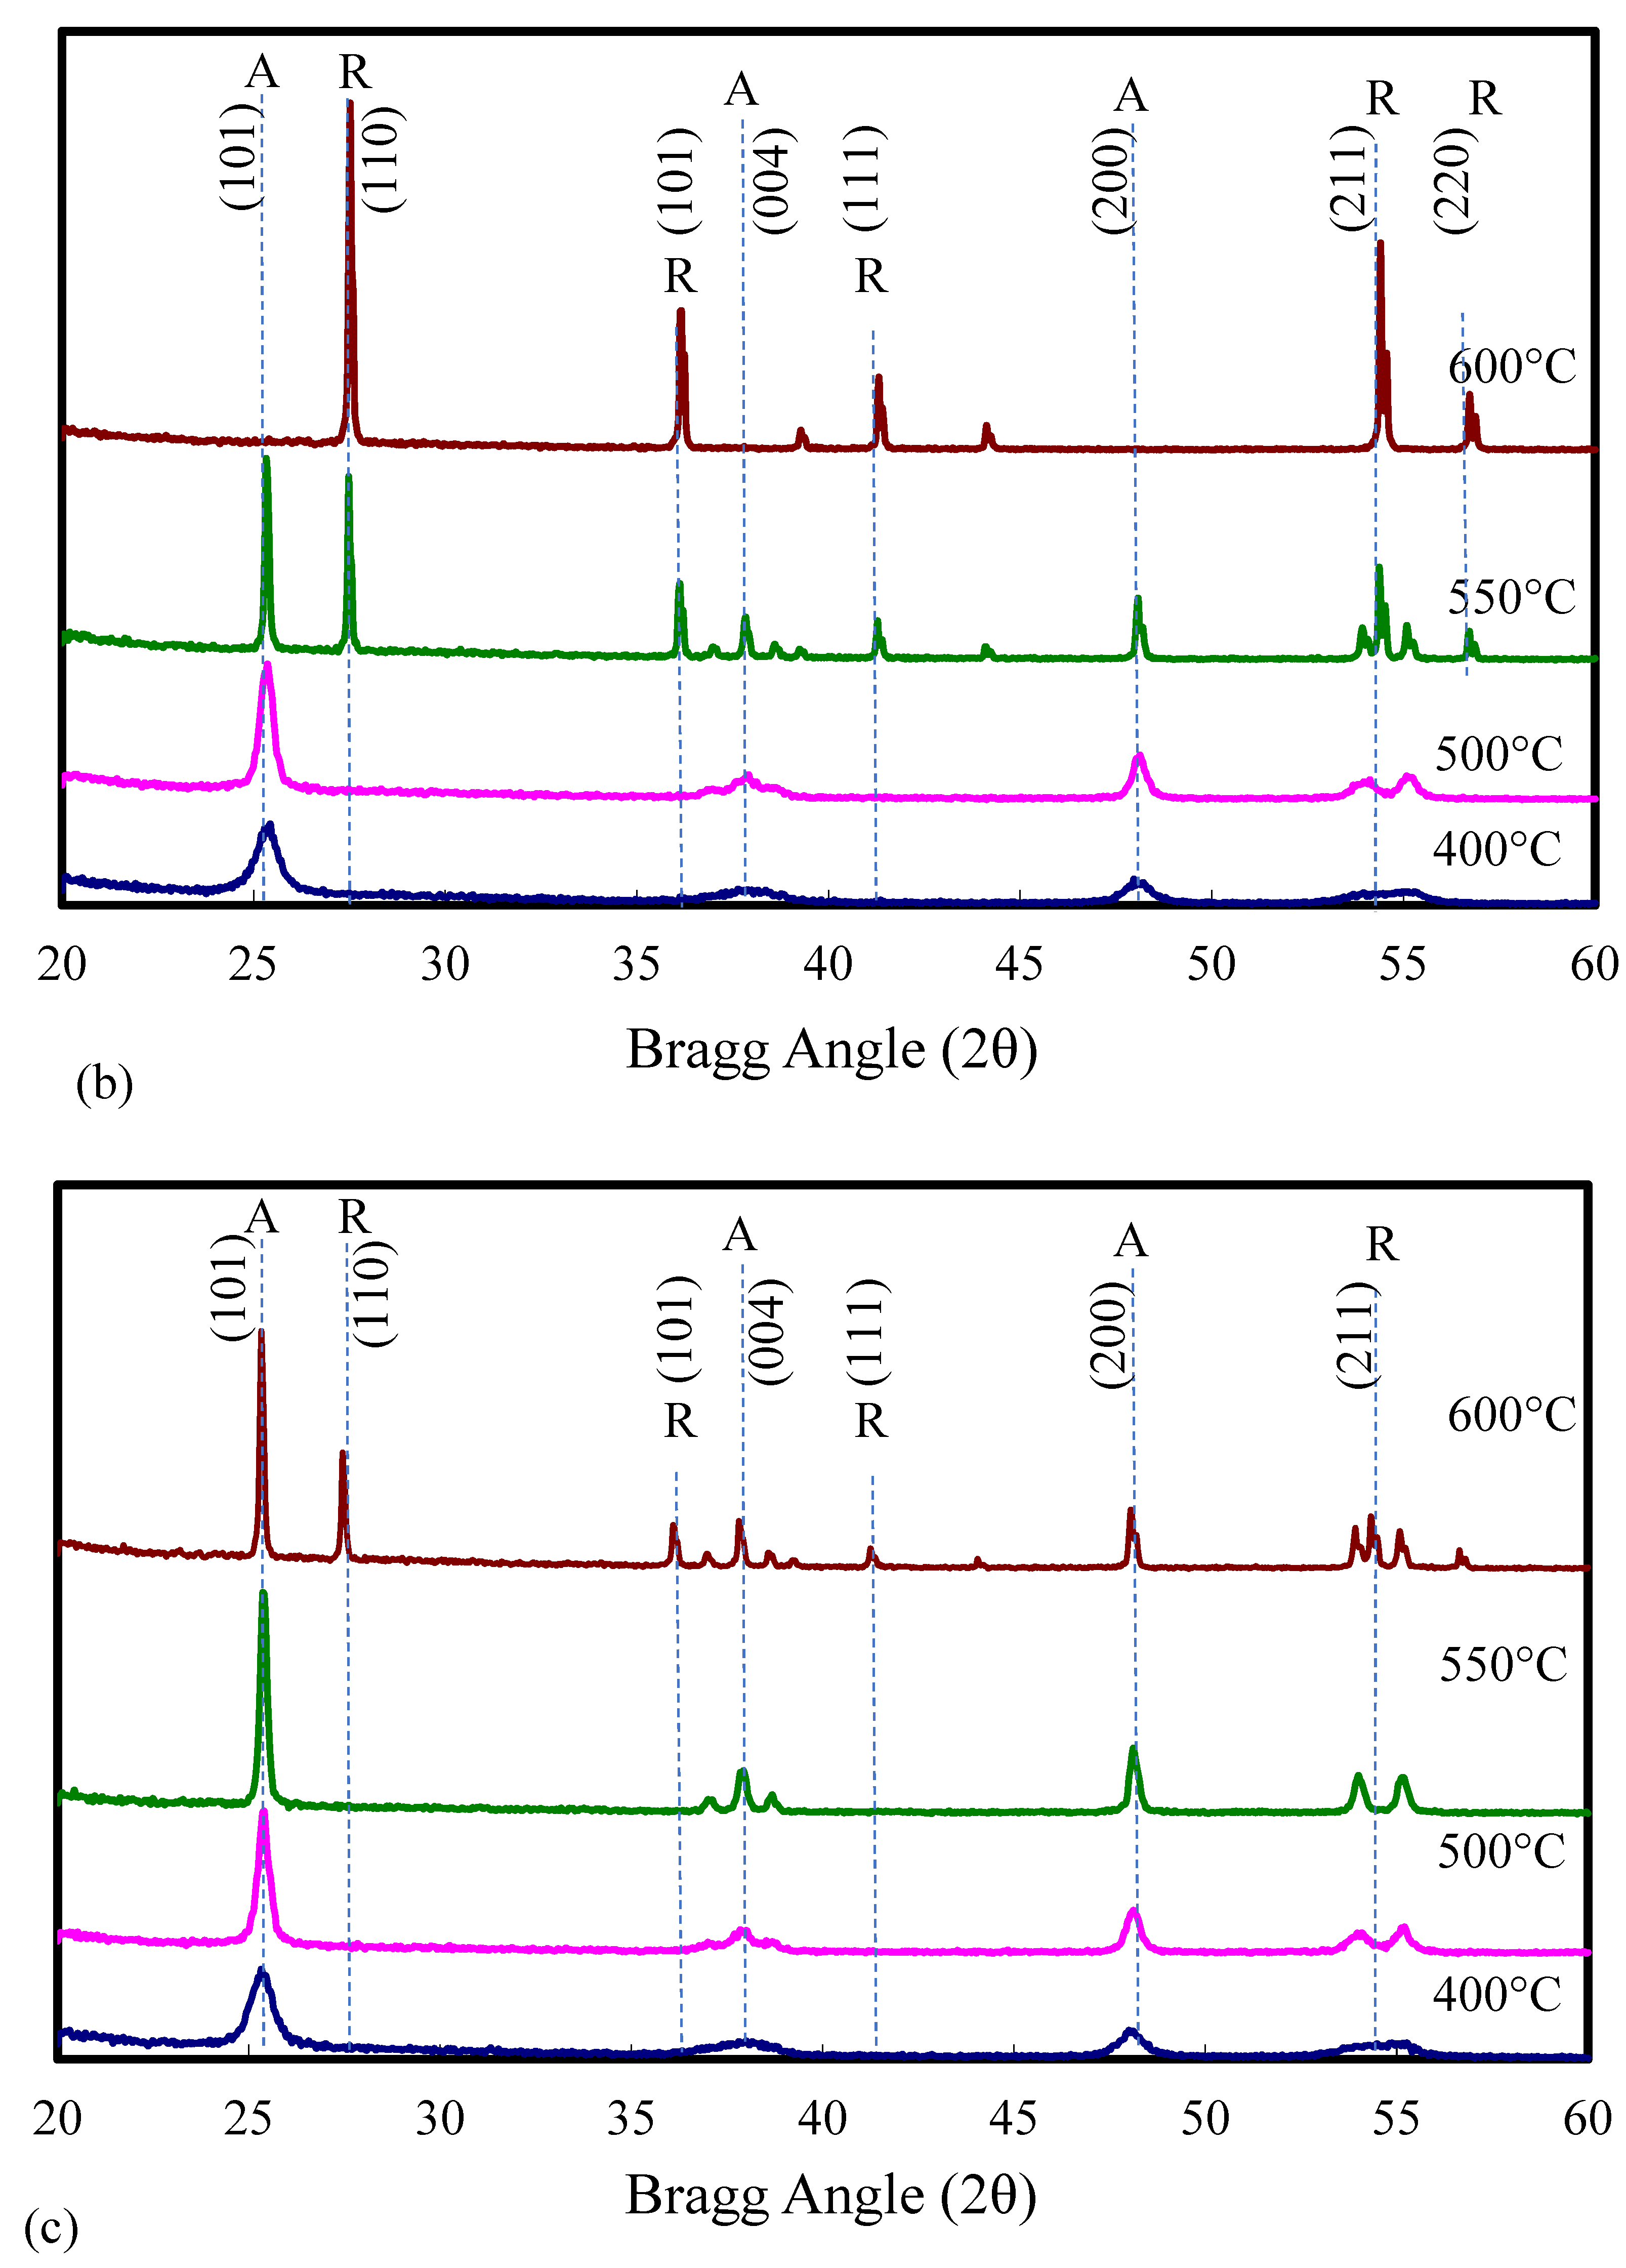
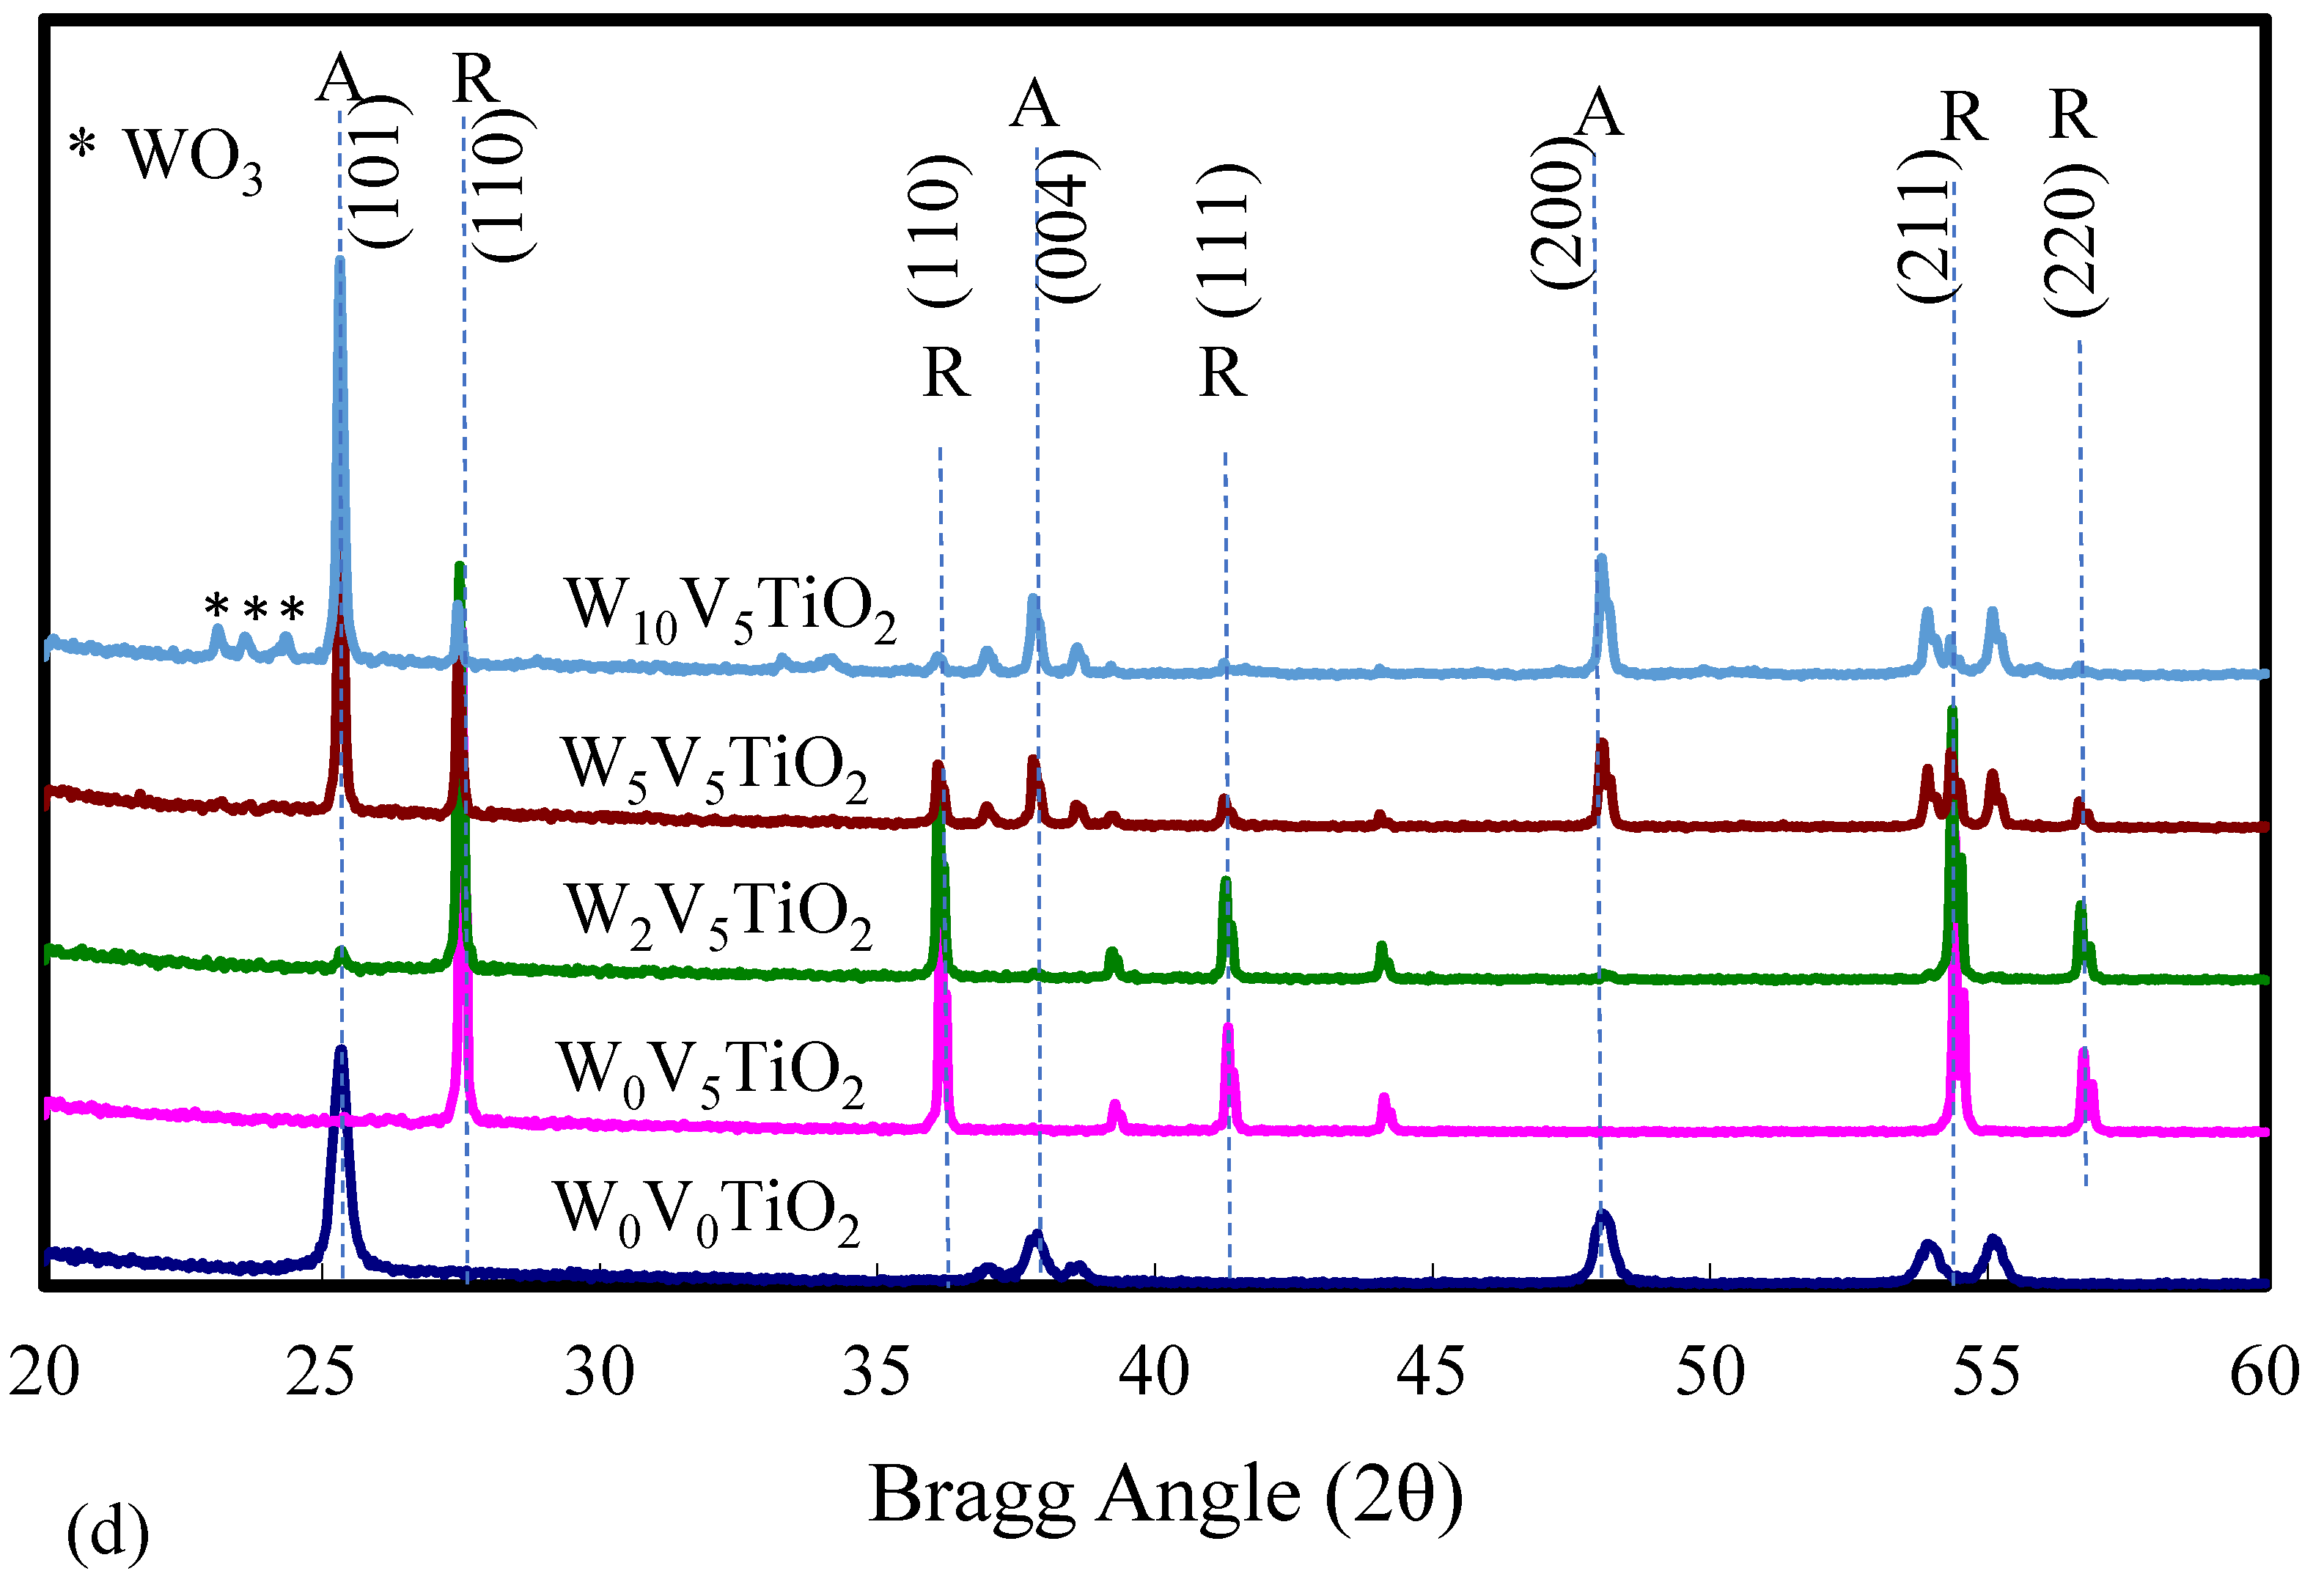
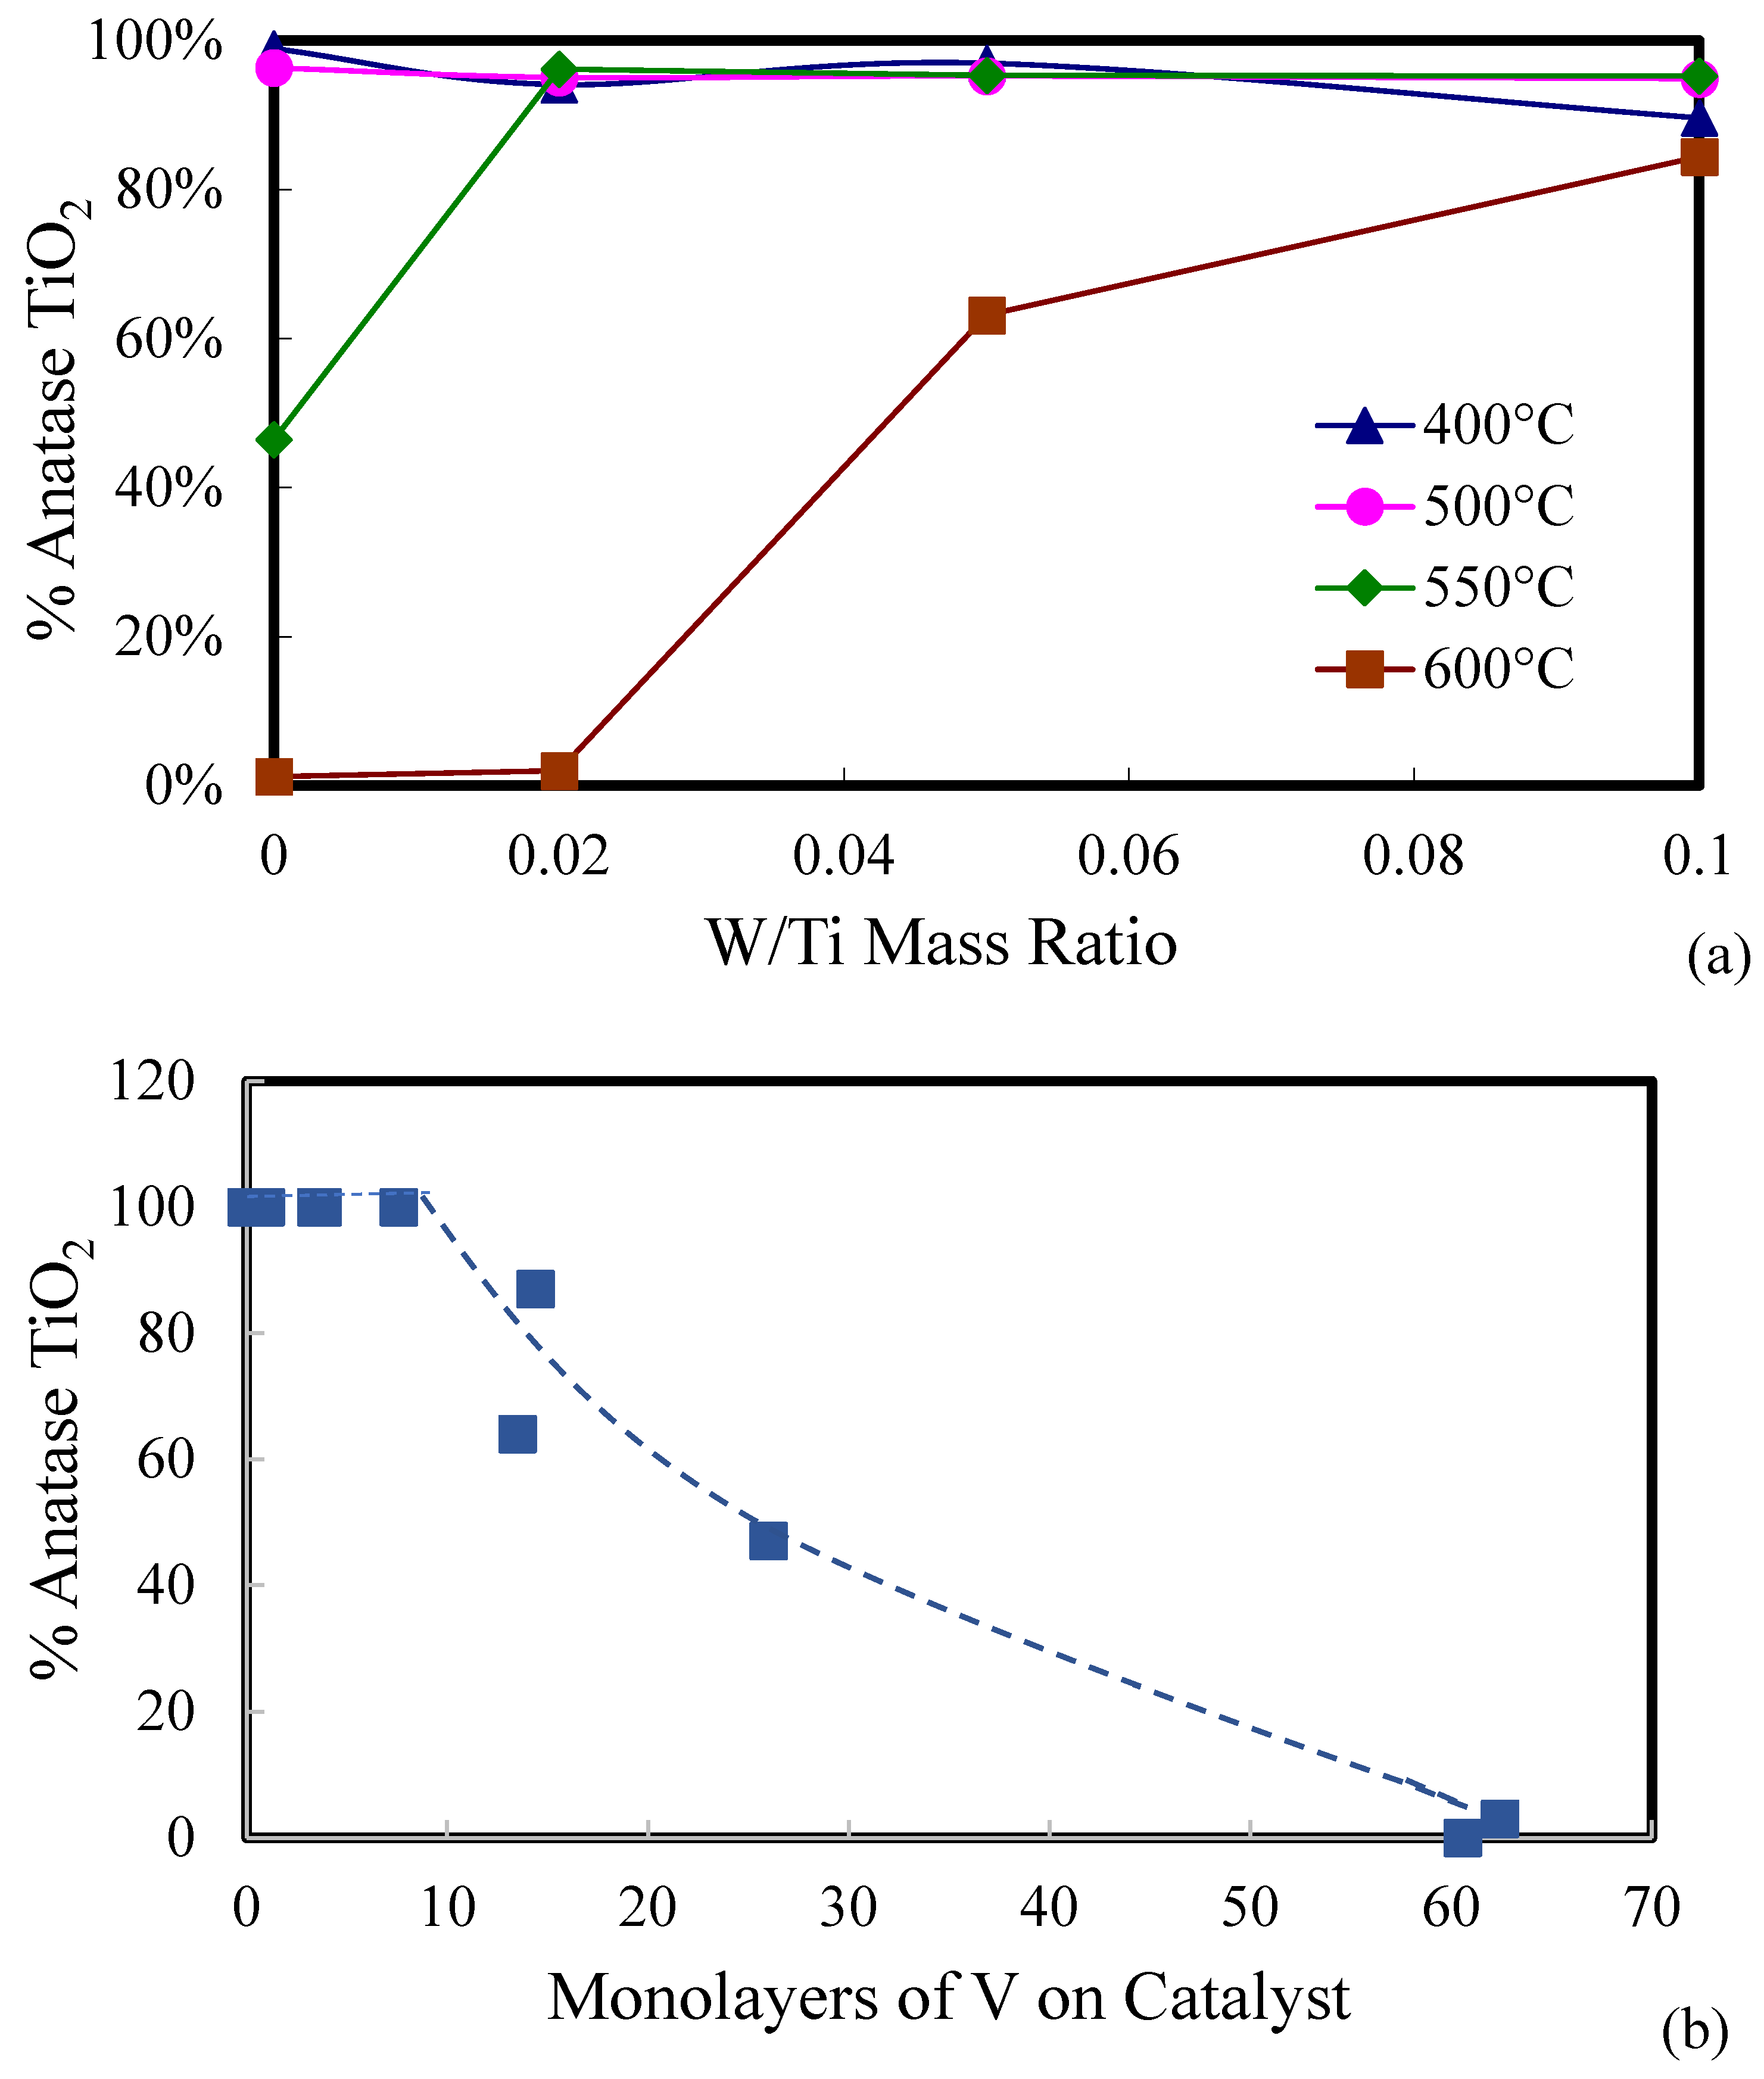
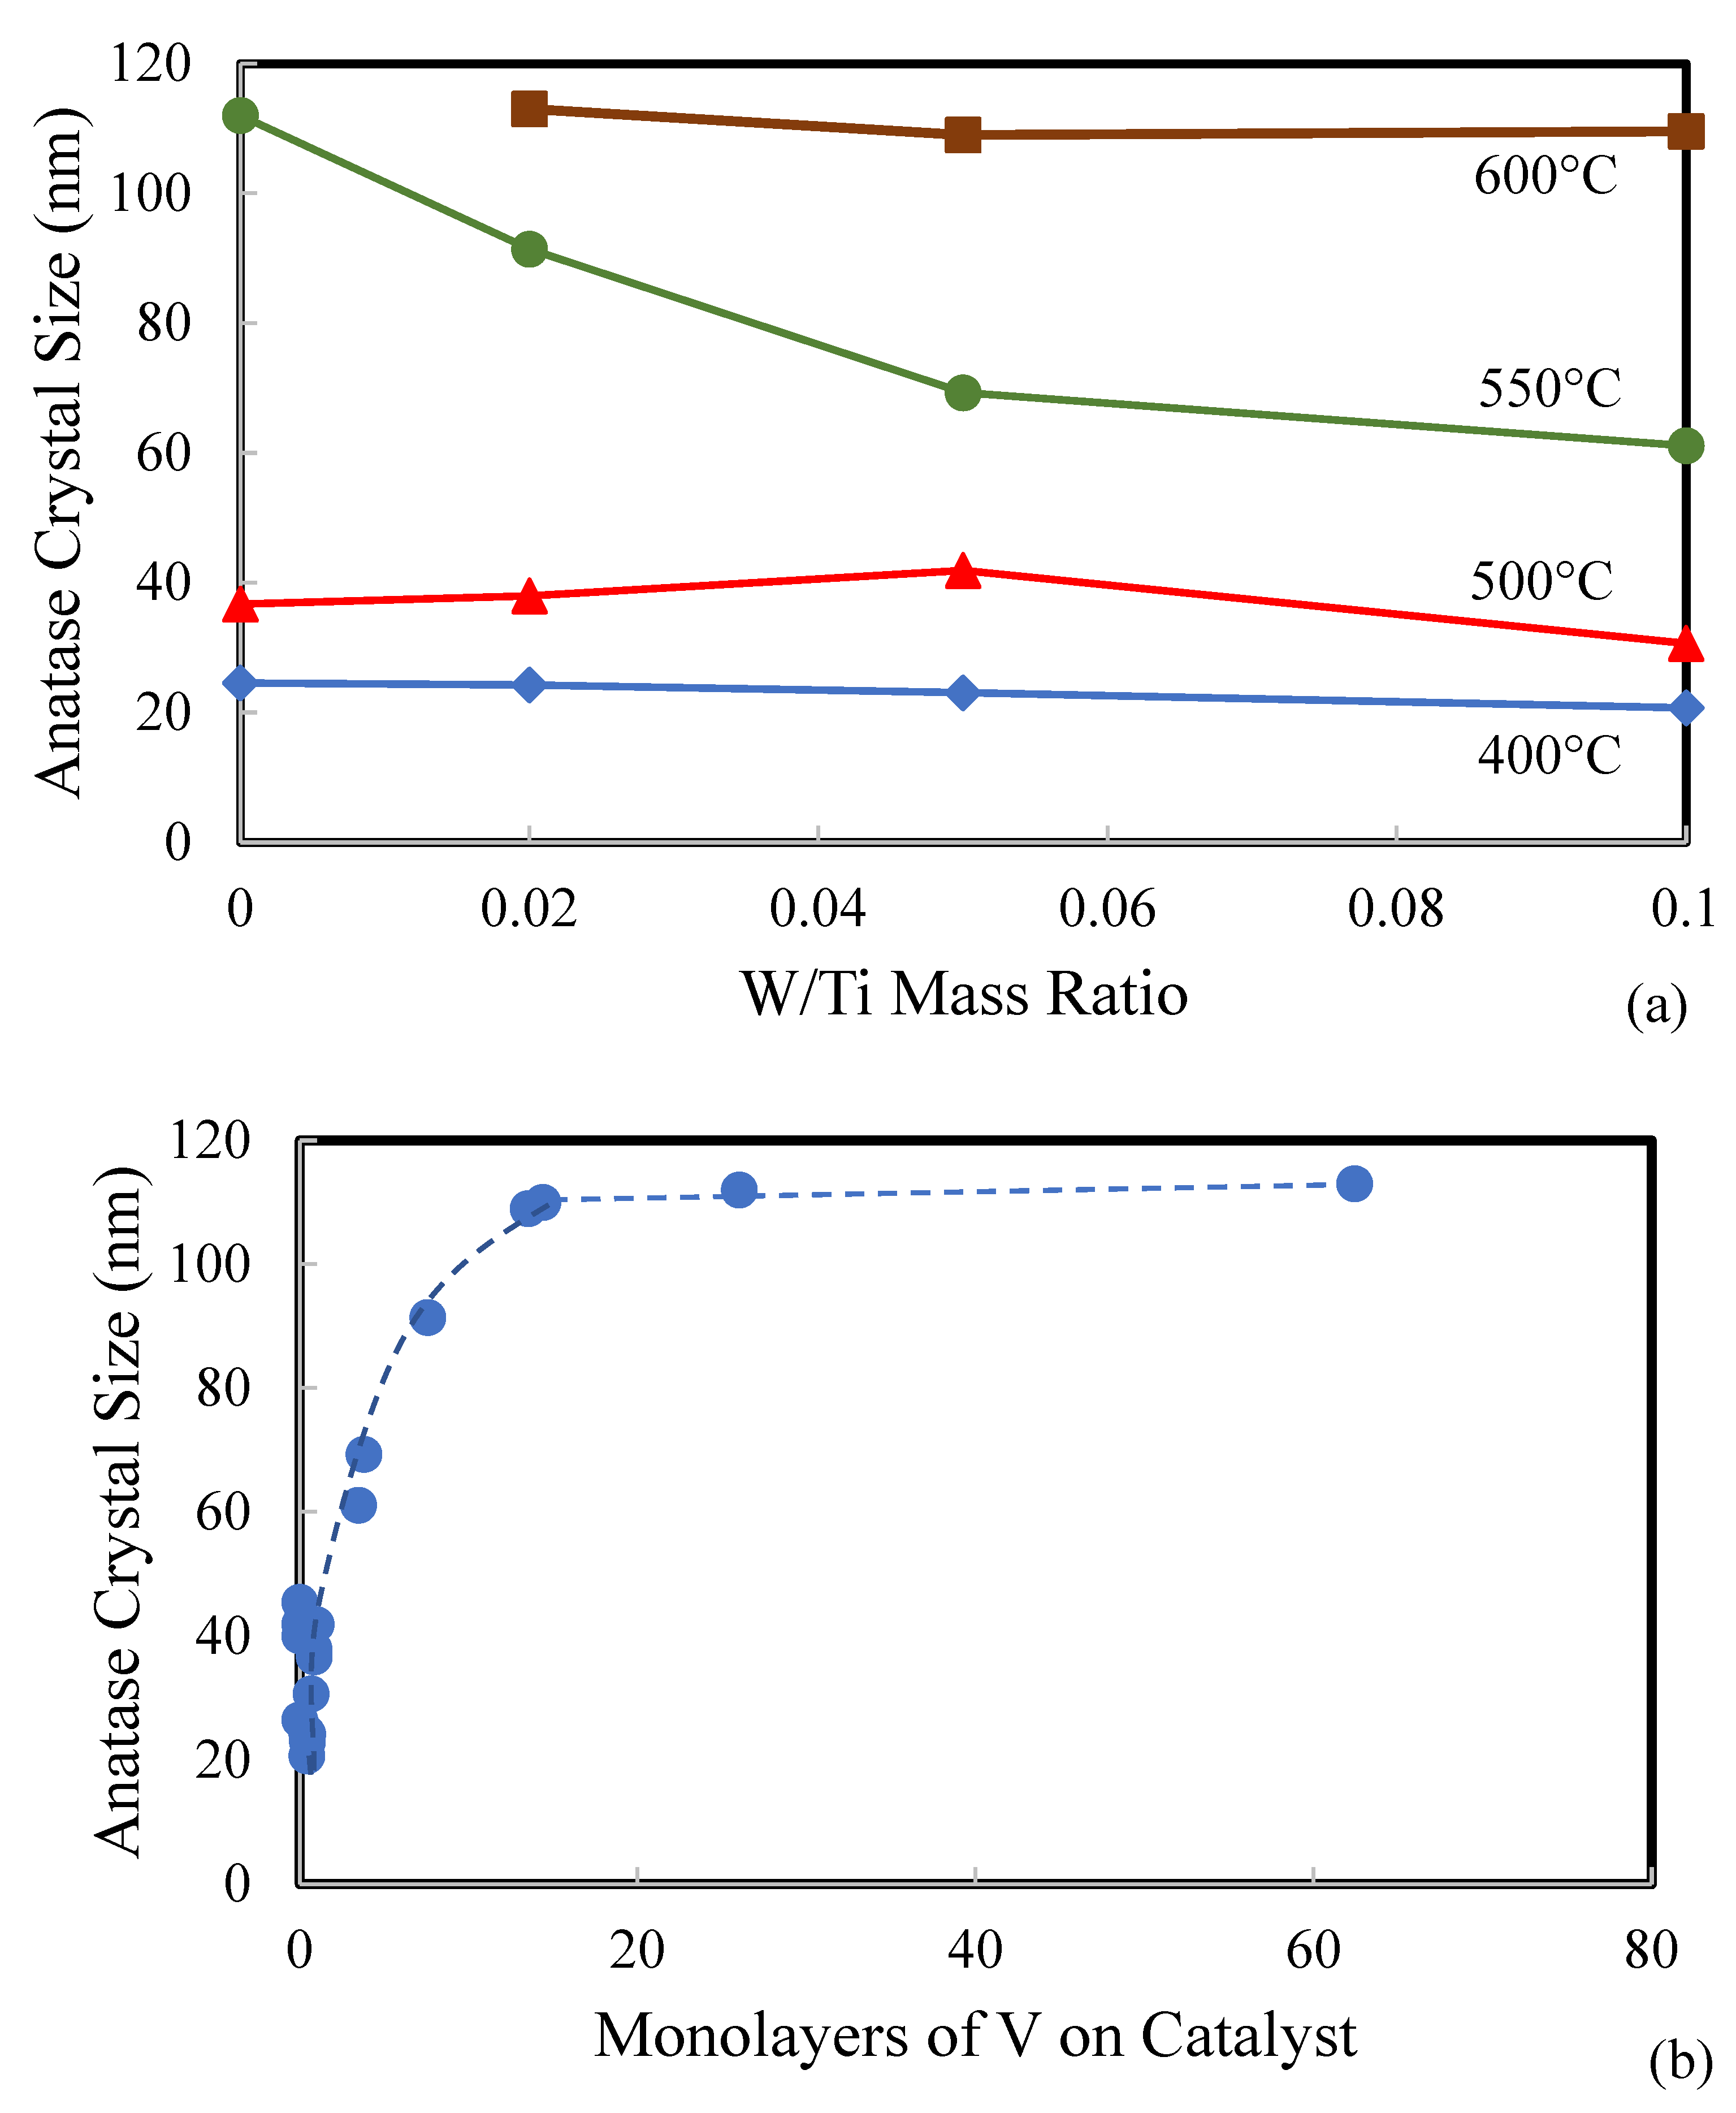
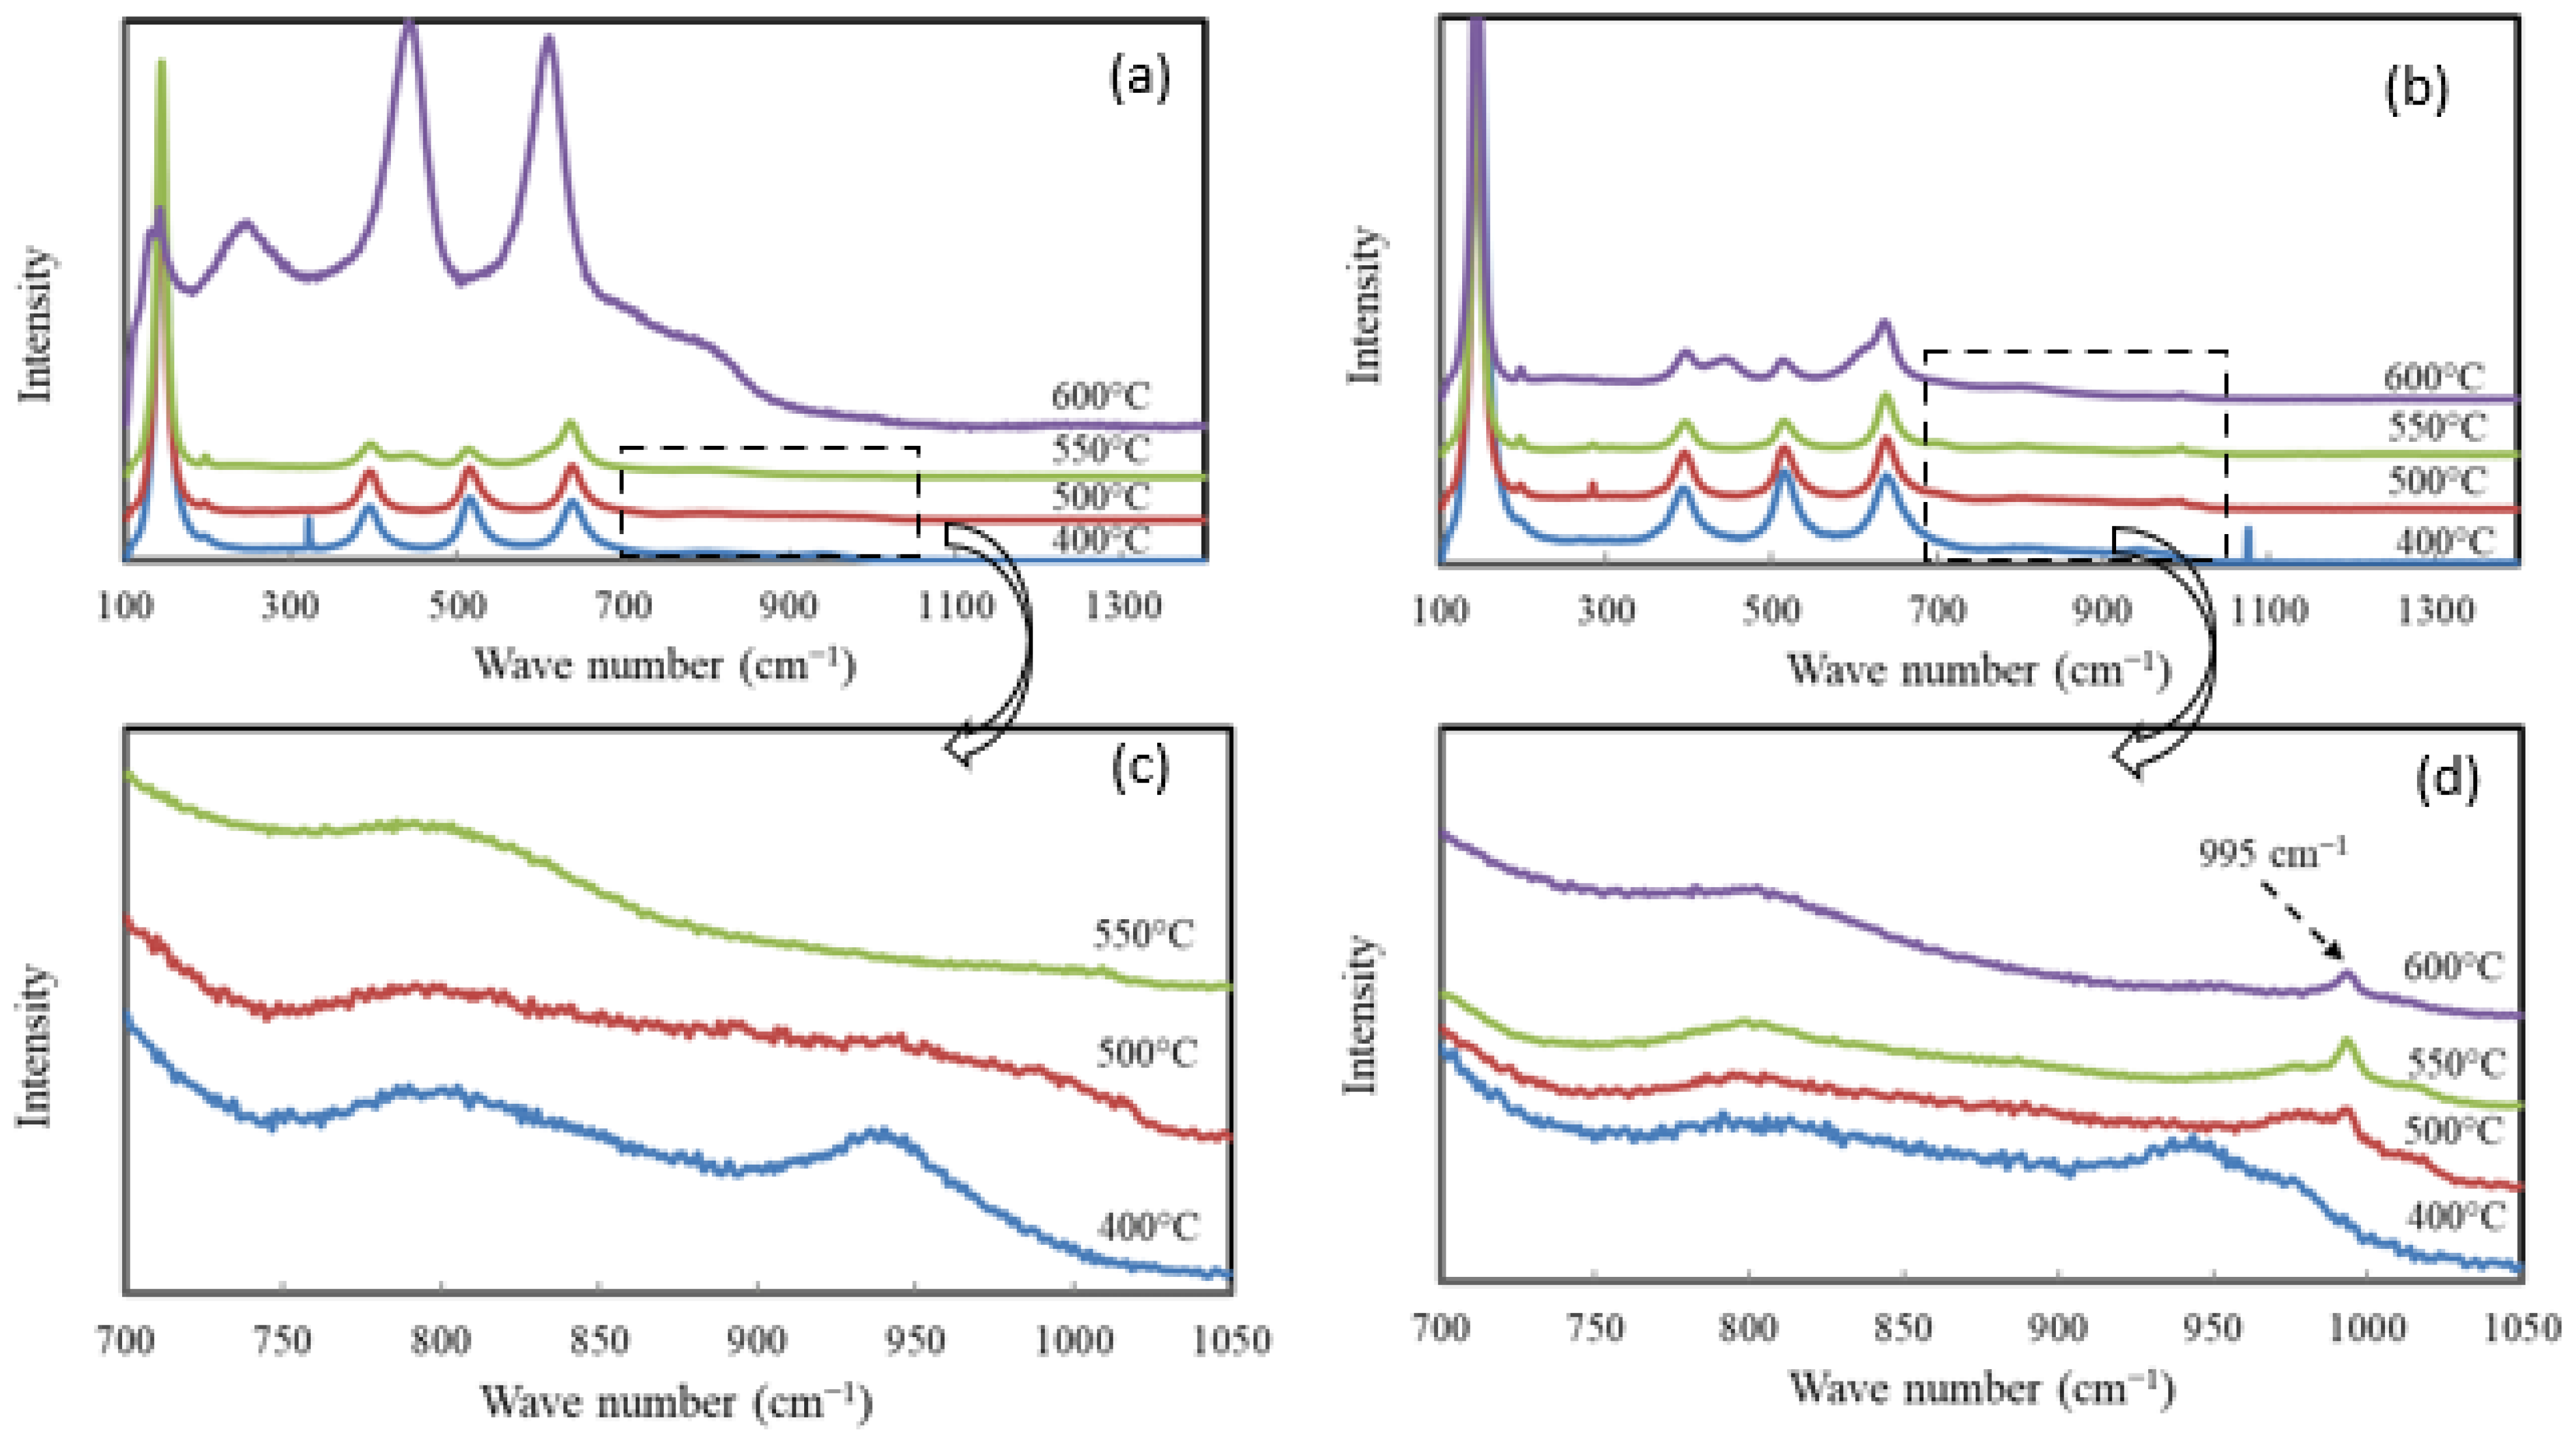
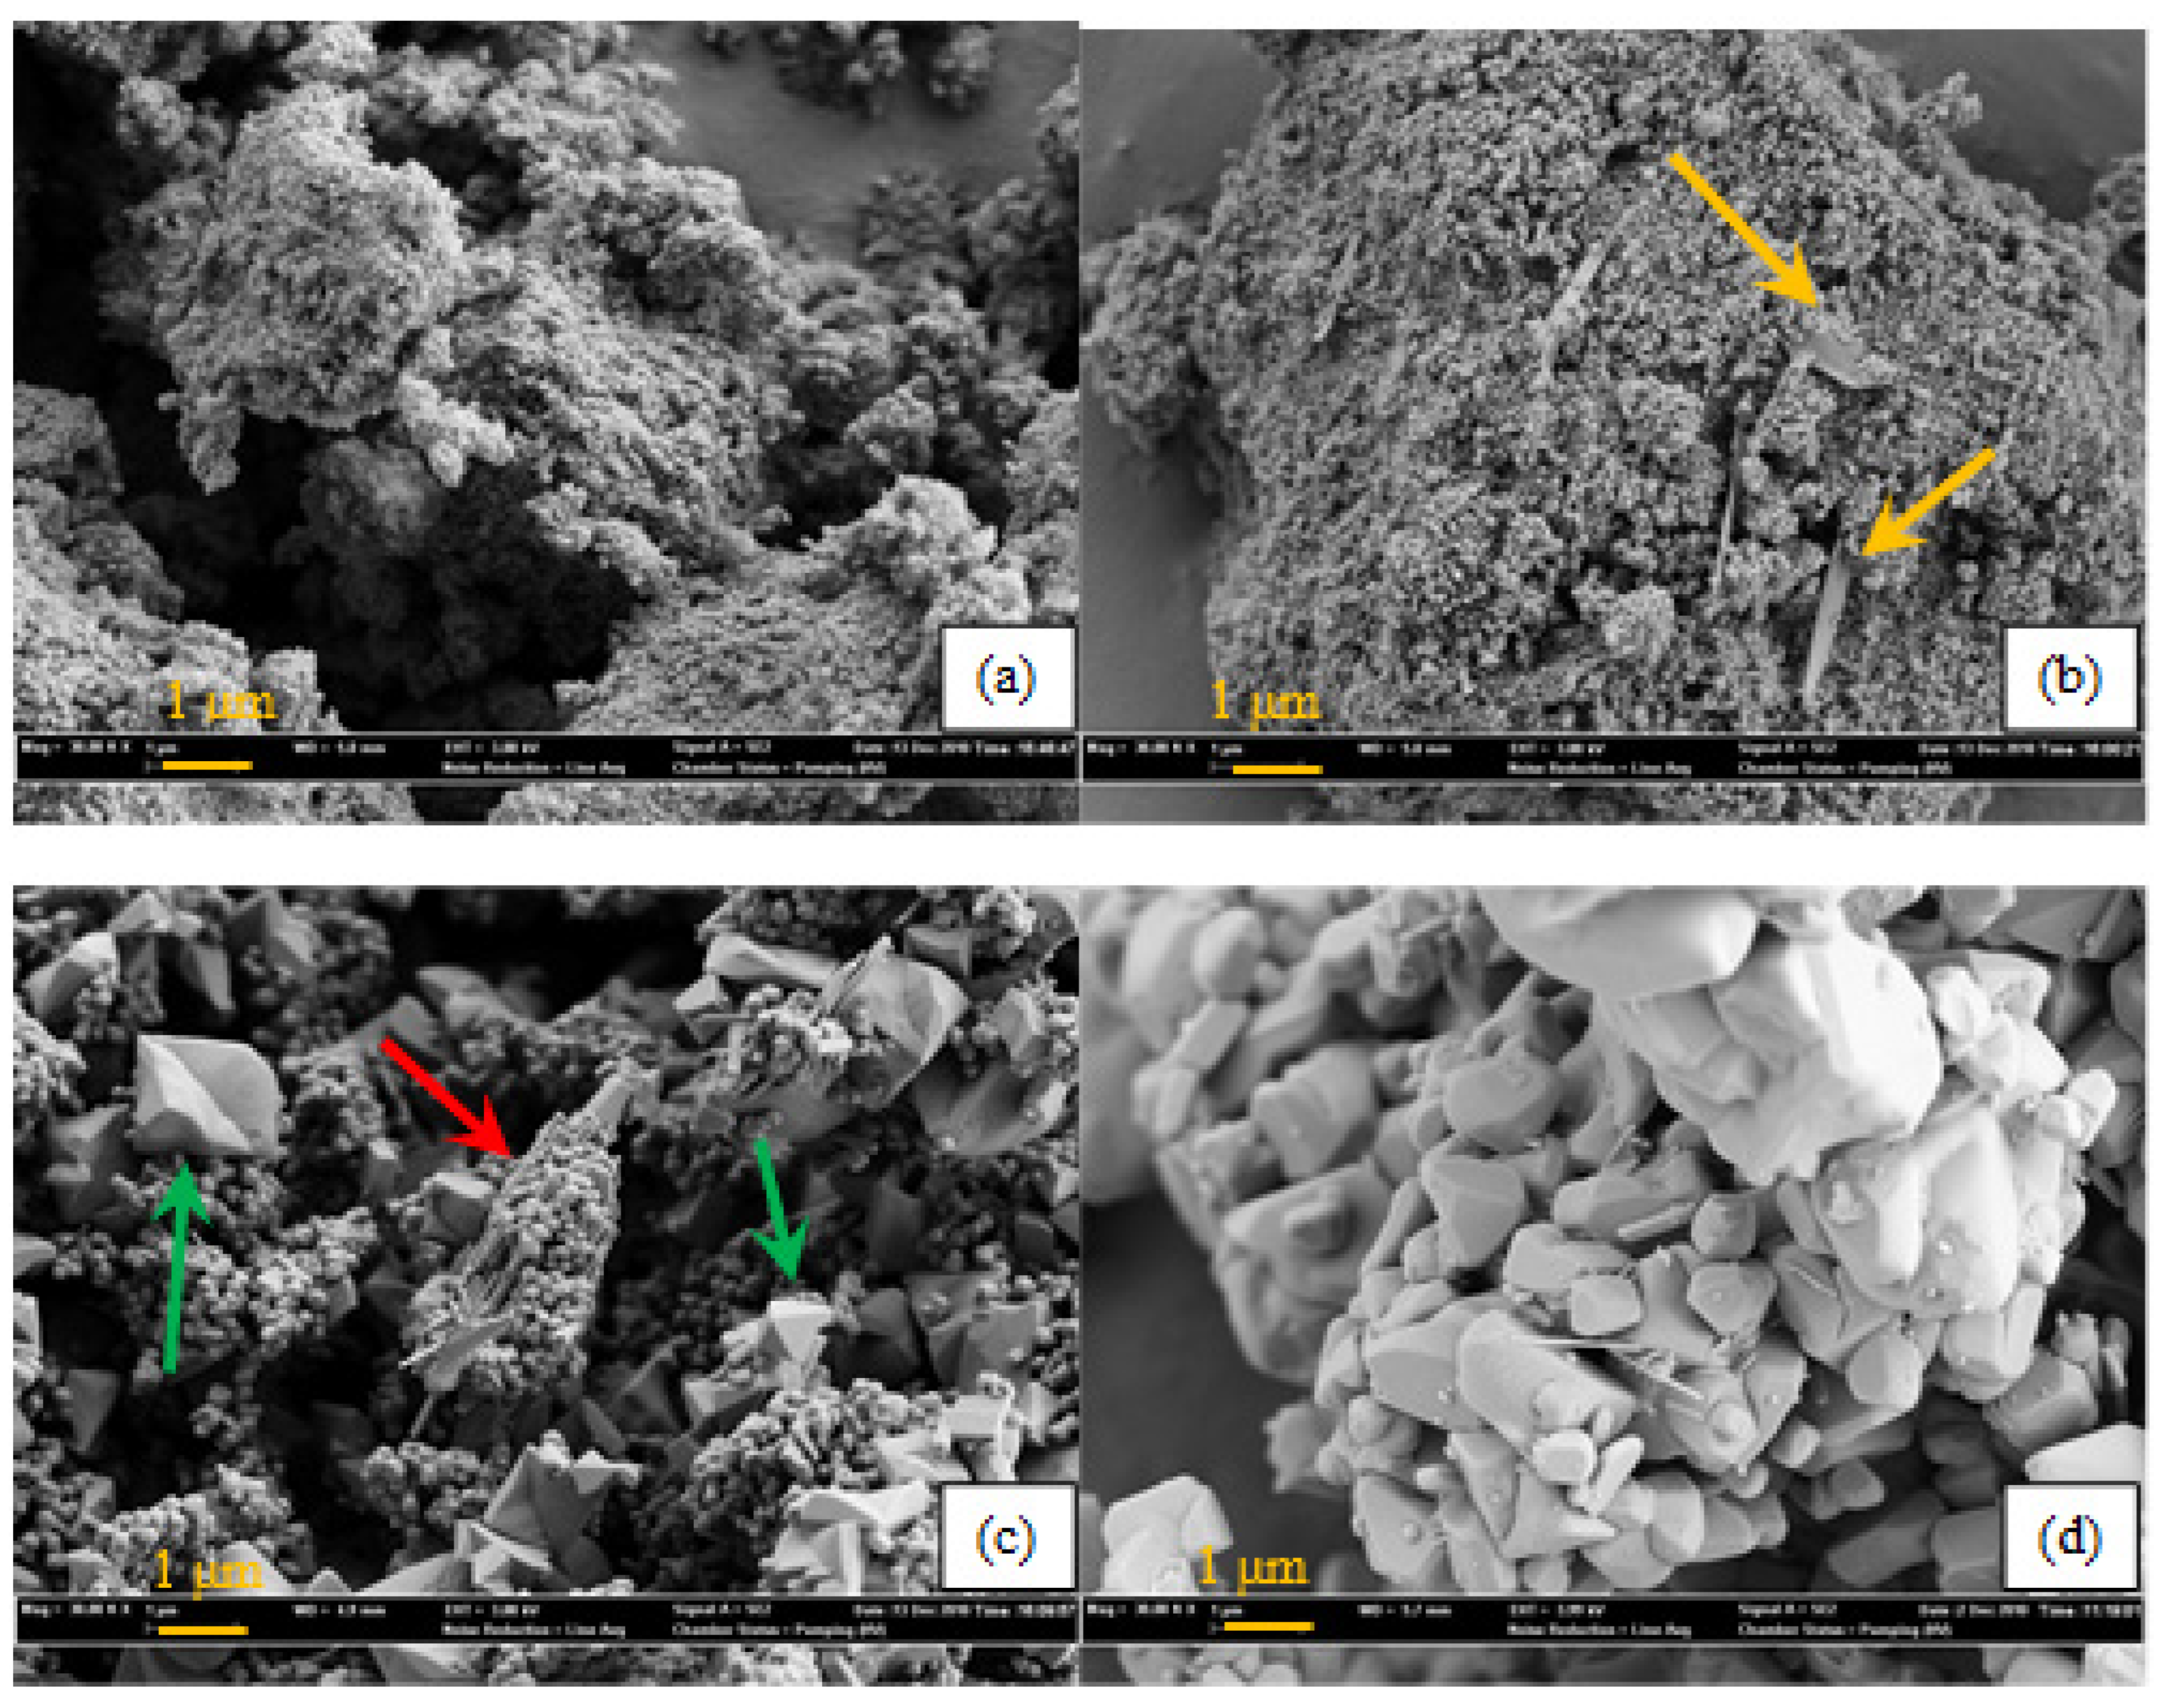
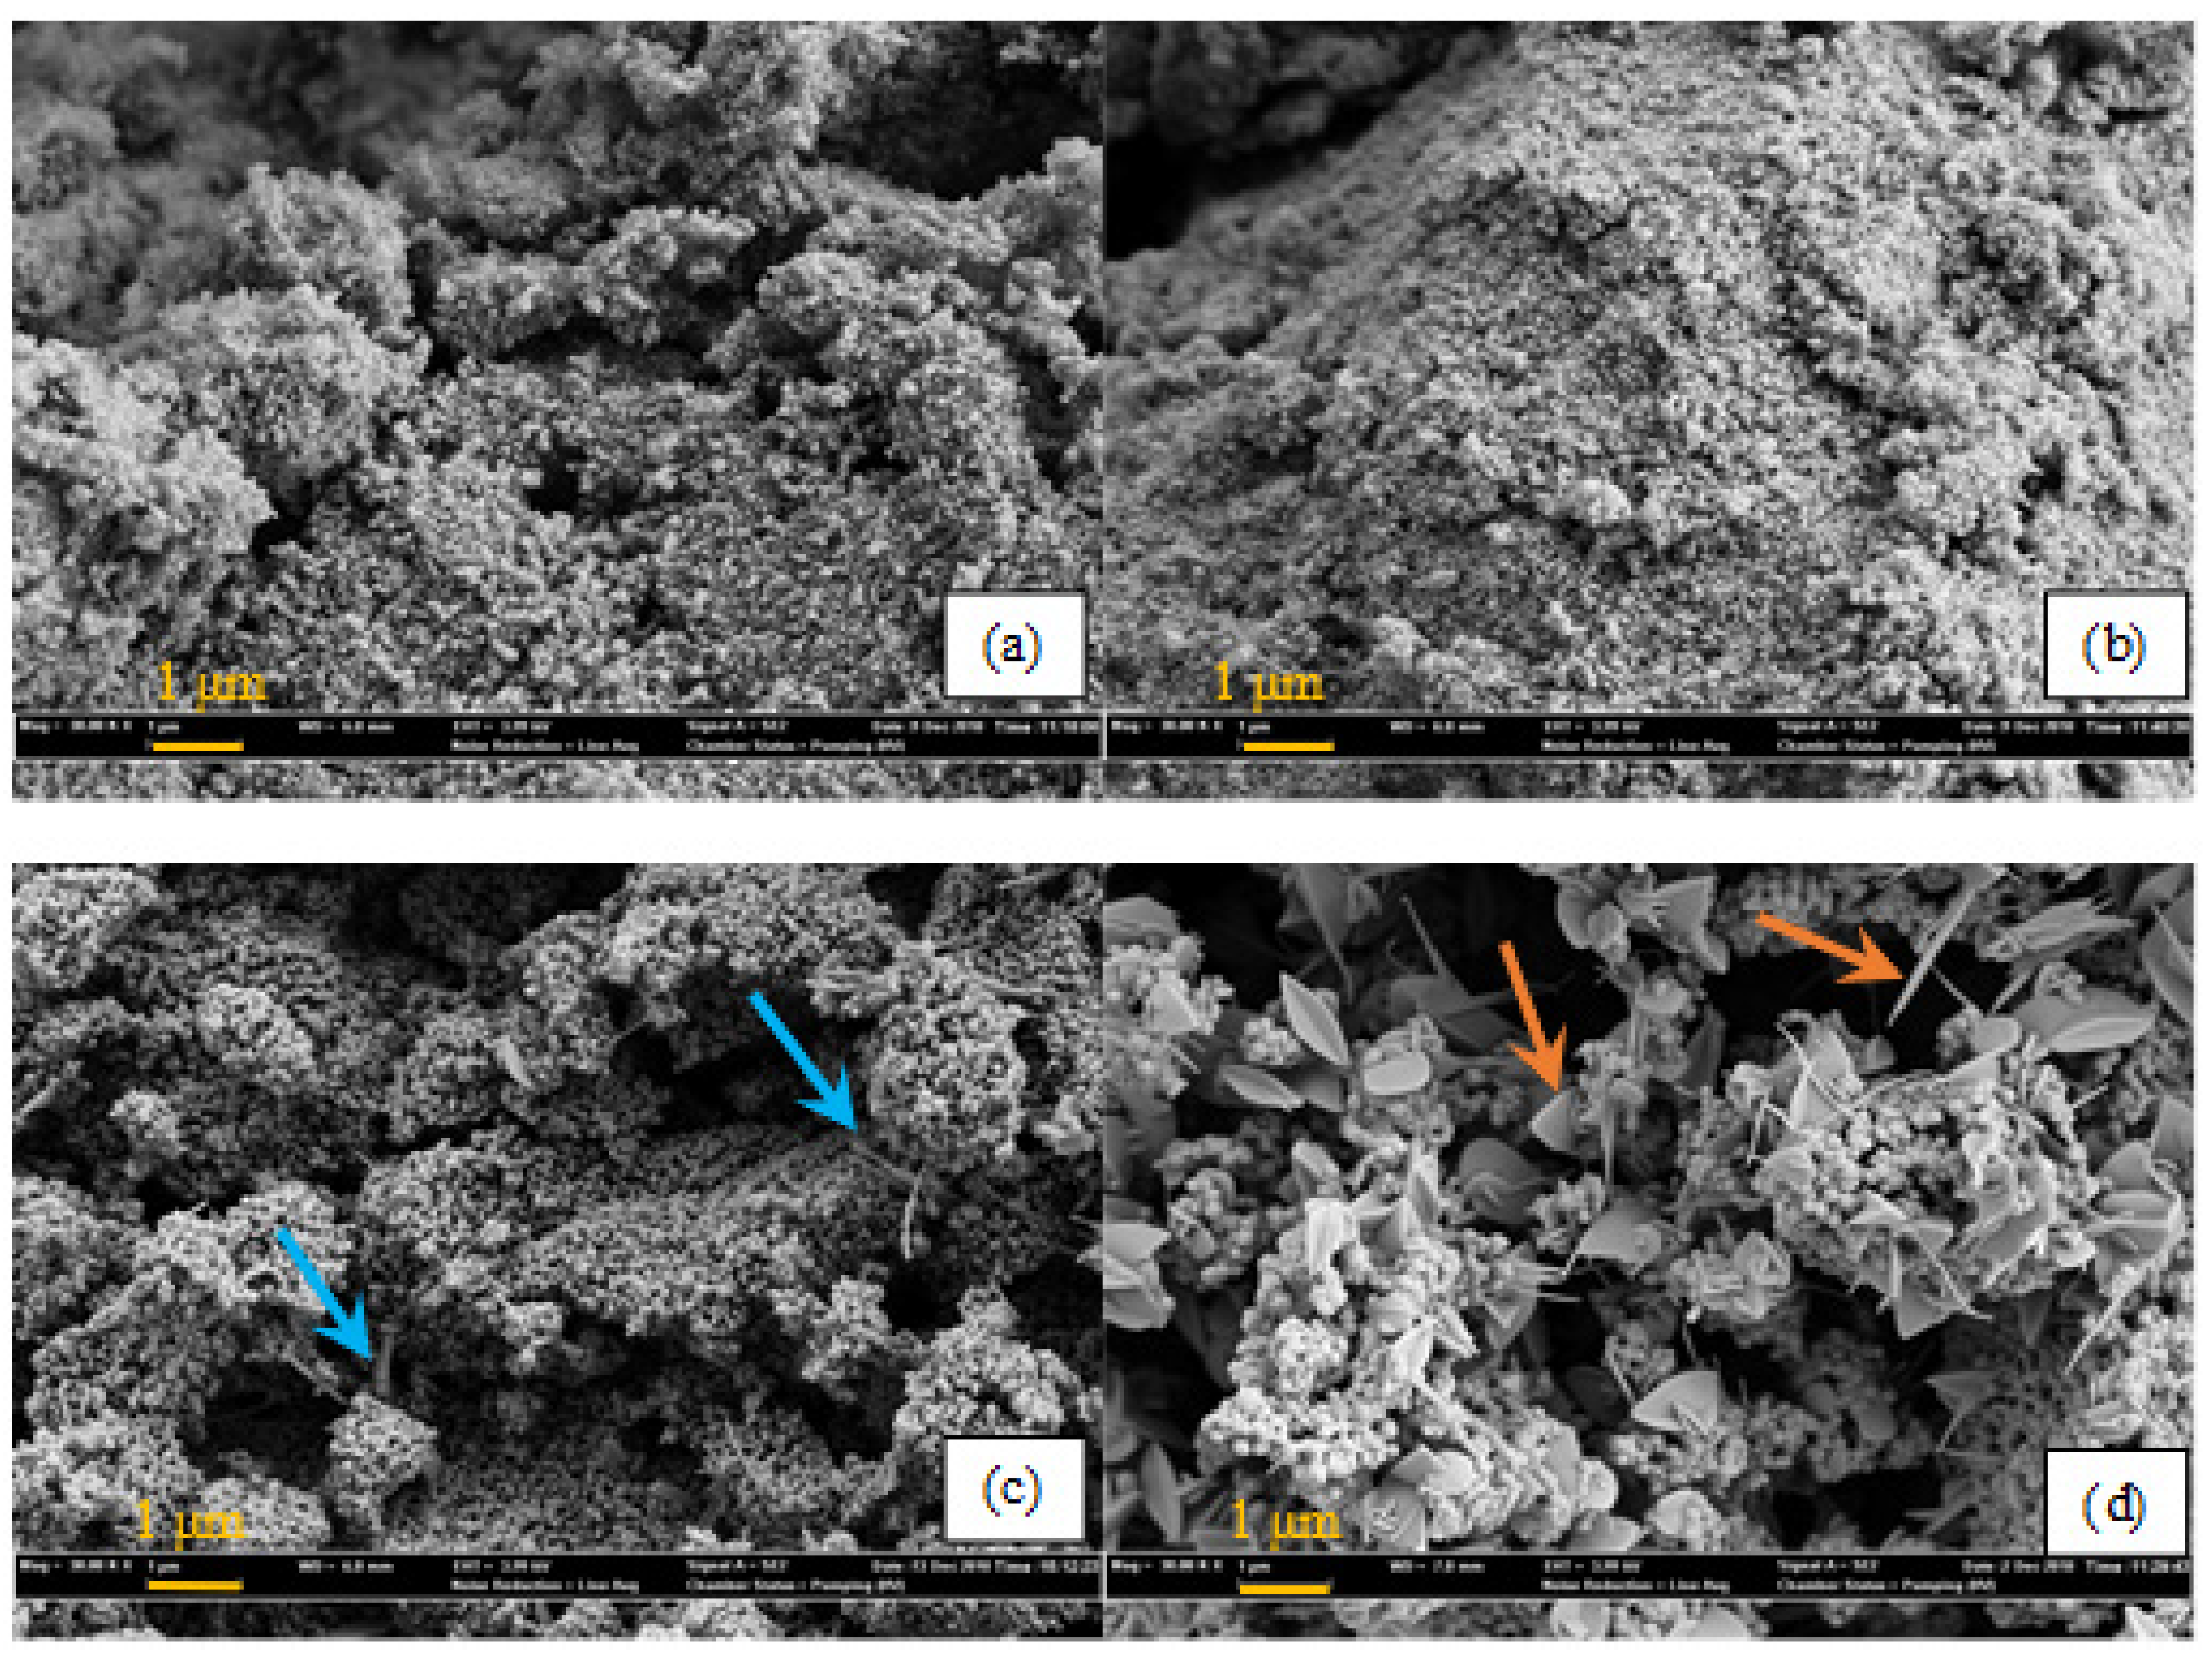
2.1. Catalyst Characterization
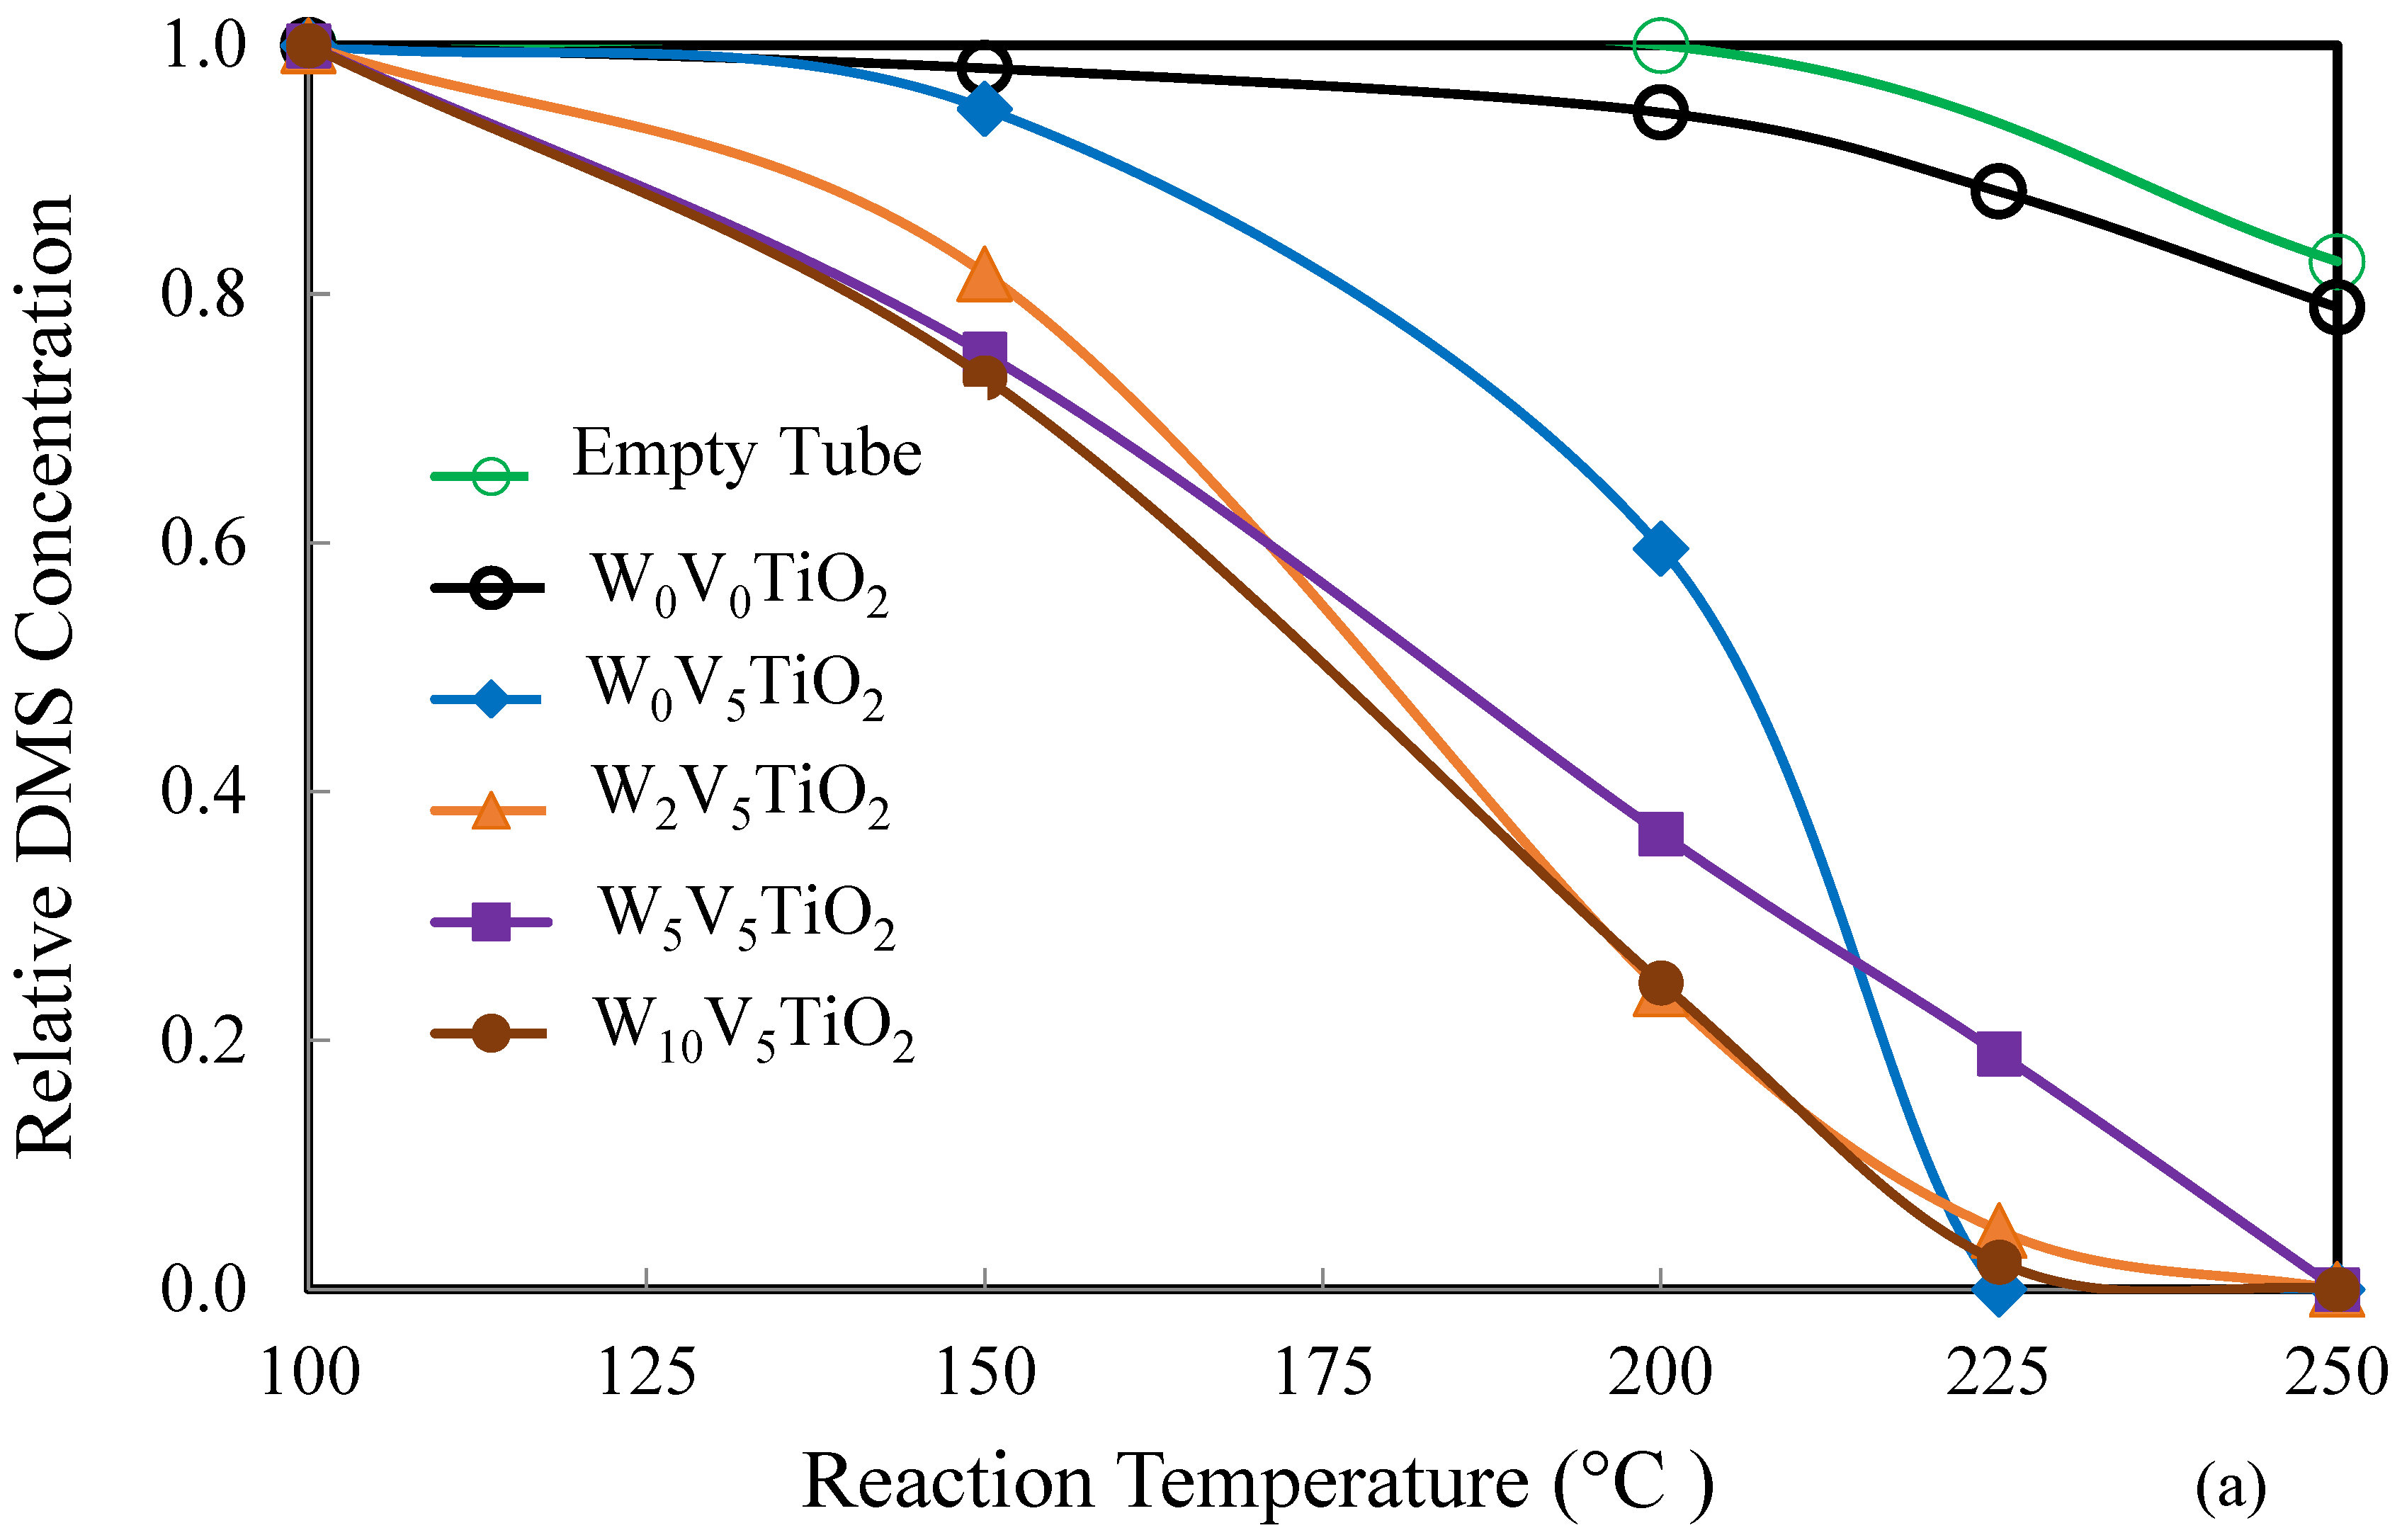
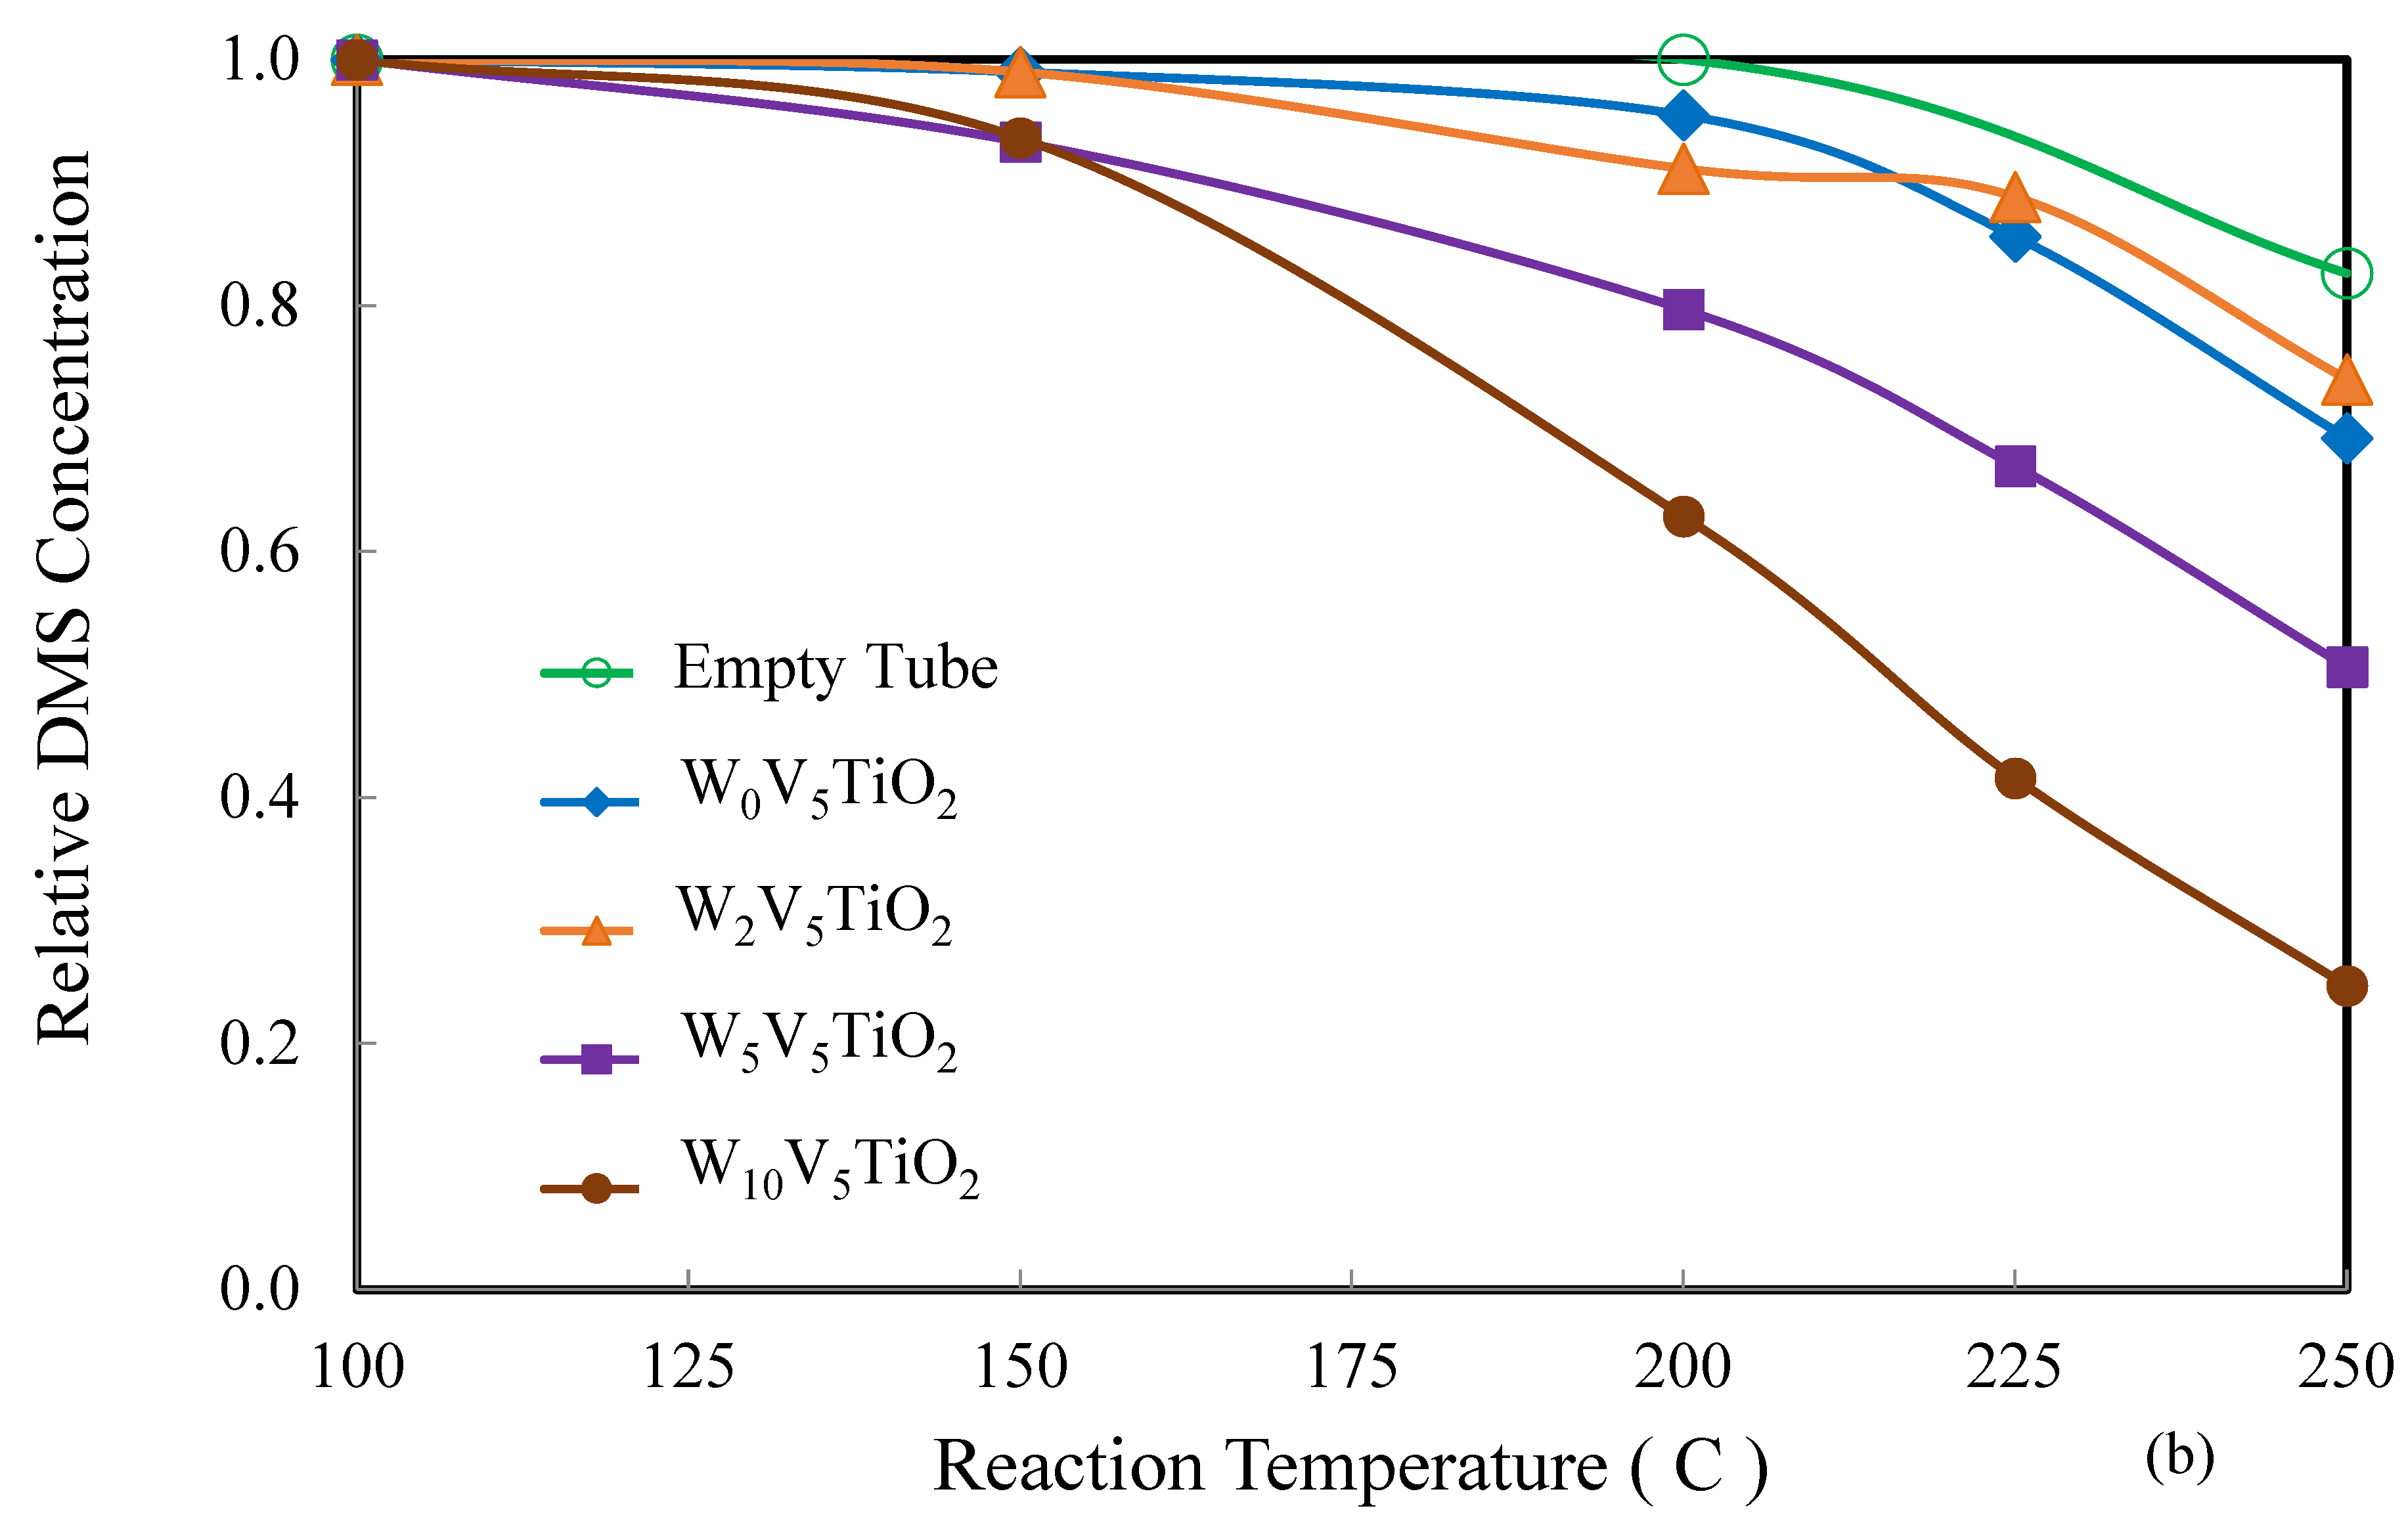
Table 1 summarizes the characteristics of the catalysts, including the BET surface area and average pore size (calculated based on nitrogen adsorption and desorption at −196 °C), the anatase crystal size and percent anatase calculated from XRD diffractograms, and the coverage of V on the surface area of the catalyst, depicted in this study as the number of monolayers of V on TiO2. For this study, the monolayer coverage was approximated to be 10 V atoms/nm2 surface area based upon the review written by Grzybowka-Swierkosz [18]. However, the monolayer coverage of V on TiO2 has been reported to be as low as 4.4 V atoms/nm2 [52] and approximately 8 V atoms/nm2 by other researchers [31]. Equations (1) and (2) were used to define monolayers of V in this study.
a t o m s _ V / n m 2 = x V M W V × ( 6.02 × 10 23 ) S S A × ( 1 × 10 18 )
m o n o l a y e r s _ V = a t o m s _ V / n m 2 10   a t o m s _ V / n m 2
Here, xV is the mass fraction of V on the catalyst (g V/g catalyst), MWV is the atomic mass of V (g V/mole), 6.02 × 10²³ is Avogadro’s number (atoms/mole), SSA is the specific surface area of the catalyst (m2/g catalyst), and 1 × 10¹⁸ is the conversion from m2 to nm2.
The anatase phase of TiO2 was predominant in all the samples calcined at 400 °C and 500 °C. However, further increases in the calcination temperature produced significant changes in the crystal structure of the TiO2 support, with evidence of anatase-to-rutile phase transformation observed in certain catalysts. Two observations were made: (1) the presence of V on the catalyst surface significantly lowers the temperature at which sintering and anatase-to-rutile phase transformation occurs; and (2) the presence of WO3 inhibits changes in the crystal structure in WxV5TiO2 catalysts as the calcination temperature increases. The first observation is supported by several studies [33,54,55,56,57,58,59]. Balikdjian et al. [57] referenced the “sintering-induced phase transition” model proposed by Amores, et al. [55] that suggests surface V species promote sintering, even at low concentrations. The sintering process raises the catalyst surface temperature, facilitating rutile nucleation. Huang et al. [56] demonstrated that the presence of V2O5 significantly enhanced the densification of Sr0.4Ba0.6Nb2O6 ceramics, reducing the sintering temperature from 1425 °C to 1100 °C. Although the calcination temperatures in this study were much lower than those in the study by Huang et al. [56], it is analogous that V2O5 spreads out on the TiO2 surface, promoting its densification. Balikdjian et al. provided experimental evidence in support of the sintering-induced phase transition mechanism [57]. Sintering promotes surface smoothing, particle joining, and pore rounding [60]. Since V2O5 has a much higher vapor pressure than either TiO2 or WO3, sublimation and vapor transport of V species to surfaces of lower vapor pressure may be a mechanism of initial sintering for these catalysts as the calcination temperature increases. Surface V species likely enhance the particle boundary mobility, which will allow the particles to be drawn closer together and rearrange into a denser configuration (e.g., anatase to rutile TiO2). In addition, V2O5 can be considered a flux material that has a melting point of approximately 690 °C. Fluxes enhance atomic diffusion during solid-state sintering, thus accelerating phase transitions [60].
The second observation, the inhibition effect of WO3 on V2O5/TiO2 catalyst sintering, is also supported by many other researchers [2,3,7,16,17,33,54,61]. Reed [60] states that grain growth is inhibited when a dopant exceeds the solubility limit and a well-dispersed second phase exists at the grain boundaries. Thus, in the WxV5TiO2 catalysts, the WO3 would be relatively insoluble in TiO2 at the calcination temperatures used in this study. In addition, it would be well dispersed on the catalyst surface. Therefore, its presence on the surface of the catalyst would inhibit densification, hence, conversion from anatase to rutile TiO2. This is clearly shown in the SEM images shown in Figure S1, which depicts the morphologies of the catalysts calcined at 600 °C. The spherical anatase TiO2 features are preserved to a greater extent as WO3 loading increases.
The changes in BET surface area for WxV5TiO2 catalysts as functions of W/Ti mass ratios and the calcination temperature are provided in Figure 2. The specific surface area decreases significantly with the calcination temperature for all catalyst compositions. Therefore, sintering of the catalysts occurs with and without the addition of WO3 as the calcination temperature increases from 400 °C to 600 °C. This is also shown in TEM images in Figures S2–S5, where catalyst particle sizes significantly increase with calcination temperature from 400 °C to 500 °C. The reduction in surface area is the result of surface smoothing of particles, neck growth between adjacent particles, and shrinkage and/or blocking of pores. However, at each calcination temperature, the BET surface area generally increases with W/Ti mass ratios from 0.02 to 0.10.
Figure 3a–d show the XRD diffractograms of the catalysts. Figure 3a shows the XRD diffractograms for pure ST01 TiO2 calcined at various temperatures. It was observed that the crystal structure of pure ST01 TiO2 was anatase at all calcination temperatures studied (400–600 °C). This is supported by other researchers, who reported that the anatase-to-rutile phase transformation of pure anatase TiO2 takes place in the temperature range of 700 °C to 900 °C [54,55,57,58,62].
Figure 3b shows the XRD diffractograms of W0V5TiO2 catalysts calcined at temperatures from 400 °C to 600 °C. Both anatase and rutile crystal phases of TiO2 are present following calcination at 550 °C, and a nearly complete phase transition to rutile occurred at 600 °C. This shows that V loading promotes sintering and phase transformation in TiO2. No crystalline V2O5 is observed on the XRD diffractograms. This provides evidence that the vanadia species are predominantly amorphous, and, if present, crystalline vanadia species are below the detection limit of XRD.
Figure 3c presents the XRD diffractograms of W5V5TiO2 catalysts as a function of the calcination temperature. The results indicate that the TiO2 remained predominantly in the anatase phase up to 550 °C, with the anatase phase still dominant even at 600 °C. These observations are consistent with previous reports [2,3,7,16,17,33,54,61], which suggests that WO3 inhibits the anatase-to-rutile phase transformations in TiO2. Since anatase is the more catalytically active polymorph of TiO2, the incorporation of WO3 effectively extends the thermal stability range of the catalyst, broadening its operational temperature window. Notably, no crystalline phases corresponding to V2O5 or WO3 were detected in the W5V5TiO2 catalysts’ XRD diffractograms, indicating either high dispersion or amorphous character of these species.
Figure 3d shows the XRD diffractograms of WxV5TiO2 catalysts after calcination in air at 600 °C, where x is varied from 0 to 10 (W/Ti mass ratio = 0 to 0.10). As the W/Ti mass ratio increases from 0 to 0.1, the anatase TiO2 support is remarkably preserved. W0V5TiO2 is nearly all rutile after calcination at 600 °C, while W10V5TiO2 is nearly all anatase under the same conditions. Although sintering of the catalysts occurs with W loading, as indicated by the reduction in BET surface area after calcination of the catalysts from 400 °C to 600 °C, W loading significantly inhibits the densification of the TiO2, and so the anatase crystal structure is preserved. Additionally, weak diffraction features characteristic of crystalline WO3 begin to appear in the XRD diffractograms of the W10V5TiO2 catalysts after calcination at 600 °C (20° < 2θ < 25°), suggesting partial crystallization of WO3 at higher loadings.
The fraction anatase in each catalyst was calculated using Equation (3), an equation that was reported in [53]. Figure 4a shows the anatase fraction in WxV5TiO2 catalysts as a function of the W/Ti mass ratio and calcination temperature. At calcination temperatures ≤ 500 °C, no significant effect of the W/Ti mass ratio is seen on the crystal structure of TiO2, since the crystal structure of TiO2 in all catalysts calcined at 400 °C and 500 °C is anatase. Therefore, the data points in Figure 4a for catalysts calcined at 400 °C and 500 °C overlap. However, after calcination at 550 °C and 600 °C, there is a clear role of WO3 as an inhibitor of TiO2 phase transformation from anatase to rutile.
F a n a t a s e = 1 1 + 1.26 ( I r / I A )
Here, Fanatase = the fraction of anatase TiO2, IA = the intensity of the strongest anatase peak (2θ = 25.3), and Ir = the intensity of the strongest rutile peak (2θ = 27.4).
Figure 4b shows the anatase fraction in WxV5TiO2 catalysts as a function of monolayers of V (as defined in Equations (1) and (2)) on the TiO2 support. As shown in Figure 4b, the anatase fraction decreases after approximately eight monolayers of V on TiO2 are reached.
The anatase crystal sizes in WxV5TiO2 catalysts were calculated by using the Debye–Scherrer equation (Equation (4)). As shown in Figure 5a, the anatase crystal size increases as the calcination temperature increases. There appears to be a critical crystal size of anatase at approximately 110 nm, above which TiO2 phase transformation occurs from anatase to rutile. This is also shown more clearly in Figure 5b, which correlates the anatase crystal size with the number of monolayer loadings of V on TiO2. After approximately 15 monolayers of V, the anatase crystal size reached a plateau at approximately 110 nm. An anatase crystal size plateau has been reported by other researchers who studied the anatase-to-rutile phase transition, including Perego et al. [62] who reported an anatase particle size plateau at approximately 40 nm, and Zhang et al. [63], who reported a plateau at approximately 80 nm. Additional support was found by Orendorz et al. [64], who reported anatase crystal sizes as large as 125 nm. Further sintering of these anatase crystals results in densification and phase transformation from anatase to rutile. Perego et al. [62] found that changes in the morphology of anatase TiO2 impacted the anatase-to-rutile transformation process by altering the rate of rutile nucleation at the interface between two anatase surfaces. Analogously, the addition of WO3 to the anatase TiO2 surfaces would change its surface morphology and, thus, inhibit the rutile nucleation process between two anatase surfaces.
d p = k λ B 1 / 2 Cos θ
Here, dp = the diameter of the anatase crystalline particle (nm). k = 0.94. B1/2 = the half height width of the predominant anatase peak (nm). λ = the wavelength of X-rays (1.54 Å). θ = the angle measured from the diffraction pattern.
Figure 6a,b show the Raman spectra of selected catalysts, providing complementary information to the XRD data. Raman spectroscopy is particularly useful for detecting the presence of V and W species at low concentrations. Figure 6a illustrates the effect of the calcination temperature on W0V5TiO2 catalysts, and Figure 6b shows the same for W5V5TiO2 catalysts. In each figure, the spectral region between 700 cm−1 and 1050 cm−1 is magnified to highlight signals associated with vanadia species.
The Raman spectra data support the XRD data with respect to anatase-to-rutile transformation. Characteristic anatase TiO2 peaks at 144, 393, 151, and 638 cm−1 [59] are predominant in all spectra shown in both Figure 6a,b with one exception; the spectra for the W0V5TiO2 catalyst after calcination at 600 °C shows predominantly rutile TiO2 features (142, 247, 441, and 610 cm−1 [59]). Minor rutile features are also observed in the W0V5TiO2 catalyst calcined at 550 °C and in the W5V5TiO2 catalyst calcined at 600 °C. These observations in the Raman spectra support the XRD data that show that the addition of WO3 to the catalysts inhibit the anatase-to-rutile TiO2 transformation.
The enlarged sections of the Raman spectra (Figure 6c,d) show two broad bands near 800 cm−1 and 950 cm−1, and one sharp band appearing at 995 cm−1. The broad band near 800 cm−1 could be a minor peak characteristic of anatase TiO2, since it is also observed in TiO2 samples containing neither V nor W (Figure S6). The broad band near 950 cm−1 may be attributed to polymeric vanadate (V=O) groups [65,66,67]. The peak at 995 cm−1, which is observed in the W5V5TiO2 catalysts calcined at temperatures of 500 °C and higher can be attributed to the stretching vibration mode of V=O groups in crystalline V2O5 [65,66]. Therefore, the Raman data give evidence of V2O5 crystallization, and the presence of WO3 promotes it. The discrepancy between Raman and XRD results with respect to crystalline V2O5 could arise from the fact that the detection limits of Raman spectroscopy are lower than those for XRD [68,69]. This was reported by Curcio et al. [69], who stated that Raman spectra are very sensitive, even to slight structural modifications that are below the detection limit of conventional characterization techniques, such as X-ray diffraction. Raman spectroscopy excels at surface-sensitive, molecular-level analysis and is useful for nanoscale or single particle measurements, whereas XRD is excellent for determining crystalline phase composition and crystallite size. However, the detection limits of XRD are in the range of 0.1 wt% to 1 wt% per phase [70].
The morphologies of the WxV5TiO2 catalysts were investigated via scanning electron microscopy (SEM), and the compositions of various features on the catalysts were investigated using EDX (Figures S7–S16). The phases and elemental composition of features observed in the SEM micrographs were supported with EDX, XRD, and Raman analyses.
Figure 7 shows the influence of the calcination temperature on the morphology of the W0V5TiO2. Noted are two key observations: (1) features containing predominantly V (per EDX analyses) start appearing even after calcination at 500 °C, and (2) the presence of V promotes sintering and phase transformation of small (<100 nm), spherical anatase crystals (Figure S7) to large (>1 um) rutile structures. Ribbon-like structures appear after calcination at 500 °C, as shown by the yellow arrows, as evidenced in Figure S8. Tetrahedron-shaped rutile TiO2 features (Figure S9) appear after calcination at 550 °C (green arrows), as do clusters of rod-like structures (red arrows); these features coalesce and sinter to form large (>1 um) rutile structures after calcination at 600 °C. The structural modification of TiO2 to the rutile phase is highly undesirable, as it leads to a significant decrease in the surface area and loss of catalytic activity.
Structures containing predominantly V are distinct temperature-dependent morphological structures, such as the ribbon-like structure after calcination at 500 °C. The transition of these V-containing structures as a function of temperature are consistent with the observations reported by Loffler et al. (2011) [71], who used SEM micrographs to investigate the formation of V nanocrystals as a function of the calcination temperature. Their results support the observations made in Figure 7. Loffler et al. [71] investigated the formation of vanadium oxide nanocrystals as a function of the calcination temperature and found three distinct growth regimes: vanadium oxide nanowires (<500 nm) were formed at temperatures < 450 °C, sheets (~1 um wide) were formed at temperatures between 450 °C and 600 °C, and rods (~10 um long) were formed at temperatures greater than 650 °C. Similar morphological features were observed in the catalyst samples analyzed in this study, supporting the trends noted in Figure 7.
Figure 8a–d show the SEM images of the W5V5TiO2 catalysts, highlighting their morphological changes with an increasing calcination temperature. Needle- and rod-like V-structures are apparent after calcination at 550 °C (Figure 8c, blue arrows) in W5V5TiO2 catalysts, while the spherical anatase TiO2 particles (<100 nm) remain the dominant morphology even after calcination at 550 °C. Plate-like rutile features (orange arrows) appear after calcination at 600 °C, consistent with the onset of anatase-to-rutile phase transformation.
A comparison of Figure 7 and Figure 8 clearly demonstrates that the incorporation of WO3 on the catalysts inhibits the initial formation of V-containing ribbon-like structures. In addition, the presence of WO3 significantly affects the rutile crystal structure following phase transformation after calcination at 600 °C. In the absence of WO3, the rutile structures are notably large (>1 um), first appearing as tetrahedron-like structures at 550 °C and subsequently coalescing into boulder-like aggregates as the calcination temperature increases to 600 °C. However, in W5V5TiO2 catalysts, the rutile structures are more plate-like or even have a “butterfly”-like morphology, and the spherical anatase features, while much larger (~100 nm compared to ~20 nm), are still present. This observation indicates that WO3 both inhibits phase transformation of anatase to rutile and alters the crystal structure of rutile once it is formed. This is consistent with the findings of Cristallo et al. [72], who studied the morphological changes in TiO2 doped with V2O5 and with both V2O5 and WO3. They found that the rutile phase in catalysts containing WO3 grows in only two directions, resulting in plate-like rutile structures, and the (101) plane in rutile is the preferential growth plane [72].

2.2. Catalysis

The performance of the catalysts was assessed using the oxidation of dimethyl sulfide (DMS) as a relative measure of catalytic activity. Figure 9a,b show the effects of W/Ti mass ratio on DMS oxidation after the catalysts were calcined at 500 °C (Figure 9a) and 600 °C (Figure 9b). Figure 9a shows that all V-containing catalysts calcined at 500 °C can degrade > 95% of the DMS at a reaction temperature of 250 °C. In contrast, under identical conditions, DMS conversion was less than 20% in both the blank reactor (i.e., without catalyst) and when using pure TiO2 as the catalyst. This confirms that the presence of V on anatase TiO2 is responsible for the catalytic activity for the oxidation of DMS, and it implies that WO3 is not catalytically active for the oxidation of DMS. Figure 9b shows that catalysts containing a W/Ti mass ratio of 0.05 and 0.10, after calcination at 600 °C has activity for DMS oxidation greater than those with W/Ti mass ratios of 0 and 0.02. Since W loading inhibits phase transformation from anatase to rutile, the activity of the catalyst is preserved even after calcination at 600 °C in W5V5TiO2 and W10V5TiO2 catalysts.
Figure 10a,b show the effects of the calcination temperature on the catalytic activity of W0V5TiO2 catalysts (Figure 10a) and W5V5TiO2 catalysts (Figure 10b). As shown in Figure 10a, the catalytic activity of W0V5TiO2 decreases when calcined above 500 °C. This decline is due to the changes in crystal structure (anatase-to-rutile transformation), morphology, and surface area reduction of the W0V5TiO2 catalysts with an increasing calcination temperature. In contrast, Figure 10b shows that the presence of W on the catalyst may block or inhibit catalyst activity after calcination at 400 °C, since its activity is lower than W5V5TiO2 catalysts calcined at 500 °C and 550 °C. The presence of W on the catalysts at 500 °C, 550 °C, and, to a lesser extent, at 600 °C calcination temperatures, however, preserves the activity of the catalysts for DMS oxidation. Since W inhibits TiO2 anatase-to-rutile phase transformation, it preserves the presence of V on anatase TiO2 and, thus, catalyst activity at higher calcination temperatures.
Figure 11, Figure 12 and Figure 13 show the reaction rate of DMS oxidation at 200 °C as functions of surface area (Figure 11), percentage anatase TiO2 (Figure 12), and coverage of catalyst with V as defined by monolayers of V in this manuscript (Figure 13). These figures show that TiO2 by itself is not reactive for DMS oxidation at 200 °C. This is evidenced by its relatively low apparent reaction rate compared to the WxV5TiO2 catalysts.
When comparing the reaction rates of the W0V5TiO2 catalyst following calcination at 400 °C and 500 °C in Figure 11, the decrease in surface area from 150 m2/g to 75 m2/g is likely the reason for the observed decrease in catalytic activity. At these points, the catalyst is still 100% anatase TiO2. This demonstrates that the surface area impacts the apparent reaction rate for W0V5TiO2 catalysts.
Comparing the reaction rates of the catalysts following calcination at 400 °C (highest surface area data point for each catalyst), W0V5TiO2 and W2V5TiO2 catalysts are most reactive. These catalysts have strong interactions between vanadia species and the anatase TiO2 support. This is supported by Haber et al. (1986) [73], who stated that the structure of vanadium oxygen species determines the oxygen capacity of the vanadia layer, and the reactivity may be significantly related to the transfer of oxygen between the gas phase and catalyst. TiO2 has a high concentration of monovanadate species on its surface, which gives it a high overall oxygen capacity. This property would give the catalyst an enhanced redox capacity due to its labile oxygen species.
The WO3 species in the W5V5TiO2 and W10V5TiO2 catalysts following calcination at 400 °C are less active than the same catalysts calcined at 500 °C and 550 °C, even though their surface areas decrease considerably with the calcination temperature. A reason for this observation may be that W species are blocking a fraction of the V species interactions with anatase TiO2 following calcination at 400 °C. In addition, the higher calcination temperature may enhance the mobility of vanadia species on the surface of the catalysts, allowing for more intimate interactions between vanadia species and anatase TiO2 and/or W-V-TiO2 interactions, thus creating synergistic benefits.
The highest reaction rates occur on catalysts that are 100% anatase (Figure 11 and Figure 12), even though their surface areas range from 20 m2/g to 150 m2/g, depending upon the catalyst composition. This gives evidence that the V species over the surface of anatase TiO2 significantly contributes to the activity of the catalyst, and its contribution to catalyst activity is greater than that of surface area. While the surface area has a role in apparent reactivity, it is less significant than the interactions of W, V, and anatase TiO2.
From Figure 13, the coverage of V on the surface of the catalyst also appears to significantly contribute to the reactivity of the catalyst. The optimal V loading on anatase TiO2 is between 0.5 and 4 monolayers. Below 0.5 monolayers of V, activity increases with increasing V. Above four monolayers, the reactivity appears to decrease, likely due to phase transformation and morphological changes. According to Saleh et al. [74], the state of vanadia species on anatase TiO2 is strongly dependent upon the calcination temperature and the morphology of the supported vanadia phase. Catalytic activity is enhanced when a complete monolayer of surface vanadia exists on anatase TiO2.

3. Discussion

This study systematically investigates the morphological, structural, and crystallographic evolution of WxV5TiO2 catalysts as a function of WO3 loading and the calcination temperature, ranging from 400 °C to 600 °C. This information is critical for understanding catalytic activity and deactivation mechanisms on this catalyst system.
The anatase-to-rutile transformation is a critical process influencing the thermal, optical, and catalytic properties of TiO2. Understanding the theoretical mechanisms underlying this phase transition is essential for tailoring TiO2-based materials for various technological applications. The anatase-to-rutile transition is a thermally-activated reconstructive polymorphic phase transition, which involves the breaking and reforming of Ti–O bonds, significant atomic rearrangement, and a change in the unit cell symmetry [75].
Phase transformation of nanocrystalline anatase-to-rutile occurs via combined interface and surface nucleation. The driving force for anatase-to-rutile transition is the reduction in the Gibbs free energy (ΔG) of the system, with rutile being the lower-energy configuration at elevated temperatures [76]. At the atomic scale, the phase transition proceeds through the formation of rutile nuclei within anatase grains, followed by the diffusion and rearrangement of Ti4+ and O2− ions, leading to the transformation of the octahedral framework, and finally the growth of rutile domains. This process involves overcoming an activation energy barrier related to the substantial atomic reorganization required for the phase transition [77].
The catalytic activity of these materials is closely associated with V loading on anatase TiO2. However, the incorporation of V significantly accelerates morphological changes and facilitates the anatase-to-rutile phase transformation. Specifically, nanoscale (~20 nm) spherical anatase crystals undergo restructuring into larger (>1 μm) rutile structures as the calcination temperature increases from 400 °C to, indicating that V presence on the TiO2 surface compromises the thermal stability of the anatase phase.
Conversely, the addition of tungsten oxide (WO3) in WxV5TiO2 formulations enhances the thermal stability of the catalyst by inhibiting both morphological alterations and phase transitions across the same temperature range. In addition, Jung et al. [78] found that the introduction of tungsten into V/TiO2 catalysts resulted in enhanced reducibility and oxygen mobility through interactions between V and W, which lowered the activation barrier for dichloroethylene oxidation. This suggests that WO3 incorporation into the anatase TiO2 support not only extends the operational temperature window over which the catalyst retains its structural integrity and activity, but there may be synergistic effects between W, V, and TiO2 that enhance oxygen mobility, catalyst reducibility, and hence, catalyst activity.
WxV5TiO2 catalysts with V loading in the range of 0.5 to 4 monolayers of V on anatase TiO2 exhibit effective catalytic activity for the oxidation of dimethyl sulfide (DMS). V loadings exceeding seven monolayers promote significant restructuring of the anatase phase, leading to phase transformation into rutile TiO2 and, consequently, a loss of the desirable structural properties associated with high catalytic performance.
The activity in this study was assessed using DMS as a probe molecule, but performance under real-world conditions involving multi-component VOC mixtures, humidity, or varying oxygen levels, simulating industrial or environmental exhaust conditions, should be addressed in the future. The use of in situ Raman or XRD under reaction conditions would provide insights into the dynamic behavior of the catalysts during DMS oxidation, particularly phase stability, surface restructuring, and the formation of reaction intermediates.

4. Materials and Methods

4.1. Materials Used

Ishihara-ST01 TiO2 was used as the support material, and it was purchased from Ishihara Sangyo Kaisha Ltd. (Osaka, Japan). The specific surface area of Ishihara ST01 TiO2 powder is approximately 300 m2/g, and it is 100% anatase, with a primary anatase crystal size of about 7 nm [79]. Ammonium metavanadate was purchased from Fisher Scientific (Waltham, MA, USA), and tungstic acid and ammonium hydroxide were purchased from Sigma-Aldrich (Burlington, MA, USA); all chemicals were used as received.

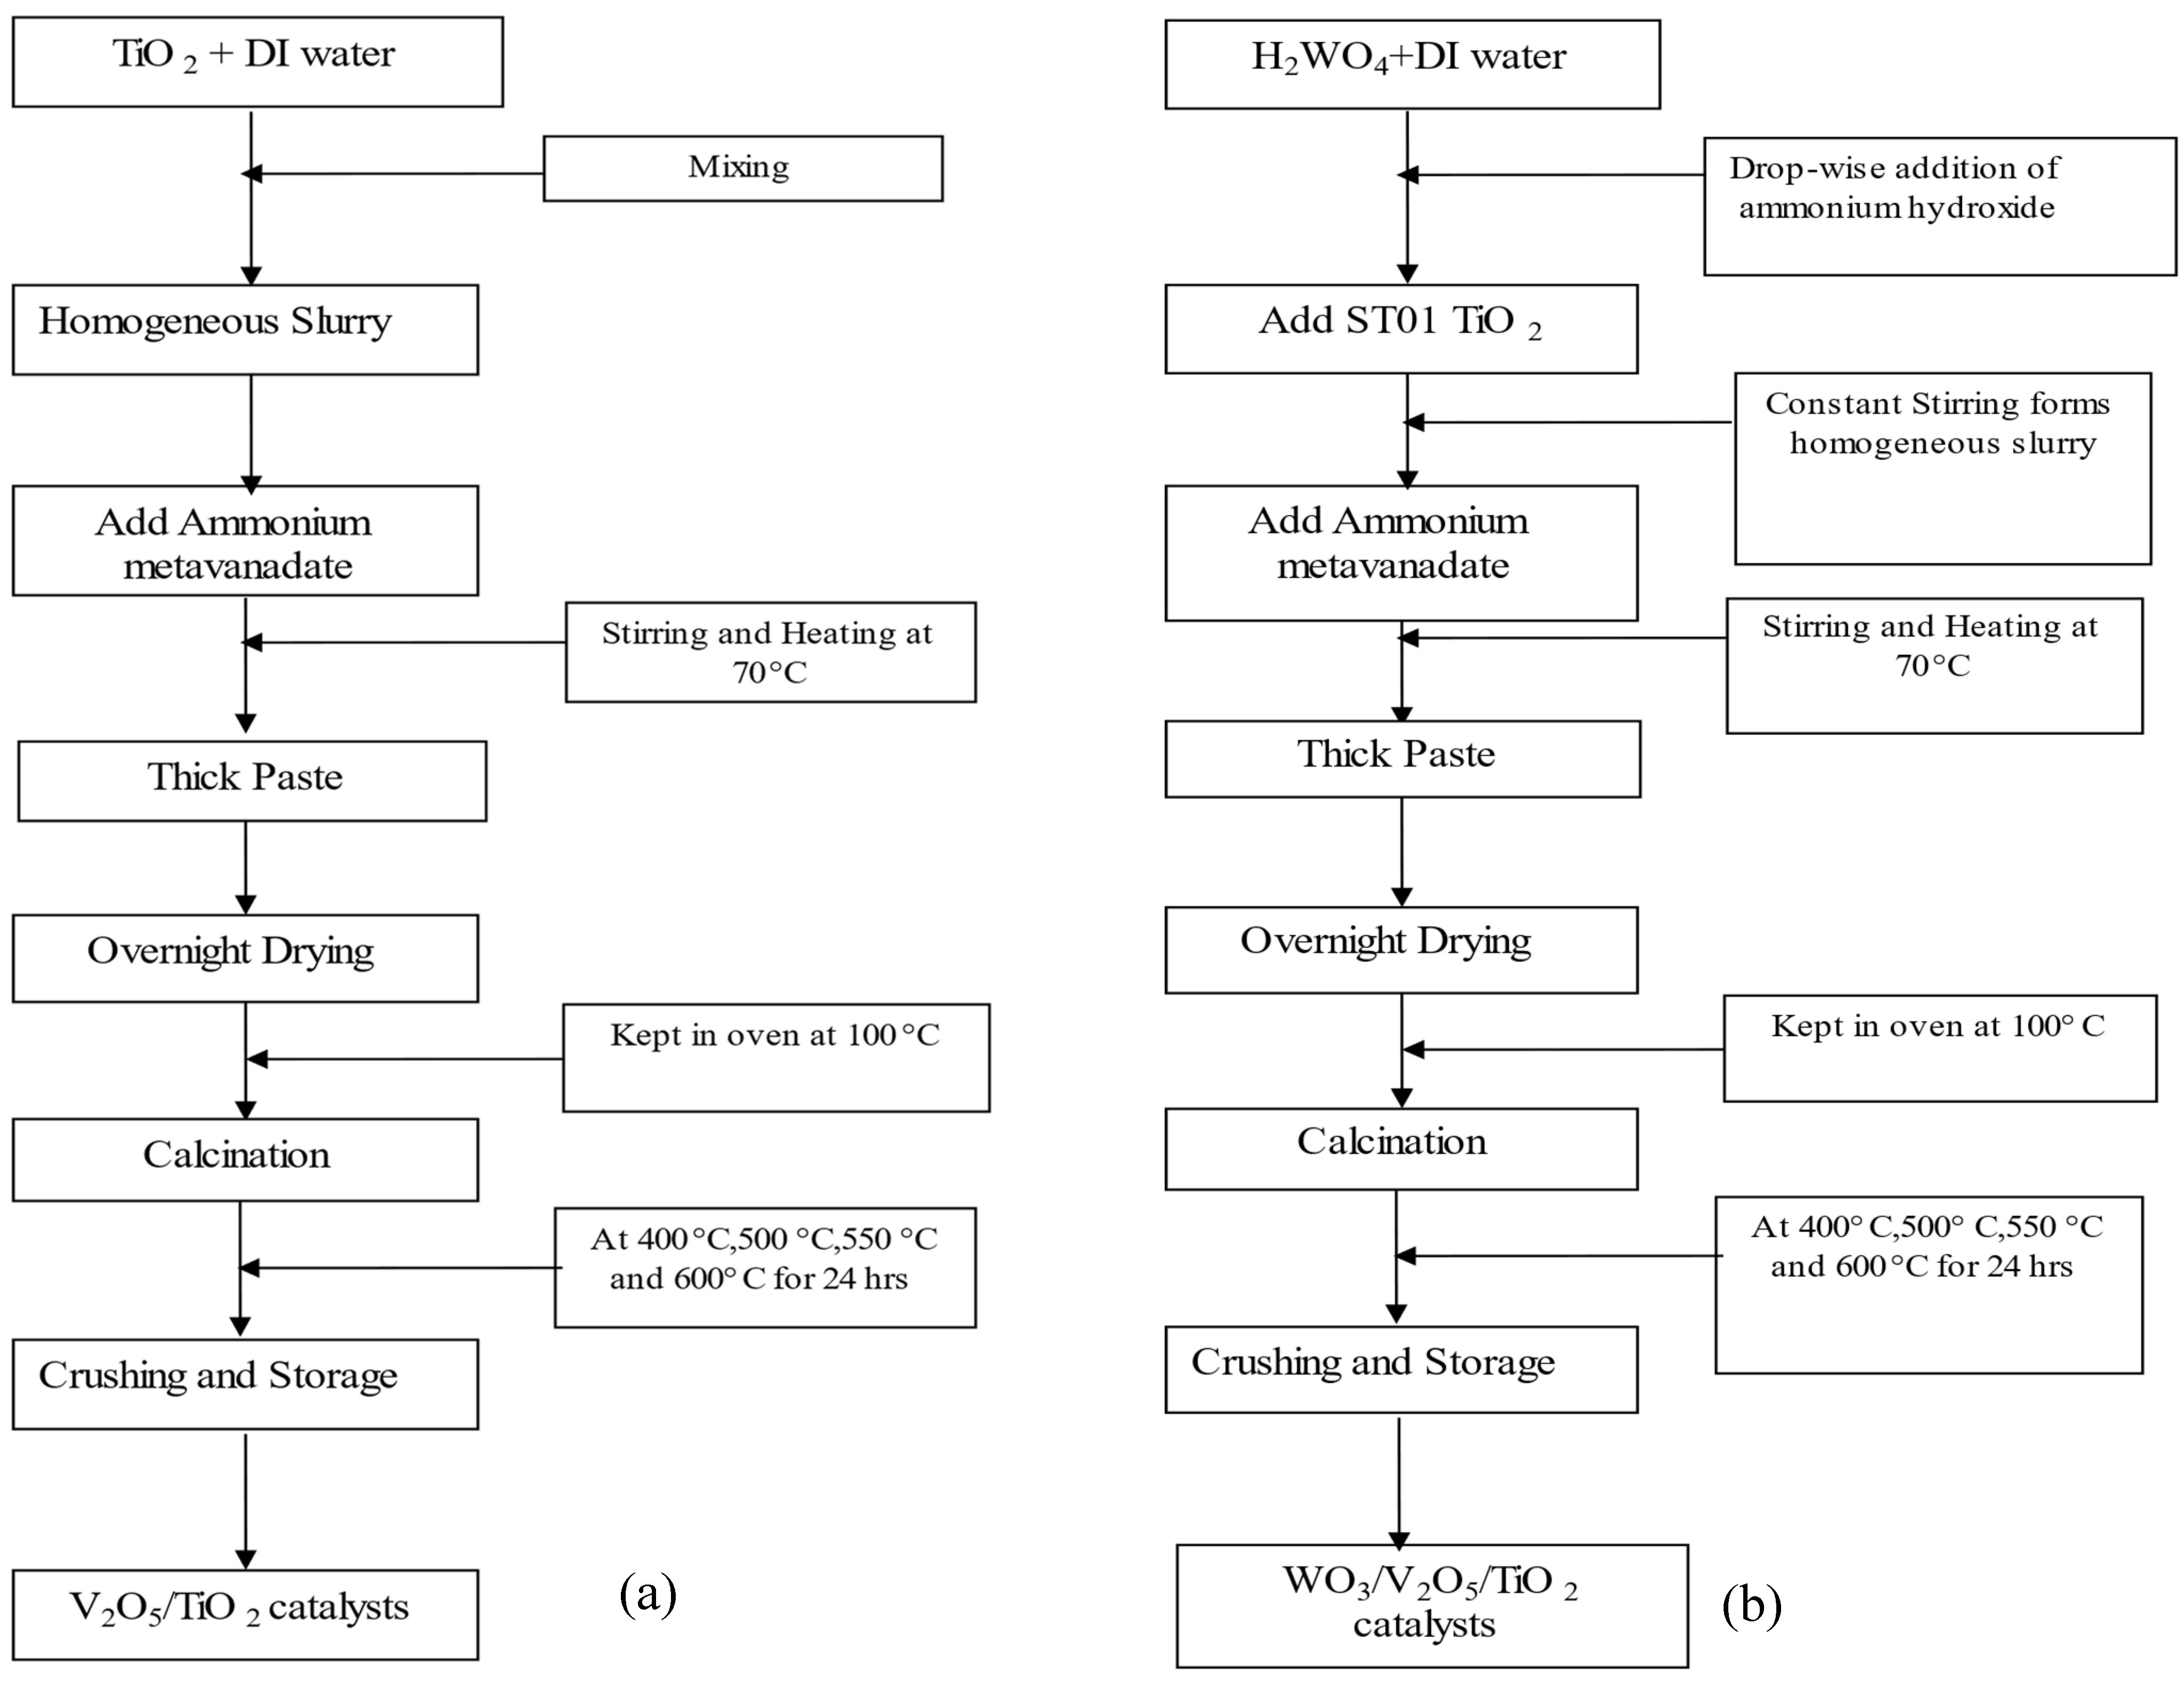
4.2. Synthesis of Catalysts

Flow charts to illustrate the methods of catalyst synthesis are provided in Figure 14a,b for W0V5TiO2 and WxV5TiO2 catalysts, respectively.
Briefly, the catalysts were prepared using a wet incipient method, and the amounts of each chemical added are provided in Table S1. For catalysts prepared without the WO3 dopant, 5 grams of Ishihara ST01 TiO2 was added to 60 mL of deionized water to form an aqueous slurry in a beaker. Constant magnetic stirring was carried out to maintain a uniform slurry. An appropriate amount of ammonium metavanadate was added to obtain a V/Ti mass ratio of 0.05. The slurry was heated to 70 °C under constant stirring until a thick paste was formed. The paste was dried in a pre-heated oven at 100 °C overnight. The dried paste was then crushed to form a fine powder and was divided into four equal parts and calcined in air at 400 °C, 500 °C, 550 °C, and 600 °C for 24 h. The heating rate during calcination was not monitored, but the final calcination temperature was reached within 15 min.
To incorporate the WO3 dopant, the catalyst synthesis method was slightly modified. Tungstic acid (H2WO4) was added to 60 mL of deionized water in a quantity that would obtain W/Ti mass ratios ranging from 0 to 0.10. Ammonium hydroxide was added drop-wise to the solution to ensure the solubility of tungstic acid. After tungstic acid was completely dissolved, a weighed amount of ST01 Ishihara TiO2 was added to the solution to form slurry. Ammonium metavanadate was added to the slurry to obtain a V/Ti mass ratio of 0.05. The rest of the procedure as described above was followed. Note that all the WxV5TiO2 catalysts contained V with a V/Ti mass ratio of 0.05.

4.3. Catalyst Characterization

Catalyst characterization was conducted by studying its surface area, morphological properties, and crystal and surface structures. All of these properties were useful in the assessment of how WO3 affects the morphology, thermal stability, and catalytic activity of WxV5TiO2 catalysts.

4.3.1. Scanning Electron Microscope (SEM)

Scanning electron microscopy (SEM) was used to provide information about the physical and structural details of the catalysts. The morphologies of WxV5TiO2 catalyst particles were studied using a Zeiss Supra 35 VP FEG SEM (Jena, Germany). Catalyst samples for SEM analyses were prepared by dispersing the samples directly on carbon adhesive tapes. The main focus was to analyze the effects of W/Ti mass ratios (Figure S1) and calcination temperatures on the shape, size, surface texture, and arrangement of the particles.

4.3.2. Transmission Electron Microscope (TEM)

Transmission electron microscopy (TEM) was used to provide additional information about the physical and structural details of the catalysts, as shown in Figures S2–S5. TEM micrographs were taken of selected catalysts using a Zeiss 10C TEM (Jena, Germany). The catalysts were dispersed in acetone before being deposited onto carbon-backed TEM copper grids (Ted Pella, Inc., Redding, CA, USA).

4.3.3. Raman Spectrometry (Raman)

Raman spectra were collected for unused catalysts under ambient conditions using a Renishaw 2000 confocal Raman microprobe (Oxford, UK). Samples were excited with a HeNe (632 nm) laser. This source was focused onto the sample using a 50× (0.85 N.A.) objective, which produced an approximate beam diameter of two micrometers at the sample. Power at the sample did not exceed 6 mW. The same objective was employed to collect the scattered radiation. Spectra were collected at a 4 cm−1 resolution and represent the average of 5 individual scans. The integration time for each spectral element was 30 s. Figure S6 depicts the effects of WO3 loading on the catalysts that were calcined at 600 °C.

4.3.4. Energy Dispersive X-ray Analysis (EDX)

Simultaneous back-scattered electron diffraction with EDX was used to identify selected morphological structures on selected catalysts (Figures S7–S9).
Energy dispersive analysis was carried out to investigate the effects of the W/Ti mass ratios and calcination temperature on the final composition of the catalysts. EDX spectra were collected by using an EDAX Genesis 2000. The sample preparation was same as that for SEM. The entire spectra were collected at an accelerating voltage of 20 keV. Elemental analyses are depicted in Figures S10–S12; elemental mapping is provided in Figures S13–S16.

4.3.5. BET Surface Area

A Beckman Coulter SA3100 (Brea, CA, USA) was used to measure the surface area of the catalysts with N2 adsorption at 77 K. The samples were outgassed at 120 °C for 45 min prior to the surface area analyses. A second set of BET surface area measurements were conducted on all catalysts using a Micromeritics TriStar II surface area analyzer (Norcross, GA, USA), also with N2 adsorption at 77 K. Adsorption isotherms from this instrument are provided in Figures S17–S21, and the pore sizes, as determined using the BJH model and the desorption data, are provided in Figure S22.

4.3.6. X-ray Diffraction

The diffraction patterns of the catalysts samples in this study were recorded using a Scintag X-ray powder diffractometer (Cupertino, CA, USA) with a Cu Kα radiation source. Measurements were carried out in 2θ range extending from 20° to 60° at the step size of 0.04 and preset time of 0.5 s. XRD was operated at a voltage of 40 kV and filament current of 35 mA. The equipment was attached to a computer installed with software that was used to record and analyze the diffraction data. The diffraction data were plotted (instrument response vs. 2θ) to obtain the spectra. For anatase TiO2, the predominant peak (101) was at 2θ = 25.3°, and for rutile TiO2, the predominant peak (110) was at 2θ = 27.4°.
Equation (3) was used to calculate the fraction anatase phase of the TiO2 using XRD diffractograms, as well as the intensity of the anatase (101) TiO2 (Ia) and rutile (110) TiO2 (Ir) peaks, as described above. The Debye–Scherrer equation (Equation (4)) was used to calculate the anatase (101) crystal size from the XRD diffractogram, also described above.

4.3.7. Thermal Gravimetric Analyzer (TGA)

TGA analyses were conducted on all catalysts using a TA Instruments Q500 TGA (New Castle, DE, USA). The temperature was ramped at 10 °C/min from ambient temperature to 900 °C under a nitrogen gas atmosphere. The TGA data for catalysts that were calcined at 400 °C are provided in Figure S23, and mass losses as a function of temperature range are summarized in Table S2.

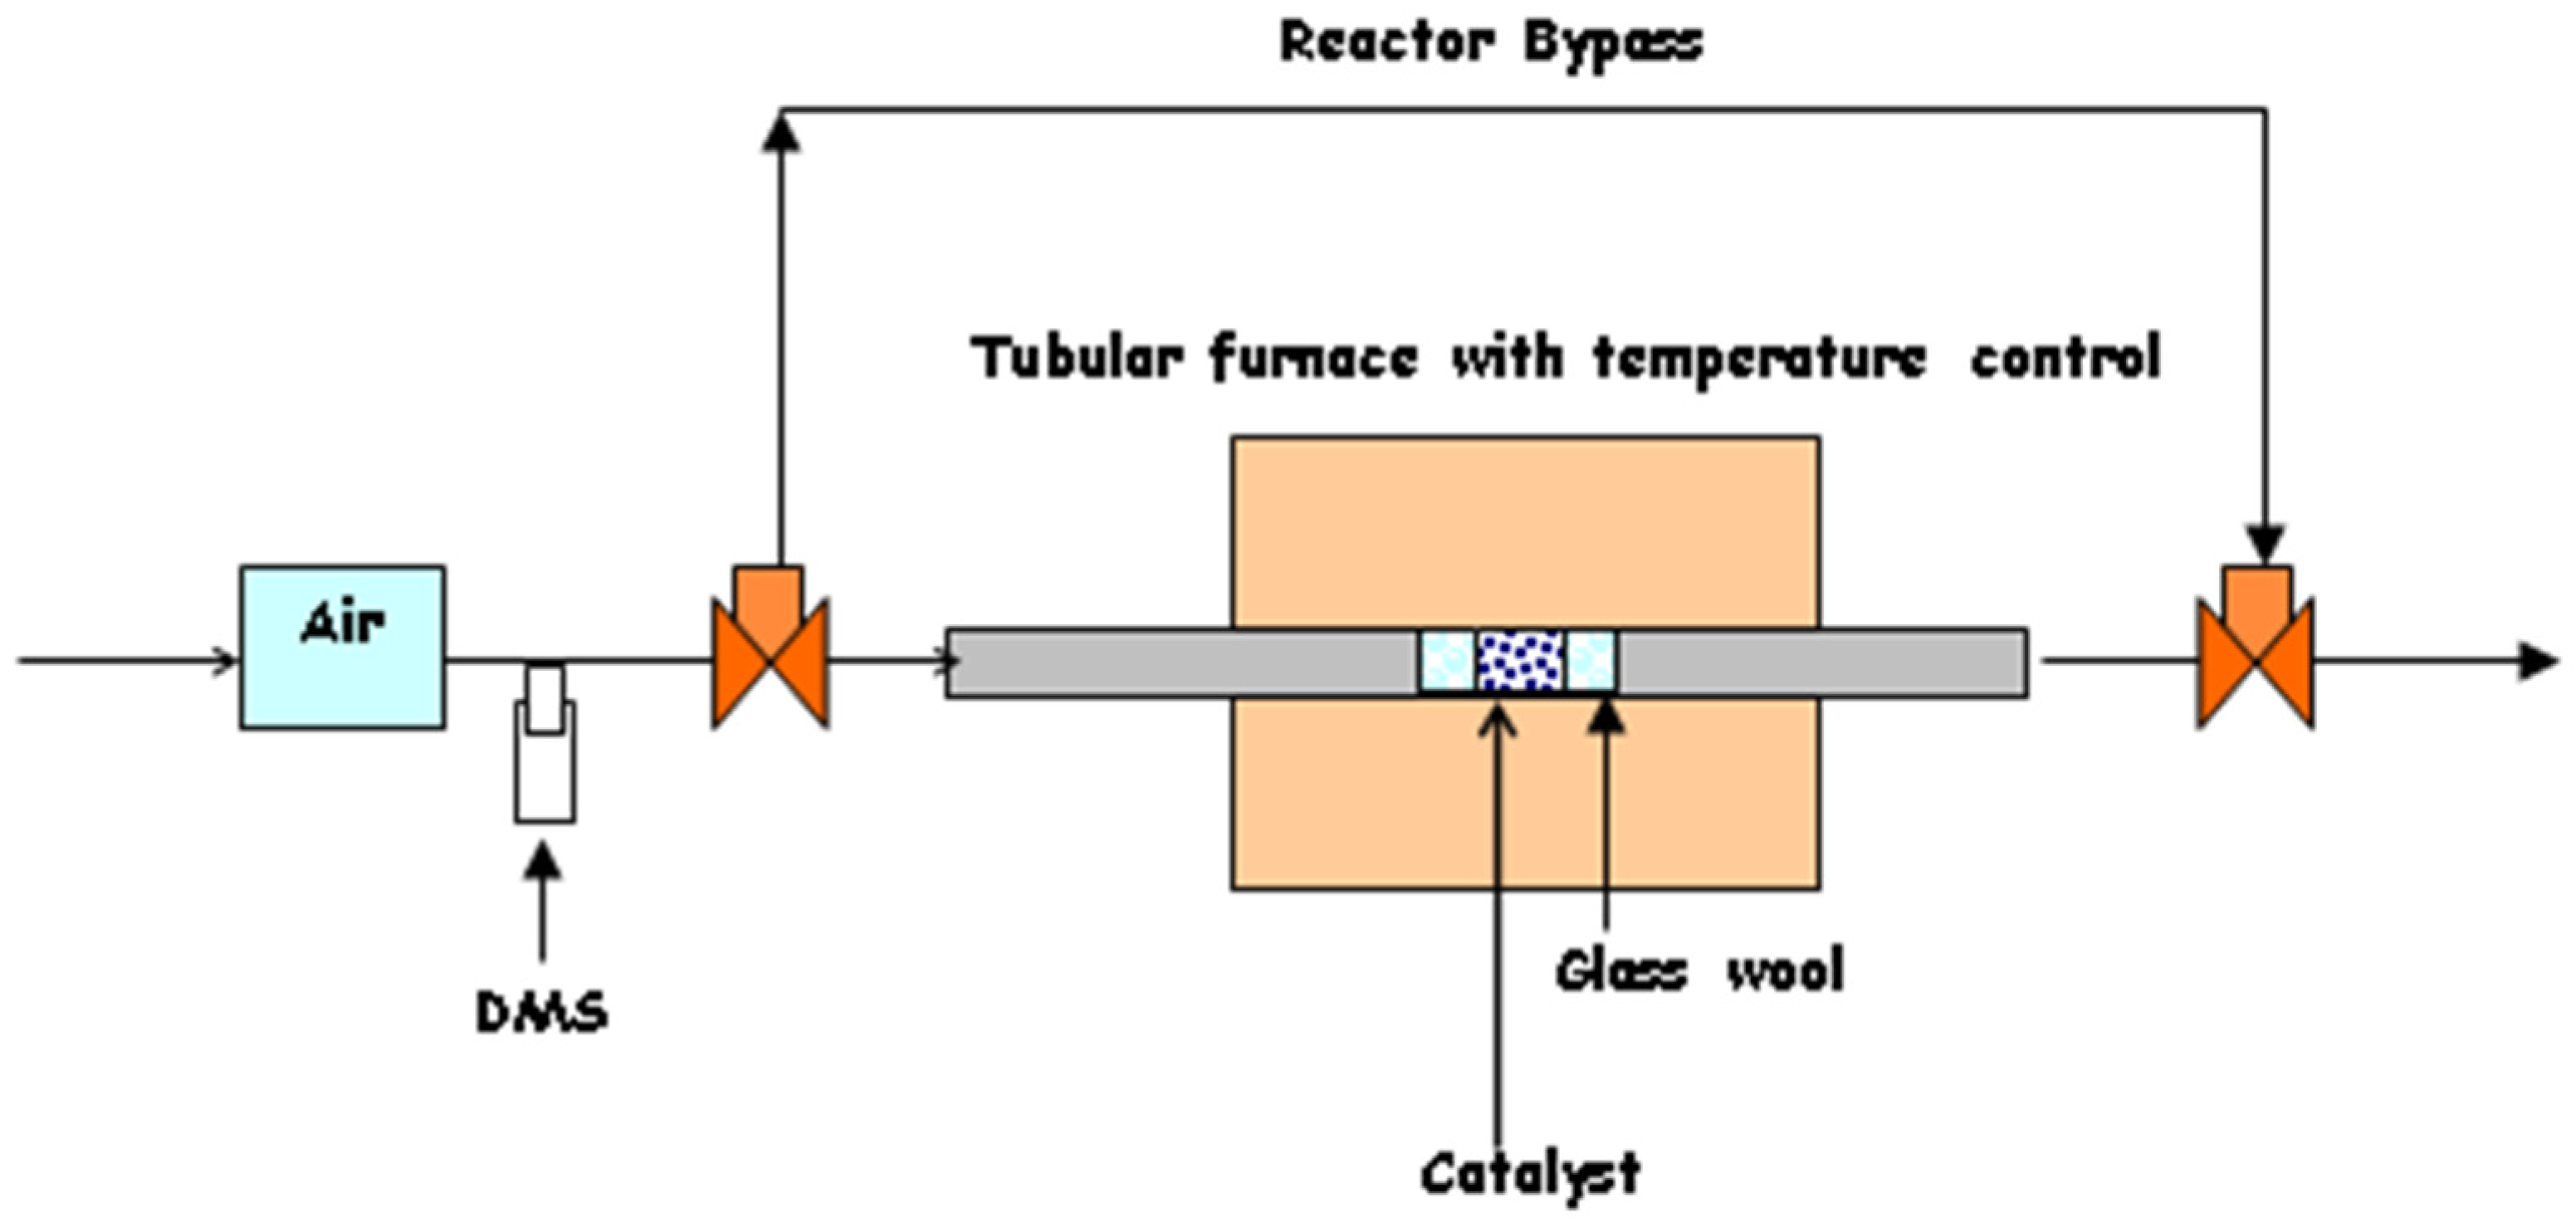
4.4. Catalyst Performance

The test system used in this study, depicted in Figure 15, consists of a stainless-steel tubular reactor (ID = 0.32 cm), a diffusion cell to generate dimethyl sulfide vapors, a mass flow controller (MKS Instruments, Andover, MA, USA, model no. M100B12CS1BV) to control the flow rate of air, and a Lindberg/Blue Mini-Mite tube furnace (Thermo Fisher Scientific, Waltham, MA, USA) to control the reaction temperature.
For each experimental trial, the performance of the catalyst was investigated using 50 mg of catalyst that was secured with quartz wool in the middle of a 0.32 cm ID stainless-steel reaction tube. Air, flowing at 20 cubic centimeters per minute (ccpm), was mixed with dimethyl sulfide vapor from the diffusion cell, resulting in a dimethyl sulfide concentration of 16,200 ppm (1.62 vol%). This gas stream was directed through the tubular reactor with a gas hourly space velocity (GHSV) = 3760/h, and the temperature in the reactor varied from 100 °C to 250 °C. The flow of air was measured before and after each experimental trial using a bubble meter. Online sampling valves on the gas chromatograph (GC), with a 1 mL sample loop, was used to analyze the influent and effluent from the reactor. The GC that was used is an Agilent 6890N gas chromatograph (GC) (Santa Clara, CA, USA) equipped with a thermal conductivity detector. A J&W Scientific DB-Wax column (Agilent Santa Clara, CA, USA) [80] was used to separate the components in the reactor effluent. ChemStation software (Revision A.09.01 2001) was used to obtain peak areas. The first readings were taken in triplicate at 100 °C, and subsequent samples were collected in at least duplicates two hours after the reaction temperature was reached.

Supplementary Materials

The following supporting information can be downloaded at: https://www.mdpi.com/article/10.3390/molecules30112436/s1, Table S1. Catalyst synthesis. Table S2. Summary of mass loss as a function of temperature range. Figure S1. SEM images (30,000 magnification) of WxV5TiO2 catalysts calcined in air at 600 °C C for 24 h. (a) Pure TiO2; (b) W0V5TiO2; (c) W2V5TiO2; (d) W5V5TiO2; (e) W10V5TiO2. Figure S2. TEM image of W0V5TiO2 calcined at 400 °C. Figure S3. TEM image of W0V5TiO2 calcined at 500 °C. Figure S4. TEM image of W5V5TiO2 calcined at 400 °C. Figure S5. TEM image of W5V5TiO2 calcined at 500 °C. Figure S6. Raman spectra of WxV5TiO2 catalysts calcined at 600 °C. (a) 100 cm−1 to 1400 cm−1; (b) enlarged area for selected catalysts from 700 cm−1 to 1050 cm−1. Figure S7. Simultaneous Electron Backscatter Diffraction (EBSD) with EDS on W5V5TiO2. Figure S8. Simultaneous Electron Backscatter Diffraction (EBSD) with EDS on W0V5TiO2. Figure S9. Simultaneous Electron Backscatter Diffraction (EBSD) with EDS on W5V5TiO2. Figure S10. EDS profile for TiO2 calcined at 600 °C. Figure S11. EDS profile for V5TiO2 calcined at 600 °C. Figure S12. EDS profile for W5V5TiO2 calcined at 600 °C. Figure S13. Elemental (a) mapping and (b) quantification of W0V5TiO2 calcined at 500 °C using EDX. Working distance = 10 mm; Aperture = 60 μm; EHT (accelerating voltage) = 15 kV. Figure S14. Elemental (a) mapping and (b) quantification of W0V5TiO2 calcined at 600 °C using EDX. Working distance = 10 mm; Aperture = 60 μm; EHT (accelerating voltage) = 15 kV. Figure S15. Elemental (a) mapping and (b) quantification of W5V5TiO2 calcined at 500 °C using EDX. Working distance = 10 mm; Aperture = 60 μm; EHT (accelerating voltage) = 15 kV. Figure S16. Elemental (a) mapping and (b) quantification of W5V5TiO2 calcined at 600 °C using EDX. Working distance = 10 mm; Aperture = 60 μm; EHT (accelerating voltage) = 15 kV. Figure S17. Nitrogen adsorption isotherms for TiO2. Figure S18. Nitrogen adsorption isotherms for W0V5TiO2. Figure S19. Nitrogen adsorption isotherms for W2V5TiO2. Figure S20. Nitrogen adsorption isotherms for W5V5TiO2. Figure S21. Nitrogen adsorption isotherms for W10V5TiO2. Figure S22. Pore size as a function of calcination temperature and catalyst composition. Pore size determined by nitrogen desorption data and the Barrett-Joyner-Halenda (BJH) model. Figure S23. TGA analyses of catalysts that had been calcined in air at 400 °C for 24 h. (a) Mass fraction remaining vs temperature; (b) derivative d(mass)/d(temp) (g/°C).

Author Contributions

Conceptualization, C.B.A. and E.S.-D.; methodology, C.B.A. and G.S.; validation, G.S. and C.B.A.; formal analysis, G.S.; investigation, G.S.; resources, E.S.-D. and C.B.A.; data curation, G.S.; writing—original draft preparation, G.S.; writing—review and editing, G.S., C.B.A. and E.S.-D.; visualization, G.S. and C.B.A.; supervision, C.B.A. and E.S.-D.; project administration, C.B.A. All authors have read and agreed to the published version of the manuscript.

Funding

This research received no external funding.

Institutional Review Board Statement

Not applicable.

Informed Consent Statement

Not applicable.

Data Availability Statement

All raw data supporting this study are available upon request from the corresponding author.

Acknowledgments

The authors would like to acknowledge Miami University’s Microscopy lab for the SEM and EDX analyses of the catalysts and the Geology department for the use of the XRD instrument.

Conflicts of Interest

The authors declare no conflicts of interest.

Abbreviations

The following abbreviations are used in this manuscript:
BETBrunauer–Emmett–Teller surface area analysis method
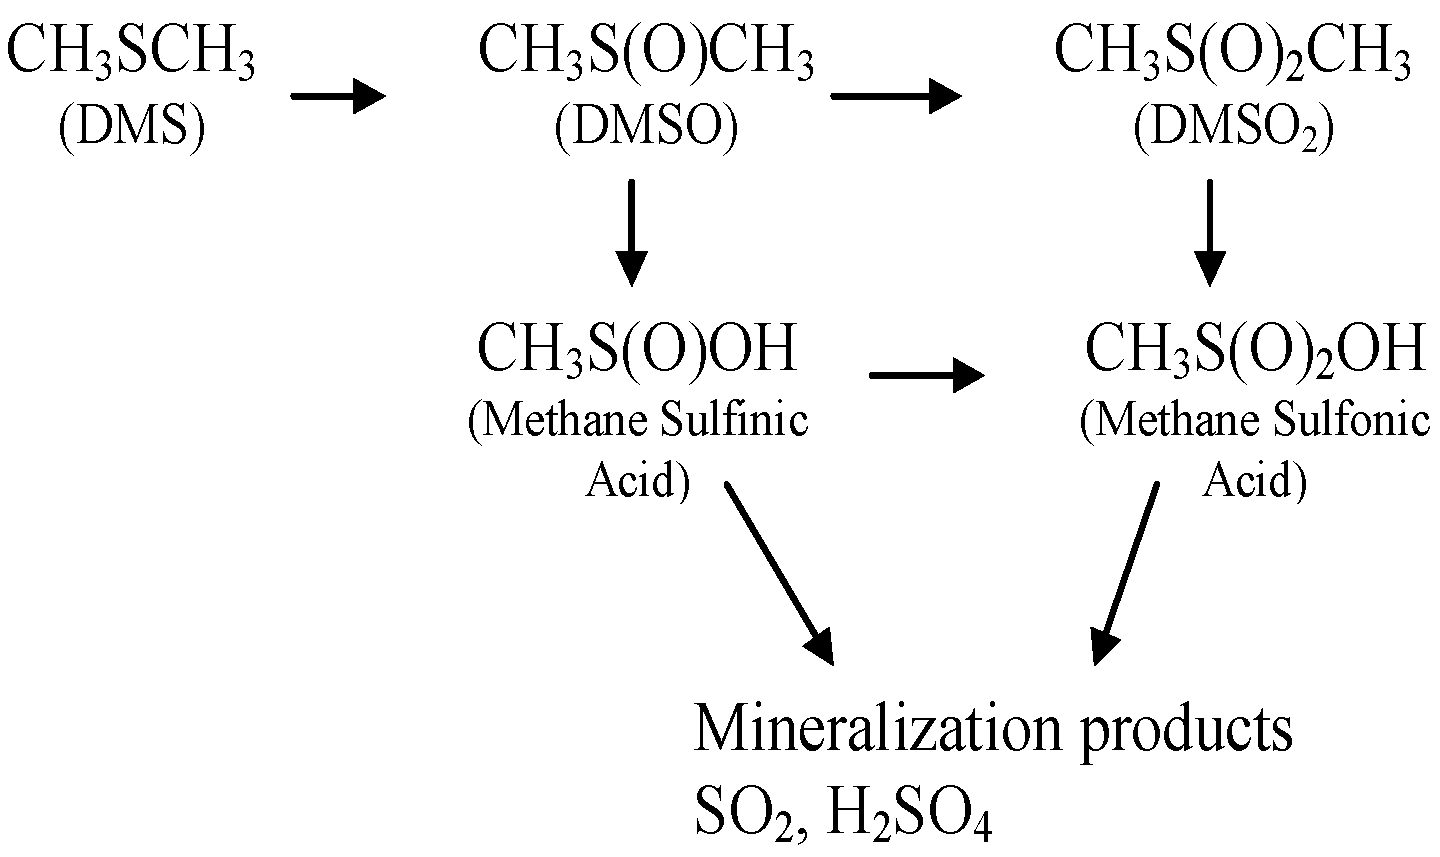
DMSDimethyl sulfide
EDXEnergy dispersion X-ray spectroscopy
FTIRFourier transform infrared spectroscopy
SEM Scanning electron microscope
VOCsVolatile organic compounds
WxV5TiO2WO3/V2O5/TiO2 catalysts with x = mass ratio W/Ti; 5 = mass ratio V/Ti
XRDX-ray diffraction

References

  1. Fernandes, D.M.; Scofield, C.F.; Neto, A.A.; Cardoso, M.J.B.; Zotin, F.M.Z. Thermal deactivation of Pt/Rh commercial automotive catalysts. Chem. Eng. J. 2010, 160, 85–92. [Google Scholar] [CrossRef]
  2. Madia, G.; Elsener, M.; Koebel, M.; Raimondi, F.; Wokaun, A. Thermal stability of vanadia-tungsta-titania catalysts in the SCR process. Appl. Catal. B-Environ. 2002, 39, 181–190. [Google Scholar] [CrossRef]
  3. Nova, I.; Acqua, L.D.; Lietti, L.; Giamello, E.; Forzatti, P. Study of thermal deactivation of a de-NOx commercial catalyst. Appl. Catal. B Environ. 2001, 35, 31–42. [Google Scholar] [CrossRef]
  4. Bartholomew, C.H. Mechanisms of catalyst deactivation. Appl. Catal. A Gen. 2001, 212, 17–60. [Google Scholar] [CrossRef]
  5. Imagawa, H.; Takahashi, N.; Tanaka, T.; Matsunaga, S.; Shinjoh, H. Improved NOx storage-reduction catalysts using Al2O3 and ZrO2-TiO2 nanocomposite support for thermal stability and sulfur durability. Appl. Catal. B Environ. 2009, 92, 23–29. [Google Scholar] [CrossRef]
  6. Phil, H.H.; Reddy, M.P.; Kumar, P.A.; Ju, L.K.; Hyo, J.S. SO2 resistant antimony promoted V2O5/TiO2 catalyst for NH3-SCR of NOx at low temperatures. Appl. Catal. B-Environ. 2008, 78, 301–308. [Google Scholar] [CrossRef]
  7. Huang, Z.G.; Zhu, Z.P.; Liu, Z.Y. Combined effect of H2O and SO2 on V2O5/AC catalysts for NO reduction with ammonia at lower temperatures. Appl. Catal. B-Environ. 2002, 39, 361–368. [Google Scholar] [CrossRef]
  8. Klimczak, M.; Kern, P.; Heinzelmann, T.; Lucas, M.; Claus, P. High-throughput study of the effects of inorganic additives and poisons on NH3-SCR catalysts Part I: V2O5-WO3/TiO2 catalysts. Appl. Catal. B-Environ. 2010, 95, 39–47. [Google Scholar] [CrossRef]
  9. Tang, F.S.; Xu, B.L.; Shi, H.H.; Qiu, J.H.; Fan, Y.N. The poisoning effect of Na+ and Ca2+ ions doped on the V2O5/TiO2 catalysts for selective catalytic reduction of NO by NH3. Appl. Catal. B-Environ. 2010, 94, 71–76. [Google Scholar] [CrossRef]
  10. Nicosia, D.; Czekaj, I.; Krocher, O. Chemical deactivation of V2O5/WO3-TiO2 SCR catalysts by additives and impurities from fuels lubrication oils and urea solution—Part II. Characterization study of the effect of alkali and alkaline earth metals. Appl. Catal. B-Environ. 2008, 77, 228–236. [Google Scholar] [CrossRef]
  11. Zheng, Y.J.; Jensen, A.D.; Johnsson, J.E.; Thogersen, J.R. Deactivation of V2O5-WO3-TiO2 SCR catalyst at biomass fired power plants: Elucidation of mechanisms by lab- and pilot-scale experiments. Appl. Catal. B-Environ. 2008, 83, 186–194. [Google Scholar] [CrossRef]
  12. Yan, S.; Shan, W.; Shi, X.; He, G.; Lian, Z.; Yu, Y.; Shan, Y.; Liu, J.; He, H. The way to enhance the thermal stability of V2O5-based catalysts for NH3-SCR. Catal. Today 2020, 355, 408–414. [Google Scholar] [CrossRef]
  13. Feng, Z.; He, R.; Zhang, Q.; Han, X.; Yue, Y.; Qian, G.; Zhang, J. Enhanced SO2-Resistance Ability of Ce-Modified TiO2-Wrapped V2O5 Catalyst. Energy Fuels 2025, 39, 5886–5896. [Google Scholar] [CrossRef]
  14. Szymaszek, A.; Samojeden, B.; Motak, M. The Deactivation of Industrial SCR Catalysts—A Short Review. Energies 2020, 13, 3870. [Google Scholar] [CrossRef]
  15. Dong, C.; Yao, J.; Shi, J.; Han, L.; Qin, H.; Zhang, Z.; Zhang, Q.; Wang, J. Resource utilization strategy based on the deactivation mechanism of V2O5-WO3/TiO2 catalyst. Fuel 2025, 381 Pt B, 133311. [Google Scholar] [CrossRef]
  16. Forzatti, P. Present status and perspectives in de-NOx SCR catalysis. Appl. Catal. A-Gen. 2001, 222, 221–236. [Google Scholar] [CrossRef]
  17. Alemany, L.J.; Lietti, L.; Ferlazzo, N.; Forzatti, P.; Busca, G.; Giamello, E.; Bregani, F. Reactivity and physicochemical characterization of V2O5-WO3/TiO2 De-NOx catalysts. J. Catal. 1995, 155, 117–130. [Google Scholar] [CrossRef]
  18. Grzybowska-Swierkosz, B. Vanadia-titania catalysts for oxidation of o-xylene and other hydrocarbons. Appl. Catal. A-Gen. 1997, 157, 263–310. [Google Scholar] [CrossRef]
  19. Busca, G.; Baldi, M.; Pistarino, C.; Gallardo Amores, J.M.; Sanchez Escribano, V.; Finocchio, E.; Romezzano, G.; Bregani, F.; Toledo, G.P. Evaluation of V2O5-WO3-TiO2 and alternative SCR catalysts in the abatement of VOCs. Catal. Today 1999, 53, 525–533. [Google Scholar] [CrossRef]
  20. Finocchio, E.; Baldi, M.; Busca, G.; Pistarino, C.; Romezzano, G.; Bregani, F.; Toledo, G.P. A study of the abatement of VOC over V2O5-WO3-TiO2 and alternative SCR catalysts. Catal. Today 2000, 59, 264–268. [Google Scholar] [CrossRef]
  21. Debecker, D.P.; Delaigle, R.; Eloy, P.; Gaigneaux, E.M. Abatement of model molecules for dioxin total oxidation on V2O5-WO3/TiO2 catalysts: The case of substituted oxygen-containing VOC. J. Mol. Catal. A Chem. 2008, 289, 38–43. [Google Scholar] [CrossRef]
  22. Albonetti, S.; Blasioli, S.; Bonelli, R.; Mengou, J.E.; Scire, S.; Trifiro, F. The role of acidity in the decomposition of 1,2-dichlorobenzene over TiO2-based V2O5/WO3 catalysts. Appl. Catal. A Gen. 2008, 341, 18–25. [Google Scholar] [CrossRef]
  23. Lazar, L.; Koser, H.; Balasanian, I.; Bandrabur, F. Catalytic destruction of aromatic VOCs on SCR-DeNOx commercial catalyst. Environ. Eng. Manag. J. 2007, 6, 13–20. Available online: https://www.researchgate.net/publication/298904939_Catalytic_destruction_of_aromatic_VOCs_on_SCR-DeNOx_commercial_catalyst#fullTextFileContent (accessed on 28 May 2025). [CrossRef]
  24. Besselmann, S.; Loffler, E.; Muhler, M. On the role of monomeric vanadyl species in toluene adsorption and oxidation on V2O5/TiO2 catalysts: A Raman and in situ DRIFTS study. J. Mol. Catal. A Chem. 2000, 162, 401–411. [Google Scholar] [CrossRef]
  25. Bulushev, D.A.; Kiwi-Minsker, L.; Renken, A. Transient kinetics of toluene partial oxidation over V/Ti oxide catalysts. Catal. Today 2000, 61, 271–277. [Google Scholar] [CrossRef]
  26. Dias, C.R.; Portela, M.F.; Banares, M.A.; Galan-Fereres, M.; Lopez-Granados, M.; Pena, M.A.; Fierro, J.L.G. Selective oxidation of o-xylene over ternary V-Ti-Si catalysts. Appl. Catal. A Gen. 2002, 224, 141–151. [Google Scholar] [CrossRef]
  27. del Val, S.; Lopez-Granados, M.; Fierro, J.L.G.; Santamaria-Gonzalez, J.; Jimenez-Lopez, A.; Blasco, T. α-TiP-supported vanadium oxide catalysts: Influence of calcinations pretreatments on structure and performance for o-xylene oxidation. J. Catal. 2001, 204, 466–478. [Google Scholar] [CrossRef]
  28. Makedonski, L.; Nikolov, V.; Anastasov, A.; Stancheva, M. Effect of calcinations temperature on the properties of V2O5-TiO2 (anatase) catalysts in methanol oxidation. React. Kinet. Catal. Lett. 2004, 81, 21–25. [Google Scholar] [CrossRef]
  29. Badlani, M.; Wachs, I.E. Methanol: A “smart” chemical probe molecule. Catal. Lett. 2001, 75, 137–149. [Google Scholar] [CrossRef]
  30. Wang, Q.; Madix, R.J. Partial oxidation of methanol to formaldehyde on a model supported monolayer vanadia catalysts: Vanadia on TiO2(110). Surf. Sci. 2002, 496, 51–63. [Google Scholar] [CrossRef]
  31. Deo, G.; Wachs, I.E. Reactivity of supported vanadium oxide catalysts: The partial oxidation of methanol. J. Catal. 1994, 146, 323–334. [Google Scholar] [CrossRef]
  32. Forzatti, P.; Tronconi, E.; Elmi, A.S.; Busca, G. Methanol oxidation over vanadia-based catalysts. Appl. Catal. A Gen. 1997, 157, 387–408. [Google Scholar] [CrossRef]
  33. Kumar, V.; Lee, N.; Almquist, C.B. An investigation of the thermal stability and performance of wet-incipient WO3/ V2O5/TiO2 catalysts and a comparison with flame aerosol catalysts of similar composition for the gas-phase oxidation of methanol. Appl. Catal. B Environ. 2006, 69, 101–114. [Google Scholar] [CrossRef]
  34. Burgess, L.; Gibson, A.G.; Furstein, S.J.; Wachs, I.E. Converting waste gases from pulp mills into value-added chemicals. Environ. Prog. 2002, 21, 137–142. [Google Scholar] [CrossRef]
  35. Jacoby, M. Catalytic cleanup at the pulp mill. Chem. Eng. News 2002, 80, 39–40. [Google Scholar] [CrossRef]
  36. Sahle-Demessie, E.; Almquist, C.B.; Devulapelli, V.G. Pilot-scale study on ozone-enhanced catalytic oxidation of waste gas emissions from the pulp and paper industry. Environ. Prog. Sustain. Energy 2011, 30, 268–277. [Google Scholar] [CrossRef]
  37. Sahle-Demessie, E.; Devulapelli, V.G. Oxidation of methanol and total reduced sulfur compounds with ozone over V2O5/TiO2 catalyst: Effect of humidity. Appl. Catal. A-Gen. 2009, 361, 72–80. Available online: https://api.semanticscholar.org/CorpusID:94761234 (accessed on 28 May 2025). [CrossRef]
  38. Bordado, J.C.M.; Gomes, J.F.P. Characterization of non-condensable sulphur containing gases from Kraft pulp mills. Chemosphere 2001, 44, 1011–1016. [Google Scholar] [CrossRef]
  39. Lin, B. Collecting and Burning Non-Condensable Gases. Available online: https://www.tappi.org/content/events/08kros/manuscripts/3-6.pdf (accessed on 19 May 2025).
  40. Siddiqui, N.A.; Ziauddin, A. Emission of non-condensable gases from a pulp and paper mill: A case study. J. Ind. Pollut. Control 2011. Available online: https://www.icontrolpollution.com/articles/emission-of-noncondensable-gases-froma-pulp-and-paper-mill--a-case-study-.php?aid=37415 (accessed on 19 May 2025).
  41. Barnes, I.; Hjorth, J.; Mihalopoulos, N. Dimethyl sulfide and dimethyl sulfoxide and their oxidation in the atmosphere. Chem. Rev. 2006, 106, 940–975. [Google Scholar] [CrossRef]
  42. Sahle-Demessie, E.; Devulapelli, V.G. Vapor phase oxidation of dimethyl sulfide with ozone over V2O5/TiO2 catalyst. Appl. Catal. B Environ. 2008, 84, 408–419. [Google Scholar] [CrossRef]
  43. Hwang, C.-L.; Tai, N.-H. Vapor phase oxidation of dimethyl sulfide with ozone over ion-exchanged zeolites. Appl. Catal. A Gen. 2011, 393, 251–256. [Google Scholar] [CrossRef]
  44. Kastner, J.R.; Buquoi, Q.; Ganagavaram, R.; Das, K.C. Catalytic ozonation of gaseous reduced sulfur compounds using wood fly ash. Environ. Sci. Technol. 2005, 39, 1835–1842. [Google Scholar] [CrossRef]
  45. Barcellos da Rosa, M.; Behnke, W.; Zetzsch, C. Study of the heterogeneous reaction of O3 with CH3SCH3 using the wetted-wall flow tube technique. Atmos. Chem. Phys. 2003, 3, 1665–1673. [Google Scholar] [CrossRef]
  46. Hakoda, T.; Chowdhury, M.A.Z.; Shimada, A.; Hirota, K. Oxidation of dimethyl sulfide in air using electron-beam irradiation, and enhancement of its oxidation via an MnO2 catalyst. Plasma Chem. Plasma Process. 2009, 29, 549–557. [Google Scholar] [CrossRef]
  47. Ch, H.; Lee, W.T.; Horng, K.H.; Tseng, T.K. The catalytic incineration of (CH3)2S over a Pt/Al2O3 catalyst. J. Hazard. Mater. 2001, B82, 43–53. [Google Scholar] [CrossRef] [PubMed]
  48. Kastner, J.R.; Das, K.C.; Melear, N.D. Catalytic oxidation of gaseous reduced sulfur compounds using coal fly ash. J. Hazard. Mater. 2002, B95, 81–90. [Google Scholar] [CrossRef]
  49. Demeertere, K.; Dewulf, J.; De Witte, B.; Van Lngenhove, H. Titanium dioxide mediated heterogeneous photocatalytic degradation of gaseous dimethyl sulfide: Parameter study and reaction pathways. Appl. Catal. B Environ. 2005, 60, 93–106. [Google Scholar] [CrossRef]
  50. Gonzalez-Garcia, N.; Ayllon, J.A.; Domenech, X.; Peral, J. TiO2 deactivation during the gas-phase photocatalytic oxidation of dimethyl sulfide. Appl. Catal. B Environ. 2004, 52, 69–77. [Google Scholar] [CrossRef]
  51. Vorontsov, A.V.; Savinov, E.V.; Davydov, L.; Smirniotis, P.G. Photocatalytic destruction of gaseous diethyl sulfide over TiO2. Appl. Catal. B Environ. 2001, 32, 11–24. [Google Scholar] [CrossRef]
  52. Niwa, M.; Habuta, Y.; Okumura, K.; Katada, N. Solid acidity of metal oxide monolayer and its role in catalytic reactions. Catal. Today 2003, 87, 213–218. [Google Scholar] [CrossRef]
  53. Spurr, R.A.; Myers, H. Quantitative Analysis of Anatase-Rutile Mixtures with an X-ray Diffractometer. Anal. Chem. 1957, 29, 760–762. [Google Scholar] [CrossRef]
  54. Dherad, S.; Tifouti, L.; Crocoll, M.; Weisweiler, W. Effect of vanadia and tungsten loadings on the physical and chemical characteristics of V2O5-WO3/TiO2 catalysts. J. Mol. Catal. A Chem. 2004, 208, 257–265. [Google Scholar] [CrossRef]
  55. Amores, J.M.G.; Escribano, V.S.; Busca, G. Anatase crystal growth and phase transformation to rutile in high area TiO2, MoO3-TiO2 and other TiO2-supported oxide catalysts systems. J. Mater. Chem. 1995, 5, 1245–1249. [Google Scholar] [CrossRef]
  56. Huang, Q.W.; Zhu, L.H.; Xu, J.; Wang, P.L.; Gu, H.; Cheng, Y.B. Effect of V2O5 on sintering behavior, microstructure and dielectric properties of textured Sr0.4Ba0.6Nb2O6 ceramics. J. Eur. Ceram. Soc. 2005, 25, 957–962. [Google Scholar] [CrossRef]
  57. Balikdjian, J.P.; Davidson, A.; Launay, S.; Eckert, H.; Che, M. Sintering and phase transformation of V-loaded anatase materials containing bulk and surface V species. J. Phys. Chem. B 2005, 104, 8931–8939. [Google Scholar] [CrossRef]
  58. Reddy, B.M.; Reddy, E.P.; Mehdi, S. Phase transformation study of titania in V2O5/TiO2 and MoO3/TiO2 catalysts by X-ray diffraction analysis. Mater. Chem. Phys. 1994, 36, 276–281. [Google Scholar] [CrossRef]
  59. Banares, M.A.; Alemany, L.J.; Jimenez, M.C.; Larrubia, M.A.; Delgado, F.; Granados, M.L.; Martinez-Arias, A.; Blasco, J.M.; Fierro, J.L.G. The role of vanadium oxide on the titania transformation under thermal treatments and surface vanadium states. J. Solid-State Chem. 1996, 124, 69–76. [Google Scholar] [CrossRef]
  60. Reed, J.S. Principles of Ceramics Processing, 2nd ed.; John Wiley & Sons, Inc.: New York, NY, USA, 1995; pp. 594–618. [Google Scholar]
  61. Yang, H.; Zhang, D.; Wang, L. Synthesis and characterization of tungsten oxide-doped titania nanocrystallites. Mater. Lett. 2002, 57, 674–678. [Google Scholar] [CrossRef]
  62. Perego, C.; Revel, R.; Durupthy, O.; Cassaignon, S.; Jolivet, J.-P. Thermal stability of TiO2-anatase: Impact of nanoparticles morphology on kinetic phase transformation. Solid State Sci. 2010, 12, 989–995. [Google Scholar] [CrossRef]
  63. Zhang, H.; Banfield, J.F. Phase transformation of nanocrystalline anatase-to-rutile via combined interface and surface nucleation. J. Mater. Res. 2000, 15, 437–448. [Google Scholar] [CrossRef]
  64. Orendorz, A.; Brodyanski, A.; Lösch, J.; Bai, L.H.; Chen, Z.H.; Le, Y.K.; Ziegler, C.; Gnaser, H. Phase transformation and particle growth in nanocrystalline anatase TiO2 films analyzed by X-ray diffraction and Raman spectroscopy. Surf. Sci. 2007, 601, 4390–4394. [Google Scholar] [CrossRef]
  65. Rodella, C.B.; Nascente, P.A.P.; Franco, R.W.A.; Magon, C.J.; Mastelaro, V.R.; Florentino, A.O. Surface characterization of V2O5/TiO2 catalytic system. Phys. Status Solidi (A) 2001, 187, 161–169. [Google Scholar] [CrossRef]
  66. Rodella, C.B.; Nascente, P.A.P.; Mastelaro, V.R.; Zucci, M.R.; Franco, R.W.A.; Magon, C.J.; Donoso, P.; Florentino, A.O. Chemical and structural characterization of V2O5/TiO2 catalysts. J. Vac. Sci. Technol. A 2001, 19, 1158–1163. [Google Scholar] [CrossRef]
  67. Went, G.T.; Leu, L.-J.; Bell, A.T. Quantitative structural analysis of dispersed vanadia species in TiO2(Anatase)-supported V2O5. J. Catal. 1992, 134, 479–491. [Google Scholar] [CrossRef]
  68. Stacey, P.; Hall, S.; Stagg, S.; Clegg, F.; Sammon, C. Raman spectroscopy and X-ray diffraction responses when measuring health-related micrometre and nanometre particle size fractions of crystalline quartz and the measurement of quartz in dust samples from the cutting and polishing of natural and artificial stones. J. Raman Spectrosc. 2021, 52, 1095–1107. [Google Scholar] [CrossRef]
  69. Curcio, A.L.; de Godoy, M.P.F.; De Giovanni Rodrigues, A. Raman spectroscopy as a method for structural characterization of ZnO-based systems at the nanoscale. Appl. Nanosci. 2024, 14, 269–275. [Google Scholar] [CrossRef]
  70. Available online: https://www.malvernpanalytical.com/en/products/measurement-type/phase-quantification (accessed on 19 May 2025).
  71. Loffler, S.; Auer, E.; Weil, M.; Lugstein, A.; Bertagnolli, E. Impact of growth temperature on the crystal habits, forms, and structures of VO2 nanocrystals. Appl. Phys. A 2011, 102, 201–204. [Google Scholar] [CrossRef]
  72. Cristallo, G.; Roncari, E.; Rinaldo, A.; Trifiro, F. Study of anatase-rutile transition phase in monolithic catalyst V2O5/TiO2 and V2O5-WO3/TiO2. Appl. Catal. A Gen. 2001, 209, 249–256. [Google Scholar] [CrossRef]
  73. Haber, J.; Kozlowska, A.; Kozłowski, R. The structure and redox properties of vanadium oxide surface compounds. J. Catal. 1986, 102, 52–63. [Google Scholar] [CrossRef]
  74. Saleh, R.Y.; Wachs, I.E.; Chan, S.S.; Chersich, C.C. Interaction of V2O5 with TiO2/(anatase): Catalyst evolution with calcination temperature and o-xylene oxidation. J. Catal. 1986, 98, 102–114. Available online: https://www.lehigh.edu/operando/Publications/1986%20Interaction%20of%20V2O5%20with%20TiO2%20-%20Cat%20evo%20caln%20temp.pdf (accessed on 28 May 2025). [CrossRef]
  75. Allieta, M.; Coduri, M.; Naldoni, A. Black TiO2 and Oxygen Vacancies: Unraveling the Role in the Thermal Anatase-to-Rutile Transformation. Appl. Nano 2024, 5, 72–83. [Google Scholar] [CrossRef]
  76. Galizia, P.; Maizza, G.; Galassi, C. Heating rate dependence of anatase to rutile transformation. Process. Appl. Ceram. 2016, 10, 235–241. [Google Scholar] [CrossRef]
  77. Hanaor, D.; Sorrell, C.C. Review of the anatase to rutile phase transformation. J. Mater. Sci. 2011, 46, 855–874. [Google Scholar] [CrossRef]
  78. Jung, H.; Lim, Y.H.; Pophali, A.; Lee, E.; Kim, H.; Kim, H.S.; Suh, J.; Choi, J.-S.; Kim, S.; Bang, J.; et al. Promotional effect of WO3 in V2O5–WO3/TiO2 on low-temperature activity in the catalytic oxidation of 1,2-dichloroethane. Chem. Eng. J. 2024, 494, 153029. [Google Scholar] [CrossRef]
  79. Photocatalytic Titanium Dioxide, ST Series Information, Ishihara Sangyo Kaisha, Ltd. Available online: https://www.iskweb.co.jp/eng/products/functional05.html (accessed on 18 April 2025).
  80. Available online: https://www.agilent.com/store/en_US/Prod-125-7032/125-7032 (accessed on 19 May 2025).
Figure 1. DMS oxidation sulfur-containing products and by-products.
Molecules 30 02436 g001
Figure 2. BET surface area of WxV5TiO2 catalysts as functions of the calcination temperature and W/Ti mass ratio. (x = 0, 2, 5, and 10, corresponding to W/Ti mass ratios = 0, 0.02, 0.05, and 0.1). All catalysts have a V/Ti mass ratio = 0.05.
Molecules 30 02436 g002
Figure 3. XRD diffractograms of catalysts after calcination at temperatures from 400 °C to 600 °C. (a) Pure TiO2, (b) W0V5TiO2, (c) W5V5TiO2, and (d) WxV5TiO2 catalysts calcined at 600 °C, where x = 0, 2, 5, and 10 corresponding to W/Ti mass ratios = 0, 0.02, 0.05, and 0.1. A = Anatase TiO2; R = Rutile TiO2.
Molecules 30 02436 g003aMolecules 30 02436 g003bMolecules 30 02436 g003c
Figure 4. The percent anatase TiO2 in WxV5TiO2 catalysts (a) as functions of the calcination temperature and W/Ti mass ratio and (b) as a function of monolayers of V on the catalyst.
Molecules 30 02436 g004
Figure 5. (a) Anatase crystal size in WxV5TiO2 catalysts as functions of the calcination temperature and W/Ti mass ratio and (b) as a function of monolayers of V on the catalyst.
Molecules 30 02436 g005
Figure 6. Raman spectra of (a) W0V5TiO2 catalysts and (b) W5V5TiO2 catalysts calcined at temperatures from 400 °C to 600 °C; enlarged views of the Raman spectra of (c) W0V5TiO2 catalysts and (d) W5V5TiO2 catalysts calcined at temperatures from 400 °C to 600 °C.
Molecules 30 02436 g006
Figure 7. SEM images (30,000 magnification) of W0V5TiO2 catalysts calcined at different temperatures in air for 24 h. (a) 400 °C; (b) 500 °C; (c) 550 °C; (d) 600 °C. Orange arrows: Titania vanadia species. Red and Green arrows: Rutile TiO2 structures.
Molecules 30 02436 g007
Figure 8. SEM images (30,000 magnification) of W5V5TiO2 catalysts calcined at different temperatures for 24 h. (a) 400 °C; (b) 500 °C; (c) 550 °C; (d) 600 °C. Blue arrows: rod-like Rutile TiO2 structures. Orange arrows: plate-like Rutile TiO2 structures.
Molecules 30 02436 g008
Figure 9. Degradation of DMS over WxV5TiO2 catalysts calcined at (a) 500 °C and (b) 600 °C.
Molecules 30 02436 g009aMolecules 30 02436 g009b
Figure 10. DMS catalytic oxidation over (a) W0V5TiO2 catalysts and (b) W5V5TiO2 catalysts calcined at temperatures ranging from 400 °C to 600 °C.
Molecules 30 02436 g010
Figure 11. Reaction rate (µmoles/min/g) of DMS at 200 °C as a function of the catalyst composition and surface area.
Molecules 30 02436 g011
Figure 12. Reaction rate (µmoles/min/g) of DMS at 200 °C as a function of the percent of anatase.
Molecules 30 02436 g012
Figure 13. Reaction rate (µmoles/min/g) of DMS oxidation at 200 °C as a function of the monolayers of V on the catalyst.
Molecules 30 02436 g013
Figure 14. Catalyst synthesis method flow charts. (a) W0V5TiO2 catalysts and (b) WxV5TiO2 catalysts, where x = 2, 5, and 10 represent W/Ti mass ratios of 0.02, 0.05, and 0.10.
Molecules 30 02436 g014
Figure 15. Schematic of the test system used for catalyst performance analysis.
Molecules 30 02436 g015
Table 1. Overall summary of the morphological properties of the catalysts.
CatalystCatalyst
Composition 1
Calcination
Temperature
(°C)
XRD ResultsBET Area
(m2/g)
Pore Size 4 (nm)Monolayers 5 of V on TiO2
V/Ti
Mass Ratio
W/Ti Mass RatioPercent Anatase 2
(%)
Anatase Crystal Size 3 (nm)
W0V0TiO20040010026.5125 ± 8.217.40
50010040.161.4 ± 13.523.20
55010042.052.5 ± 1225.30
60010045.542.6 ± 7.626.20
W0V5TiO20.05040010024.5149 ± 10.914.70.40 ± 0.03
50010036.769.3 ± 0.425.60.85 ± 0.01
550471123.2 ± 2.551.226.0 ± 20.1
60000.01.3 ± 138.660.6 ± 43.9
W2V5TiO20.050.0240010024.2130 ± 22.314.90.46 ± 0.08
50010038.071.5 ± 0.825.80.83 ± 0.01
55010091.48.9 ± 4.449.67.58 ± 3.75
60031131.3 ± 1.043.662.4 ± 46.5
W5V5/TiO20.050.0540010023.0130 ± 4.816.20.45 ± 0.02
50010041.963.3 ± 15.125.30.96 ± 0.23
55010069.316.1 ± 4.139.83.79 ± 0.97
600641095.95 ± 4.337.313.5 ± 9.82
W10V5/TiO20.050.1040010020.7144 ± 3.814.80.41 ± 0.01
50010030.792.8 ± 25.722.20.66 ± 0.18
55010061.119.3 ± 9.447.43.47 ± 1.69
600871106.76 ± 6.042.214.4 ± 12.8
1 The masses of precursors used for each catalyst is provided in Table S1. 2 The percent anatase TiO2 is based on Equation (3), as reported in [53]. 3 The anatase crystal size is based on the Scherrer equation, Equation (4). 4 The pore size is based on the Barrett–Joyner–Halenda (BJH) model and nitrogen desorption data, acquired during BET surface area analyses. 5 Monolayers of vanadia species on the surface of the catalyst, as defined by Equations (1) and (2) and [18].
Disclaimer/Publisher’s Note: The statements, opinions and data contained in all publications are solely those of the individual author(s) and contributor(s) and not of MDPI and/or the editor(s). MDPI and/or the editor(s) disclaim responsibility for any injury to people or property resulting from any ideas, methods, instructions or products referred to in the content.

